Abstract
In this study we report biofuel potential in waste cake obtained from oil refinery. The sample was analyzed for its calorific value using auto bomb calorimeter (LECO AC-500), proximate analysis using Thermogravimetric analyzer (LECO 701) and elemental analysis using CHNS analyzer (LECO Tru-Spec). The elemental analysis of dry waste cake vs wet cake depicted the percentage composition of carbon (49.8%, 40.8%), hydrogen (7.9%, 6.0%), nitrogen (2.8%, 1.9%), Sulphur (1.9%, 0.5%) and oxygen content (37.6%, 40.4%). As for as the thermal degradation behavior of dry and wet cake in TGA is concerned, higher moisture contents (68.50%) found in wet cake and lower in dry cake (40.1%). Whereas the volatile matter in dry cake (30.9%) and low volatile in wet cake (14.3%). Similarly, %age of ash become high in dry cake (17.3%) and low in wet cake (5.11%). The results reflected that higher heating value of dry waste cake is higher (22.5 MJ/kg) than wet waste cake (20.5 MJ/kg) and commonly used sugarcane bagasse (17.88 MJ/kg).
1. Introduction
During the oil refinery wastewater treatment, a semi-solid by-product is formed which is known as waste water. The dewatered product formed is a dry cake having 30% solid content (by weight) which is obtained at the outlet of the centrifuge with the dose of dewatering polyelectrolyte. Thermal investigation in which variations in chemical and physical properties of substances are controlled as a function of constant rate of heating, or a time function with endless temperature or constant loss of mass [1]. During the process, gaseous products usually disappeared by reaction of elastomers, fibers, thermoplastic, composites and paints [1]. They emit greenhouse gases like carbon dioxide but at lower levels [2]. The investigation of biological and physio-chemical sludge was determined by heating at different rates such as 4 and 10 °C/min, with different interaction time between gases in Spanish oil refinery [3]. The effect of operating parameters such as heating rate of various biomass was investigated through TGA. It is important to find the effect of operating parameters for thermal degradation of low-grade coal, bagasse and their mixtures [4]. In the refining process of crude oil, large quantities of oily sludge are produced in refineries. But oily sludge is a hydrocarbon having calorific value of 3900 kcal/kg or above and high potential energy [5].
2. Materials and Methods
In this research, waste cake was obtained from Wastewater treatment plant of oil refinery. It consists of high moisture content and in slurry form. Collected waste cake samples were prepared, processed and analyzed in the Coal Research Laboratory of NFC-IET. Proximate analysis was done by TGA LECO-701; The ultimate analysis was carried out by LECO Tru-Spec CHN-S Analyzer. The Calorimeter used in this research is LECO AC-500 Auto Bomb Calorimeter.
3. Results and Discussion
Thermal degradation behavior of waste cake was studied by using thermo-gravimetric analysis (TGA) (Figure 1a). A total weight loss of 92% was observed in the TGA result. Evaporation of moisture was observed to occur between 32 °C and 107 °C as seen in the TG curve. The TG profile showed that waste cake experienced three zones of degradation: drying zone (32–107 °C), devolatilization zone (107–950 °C), and char formation zone (600–750 °C). In zone: 1 (Figure 1b), the moisture in the waste cake was removed and sample was dried at 107 °C. In zone: 2, devolatilization of waste cake started. The volatile matter in the sample was removed at 950 °C. In char formation zone, the waste cake was heated from 600 °C to 750 °C.
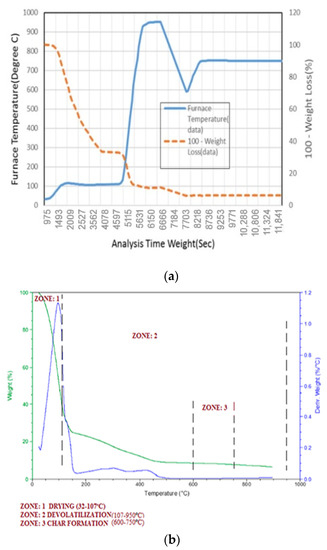
Figure 1.
TGA Curve for Waste Cake (a), TG and DTG Curve for Waste cake (b).
Due to large volume of moisture the DTG was observed to increase sharply to a peak at 100 °C. Between 100 °C and 150 °C there is reduction in weight loss when compared to the earlier stage (between 32 °C and 100 °C). This region is also reflected in the DTG curve with a sharp fall. This observation could be attributed to the evaporation of the remaining moisture and the volatilization of small quantity of low temperature hydrocarbons.
3.1. Proximate and Ultimate Analysis
The dry waste cake contains higher percentage of volatile matter (30.9%) and ash (17. 3%) (Table 1).This increase in volatile matter and ash due to increasing concentration of microbes in dry waste cake. Similar results about the proximate analysis of microbes (microalgae) are reported by other researcher.

Table 1.
Comparison of proximate analysis of different biomass.
The dry waste cake contains higher percentage of carbon (49.8%) and oxygen (37.6%) (Table 2). A sample having high content of oxygen will cause an increase in the rate of combustion reaction. The high carbon content related to good fuel properties. The hydrocarbon elements (hydrogen and carbon) and oxygen constitute about 95.3%, while nitrogen and sulfur account for 4.7%. There is high Oxygen content in the sample when compared to oily sludge and less than sugarcane bagasse. The oxygen content in sample will help combustion reaction.
Table 2.
Comparison of Ultimate analysis of different biomass.
3.2. Calorific Value of Waste Cake
Higher heating value (HHV) of 22.5 MJ/kg was obtained which is higher than the value of oily sludge and sugar cane bagasse (Figure 2). The high HHV value recorded may be attributable to the high fixed carbon and lower ash content of the waste cake.
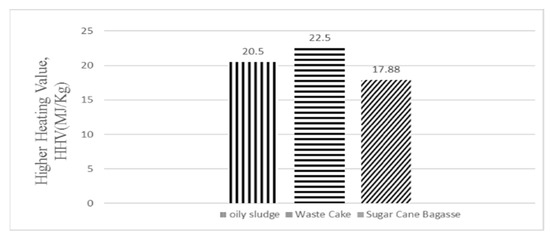
Figure 2.
Comparison of HHV of different samples.
3.3. Comparison of Different Biomasses for Biofuel Potential
Waste cake is a potential source for biofuel production. By comparing waste cake to other biomass sources, it was resulted that waste cake has also biofuel content. It has 50% (Table 3) biofuel content by weight which is slightly less than Corn cob, Switchgrass and Corn Stover. There are different techniques to produce biofuel from different biomasses.
Table 3.
Comparison of Various Biomasses.
4. Conclusions
From the characterization, the waste cake has 40.1% moisture, 17.3% ash, 30.9% volatile matter, 11.7% fixed carbon. Even though the waste cake has high moisture content, but it has a higher heating value (HHV) of 22.5 MJ/kg. This HHV may be associated with high fixed carbon, high volatile matter and low ash content. The Oxygen content and volatile matter is high, which indicates that waste cake has good combustion reaction ability. Nitrogen and Sulphur contents are low and their emission effects can be easily achieved by existing methods. The higher heating value is a base to identify the available energy which can be recovered. To observe the thermal behavior of waste case that is subjected to control heating and cooling inside the TGA furnace. When sample dehydrates, the curve deviation starts from a certain region. The waste cake sample used in this study has significant calorific value, volatile matter and organic content, which are similar to biomass that has biofuel production potential. Waste cake has also potential for biofuel production. By comparing waste cake to other biomass sources for biofuel content, it concluded that it has 50% biofuel content by weight which is greater than some other biomass sources for biofuel production.
Author Contributions
All Authors contributed equally to this work. All authors have read and agreed to the published version of the manuscript.
Conflicts of Interest
The authors declare no conflict of interest.
References
- Ning, S.K.; Hung, M.C.; Chang, Y.H.; Wan, H.P.; Lee, H.T.; Shih, R.F. Benefit assessment of cost, energy, and environment for biomass pyrolysis oil. J. Clean. Prod. 2013, 59, 141–149. [Google Scholar] [CrossRef]
- Huang, D.; Zhou, H.; Lin, L. Biodiesel: An Alternative to Conventional Fuel. In Proceedings of the 2012 International Conference on Future Energy, Environment, and Materials, Hong Kong, China, 12–13 April 2012. [Google Scholar]
- Hussain, S.; Shahzad, K.; Akthar, K.S.; Akhthar, N.A.; Chughtai, A. Investigations of thermal conversion and kinetics of low-grade coal and bagasse using thermogravemetric technique. J. Fac. Eng. Technol. 2014, 21, 105–117. [Google Scholar]
- Ali, A.M.; Abu-Hassan, M.A.; Ibrahim, R.R.; Zaini, M.A.A.; Abdulkarim, B.I.; Hussein, A.S.; Su, S.M.; Mohd Halim, M.A.I. Characterization of Petroleum Sludge from Refinery Industry Biological Wastewater Treatment Unit. Preprints 2017, 2017080033. [Google Scholar] [CrossRef]
- Hou, B.; Xie, S.X.; Chen, M.; Jin, Y.; Hao, D.; Wang, R.S. The Treatment of Refinery Heavy Oil Sludge. Pet. Sci. Technol. 2002, 31, 458–464. [Google Scholar] [CrossRef]
- Boateng, A.A.; Daugaard, D.E.; Goldberg, N.M.; Hicks, K.B. Bench-scale fluidized-bed pyrolysis of switchgrass for bio-oil production. Ind. Eng. Chem. Res. 2007, 46, 1891–1897. [Google Scholar] [CrossRef]
- Mullen, C.A.; Boateng, A.A.; Goldberg, N.M.; Lima, I.M.; Laird, D.A.; Hicks, K.B. Bio-oil and bio-char production from corn cobs and stover by fast pyrolysis. Biomass Bioenergy 2010, 34, 67–74. [Google Scholar] [CrossRef]
- Ates, F.; Isikday, M.A. Evaluation of the role of pyrolysis temperature in straw biomass samples and characterization of the oils by GC/MS. Energy Fuel 2008, 22, 1936–1943. [Google Scholar] [CrossRef]


Publisher’s Note: MDPI stays neutral with regard to jurisdictional claims in published maps and institutional affiliations. |
© 2022 by the authors. Licensee MDPI, Basel, Switzerland. This article is an open access article distributed under the terms and conditions of the Creative Commons Attribution (CC BY) license (https://creativecommons.org/licenses/by/4.0/).