Abstract
The search for sustainable, economically viable, and effective plant protection strategies against pathogenic bacteria, fungi, and viruses is a major challenge in modern agricultural practices. Chitosan (CS) is an abundant cationic natural biopolymer known for its biocompatibility, low toxicity, and antimicrobial properties. Its potential use in agriculture for pathogen control is a promising alternative to traditional chemical fertilisers and pesticides, which raise concerns regarding public health, environmental protection, and pesticide resistance. This study focused on the preparation of chitosan nanoparticles (CS-NPs) through cross-linking with organic molecules, such as tannic acid (TA). Various formulations were explored for the development of stable nanoscale particles having encapsulation capabilities towards low compounds of varying polarity and with potential agricultural applications relevant to plant health and growth. The solution properties of the NPs were assessed using dynamic and electrophoretic light scattering (DLS and ELS); their morphology was observed through atomic force microscopy (AFM), while analytical ultracentrifugation (AUC) measurements provided insights into their molar mass. Their properties proved to be primarily influenced by the concentration of CS, which significantly affected its intrinsic conformation. Additional structural insights were obtained via infrared and UV–Vis spectroscopic measurements, while detailed fluorescence analysis with the use of three different probes, as model cargo molecules, provided information regarding the hydrophobic and hydrophilic microdomains within the particles.
1. Introduction
The continuously growing human population and consecutive depletion of natural resources have made sustainable agriculture imperative for future farming practices. In parallel, a vast array of insect pests, diseases, and weeds challenge agricultural production, causing severe economic losses every year. Unfortunately, in order to face these challenges and enhance productivity, farmers are usually forced to resort to excessive and indiscriminate use of agrochemicals, which in turn has serious adverse effects relevant to the deterioration of soil health, degradation of agro-ecosystems, residue problems, environmental pollution, and pesticide resistance in insects and pathogens [1,2]. To this end, several nanotechnological solutions have been proposed in an attempt to produce more efficient, specialised, high-performing, and cost-effective pesticides that are less harmful to the environment [3]. Nanotechnology offers novel tools and approaches suitable for managing both biotic and abiotic stress in agriculture, while at the same time promising to enhance the bioavailability and improve the physical and chemical stability of agrochemicals, widen their modes of activity, and increase the biodegradable components in their composition [2]. Simultaneously, it ensures increased crop productivity and nutritional value, as various nano-based methods are being utilised for delivering hormones that promote plant growth, transferring target genes, improving seed germination, managing crop diseases, and controlling the release of agrochemicals [4]. These nanotechnological approaches are usually based on the use of suitable nanoparticles (NPs) as carriers of active ingredients, such as pesticides, herbicides, bioactive agents, nutrients, and growth regulators [5], since their small size renders them capable of crossing biological barriers and carrying the required molecules into various locations in plants [6].
Among the plethora of materials available for the construction of NPs relevant to agricultural applications, chitosan (CS) has proven to be one of the most widely used biopolymers owing to its unique properties. This is evidenced by the large number of experimental studies devoted to the use of CS and its NPs in agriculture, and several related recent reviews can be found in the literature [4,5,7,8]. Chitosan is a linear copolymer comprised of D-glucosamine and N-acetyl-D-glucosamine units joined via β-(1-4) glycosidic bonds [6]. It is obtained through the alkaline deacetylation of hard and inelastic chitin (owing to its semi-crystalline structure) [9,10], which is the second most abundant polysaccharide after cellulose. Chitin is found in the shells of crustacean sea animals (i.e., crabs, shrimps, and lobsters), the exoskeletons of insects (like scorpions, beetles, and cockroaches), as well as the cell walls of various microorganisms, including fungi, yeasts, and some types of marine algae (i.e., coralline alga Clathromorphum compactum [11]) [5]. The degree of deacetylation (DD) and molecular weight (MW) of the resulting CS polymer are the main factors that determine its physicochemical and biological properties, as they define the total number of primary amine residues. CS is renowned for its valuable features, including biodegradability, biocompatibility, non-toxicity, regulation of plant growth, and antimicrobial action [7]. These key characteristics of CS are generally retained when it is formulated into NPs, making them suitable for various biomedical applications [12]. Moreover, CS-based formulations have been used for the effective protection of plants against pathogenic bacteria since the 1990s, owing to their bactericidal (killing bacteria) and/or bacteriostatic (hindering bacterial growth) properties, which are mostly attributed to the polycationic character of CS [13]. The antibacterial property of CS depends on various factors, with molecular weight being a major one since the antibacterial activity generally increases as the molecular weight decreases [13]. Thus, the use of CS oligosaccharides (COS) is advantageous in this respect as they also offer increased solubility. The presence of positively charged amino groups is one of the main advantages of CS, because they enable interactions with oppositely charged polyionic compounds in bacterial cell walls (i.e., teichoic acids in Gram-positive or lipopolysaccharides and phospholipids in Gram-negative bacteria) [14]. In parallel, they facilitate its modification through various chemical reactions, thus altering its physicochemical and biophysical properties [2]. At the same time, its biological activity is preserved due to the excess of positive charges, or even enhanced, depending on the type of chemical modification and the specific derivative [15]. Through appropriate modification, substituted, cross-linked, carboxylated, ionic, and bounded CS derivatives can be produced to meet various research needs [6].
Several methods are readily used for the synthesis of CS-based NPs (CS-NPs), including ionotropic gelation, emulsion cross-linking, reverse micellization, sieving, precipitation, and spray drying [1,2,3]. All these methods constitute bottom-up approaches, as they involve the assembly of molecules/ions into defined nanostructures [2]. The suitable method for CS-NP synthesis is chosen based on the specific requirements regarding particle size and shape, thermal stability, release time of the active ingredients, and residual toxicity of the final product [1]. For agricultural applications in particular, the produced CS-NPs have to be safe for plants, soil, and non-target organisms, so it is crucial not to introduce harmful residues. Moreover, they should break down naturally in the environment, minimizing long-term pollution [1,5]. Regarding their bioactivity, they should possess inherent antimicrobial, antioxidant, or eliciting activities to support plant health [16]; additionally, enable encapsulation and slow, targeted release of fertilizers, pesticides, or growth promoters, while maintaining stability and ensuring well-dispersed formulations in agricultural settings [16,17]. Finetuning of their size is equally important, as nanoscale size (typically 1–100 nm) is crucial for high surface area, bioactivity, and plant uptake. Lastly, ease of synthesis and scalability via cost-effective and reproducible methods (e.g., ionic gelation, emulsion cross-linking) are also desirable prerequisites [16,17]. Consequently, CS-NPs are considered highly suitable for use in agriculture due to their unique combination of innate properties, which in parallel enable them to enhance crop productivity, improve plant health, and support sustainable farming practices.
One of the simplest, most reliable, reproducible, and easily scalable methods for the preparation of CS-NPs is ionotropic gelation, which entails ionic interactions between the positively charged amino groups of CS and the negatively charged functional groups of a polyion, with sodium tripolyphosphate (TPP) being the most extensively used one [2]. The produced CS-NPs are stable, non-toxic, and organic solvent-free [1], while their physicochemical characteristics (i.e., size, shape, charge, and stability) are primarily dictated by the DD, MW, and concentration of CS, the CS–to TPP ratio and rate of mixing between the two components, as well as the pH and temperature of the solution [2]. Numerous experimental studies have investigated the preparation procedure, physicochemical and/or biological properties, and potential applications of ionically cross-linked CS-TPP NPs [18,19,20,21,22,23]. An alternative, less commonly used cross-linking agent is tannic acid (TA) [24,25,26], a plant polyphenol of natural origin known for its antibacterial, antioxidant, and haemostatic properties [25]. TA contains five catechol and five galloyl groups, which can induce multiple types of interactions, such as hydrogen bonding, π-π interaction, coordination bonding, or dynamic covalent bonding with various other materials [27]. It has also been utilised in combination with TPP [28,29,30,31] or magnetic NPs [32,33,34] for the preparation of various CS-based biomaterials of different formulations, including nano/micro-particles, hydrogels, and films. Especially in the latter case, the incorporation of TA leads to CS films with enhanced mechanical properties, water resistance, and UV protection, thus rendering them advantageous for food packaging applications [27,35,36].
Herein, we focus on the investigation of the physicochemical solution properties of CS-NPs prepared by ionotropic gelation of a water-soluble CS (i.e., chitosan hydrochloride) utilising TA as the cross-linking agent. Different CS concentrations and TA contents were examined to establish the effect of both parameters, as well as that of the mixing ratio of the two components, on the characteristics of the produced NPs. Initially, their structure was investigated by means of infrared and UV–Vis spectroscopy. Dynamic and electrophoretic light scattering (DLS and ELS) were employed to evaluate their solution properties in terms of mass, size, size distribution, and charge. In parallel, atomic force microscopy (AFM) revealed their morphology, while analytical ultracentrifugation (AUC) measurements provided additional information about the molar mass of CS-NPs. Special interest was dedicated to investigating their hydrophobicity by employing three different fluorescent probes of varying sensitivity to hydrophobic interactions and/or regions, namely, pyrene, Nile red, and 8-anilino-1-naphthalenesulfonic acid (ANS). To the best of our knowledge, this is the first study employing a combination of pyrene, Nile red, and ANS fluorescence to investigate the structural evolution of TA-cross-linked CS-NPs across a concentration gradient. Moreover, the innovation of this work lies in the distinct combination of a water-soluble CS and TA used for the preparation of the CS-NPs, together with the specialized array of applied experimental approaches. Overall, the acquired information allowed for a thorough structural and physicochemical characterisation of the prepared CS-NPs, which were intended to be used as carriers of active ingredients to control plant diseases while improving plant health.
2. Materials and Methods
2.1. Materials
A chitosan hydrochloride sample with a molecular weight of MW = 61,000 g/mol (CS61K) and a high deacetylation degree DD = 88.2% was provided by Shandong AK Biotech Co., Ltd. (Jinan, China). All other chemicals, including acetic acid (glacial 100%), tannic acid (ACS reagent), pyrene (for fluorescence, ≥99.0%), Nile red (for microscopy), and 8-anilino-1-naphthalenesulfonic acid ammonium salt (ANS) (for fluorescence, ≥ 97.0%), were purchased from Sigma-Aldrich (Merck KGaA, Darmstadt, Germany) and used without further purification.
2.2. Preparation of CS-NPs
For the preparation of the CS-NPs, initial CS61K stock solutions were prepared at three different concentrations, i.e., 0.1, 0.5, and 1% w/v. In all cases, a 0.2% v/v acetic acid (AcOH) solution in distilled water was used as the common solvent, thus facilitating the full protonation of the chitosan amino groups, which in turn enhanced its solubility. The optimised solvation protocol consisted of adding the desired weighted amount of the CS61K sample to the solvent under stirring at 1000 rpm for 5 min and then at 500 rpm for 30 min, so as to ensure the best possible dissolution. Subsequently, an appropriate volume of a 1% w/v TA stock solution in distilled water was added to equal parts of the CS61K stock solutions under stirring at 500 rpm for 5 min. The TA solution aliquots were appropriately chosen so that the final weight concentration of TA with respect to the weight of CS was 5, 10, and 15% w/w. The corresponding sample codes regarding the final concentrations of CS and TA are summarised in Table 1. It should be noted that for the specific CS/TA weight/mass ratios, the positive charges of CS were always in excess, thus assuring the full incorporation of TA. The actual values of the charge ratio between the two oppositely charged components are given in Table S1. All solutions were left to stand overnight for better equilibration prior to measurement.

Table 1.
Sample codes indicating the corresponding CS and TA concentrations of the CS-NP solutions.
2.3. Dynamic Light Scattering
DLS measurements were performed on an ALV/CGS-3 compact goniometer system (ALV GmbH, Hessen, Germany) equipped with an ALV-5000/EPP multi-tau digital correlator, a He-Ne laser operating at a wavelength λ = 632.8 nm, and an avalanche photodiode detector. Sample solutions were loaded into standard 1 cm width cylindrical soda-lime glass dust-free cells, and measurements were performed at ambient conditions (i.e., 25 °C) at scattering angles of 45°, 90°, and 135°.
Valuable information regarding the scattered light intensity, particle size, size distribution, and polydispersity index (PDI) of the samples was obtained. More specifically, the distribution of relaxation times τ is derived by appropriate fitting of the measured normalised time autocorrelation functions of the scattered light intensity. Assuming that the observed fluctuations in the scattered intensity are caused by diffusive motions, the apparent diffusion coefficient Dapp is related to the relaxation time τ as Dapp = 1/τq2, where q is the scattering vector defined as 4πn0sin(θ/2)/λ0, with n0, θ, and λ0 being the solvent refractive index, scattering angle, and wavelength of the laser in vacuum, respectively. The hydrodynamic radius Rh can be obtained from the apparent diffusion coefficient Dapp using the Stokes–Einstein relationship Rh = kBT/6πη0Dapp, where kB is the Boltzmann constant, T is the temperature, and η0 is the viscosity of the solvent [37,38]. The cumulant method was used to analyse the DLS data to extract information on the average hydrodynamic radius (Rh) and PDI, while the CONTIN regularisation method provided the distribution of the hydrodynamic radii of the particles present in the solution. Finally, it should be noted that for the measured scattered intensity values, there is a standard deviation of approximately 1–2%, whereas for the calculated Rh values, the corresponding standard deviation is approximately 5%.
2.4. Electrophoretic Light Scattering
Zeta potential (ζP) measurements were conducted using a Zetasizer Nano-ZS (Malvern Panalytical Ltd., Malvern, UK) equipped with a He-Ne laser (λ = 633 nm) and an avalanche photodiode detector. The Henry equation in the Smoluchowski approximation was used for zeta potential calculation, and the ζP values were determined using the Smoluchowski equation ζP = 4πην/ε, where η is the solvent viscosity, ν the electrophoretic mobility, and ε the dielectric constant of the solvent [39]. The reported values are the averages of 50 repeated measurements at a 173° scattering angle and room temperature.
2.5. Analytical Ultracentrifugation
Representative CS-NP solutions were subjected to analytical ultracentrifugation (AUC) analysis to evaluate the weight-average molar mass of the NPs. Sedimentation velocity (SV) experiments were performed at 25 °C using a ProteomeLab XL-I (Beckman Coulter, CA, USA) analytical ultracentrifuge equipped with a UV–Vis absorption optical system. The absorption of CS-NPs was monitored at 275 nm, corresponding to the characteristic absorption peak of TA. A rotor speed of 35,000 rpm was selected for all solutions. However, a single scan at 3000 rpm was always performed before the high-speed SV investigations as a radial calibration for optimum accuracy and as a means of eliminating any possible impurities of higher molecular weight. Subsequently, 150 radial scans were recorded at time intervals of 4 min, thus providing the absorbance variation as a function of radial displacement (distance from the centre of rotation) in the solution. The sedimentation coefficient distributions were determined by the continuous c(S) distribution model using the Lamm equation analysis of the SEDFIT software and appropriate fine-tuning of the relevant parameters (i.e., resolution, S min, S max, frictional ratio, partial specific volume, etc.), to obtain the optimum fit (more information can be found online at https://sedfitsedphat.github.io, accessed on 15 May 2025). Using the obtained sedimentation coefficient, SEDFIT software estimates the corresponding effective reduced molar mass using the Svedberg equation S = MD(1 − υρ)/RT, where M, D, R, T, υ, and ρ are the molar mass, diffusion coefficient, gas constant, absolute temperature, partial specific volume, and density of the solvent, respectively [40,41]. Sedimentation equilibrium runs were analysed with a nonlinear exponential fit for single species to obtain weight-average molar mass distributions.
2.6. Atomic Force Microscopy
AFM analysis was performed on a Dimension Icon system (Bruker, MA, USA) equipped with a NanoScope V Control Station, with a 1.00 Hz scan rate under ambient conditions. For AFM sample preparation, a 2 μL droplet of the investigated CS-NPs solution was placed onto a freshly cleaned glass substrate (1 cm2) and spin-cast at 2000 rpm for 1 min. AFM measurements were performed in ScanAsyst (Peak Force Tapping) mode. Obtained images were analysed using the ImageJ software (version 1.53m) [42].
2.7. Fluorescence Spectroscopy
The steady-state fluorescence spectra of the CS-NPs were recorded using suitable probes with a double-grating excitation and single-grating emission spectrofluorometer (Fluorolog-3, model FL3-21, Jobin Yvon-Spex, Horiba Ltd., Kyoto, Japan) at room temperature. Specifically, three different fluorescent molecular probes were used: pyrene, Nile red, and ANS. Each of these probes exhibits a different degree of sensitivity to the presence of hydrophobic domains in the formed CS-NPs. Pyrene and Nile red were added to a final concentration of 1 µM in the CS-NP solutions (from 1 mM stock solutions in acetone), while the corresponding concentration of ANS was 0.1 mM (from a 10 mM stock in 1 M NaOH). The excitation wavelength used for pyrene was λ = 335 nm, and the emission spectra were recorded in the region 350–600 nm. Accordingly, for Nile red, an excitation wavelength of λ = 550 nm and the 570–800 nm spectral range were selected, while for ANS, λ = 370 nm and the spectral range was 390–700 nm. For all measurements, an increment of 1 nm, an integration time of 0.5 s, and slit openings of 1 nm for both the excitation and emitted beams were used. Under the employed experimental conditions, fluorescence from the three different probes was observed and utilised to extract valuable information about the structure of CS-NPs.
2.8. Fourier Transform Infrared Spectroscopy
A mid-infrared FTIR spectrometer (Bruker Equinox 55, Bruker GmbH, Ettlingen, Germany) equipped with an attenuated total reflectance (ATR) accessory (DuraSamplIR II, SensIR Technologies, Danbury, CT, USA) with a spectral range of 5000–550 cm−1 was used. Background spectra were obtained by recording the pristine and desiccated ATR diamond crystal surface in ambient air. The CS-NPs solution measurements were performed in the dry state by creating a thin film of the solution’s components on the ATR diamond crystal after solvent evaporation in a stream of nitrogen. Specifically, a small aliquot of each solution was placed on the ATR element and dried under N2 flow before measurement. For each sample, the final spectrum is the average of three 100-scan measurements at 2 cm−1 resolution. The measurement of each sample was bracketed by two background spectra to allow for the elimination of H2O vapour peaks by interpolation.
2.9. UV–Vis Spectroscopy
The absorption spectra of the CS-NPs solutions were recorded in the wavelength range between 200 and 800 nm using a UV–Vis NIR double-beam spectrophotometer (Lambda 19 by Perkin Elmer, Waltham, MA, USA) at room temperature. Appropriate dilutions were performed as needed to obtain a maximum measured absorbance value of less than 3.
3. Results
3.1. Chemical Structure of the CS-NPs
Initially, we investigated the chemical structure of the prepared CS-NPs by means of FTIR spectroscopy, in order to confirm the cross-linking interactions between the CS and TA. Figure 1a presents the obtained spectra for the NPs prepared at 1% w/v CS concentration and different TA content, i.e., 5, 10, and 15% w/w (with respect to the weight of CS), along with the spectrum of the 1% TA w/v stock solution for comparison. The corresponding spectra for the CS-NPs at 0.1 and 0.5% w/v CS are shown in Figure S1. The vibrational assignments of the detected characteristic peaks of CS and TA, along with the observed changes in the TA peaks in the CS-NPs spectra, are summarised in Table 2. Note that the information included in Table 2 also applies in the case of the CS-NPs prepared at 0.1 and 0.5% w/v CS (Figure S1).
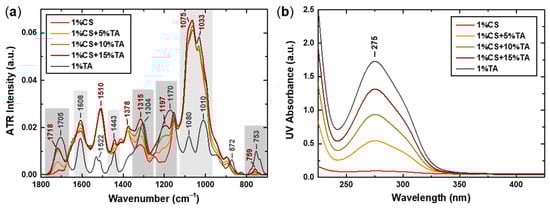
Figure 1.
(a) FTIR spectra in the spectral region 1800–700 cm−1, where characteristic peaks and observed changes are noted (dark vs. light grey frames denote shifted vs. non-shifted peaks), and (b) UV–Vis spectra for the CS-NPs prepared at 1% w/v CS concentration and different TA content, i.e., 5, 10, and 15% w/w (with respect to the weight of CS). The corresponding spectra of the 1% TA w/v stock solution are also included for comparison.
Table 2.
The position of the main peaks, attributed either to CS or TA, the corresponding vibrational assignments, and relevant comments/changes observed in the spectral region 1800–700 cm−1 of the FTIR spectra of the CS-NPs samples.
As can be seen in Figure 1a and Table 2, the main observable differences in the spectra of the CS-NPs compared to the original CS spectrum relate to the appearance of additional peaks attributed to TA. As far as the CS precursor is concerned, it is worth noting that the peak at 1510 cm−1, attributed to the N–H bending vibration, is characteristic of the protonated primary amine (–NH3+) and thus constitutes a distinctive feature of the chitosan hydrochloride sample [43]. Regarding the position of the TA peaks in the CS-NP spectra, some appear at the same position as in the spectrum of neat TA, while others exhibit noticeable shifts to higher wavenumbers. However, the intensity of all TA peaks increases as the TA content becomes higher, suggesting its increased incorporation in the CS-NPs. Of particular interest is the fact that the peaks attributed to the vibrations of the benzene ring seem rather fixed (in terms of position) in contrast to those corresponding to the ester and phenol groups, which show significant displacements. This observation indicates that these functional groups are mostly affected by the interaction with CS. Indeed, the hydroxyl group of the phenolic ring of TA is expected to form hydrogen bonds with the hydroxyl and amino groups of CS. Apparently, this also alters the electron density around the ester groups of TA, increasing their vibrational frequencies, which is observed as a blue shift in the spectra. Moreover, the protonated amino groups of CS can form electrostatic interactions with the acidic TA phenolic groups, which also affects their vibrational frequency. Lastly, one should also keep in mind that the conformational restraints resulting from the interaction of CS and TA could influence the bond angles and lengths of the esters, contributing to the observed shifts. Altogether, the acquired FTIR spectra confirm the successful interaction and cross-linking of CS with TA.
Similarly, the UV–Vis spectra of the CS-NPs at 1% w/v CS concentration and different TA content are presented in Figure 1b, along with the corresponding spectrum of TA. The spectra for the samples prepared at 0.1% and 0.5% w/v CS are shown in Figure S2, where the correlation between the absorbance at 275 nm and TA content for all CS-NPs samples is also presented. The characteristic peak at 275 nm, attributed to π-π* transitions in the aromatic rings of TA [45,46], is prominent in all CS-NPs spectra, with its intensity being directly proportional to the TA content (Figure S2c) and its position remaining unaltered. The specific position of the peak indicates a rather acidic environment [27], which is consistent with the low pH of the CS solvent (i.e., 0.2% v/v AcOH). Furthermore, the absence of a shift suggests that the aromatic π-system of TA is not strongly perturbed by its interaction with CS. This corroborates the assumption that TA interacts with CS primarily through hydrogen bonding and electrostatic interactions involving phenolic hydroxyl and ester groups, whereas the aromatic rings remain spectroscopically and electronically unaffected.
3.2. Physicochemical Properties of the CS-NPs
The solution properties of the CS-NPs prepared at 0.1%, 0.5%, and 1% w/v CS and varying TA content were investigated by performing DLS and ELS measurements. The obtained results regarding the values of the scattered intensity at 90° (I90), the average hydrodynamic radius (Rh), derived from the cumulant analysis, the polydispersity index (PDI), and the zeta potential (ζP), as a function of TA content, are presented in Figure 2. Also included for comparison are the corresponding values for the initial CS solutions (i.e., points at 0 TA content). Additional information about the size of the NPs can be extracted through the CONTIN analysis of the DLS measurement, which provides the intensity-weighted size distribution functions (SDFs) shown in Figure 3, along with the corresponding Rh values of the individual discerned peaks.
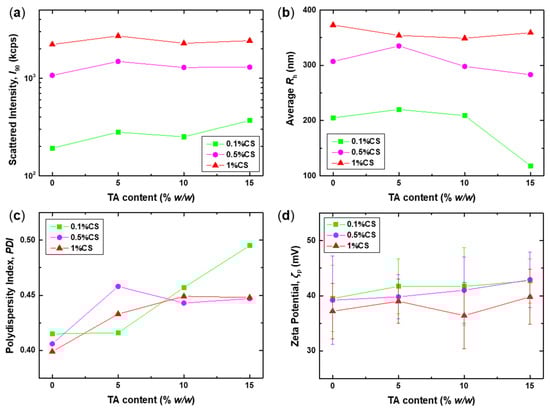
Figure 2.
DLS and ELS results: (a) scattered intensity at 90° (I90), (b) average hydrodynamic radius (Rh), (c) polydispersity index (PDI), and (d) zeta potential (ζP), as a function of TA content, for the CS-NPs prepared at 0.1%, 0.5%, and 1% w/v CS.
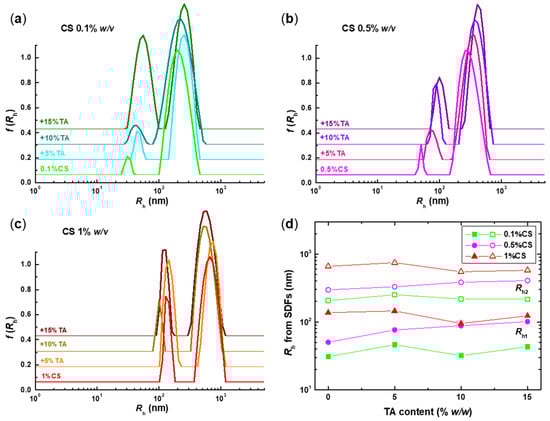
Figure 3.
Size distribution functions (SDFs) for the CS-NPs prepared at (a) 0.1%, (b) 0.5%, and (c) 1% w/v CS and varying TA content, along with (d) the corresponding Rh values of the two discerned peaks: Rh1 (closed symbols) and Rh2 (open symbols). The SDFs of the initial CS solutions are also included for comparison.
The measured scattered intensity values (Figure 2a) are proportional to the total mass of the scattering species in solution, and the effect of the initial CS solution concentration on the I90 values is evident, as they are proportional to the CS weight percentage. The addition of TA leads to a rather small increase in the I90 values, possibly indicating the formation of CS-NPs. Nevertheless, the actual value of the TA content does not seem to greatly affect the mass of the formed NPs, as the I90 values are quite similar for all three TA contents. Therefore, the mass of the CS-NPs is most likely dictated by the mass of the species in the initial CS solution, without any signs of secondary aggregation or agglomeration, which would entail a significant increase in scattered intensity. Regarding the corresponding sizes, a similar trend is observed for the average Rh of the CS-NPs (Figure 2b), with their size being comparable to that of the CS precursor, independent of the TA content. The observed significant decrease in the average Rh value for the 0.1%CS+15%TA sample is due to the change in the relative intensity of the two peaks discerned in the corresponding SDFs (Figure 3a). Of course, in all cases, the size is a function of the initial CS concentration, with larger NPs detected at higher concentrations, as previously reported [18,23,28,31].
A more detailed picture of the different particle populations in the solution and their respective sizes can be extracted from the SDFs shown in Figure 3. For all examined samples, a bimodal distribution is observed, indicating the presence of two populations: small and large particles with sizes ranging from 30 to 100 nm and 200 to 600 nm, respectively. This is also a common feature in all the solutions of the precursor CS, suggesting that the polysaccharide exhibits some degree of self-assembly in solution, forming multi-chain aggregates. The tendency of chitosan to form intra- and intermolecular aggregates in solution owing to hydrophobic interactions between the residual acetylated groups has been thoroughly established experimentally over the years [47,48,49,50,51]. Consequently, the two peaks in the SDFs of the CS samples most likely correspond to single chains (Rh1) and intermolecular aggregates (Rh2), which consist of several CS chains. As the CS concentration increases, the size of both populations also increases significantly, so it seems that both peaks correspond to aggregates of different numbers of chains. This can be a direct consequence of the fact that an increasing number of chains in solution is expected to favour intermolecular interactions. Actually, for the 1% w/v CS sample, the contribution of the Rh1 peak to the overall distribution is significantly increased. This is direct evidence of the strong scattering of this population; therefore, their mass is considerably greater than that of those formed at the two lower CS concentrations. In most cases, cross-linking with TA does not significantly affect the sizes of the already formed particles, especially the larger ones, which implies that the conformation of the original CS aggregates is preserved and further stabilised by the addition of TA. Nevertheless, at lower CS concentrations and high TA content, the contribution of the Rh1 peaks increases (most notably for the 0.1%CS+15%TA sample), which could mean that even the small peak corresponds to aggregates. Apparently, high TA content promotes interchain binding, as is the case for the high CS concentration.
The coexistence of different particle populations and the formation of aggregates also entail increased polydispersity in all cases, as evidenced by the obtained PDI values that are above 0.4 (Figure 2c). A small increase is observed after the addition of TA, signifying an enhancement of the aggregation processes. However, all formed CS-NPs exhibit a strong positive effective charge, with ζP values of approximately +40 mV, which enhances their colloidal stability. Notably, the zeta potential of the CS-NPs is almost identical to that of the original CS species, which suggests that the incorporation of TA does not perturb the overall charge, although some degree of charge neutralisation occurs due to the electrostatic interactions between CS and TA. So, appropriate conformational rearrangements are possibly taking place in order to compensate for the loss of charges. This could be considered as further proof that the conformation of CS is the driving factor that determines the properties of the resulting CS-NPs.
3.3. Molecular Characteristics of the CS-NPs
Additional information regarding the molecular characteristics of the CS-NPs can be obtained through AUC measurements. Representative samples of 0.5%CS+5%TA and 1%CS+5%TA were selected (the absorbance of 0.1%CS samples was not sufficient for accurate measurements), and sedimentation velocity (SV) experiments were performed. The obtained boundary profile data were analysed using SEDFIT software (version 16.1c), and the acquired sedimentation coefficient distributions are presented in Figure 4. The corresponding molar mass (M) values for each peak, calculated according to the Svedberg equation, are also noted.
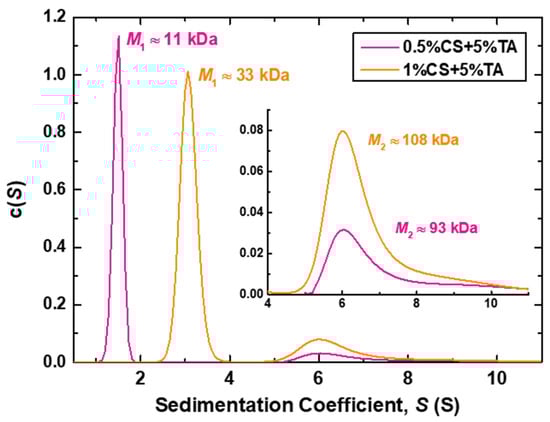
Figure 4.
Sedimentation coefficient (S) distributions derived from AUC measurements of the 0.5%CS+5%TA and 1%CS+5%TA samples. The corresponding molar mass (M) values for each peak are also shown, while the inset shows a scale-up of the region for S ≥ 4 S.
Both samples exhibit two peaks, indicating the existence of two different sedimenting populations in the solutions, as was the case for the DLS results. The first peaks (<4 S) correspond to slowly sedimenting, or in other words, small particles, while the second peaks (>4 S) indicate fast sedimentation, thus representing larger entities. The calculated approximate molar mass values for the first peaks (M1) are 11 and 33 kDa for the NPs prepared at 0.5% and 1% w/v CS, respectively. These values are significantly smaller than the molecular weight of CS (i.e., MW = 61 kDa) and can only be considered as apparent values. This is because single CS chains in solution are expected to be highly solvated and adopt a rather extended conformation, leading to slower sedimentation and, therefore, an underestimation of their molar mass. The non-ideal hydrodynamic behaviour of charged polysaccharides, stemming from high chain stiffness and charge density, has been proven challenging for the determination of their molecular weight/mass, especially by sedimentation methods [52,53,54]. Still, the obtained M values offer useful qualitative insight, verifying the notion that the smaller population of particles formed at higher CS concentration, i.e., 1%CS+5%TA sample, is most probably multi-chain aggregates, as it corresponds to a three-times higher molar mass than those at 0.5%CS+5%TA. Moreover, the larger particles corresponding to the second peak have more comparable M2 values, suggesting a small variation in the number of CS chains comprising the NPs. Finally, from the comparison between the M1 value for the 0.5%CS+5%TA sample (assuming that this population corresponds to single chains) and the M2 values of both samples, it could be inferred that the large population of CS-NPs consists of approximately 10 CS chains.
3.4. Morphology of the CS-NPs
AFM imaging was performed in order to visualise the CS-NPs and extract valuable information about their morphology. Figure 5 shows the obtained 2D and 3D AFM images for the representative samples 0.5%CS+5%TA and 1%CS+5%TA. Additional 2D images of lower magnification were analysed using ImageJ software (Figure S3), which provided a statistical particle size and shape analysis (the obtained circularity values for the analysed particles are shown in Figure S3). The corresponding histograms of the particle diameters (D) are also included in Figure 5, where the average D values for different populations are noted. As can be seen, spherical NPs with smooth surfaces and varying sizes are detected for both samples. Regarding the size distribution, the majority of the detected particles correspond to a small population with an average diameter of approximately 20 or 15 nm for the NPs prepared at 0.5% or 1% w/v CS, respectively. Larger particles, with an average size of about 45 nm, are also detected for both samples. For the 1%CS+5%TA sample, an even larger particle with a diameter close to 75 nm is observed. In general, the measured AFM particle sizes are significantly smaller than the corresponding hydrodynamic sizes derived from the DLS measurements. This is a common discrepancy between the two techniques, as DLS measures particles in their hydrated state, whereas in AFM imaging, the particles are in the dry form [55,56,57,58]. Especially in the case of CS-NPs, which are characterised by a loose structure (nanogel-like), they are expected to shrink considerably upon drying. In fact, it seems that the larger particles are susceptible to a higher degree of shrinking (i.e., greater reduction in comparison to hydrodynamic size), which matches the hypothesis that these are aggregates of several loosely bound CS chains. The measured small height of the particles, which is approximately 3 nm in both cases, also confirms their loose structure, in the sense that the particles adopt a rather flat shape upon deposition on a solid planar surface.
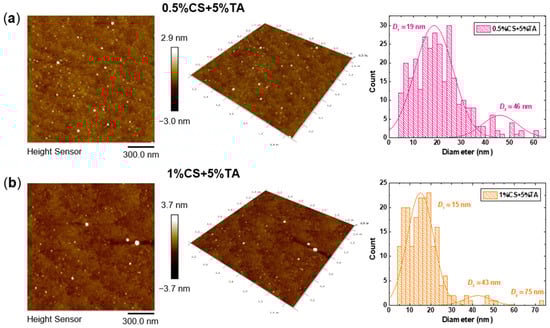
Figure 5.
AFM images in 2D and 3D, along with the corresponding histograms of the particle diameters obtained by analysis with ImageJ (where the average diameters of different populations are noted), for the (a) 0.5%CS+5%TA and (b) 1%CS+5%TA samples.
3.5. Internal Hydrophobicity of the CS-NPs
The ability of the prepared CS-NPs to incorporate hydrophobic molecules is crucial for their potential application as carriers for hydrophobic bioactive ingredients. For this reason, the hydrophobicity of the CS-NPs was examined in detail by fluorescence spectroscopy and the use of three probes with varying sensitivities to changes in the polarity of their environment. Initially, pyrene was utilised to assess the formation of hydrophobic microdomains in the structure of the CS-NPs. Pyrene has a characteristic fluorescence emission spectrum exhibiting five major vibronic bands. The intensity ratio of the first (located around 373 nm) to the third (located around 384 nm), denoted as I1/I3, is used for the investigation of aggregation phenomena, and especially for the determination of the critical aggregation concentration (CAC) of amphipathic molecules upon association in aqueous solutions, including both unmodified and hydrophobically modified chitosans [48,59,60]. As the aggregation of CS in the original stock solutions has already been established by DLS, it is also expected to affect the emission of pyrene.
The fluorescence spectra obtained for the initial 0.1%, 0.5%, and 1% w/v CS solutions after the addition of pyrene are presented in Figure 6a, in comparison to the spectra of pyrene solutions in water and acetone at the same final concentration (i.e., 1 μM). The corresponding I1/I3 ratios shown in Figure 6b reveal a decrease in polarity (lower I1/I3 values) or, equivalently, an increase in hydrophobicity with increasing CS concentration. Specifically, the I1/I3 ratio ranges from a value of approximately 1.65 for the 0.1%CS sample to 1.45 for the 1%CS sample. Note that the corresponding ratio values for pyrene in water and acetone are 1.66 and 1.55, respectively. Apparently, as the concentration of CS increases, the self-aggregation process is also enhanced, resulting in the formation of denser and less hydrated structures. Moreover, a reduction in the overall fluorescence intensity (i.e., quenching) of pyrene is observed at higher CS concentrations, indicating aggregation. When luminescent probes like pyrene aggregate, their fluorescence can be quenched, a phenomenon known as aggregation-caused quenching (ACQ) [61]. This observation is in direct correlation with the formation of denser CS multi-chain aggregates, which seem to contain more and/or larger hydrophobic microdomains, as more inter-/intrachain binding sites are created. Thus, the incorporation of pyrene molecules is enhanced, eventually leading to aggregation and reduced fluorescence.
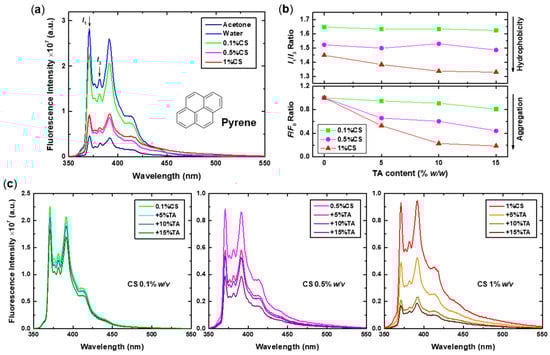
Figure 6.
(a) Fluorescence spectra of pyrene (molecular structure also shown) in acetone, water, and 0.1%, 0.5%, and 1% w/v CS initial solutions (excitation at 335 nm). (b) The calculated I1/I3 and F/F0 intensity ratio values for the CS-NPs prepared at 0.1%, 0.5%, and 1% w/v CS and varying TA content, derived from (c) the corresponding spectra.
As evidenced by the corresponding spectra of the CS-NPs shown in Figure 6c, the addition of TA results in an either imperceptible (i.e., for the NPs prepared at 0.1% w/v CS) or noticeable decrease in both the I1/I3 ratio and the quenching of the fluorescence intensity, which is expressed by the relative fluorescence F/F0 ratio values (calculated based on the intensity of the I1 peak), also shown in Figure 6b. This dual effect is concentration-dependent, as it becomes even more pronounced (especially quenching) at higher CS concentrations and TA contents. Therefore, cross-linking with TA increases the hydrophobicity of the NPs either by providing additional sites/domains capable of incorporating pyrene molecules or by assisting the aggregation and binding of the CS chains. Even so, when the concentration of CS is low, the interchain interactions are limited, and the formed NPs are composed of a small number of chains. Consequently, they retain a high degree of solvation, even after the addition of TA, as expressed by the rather high and practically constant I1/I3 values. Finally, it is worth noting that the intense quenching observed at high TA concentrations without evidence of excimer formation (i.e., appearance of a broad peak at about 480 nm) could be an indication of increased TA–pyrene interactions. It is possible that the phenolic groups of TA form non-fluorescent complexes with pyrene via π-π stacking or hydrophobic interactions, thus reducing the fluorescence intensity. Similarly, the interaction of pyrene with methylene blue, by proper orientation of their aromatic rings, resulted in the separation of self-associated pyrene aggregates, lowering the excimer signal of pyrene-labelled poly(acrylic acid) [62].
Likewise, Nile red was introduced into the solutions of both the precursor CS and the formed CS-NPs to probe the local polarity of the various nano-assemblies. Nile red is a dye that exhibits strong solvatochromism, fluorescing intensely in nonpolar/organic solvents while showing minimal fluorescence in polar solvents such as water. It is mostly known as a polarity-sensitive probe for the characterisation of proteins [63,64], but there are also reports in the literature of its use for the investigation of NPs formed either through CS electrostatic complexation [65,66] or self-assembly of hydrophobically modified CS [67]. The fluorescence emission spectra of Nile red in the initial 0.1%, 0.5%, and 1% w/v CS solutions (compared to the Nile red spectra in acetone and water), along with the corresponding spectra for the CS-NPs prepared at various CS concentrations and TA contents, as well as the position of the peaks’ maxima and the relative intensity F/F0 ratio as a function of TA content, are presented in Figure 7. Characteristic peak features, including the position of the maxima and observed shoulders, are noted in all cases. Moreover, the intensity of some spectra was normalised for comparison, and the correction factor (i.e., division by a constant) is indicated. For better visualisation of the spectral changes and shifts, the same intensity-normalised fluorescence spectra are shown in Figure S4.
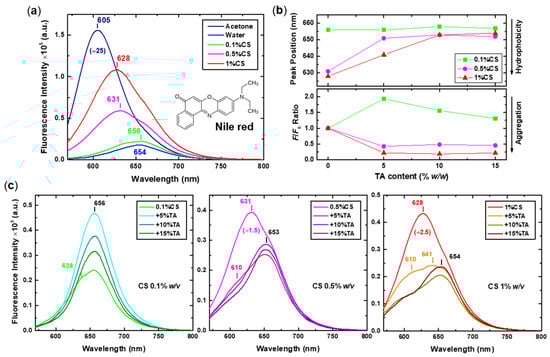
Figure 7.
(a) Fluorescence spectra of Nile red (molecular structure also shown) in acetone, water, and 0.1%, 0.5%, and 1% w/v CS initial solutions (excitation at 550 nm). (b) The position of the peaks and the F/F0 intensity ratio values for the CS-NPs prepared at 0.1%, 0.5%, and 1% w/v CS and varying TA content, derived from (c) the corresponding spectra.
The comparison between the two Nile red spectra in acetone and water (Figure 7a) reveals its distinctive fluorescence properties, that is, very high intensity and blue-shifted emission (peak position at 605 nm) in organic solvents/hydrophobic environments versus very low intensity and red-shifted emission (peak position at 654 nm) in water/hydrophilic environments. Accordingly, the spectra of Nile red in the initial CS solutions exhibit a gradual increase in intensity and a shift to lower wavenumbers with increasing concentration. This is direct evidence that the probe experiences a more hydrophobic microenvironment as the self-aggregation of CS becomes more extensive, creating additional hydrophobic domains. The close similarity of the Nile red spectrum at low CS concentration (i.e., 0.1%CS) to that in water demonstrates once again the highly solvated and expanded/open conformation of the corresponding assemblies. After TA is added to these multi-chain aggregates, new hydrophobic regions are formed that can accommodate Nile red; thus, a considerable increase in the fluorescence intensity is observed for the 0.1%CS+5%TA sample. Further increase in the TA content results in a decrease in intensity, which could be attributed to the self-quenching of Nile red due to stacking and non-radiative energy transfer caused by aggregation [68,69]. Still, since no shift of the peak is observed, the formed CS-NPs must retain a significant degree of hydration.
Interestingly, a different picture is seen at higher CS concentrations. The spectra of the NPs are significantly quenched in comparison to the initial CS solutions of the same concentration, indicating increased aggregation of the fluorophore. At the same time, the position of the maxima of the peaks appears markedly red-shifted, which may seem contradictory because it translates to increased hydrophilicity. Upon closer inspection of the corresponding spectra (see also Figure S4), a dual contribution to the overall peak, expressed as a shoulder located around 610 nm, can be discerned, particularly at low TA content. A similar peak “splitting” was observed for Nile red spectra in methanol–water mixtures as the water volume fraction increased and was associated with the twisted intramolecular charge transfer (TICT) properties of the dye in combination with its aggregation in water [68]. Therefore, it appears that there are two distinct species of Nile red molecules incorporated into the CS-NPs: isolated molecules located in hydrophilic regions and closely packed aggregates that form in the hydrophobic microdomains owing to high accumulation and overcrowding conditions. At higher TA contents, the contribution of the aggregates (i.e., shoulder at 610 nm) decreases, which could indicate even more pronounced dye aggregation and/or mobility restriction due to the increased topological density. Another important contributing factor to the observed quenching with the increase in TA is that the phenolic hydroxyl groups of TA can act as H-bond donors to the Nile red carbonyl groups, promoting non-radiative decay through hydrogen bonding and thus lowering the fluorescence quantum yield [70].
The third employed probe was ANS, whose fluorescence is sensitive to both the polarity and viscosity of its environment. A blue shift of the emission maximum and an increase in the quantum yield occur with decreasing polarity of the solvent and are correlated to the TICT process, which characterises ANS as well [64]. ANS has been extensively used for protein surface hydrophobicity studies, which have shown that the dye can bind to the protein not only hydrophobically but also electrostatically through its negatively charged sulfonate groups [71,72,73,74]. Apart from proteins, the micellization process and micelle properties of sodium dodecyl sulphate [75] and hydrophobically modified chitosans [76] have been probed with the aid of ANS fluorescence. In the context of this study, the obtained emission spectra of ANS after addition to the initial CS solutions and the corresponding CS-NPs are shown in Figure 8. The manner of presentation is identical to that of Nile red, with all characteristic spectral traits being noted, while intensity-normalised spectra are shown in Figure S5. Once again, the increase in the hydrophobicity of the system as the concentration of CS increases is evident from the ANS spectra. The 0.1%CS sample spectrum is almost identical to that of ANS in water, exhibiting a relatively low intensity and a red-shifted maximum around 511 nm, thus verifying the increased hydration of the assemblies formed at low CS concentration. As the concentration of CS increases, a gradual intensity increase and shift of the spectrum to lower wavenumbers (up to 496 nm) is observed, with a parallel appearance of a shoulder at approximately 443 nm. It seems that, also in the case of ANS, there is a dual contribution to the fluorescence spectra, which could be attributed to molecules exhibiting different microenvironments. Most likely, ANS molecules bound either on the hydrophilic surface of the CS aggregates via electrostatic interactions or inside the hydrophobic regions formed by interchain binding coexist in the 0.5% and 1% w/v CS solutions. A multi-component contribution to the fluorescence spectra of ANS due to molecules bound at different surface sites of lysozyme or bovine serum albumin proteins has been previously described [74].
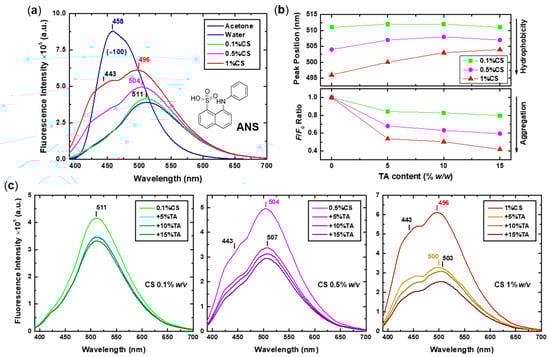
Figure 8.
(a) Fluorescence spectra of ANS (molecular structure also shown) in acetone, water, and 0.1%, 0.5%, and 1% w/v CS initial solutions (excitation at 370 nm). (b) The position of the peaks and the F/F0 intensity ratio values for the CS-NPs prepared at 0.1%, 0.5%, and 1% w/v CS and varying TA content, derived from (c) the corresponding spectra.
As far as the CS-NPs are concerned, the addition of TA seems to have a less prominent effect on the fluorescence of ANS than the two previously utilised probes, as the occurring spectral changes are more subtle (Figure 8c). At low CS concentration, only a small degree of intensity quenching with no shift of the peak position are seen, while at higher CS concentrations, the quenching is gradually more evident, accompanied by a small red shift of the peaks’ maxima and a decrease in the intensity of the shoulder at 443 nm (see also Figure S5). The incorporation of TA increases the hydrophobic interactions and regions within the particles, with the ANS molecules located in the corresponding microenvironments experiencing either ACQ, loss of fluorescence due to their interaction with the TA molecules, or restricted mobility as a result of the increased density of the aggregates, as previously discussed. The difference in this case is that the electrostatically surface-bound ANS molecules are less affected by the presence of TA, thus their fluorescence contribution is retained, leading to comparably smaller quenching and red-shift.
In total, the varying sensitivity of the three probes to changes in the polarity of their environment allowed for a distinction between the hydrophobic and hydrophilic regions of the initial CS multi-chain aggregates and the formed CS-NPs. This way, the effect of the increase in both CS concentration and added TA content proved to trigger a significant enhancement of hydrophobic interactions, leading to denser particle structures.
4. Conclusions
This study concerned the detailed characterisation of CS-NPs prepared via ionotropic gelation using TA as the cross-linking agent over a range of CS concentrations and TA contents. The sum of the obtained results highlights the role of the intrinsic properties of CS, especially the fine balance between its mostly hydrophilic but also partially hydrophobic (due to the residual acetylated groups) character. The successful cross-linking of CS with TA was confirmed by FTIR and UV–Vis spectroscopies. Subsequently, DLS and ELS measurements were employed to investigate the solution properties of both the precursor CS and the formed NPs after the addition of TA. The overall physicochemical characteristics (i.e., mass, size, charge, and structure) of the CS-NPs were mostly dictated by the intrinsic conformation of CS, which formed multi-chain aggregates in solution owing to hydrophobic interactions. The structure of these aggregates was directly correlated to the CS concentration, as the aggregation became more extended, leading to denser conformations with increasing concentration. The addition of TA further stabilised the preformed CS nano-assemblies without significantly altering their properties in regard to mass, size, and charge. Accordingly, two scattering populations with Rh values ranging from 30 to 100 nm and 200 to 600 nm, respectively, were detected in the solutions of the CS-NPs corresponding to NPs consisting of different numbers of CS chains. Their density increased at high TA content since TA enhances hydrophobic interactions and interchain binding. Nevertheless, their colloidal stability was ensured by their strong positive effective charge (i.e., zeta potential about +40 mV). AUC measurements provided an estimation of the molar mass of the formed CS-NPs, allowing for qualitative comparisons between the different populations. The CS-NPs’ morphology was determined as spherical by AFM imaging, which also verified their loose structure and size polydispersity. Finally, a thorough investigation of the hydrophobicity of the different obtained NPs was performed through fluorescence spectroscopy and the use of three probes of varying sensitivity to changes in the polarity of their microenvironment. Pyrene, Nile red, and ANS fluorescence emission spectra were used to elucidate the structure of the CS-NPs under study, highlighting the interplay between hydrophobic and hydrophilic interactions and/or regions. Moreover, it was shown that both the increase in CS concentration and the addition of increasing TA content led to more compact structures as a result of the enhanced hydrophobicity. Altogether, this study demonstrates the depth of accessible information through the specific combination of applied methods regarding the physicochemical properties of the prepared CS-NPs, which are in turn closely related to their overall performance as carriers of active ingredients.
Supplementary Materials
The following supporting information can be downloaded at https://www.mdpi.com/article/10.3390/polysaccharides6030067/s1, Table S1: CS/TA mass ratio and corresponding molar charge ratio values for the prepared CS-NPs; Figure S1: FTIR spectra for the CS-NPs prepared at (a) 0.1% and (b) 0.5% w/v CS concentration and different TA content; Figure S2: UV–Vis spectra for the CS-NPs prepared at (a) 0.1% and (b) 0.5% w/v CS concentration and different TA content. (c) Relation between the absorbance at 275 nm and TA content for all CS-NPs samples; Figure S3: Lower magnification 2D AFM images, along with the corresponding histograms of the particle circularity, for the (a) 0.5%CS+5%TA and (b) 1%CS+5%TA samples; Figure S4: Intensity normalised fluorescence spectra of Nile red; Figure S5: Intensity normalised fluorescence spectra of ANS.
Author Contributions
Conceptualisation, S.P.; methodology, M.K., E.H., S.R. and S.P.; investigation, M.K. and E.H.; visualisation: M.K.; writing—original draft preparation, M.K.; writing—review and editing, M.K., E.H., S.R. and S.P.; supervision, S.P.; funding acquisition, S.P. All authors have read and agreed to the published version of the manuscript.
Funding
This research was partially funded by the project NANOSHIELD (Τ2ЕDΚ−02113) of the Operational Programme “Competitiveness, Entrepreneurship and Innovation” (NSRF 2014–2020) action that was co-financed by Greece and the European Union (European Regional Development Fund).
Institutional Review Board Statement
Not applicable.
Data Availability Statement
Data are contained within the article or supplementary materials.
Acknowledgments
Krasimira Rusinova-Ilieva and Radka Radeva from the Institute of Polymers, Bulgarian Academy of Sciences, are greatly acknowledged for the AFM imaging and AUC measurements, respectively.
Conflicts of Interest
The authors declare no conflicts of interest.
References
- Kashyap, P.L.; Xiang, X.; Heiden, P. Chitosan Nanoparticle Based Delivery Systems for Sustainable Agriculture. Int. J. Biol. Macromol. 2015, 77, 36–51. [Google Scholar] [CrossRef]
- Kumaraswamy, R.V.; Kumari, S.; Choudhary, R.C.; Pal, A.; Raliya, R.; Biswas, P.; Saharan, V. Engineered Chitosan Based Nanomaterials: Bioactivities, Mechanisms and Perspectives in Plant Protection and Growth. Int. J. Biol. Macromol. 2018, 113, 494–506. [Google Scholar] [CrossRef]
- Chouhan, D.; Mandal, P. Applications of Chitosan and Chitosan Based Metallic Nanoparticles in Agrosciences-A Review. Int. J. Biol. Macromol. 2021, 166, 1554–1569. [Google Scholar] [CrossRef]
- Karamchandani, B.M.; Dalvi, S.G.; Bagayatkar, M.; Banat, I.M.; Satpute, S.K. Prospective Applications of Chitosan and Chitosan-Based Nanoparticles Formulations in Sustainable Agricultural Practices. Biocatal. Agric. Biotechnol. 2024, 58, 103210. [Google Scholar] [CrossRef]
- Saberi Riseh, R.; Vatankhah, M.; Hassanisaadi, M.; Varma, R.S. A Review of Chitosan Nanoparticles: Nature’s Gift for Transforming Agriculture through Smart and Effective Delivery Mechanisms. Int. J. Biol. Macromol. 2024, 260, 129522. [Google Scholar] [CrossRef]
- Bandara, S.; Du, H.; Carson, L.; Bradford, D.; Kommalapati, R. Agricultural and Biomedical Applications of Chitosan-Based Nanomaterials. Nanomaterials 2020, 10, 1903. [Google Scholar] [CrossRef] [PubMed]
- Bhatt, S.; Pathak, R.; Punetha, V.D.; Punetha, M. Chitosan Nanocomposites as a Nano-Bio Tool in Phytopathogen Control. Carbohydr. Polym. 2024, 331, 121858. [Google Scholar] [CrossRef] [PubMed]
- Chandrasekaran, M.; Paramasivan, M. Chitosan Derivatives Act as a Bio-Stimulants in Plants: A Review. Int. J. Biol. Macromol. 2024, 271, 132720. [Google Scholar] [CrossRef] [PubMed]
- Lingait, D.; Rahagude, R.; Gaharwar, S.S.; Das, R.S.; Verma, M.G.; Srivastava, N.; Kumar, A.; Mandavgane, S. A Review on Versatile Applications of Biomaterial/Polycationic Chitosan: An Insight into the Structure-Property Relationship. Int. J. Biol. Macromol. 2024, 257, 128676. [Google Scholar] [CrossRef] [PubMed]
- Schmitz, C.; González Auza, L.; Koberidze, D.; Rasche, S.; Fischer, R.; Bortesi, L. Conversion of Chitin to Defined Chitosan Oligomers: Current Status and Future Prospects. Mar. Drugs 2019, 17, 452. [Google Scholar] [CrossRef]
- Rahman, M.A.; Halfar, J. First Evidence of Chitin in Calcified Coralline Algae: New Insights into the Calcification Process of Clathromorphum Compactum. Sci. Rep. 2014, 4, 6162. [Google Scholar] [CrossRef]
- Mikušová, V.; Mikuš, P. Advances in Chitosan-Based Nanoparticles for Drug Delivery. Int. J. Mol. Sci. 2021, 22, 9652. [Google Scholar] [CrossRef]
- Morin-Crini, N.; Lichtfouse, E.; Torri, G.; Crini, G. Applications of Chitosan in Food, Pharmaceuticals, Medicine, Cosmetics, Agriculture, Textiles, Pulp and Paper, Biotechnology, and Environmental Chemistry. Environ. Chem. Lett. 2019, 17, 1667–1692. [Google Scholar] [CrossRef]
- Nasaj, M.; Chehelgerdi, M.; Asghari, B.; Ahmadieh-Yazdi, A.; Asgari, M.; Kabiri-Samani, S.; Sharifi, E.; Arabestani, M. Factors Influencing the Antimicrobial Mechanism of Chitosan Action and Its Derivatives: A Review. Int. J. Biol. Macromol. 2024, 277, 134321. [Google Scholar] [CrossRef]
- Mawazi, S.M.; Kumar, M.; Ahmad, N.; Ge, Y.; Mahmood, S. Recent Applications of Chitosan and Its Derivatives in Antibacterial, Anticancer, Wound Healing, and Tissue Engineering Fields. Polymers 2024, 16, 1351. [Google Scholar] [CrossRef]
- Nandhini, R.; Rajeswari, E.; Harish, S.; Sivakumar, V.; Gangai Selvi, R.; Jaya Sundrasharmila, D. Role of Chitosan Nanoparticles in Sustainable Plant Disease Management. J. Nanoparticle Res. 2025, 27, 13. [Google Scholar] [CrossRef]
- Hoang, N.H.; Le Thanh, T.; Sangpueak, R.; Treekoon, J.; Saengchan, C.; Thepbandit, W.; Papathoti, N.K.; Kamkaew, A.; Buensanteai, N. Chitosan Nanoparticles-Based Ionic Gelation Method: A Promising Candidate for Plant Disease Management. Polymers 2022, 14, 662. [Google Scholar] [CrossRef] [PubMed]
- Liu, H.; Gao, C. Preparation and Properties of Ionically Cross-linked Chitosan Nanoparticles. Polym. Adv. Technol. 2009, 20, 613–619. [Google Scholar] [CrossRef]
- Rampino, A.; Borgogna, M.; Blasi, P.; Bellich, B.; Cesàro, A. Chitosan Nanoparticles: Preparation, Size Evolution and Stability. Int. J. Pharm. 2013, 455, 219–228. [Google Scholar] [CrossRef]
- Kleine-Brueggeney, H.; Zorzi, G.K.; Fecker, T.; El Gueddari, N.E.; Moerschbacher, B.M.; Goycoolea, F.M. A Rational Approach towards the Design of Chitosan-Based Nanoparticles Obtained by Ionotropic Gelation. Colloids Surf. B 2015, 135, 99–108. [Google Scholar] [CrossRef]
- Lozano Chamizo, L.; Luengo Morato, Y.; Ovejero Paredes, K.; Contreras Caceres, R.; Filice, M.; Marciello, M. Ionotropic Gelation-Based Synthesis of Chitosan-Metal Hybrid Nanoparticles Showing Combined Antimicrobial and Tissue Regenerative Activities. Polymers 2021, 13, 3910. [Google Scholar] [CrossRef]
- Amin, M.K.; Boateng, J.S. Enhancing Stability and Mucoadhesive Properties of Chitosan Nanoparticles by Surface Modification with Sodium Alginate and Polyethylene Glycol for Potential Oral Mucosa Vaccine Delivery. Mar. Drugs 2022, 20, 156. [Google Scholar] [CrossRef] [PubMed]
- Alehosseini, E.; Shahiri Tabarestani, H.; Kharazmi, M.S.; Jafari, S.M. Physicochemical, Thermal, and Morphological Properties of Chitosan Nanoparticles Produced by Ionic Gelation. Foods 2022, 11, 3841. [Google Scholar] [CrossRef] [PubMed]
- Aelenei, N.; Popa, M.I.; Novac, O.; Lisa, G.; Balaita, L. Tannic Acid Incorporation in Chitosan-Based Microparticles and in Vitro Controlled Release. J. Mater. Sci. Mater. Med. 2009, 20, 1095–1102. [Google Scholar] [CrossRef]
- Li, N.; Yang, X.; Liu, W.; Xi, G.; Wang, M.; Liang, B.; Ma, Z.; Feng, Y.; Chen, H.; Shi, C. Tannic Acid Cross-linked Polysaccharide-Based Multifunctional Hemostatic Microparticles for the Regulation of Rapid Wound Healing. Macromol. Biosci. 2018, 18, 1–16. [Google Scholar] [CrossRef] [PubMed]
- Smith, R.A.; Walker, R.C.; Levit, S.L.; Tang, C. Single-Step Self-Assembly and Physical Crosslinking of PEGylated Chitosan Nanoparticles by Tannic Acid. Polymers 2019, 11, 749. [Google Scholar] [CrossRef]
- Lee, S.J.; Gwak, M.A.; Chathuranga, K.; Lee, J.S.; Koo, J.; Park, W.H. Multifunctional Chitosan/Tannic Acid Composite Films with Improved Anti-UV, Antioxidant, and Antimicrobial Properties for Active Food Packaging. Food Hydrocoll. 2023, 136, 108249. [Google Scholar] [CrossRef]
- Zhan, F.; Sheng, F.; Yan, X.; Zhu, Y.; Jin, W.; Li, J.; Li, B. Enhancement of Antioxidant and Antibacterial Properties for Tannin Acid/Chitosan/Tripolyphosphate Nanoparticles Filled Electrospinning Films: Surface Modification of Sliver Nanoparticles. Int. J. Biol. Macromol. 2017, 104, 813–820. [Google Scholar] [CrossRef]
- Leonida, M.D.; Benzecry, A.; Lozanovska, B.; Mahmoud, Z.; Reid, A.; Belbekhouche, S. Impact of Tannic Acid on Nisin Encapsulation in Chitosan Particles. Int. J. Biol. Macromol. 2023, 233, 123489. [Google Scholar] [CrossRef]
- Rashidipour, M.; Abbaszadeh, S.; Birjandi, M.; Pajouhi, N.; Ahmadi Somaghian, S.; Goudarzi, G.; Shahryarhesami, S.; Moradi Sarabi, M.; Babaeenezhad, E. Antimicrobial Activity and Cytotoxic and Epigenetic Effects of Tannic Acid-Loaded Chitosan Nanoparticles. Sci. Rep. 2024, 14, 30405. [Google Scholar] [CrossRef]
- Cadinoiu, A.N.; Rata, D.M.; Daraba, O.M.; Atanase, L.I.; Horhogea, C.E.; Chailan, J.F.; Popa, M.; Carauleanu, A. Metronidazole-Loaded Chitosan Nanoparticles with Antimicrobial Activity Against Clostridium Perfringens. Pharmaceutics 2025, 17, 294. [Google Scholar] [CrossRef]
- Shagholani, H.; Ghoreishi, S.M. Investigation of Tannic Acid Cross-Linked onto Magnetite Nanoparticles for Applying in Drug Delivery Systems. J. Drug Deliv. Sci. Technol. 2017, 39, 88–94. [Google Scholar] [CrossRef]
- Marzini Irranca, S.; García Schejtman, S.D.; Rosso, A.P.; Coronado, E.A.; Martinelli, M. Hybrid Nanogels by Direct Mixing of Chitosan, Tannic Acid and Magnetite Nanoparticles: Processes Involved in Their Formation and Potential Catalytic Properties. Soft Matter 2023, 19, 8378–8385. [Google Scholar] [CrossRef] [PubMed]
- Sun, X.; Yin, S.; Zhao, L.; Yang, W.; You, Y. Adsorption Properties of Methylene Blue and Cu(II) on Magnetically Oxidized Tannic Acid Cross-Linked Carboxymethyl Chitosan Gels. Int. J. Biol. Macromol. 2024, 278, 134709. [Google Scholar] [CrossRef]
- Yang, J.; Li, M.; Wang, Y.; Wu, H.; Zhen, T.; Xiong, L.; Sun, Q. Double Cross-Linked Chitosan Composite Films Developed with Oxidized Tannic Acid and Ferric Ions Exhibit High Strength and Excellent Water Resistance. Biomacromolecules 2019, 20, 801–812. [Google Scholar] [CrossRef]
- Li, S.; Liu, X.; Zhang, X.; Fan, L.; Wang, F.; Zhou, J.; Zhang, H. Preparation and Characterization of Zein-Tannic Acid Nanoparticles/Chitosan Composite Films and Application in the Preservation of Sugar Oranges. Food Chem. 2024, 437, 137673. [Google Scholar] [CrossRef] [PubMed]
- Pecora, R. Dynamic Light Scattering; Springer: Berlin/Heidelberg, Germany, 1985; ISBN 978-1-4612-9459-7. [Google Scholar]
- Chu, B. Laser Light Scattering; Elsevier: Amsterdam, The Netherlands, 1991; ISBN 9780121745516. [Google Scholar]
- Hunter, R.J. Zeta Potential in Colloid Science; Elsevier: Amsterdam, The Netherlands, 1981; ISBN 9780123619617. [Google Scholar]
- Aziz, Z.; Behlke, J.; Bernardi, G.; Bourdillon, L.; Butler, P.J.G.; Carels, N.; Clay, O.; Colfen, H.; Correia, J.J.; Daugherty, M.A.; et al. Analytical Ultracentrifugation; The Royal Society of Chemistry: London, UK, 2005; ISBN 978-0-85404-547-1. [Google Scholar]
- Edwards, G.B.; Muthurajan, U.M.; Bowerman, S.; Luger, K. Analytical Ultracentrifugation (AUC): An Overview of the Application of Fluorescence and Absorbance AUC to the Study of Biological Macromolecules. Curr. Protoc. Mol. Biol. 2020, 133, e131. [Google Scholar] [CrossRef]
- Schneider, C.A.; Rasband, W.S.; Eliceiri, K.W. NIH Image to ImageJ: 25 Years of Image Analysis. Nat. Methods 2012, 9, 671–675. [Google Scholar] [CrossRef]
- Lawrie, G.; Keen, I.; Drew, B.; Chandler-Temple, A.; Rintoul, L.; Fredericks, P.; Grøndahl, L. Interactions between Alginate and Chitosan Biopolymers Characterized Using FTIR and XPS. Biomacromolecules 2007, 8, 2533–2541. [Google Scholar] [CrossRef]
- Ricci, A.; Olejar, K.J.; Parpinello, G.P.; Kilmartin, P.A.; Versari, A. Application of Fourier Transform Infrared (FTIR) Spectroscopy in the Characterization of Tannins. Appl. Spectrosc. Rev. 2015, 50, 407–442. [Google Scholar] [CrossRef]
- Bensalah, N.; Chair, K.; Bedoui, A. Efficient Degradation of Tannic Acid in Water by UV/H2O2 Process. Sustain. Environ. Res. 2018, 28, 1–11. [Google Scholar] [CrossRef]
- Zhou, Y.; Tawiah, B.; Noor, N.; Zhang, Z.; Sun, J.; Yuen, R.K.K.; Fei, B. A Facile and Sustainable Approach for Simultaneously Flame Retarded, UV Protective and Reinforced Poly(Lactic Acid) Composites Using Fully Bio-Based Complexing Couples. Compos. Part B Eng. 2021, 215, 108833. [Google Scholar] [CrossRef]
- Anthonsen, M.; Varum, K.; Hermansson, A.; Smidsrod, O.; Brant, D. Aggregates in Acidic Solutions of Chitosans Detected by Static Laser Light Scattering. Carbohydr. Polym. 1994, 25, 13–23. [Google Scholar] [CrossRef]
- Amiji, M.M. Pyrene Fluorescence Study of Chitosan Self-Association in Aqueous Solution. Carbohydr. Polym. 1995, 26, 211–213. [Google Scholar] [CrossRef]
- Hu, Y.; Du, Y.; Yang, J.; Tang, Y.; Li, J.; Wang, X. Self-Aggregation and Antibacterial Activity of N-Acylated Chitosan. Polymer 2007, 48, 3098–3106. [Google Scholar] [CrossRef]
- Blagodatskikh, I.V.; Bezrodnykh, E.A.; Abramchuk, S.S.; Muranov, A.V.; Sinitsyna, O.V.; Khokhlov, A.R.; Tikhonov, V.E. Short Chain Chitosan Solutions: Self-Assembly and Aggregates Disruption Effects. J. Polym. Res. 2013, 20, 73. [Google Scholar] [CrossRef]
- Ho, K.W.; Ooi, C.W.; Mwangi, W.W.; Leong, W.F.; Tey, B.T.; Chan, E.-S. Comparison of Self-Aggregated Chitosan Particles Prepared with and without Ultrasonication Pretreatment as Pickering Emulsifier. Food Hydrocoll. 2016, 52, 827–837. [Google Scholar] [CrossRef]
- Harding, S.E.; Varum, K.M.; Stokke, B.T.B.T.; Smidsrod, O.; Vårum, K.M.; Stokke, B.T.B.T.; Smidsrød, O. Molecular Weight Determination of Polysaccharides. Adv. Carbohydr. Anal. 1991, 1, 63–144. [Google Scholar]
- Harding, S.E. Analysis of Polysaccharides by Ultracentrifugation. Size, Conformation and Interactions in Solution. In Polysaccharides I; Springer: Berlin/Heidelberg, Germany, 2005; Volume 186, pp. 211–254. [Google Scholar]
- Morris, G.A.; Castile, J.; Smith, A.; Adams, G.G.; Harding, S.E. Macromolecular Conformation of Chitosan in Dilute Solution: A New Global Hydrodynamic Approach. Carbohydr. Polym. 2009, 76, 616–621. [Google Scholar] [CrossRef]
- Masarudin, M.J.; Cutts, S.M.; Evison, B.J.; Phillips, D.R.; Pigram, P.J. Factors Determining the Stability, Size Distribution, and Cellular Accumulation of Small, Monodisperse Chitosan Nanoparticles as Candidate Vectors for Anticancer Drug Delivery: Application to the Passive Encapsulation of [14C]-Doxorubicin. Nanotechnol. Sci. Appl. 2015, 8, 67. [Google Scholar] [CrossRef]
- Kiilll, C.P.; Barud, H.d.S.; Santagneli, S.H.; Ribeiro, S.J.L.; Silva, A.M.; Tercjak, A.; Gutierrez, J.; Pironi, A.M.; Gremião, M.P.D. Synthesis and Factorial Design Applied to a Novel Chitosan/Sodium Polyphosphate Nanoparticles via Ionotropic Gelation as an RGD Delivery System. Carbohydr. Polym. 2017, 157, 1695–1702. [Google Scholar] [CrossRef]
- Huang, P.; Huang, C.; Ma, X.; Gao, C.; Sun, F.; Yang, N.; Nishinari, K. Effect of PH on the Mechanical, Interfacial, and Emulsification Properties of Chitosan Microgels. Food Hydrocoll. 2021, 121, 106972. [Google Scholar] [CrossRef]
- Des Bouillons-Gamboa, R.E.; Montes de Oca, G.; Baudrit, J.R.V.; Ríos Duarte, L.C.; Lopretti, M.; Rentería Urquiza, M.; Zúñiga-Umaña, J.M.; Barreiro, F.; Vázquez, P. Synthesis of Chitosan Nanoparticles (CSNP): Effect of CH-CH-TPP Ratio on Size and Stability of NPs. Front. Chem. 2024, 12, 1469271. [Google Scholar] [CrossRef] [PubMed]
- Hu, Y.; Du, Y.; Wang, X.; Feng, T. Self-aggregation of Water-soluble Chitosan and Solubilization of Thymol as an Antimicrobial Agent. J. Biomed. Mater. Res. Part A 2009, 90A, 874–881. [Google Scholar] [CrossRef] [PubMed]
- Rodrigues, M.R.; Lima, A.; Codognoto, L.; Villaverde, A.B.; Tavares Pacheco, M.T.; Moisés de Oliveira, H.P. Detection of Polymolecular Associations in Hydrophobized Chitosan Derivatives Using Fluorescent Probes. J. Fluoresc. 2008, 18, 973–977. [Google Scholar] [CrossRef]
- Feng, X.; Wang, X.; Redshaw, C.; Tang, B.Z. Aggregation Behaviour of Pyrene-Based Luminescent Materials, from Molecular Design and Optical Properties to Application. Chem. Soc. Rev. 2023, 52, 6715–6753. [Google Scholar] [CrossRef] [PubMed]
- Stîngă, G.; Băran, A.; Iovescu, A.; Aricov, L.; Anghel, D.-F. Monitoring the Confinement of Methylene Blue in Pyrene Labeled Poly(Acrylic Acid). J. Mol. Liq. 2019, 273, 125–133. [Google Scholar] [CrossRef]
- Sackett, D.L.; Wolff, J. Nile Red as a Polarity-Sensitive Fluorescent Probe of Hydrophobic Protein Surfaces. Anal. Biochem. 1987, 167, 228–234. [Google Scholar] [CrossRef]
- Hawe, A.; Sutter, M.; Jiskoot, W. Extrinsic Fluorescent Dyes as Tools for Protein Characterization. Pharm. Res. 2008, 25, 1487–1499. [Google Scholar] [CrossRef]
- Cui, W.; Lu, X.; Cui, K.; Wu, J.; Wei, Y.; Lu, Q. Photosensitive Nanoparticles of Chitosan Complex for Controlled Release of Dye Molecules. Nanotechnology 2011, 22, 65702. [Google Scholar] [CrossRef]
- Cui, W.; Lu, X.; Cui, K.; Wu, J.; Wei, Y.; Lu, Q. Fluorescent Nanoparticles of Chitosan Complex for Real-Time Monitoring Drug Release. Langmuir 2011, 27, 8384–8390. [Google Scholar] [CrossRef]
- Ercelen, S.; Zhang, X.; Duportail, G.; Grandfils, C.; Desbrières, J.; Karaeva, S.; Tikhonov, V.; Mély, Y.; Babak, V. Physicochemical Properties of Low Molecular Weight Alkylated Chitosans: A New Class of Potential Nonviral Vectors for Gene Delivery. Colloids Surf. B 2006, 51, 140–148. [Google Scholar] [CrossRef]
- Dutta, A.K.; Kamada, K.; Ohta, K. Spectroscopic Studies of Nile Red in Organic Solvents and Polymers. J. Photochem. Photobiol. A Chem. 1996, 93, 57–64. [Google Scholar] [CrossRef]
- Akbulut, M.; Ginart, P.; Gindy, M.E.; Theriault, C.; Chin, K.H.; Soboyejo, W.; Prud’homme, R.K. Generic Method of Preparing Multifunctional Fluorescent Nanoparticles Using Flash NanoPrecipitation. Adv. Funct. Mater. 2009, 19, 718–725. [Google Scholar] [CrossRef]
- Cser, A.; Nagy, K.; Biczók, L. Fluorescence Lifetime of Nile Red as a Probe for the Hydrogen Bonding Strength with Its Microenvironment. Chem. Phys. Lett. 2002, 360, 473–478. [Google Scholar] [CrossRef]
- Matulis, D.; Lovrien, R. 1-Anilino-8-Naphthalene Sulfonate Anion-Protein Binding Depends Primarily on Ion Pair Formation. Biophys. J. 1998, 74, 422–429. [Google Scholar] [CrossRef] [PubMed]
- Pal, S.K.; Peon, J.; Zewail, A.H. Ultrafast Surface Hydration Dynamics and Expression of Protein Functionality: α-Chymotrypsin. Proc. Natl. Acad. Sci. USA 2002, 99, 15297–15302. [Google Scholar] [CrossRef] [PubMed]
- Deshpande, M.; Sathe, S.K. Interactions with 8-Anilinonaphthalene-1-sulfonic Acid (ANS) and Surface Hydrophobicity of Black Gram (Vigna Mungo) Phaseolin. J. Food Sci. 2018, 83, 1847–1855. [Google Scholar] [CrossRef]
- Ota, C.; Tanaka, S.; Takano, K. Revisiting the Rate-Limiting Step of the ANS–Protein Binding at the Protein Surface and Inside the Hydrophobic Cavity. Molecules 2021, 26, 420. [Google Scholar] [CrossRef]
- Abuin, E.B.; Lissi, E.A.; Aspée, A.; Gonzalez, F.D.; Varas, J.M. Fluorescence of 8-Anilinonaphthalene-1-Sulfonate and Properties of Sodium Dodecyl Sulfate Micelles in Water–Urea Mixtures. J. Colloid Interface Sci. 1997, 186, 332–338. [Google Scholar] [CrossRef]
- Martin, G.L.; Ross, J.A.; Minteer, S.D.; Jameson, D.M.; Cooney, M.J. Fluorescence Characterization of Chemical Microenvironments in Hydrophobically Modified Chitosan. Carbohydr. Polym. 2009, 77, 695–702. [Google Scholar] [CrossRef]
Disclaimer/Publisher’s Note: The statements, opinions and data contained in all publications are solely those of the individual author(s) and contributor(s) and not of MDPI and/or the editor(s). MDPI and/or the editor(s) disclaim responsibility for any injury to people or property resulting from any ideas, methods, instructions or products referred to in the content. |
© 2025 by the authors. Licensee MDPI, Basel, Switzerland. This article is an open access article distributed under the terms and conditions of the Creative Commons Attribution (CC BY) license (https://creativecommons.org/licenses/by/4.0/).