Abstract
Hydrogen leakage is a critical safety concern for high-pressure storage systems, where orifice geometry significantly influences dispersion and risk. Previous studies on leakage and diffusion have mostly focused on closed or semi-closed environments, while thorough exploration has been conducted on open and unshielded environments. This work compares three typical orifice types—circular, slit, and Y-type—through controlled experiments. Results show that circular orifices generate directional jets with steep gradients but relatively low concentrations, with a 1 mm case reaching only 0.725% at the jet core. Slit orifices exhibit more uniform diffusion; at 1 mm, concentrations ranged from 2.125% to 2.625%. Y-type orifices presented the highest hazard, with 0.5 mm leaks producing 2.9% and 1 mm cases approaching the 4% lower flammability limit within 375 s. Equilibrium times increased with orifice size, from 400–800 s for circular and slit leaks to up to 900 s for Y-type leaks, some of which failed to stabilize. Response behavior also varied: Y-type leaks achieved rapid multi-point responses (as short as 10 s), while circular and slit leaks responded more slowly away from the jet core. Overall risk ranking was circular < slit < Y-type, underscoring the urgent need for geometry-specific monitoring strategies, sensor layouts, and emergency thresholds to ensure safe hydrogen storage.
1. Introduction
With the rapid advancement of society, economy, and technology, global demand for energy continues to surge, making the development of efficient, low-carbon renewable energy systems an urgent priority [1,2,3,4]. Hydrogen energy, as a green and high-efficiency secondary energy source, boasts prominent advantages such as high calorific value, abundant reserves, and broad applicability [5,6,7,8]. At present, the global consumption is expected to rise to 530 million tons per year by 2050. Recognized as the most promising clean energy source in the 21st century, it plays a pivotal role in achieving the “carbon neutrality” goal [9,10,11,12]. Despite its enormous potential, the hydrogen energy industry faces two major bottlenecks: high hydrogen production costs and safety concerns [13,14,15]. While production costs are affected by various factors, hydrogen-related safety risks—particularly its flammability and susceptibility to leakage—have attracted the most attention [16,17,18]. Among various hydrogen storage technologies, high-pressure gaseous hydrogen storage is the most mature [19,20,21]. As the most effective and economical approach, it involves storing hydrogen in specialized high-pressure containers [22,23]. This method offers advantages like lower costs and faster refueling speeds, but it is accompanied by safety risks, especially in the event of hydrogen leakage from high-pressure storage tanks [24,25,26]. When exposed to high temperatures, hydrogen embrittlement, or external impacts, these tanks may leak, potentially triggering severe accidents such as fires or explosions [27,28]. Therefore, gaining a clear understanding of hydrogen leakage and diffusion behaviors is crucial for enhancing safety standards in the hydrogen energy sector.
Extensive research has been conducted to explore hydrogen leakage and diffusion under different scenarios. A.D. Birch et al. [29] pioneered the “pseudo-source” theory for pipeline leakage studies: they defined the cross-section where the jet contacts the atmospheric environment as a “pseudo-source” to replace the actual pipeline leak orifice. Based on mass flow conservation, correlation of gas state parameters under different conditions, and experimental data, they derived formulas for calculating key model parameters such as pseudo-source flow velocity and diameter, providing a theoretical basis for pipeline leakage and diffusion analysis. Stefano et al. [30] carried out experiments to investigate the effects of initial leakage conditions and obstacles on hydrogen leakage and diffusion. Their results showed that the initial leakage velocity had a more significant impact on hydrogen diffusion than the initial leakage position; additionally, hydrogen velocity decreased when it encountered obstacles during diffusion. Gupta et al. [31] conducted experiments on hydrogen leakage from hydrogen fuel cell vehicles (HFCVs) in small garages. For safety reasons, helium was used as a substitute for hydrogen, and the findings indicated that the peak hydrogen concentration in the garage was solely related to the total amount of leaked hydrogen. Lacome et al. [32] performed hydrogen leakage experiments with different mass flow rates in an 80 m3 room. When the room was isolated from the outside, the volume of the hydrogen–air mixture cloud depended only on the total leaked hydrogen (independent of leakage velocity), and the concentration of the cloud at the top remained stable after a certain period. Tamura et al. [33] conducted experiments on hydrogen leakage risks under forced ventilation conditions (with a hydrogen leakage rate of 2000 NL/min and a ventilation velocity of 10 m/s), confirming that forced ventilation could effectively reduce the accumulation of flammable gas clouds. Matsuura et al. [34] first studied the influence of natural ventilation on hydrogen leakage and diffusion in semi-confined spaces and further explored the effect of forced ventilation based on the initial findings. Some studies have employed Computational fluid dynamics (CFD) methods to investigate hydrogen leakage and diffusion behavior. CFD serves as an ideal tool for modeling the consequences of hydrogen-related incidents. CFD not only accurately simulates various physical phenomena during accidents but also depicts the complete geometry involved, which is crucial for subsequent consequence analysis. Considering hydrogen safety concerns, extensive CFD research has been conducted to thoroughly investigate the behavior and consequences following hydrogen releases. Mohammad et al. [35] proposed a CFD-based method to evaluate the diffusion behavior of hydrogen released from a hydrogen fuel cell vehicle within an enclosed area. Considering different ventilation conditions, fuel concentration distributions within the cabin are generated. Bauwens et al. [36] used numerical simulations to adjust warehouse size and leakage rate, investigating the concentration distribution of hydrogen after leakage in large warehouses. Wang et al. [37] validated the effects of parameters such as ventilation flow rate and ventilation area on flammable gas diffusion and explosion risks during hydrogen leakage from hydrogen production containers through CFD simulations and proposed and verified the concept of critical ventilation flow rate. Malakhov et al. [38] simulated underground mining tunnel scenarios using containers equipped with ventilation ducts, obtaining the hydrogen concentration distribution inside the containers. For transportation-related scenarios, Soto et al. [39] focused on ships, analyzing hydrogen leakage and diffusion in shipborne hydrogen storage systems, and found that vortex recirculation zones affected the accumulation of flammable gas clouds (FGCs). Gao et al. [40] combined HFCVs with ships, studying hydrogen diffusion distributions at different leakage positions in ship cabins during HFCV transportation. Their results revealed that the leakage position directly affected the risk level, with the hazard significantly increasing as the leakage position moved toward the rear of the cabin. Overall, existing studies on hydrogen leakage and diffusion primarily focus on confined or semi-confined scenarios, such as hydrogen refueling stations, HFCVs, hydrogen refueling machines, and ships [41,42,43,44,45,46]. However, research on hydrogen diffusion in open, unshielded environments remains scarce. Rising storage pressures keep hydrogen leaks in open environments a serious safety risk [47]. Research remains limited on spatial distributions and time evolution of concentrations under varying leakage conditions—pressure, orifice diameter, orifice shape. To close this gap, this study examines leakage and diffusion from high-pressure storage in an open-top warehouse. This paper supplements the data on the spatial distribution and concentration of hydrogen gas over time under different leakage conditions, including in enclosed spaces and semi-open spaces. This provides data for subsequent theoretical analysis and simulation-based research on hydrogen gas leakage. Objectives: determine spatial concentration fields and time histories in this open volume; quantify how leakage pressure, orifice diameter, and orifice geometry govern dispersion. The findings inform safety design and risk assessment for high-pressure hydrogen facilities in open settings. Figure 1 shows the schematic diagram of this paper.
Figure 1.
The schematic diagram of this article.
2. Hydrogen Leakage and Diffusion Test
To satisfy the requirements for system purging and inerting, remote monitoring and data acquisition, and real-time hydrogen leak detection and mitigation, we deployed a supporting gas-supply piping network, a measurement–control and video recording system, a hydrogen safety monitoring system, and a fire-protection system. The system configuration and associated retrofits are summarized as follows.
2.1. Hydrogen Leakage and Diffusion Test System
Hydrogen leak-and-dispersion experimental system comprises a gas supply unit, a leak-simulation device, a data acquisition (DAQ) system, and a nitrogen-based fire-suppression unit. The hydrogen source is connected to the leak-simulation device, while signals are recorded and analyzed via the DAQ to investigate equipment conditions under hydrogen service and the characteristics of hydrogen leakage across operating scenarios. The system layout is shown in Figure 2a, and test site in Figure 2b.
Figure 2.
(a) Hydrogen leak diffusion test system configuration diagram; (b) Test site diagram. Description: 1—gas cylinder pressure reducing valve, 2—air release control valve, 3—air release stop valve, 4—pressure gauge, 5—main line stop valve, 6—main line gas control valve, 7—hydrogen leakage simulation device, 8—nitrogen fire ring, 9—nitrogen fire gas control valve, 10—hydrogen concentration sensor array, 11—hydrogen concentration host controller, 12—camera, 13—measurement and control as well as video surveillance system.
Hydrogen line: The distribution manifold supplies hydrogen and nitrogen at the pressures required for testing. Hydrogen from the manifold passes through pressure transducer 4 and the remotely actuated pneumatic valve 6 before reaching the hydrogen leak-simulation device 7. The leak-simulation device consists of a cylindrical pressure vessel (internal diameter 50 mm; height 320 mm) equipped with interchangeable nozzles mounted on the end face of the vessel. The gas circuit also includes a blowdown branch via vent valve 2 to depressurize the system in the event of a mechanical failure in the main line (indicated by the thick black line), thereby facilitating safe disassembly and maintenance. The actuation gas for hydrogen valve 6 is supplied by a 40 L, 12 MPa nitrogen cylinder.
Nitrogen line: Nitrogen from the distribution manifold flows through pneumatic valve 9 to a nitrogen fire-suppression ring 8 that surrounds the hydrogen leak-simulation device 7. In the event of a fire, valve 9 can be actuated remotely to discharge nitrogen for extinguishment.
Monitoring system comprises sensors, actuators, data acquisition and supervisory control units, and a remote computer interface. It records hydrogen concentration, pipeline pressure, and wind speed/direction within the test site. After processing, the data are transmitted via Ethernet for display and supervisory control on the remote computer.
2.2. Gas Distribution System
Hydrogen leak diffusion test requires high-pressure hydrogen for gas leak simulation and nitrogen as a fire suppression gas. A gas supply pipeline system is provided, with the flow diagram shown in Figure 3a below.
Figure 3.
(a) Gas supply pipeline system flowchart; (b) On-site photograph of the gas distribution console; (c) Pressure vessels and nitrogen fire rings.
Gas-supply piping system comprises shut-off valves, pressure-reducing valves (PRVs), safety relief valves (SRVs), pressure gauges, and stainless-steel tubing. It is divided into a nitrogen line and a hydrogen line, both routed from the cryogenic-plant fire-exposure test stand. The nitrogen line is approximately 100 m in total length. A safety relief valve A1 provides over-pressure protection, and a pressure-reducing valve R1 regulates the outlet pressure. Pressure gauges are installed both upstream and downstream of the PRV. The hydrogen line is also about 100 m long. A safety relief valve A2 serves for over-pressure venting, while pressure-reducing valve R2 controls the outlet pressure. Pressure gauges are installed on both sides of the PRV. A site photograph is provided in Figure 3b. All hydrogen transfer lines use German-made MAXIMATOR tubing (3/8-in OD, 316 stainless steel) (MAXIMATOR GmbH, Nordhausen, Germany) rated for a maximum working pressure up to 150 MPa. Pneumatic valves are German-made MAXIMATOR units fitted with solenoid pilots, enabling remote actuation and control. Manual valves are likewise MAXIMATOR shut-off valves, offering high reliability.
2.3. Remote Monitoring, Control, and Video System
An integrated system acquires and transmits key parameters—including hydrogen concentration, venting pressure, and wind speed/direction—and remotely issues solenoid-valve commands to start/stop hydrogen leak containment and to actuate nitrogen discharge from the fire suppression system. In parallel, the video subsystem continuously monitors site conditions to ensure rapid detection and handling of on-site emergencies. All back-end equipment—storage and display devices, communication cabinets, and G652 single-mode optical-fiber switches (DiCon Fiberoptics, Richmond, VA, USA)—is centralized in the remote control center.
2.4. Hydrogen Leakage Simulation Device
The hydrogen leakage simulation device consists of a cylindrical pressure vessel (with an inner diameter of 50 mm and a height of 320 mm), and interchangeable nozzles are installed on its end faces (Figure 3c). Vessel is fabricated from 304 stainless steel with a wall thickness of 25 mm and is rated to meet the pressure requirements of the tests. The right end of the vessel is connected to the gas supply line, while the left end is coupled to the interchangeable nozzle. During operation, high-pressure gas inside the vessel discharges through the left-side nozzle, and the supply line on the right continuously replenishes the vessel to maintain a constant internal pressure. An M20 × 1.5 threaded boss is welded to the top of the vessel for mounting a pressure transducer, enabling real-time monitoring of the internal pressure.
2.5. Nitrogen Fire Protection System
The nitrogen fire suppression system is primarily used to rapidly discharge large volumes of nitrogen gas when hydrogen leaks or fires occur on-site, thereby reducing hydrogen and oxygen concentrations. The system draws high-pressure nitrogen from the nitrogen supply pipeline, which is controlled by pneumatic valves to activate the nitrogen fire suppression ring and deliver nitrogen discharge to the test system.
2.6. Hydrogen Concentration Monitoring System
The hydrogen concentration monitoring system mainly uses front-end hydrogen concentration sensors to monitor hydrogen levels. Generated output signals are sampled and transmitted into the data monitoring system, then relayed via fiber optic cables to the rear-end control room for real-time monitoring and recording of hydrogen concentrations. Sensor installation location is shown in Figure 4d.
Figure 4.
(a) Hydrogen concentration sensor installation location; (b) Sensor installation location; (c) Shree-view drawings of the sensor; (d) Three-view drawings of hydrogen concentration sensor.
3. Experimental Procedures
Prior to the hydrogen release test, the supply pressure of the nitrogen fire protection system was set to 0.7 MPa by adjusting valve V1. Subsequently, valve AV5 was opened, and the pressure of the system was regulated to 3 MPa using the pressure-reducing valve R2. Finally, valve AV6 was opened. A replaceable nozzle corresponding to the specific test condition was installed onto the pressure vessel. After installation, valves AV3 and AV5 were manually opened in sequence. Next, valve AV2 was opened, and the outlet pressure of pressure-reducing valve R1 was adjusted to 0.2 MPa above the target working pressure. At this stage, valve 6 was remotely operated to initiate hydrogen release. Once the system pressure stabilized, the pressure reading was recorded, and valve 6 was closed. Based on the recorded value, the pressure of R1 was further adjusted. This process was repeated until the post-release pressure stabilized at the target working value. Finally, all hydrogen concentration sensors were monitored. Once all sensor readings returned to zero, a 3-min waiting period was observed. Valve 6 was then reopened, data recording commenced, and the experiment officially began.
As illustrated in Figure 4a–c, hydrogen concentration sensors were arranged within a 5 m × 4 m × 3 m volume centered around the leakage nozzle, which served as the region of interest. Unlike the outdoor small-scale tests, the indoor experiments were conducted in a larger enclosed space measuring 12 m × 6 m × 6 m. In this setup, the hydrogen jet does not interact with walls, thus avoiding wall reflection and subsequent diffusion. As a result, placing sensors behind the jet nozzle would likely fail to capture significant hydrogen concentration signals. Therefore, the sensors were strategically placed in the half-space located in front of the jet nozzle. Given that the space is a regular rectangular cuboid and exhibits axial symmetry, the hydrogen sensors were deployed in the right half of the jet direction. The entire 5 m × 4 m × 3 m sensing volume was centrally located within the 12 m × 6 m × 6 m room, with the jet nozzle positioned 1.5 m above the ground.
The outdoor test site is an open-air space enclosed by explosion-proof walls, with dimensions of 5 m × 4 m × 3 m. Leakage nozzle is located 1.5 m above the ground and positioned at the center of the space in the horizontal direction. Since the space is a regular cuboid and has axial symmetry, hydrogen concentration sensors were arranged in the right half-space along the jet direction. At a distance of 1 m perpendicular to the jet direction, two layers of three groups of hydrogen concentration sensors (a total of six) were evenly arranged to monitor the hydrogen concentration distribution within the test site.
4. Results and Discussion
4.1. Indoor Hydrogen Leakage and Diffusion Test
4.1.1. Circular Hole Leakage Test
At 3 MPa through circular orifices, detection at 1 m perpendicular to the jet axis was negligible, but relocating sensors to 0.25 m revealed clear size-dependent behavior (Figure 5): for 0.1 mm, only the near-source sensors responded, reaching a quasi-steady state by approximately 400 s with equilibrium concentrations of approximately 0.10% at No. 6 and 0.025% at No. 5, and response times of about 120 s (No. 6) and 30 s (No. 5). For 0.5 mm, concentrations stabilized by approximately 500 s with No. 6 highest at 0.225%, followed by No. 5 (0.125%), No. 4 (0.10%), and No. 2 (0.0825%); responses ranged from 23 s (No. 5) to 248 s (No. 2). For 1 mm, all positions reached quasi-equilibrium by approximately 800 s, with the highest levels at Nos. 6 and 1 (0.725%), then No. 2 (0.625%), No. 4 (0.60%), No. 5 (0.55%), and No. 3 (0.45%); response times spanned 77–146 s (77 s at No. 5; 87 s at Nos. 1–2; 102 s at Nos. 4 and 6; 146 s at No. 3). Larger orifices produced higher concentrations and broader spatial responses, while the time to quasi-steady increased from approximately 400 s (0.1 mm) to 500 s (0.5 mm) to 800 s (1 mm).
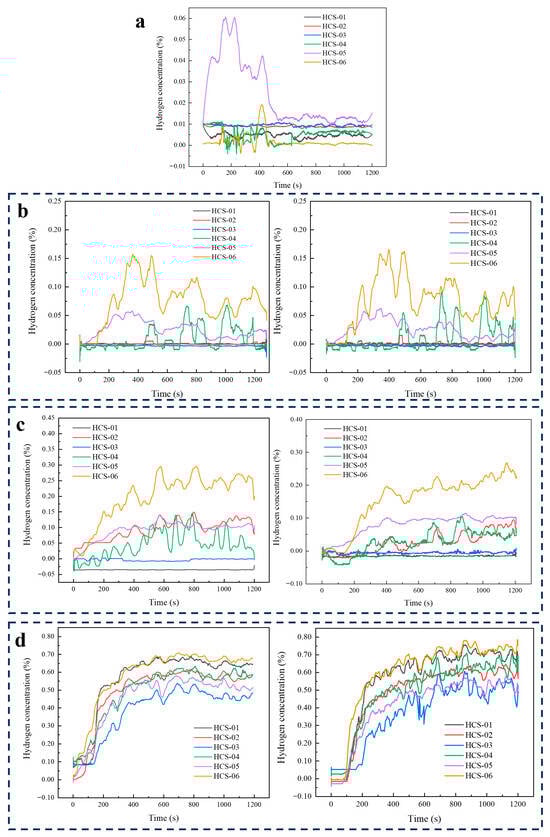
Figure 5.
(a) Round hole 0.1 mm, concentration curve under 3 MPa operating conditions (initial installation position); (b) Round hole 0.1 mm, concentration curve under 3 MPa operating conditions. (c) Round hole 0.5 mm, concentration curve under 3 MPa operating conditions; (d) Round hole 1 mm, concentration curve under 3 MPa operating conditions.
4.1.2. Slit-Type Leakage Hole Test
At 3 MPa with slit-type orifices, moving from 0.25 to 0.5 to 1.0 mm produced higher concentrations and slightly longer times to quasi-equilibrium (about 600, 650, and 800 s, respectively; Figure 6). For 0.25 mm, the field stabilized near 600 s with No. 1 highest (~1.40%), followed by No. 3 (~1.20%), Nos. 2 and 6 (~1.00%), and Nos. 4 and 5 (~0.80–0.90%); response times spanned 30–110 s (fastest at No. 1). For 0.5 mm, quasi-steady was reached at ~650 s, led by Nos. 1 (~1.48%) and 3 (slightly lower), then Nos. 6 and 2 (~1.30%), with Nos. 4 and 5 ~0.96%; responses were 35–75 s. For 1.0 mm, stability occurred by ~800 s with maxima at No. 6 (~2.984%) and near-peaks at Nos. 1 and 2 (~2.678%), followed by Nos. 3 and 4 (~2.375%) and No. 5 (~2.125%); responses ranged from 44 to 170 s. Overall, wider slits yielded higher area-wide concentrations and broader spatial response, while the approach to quasi-steady became progressively slower.
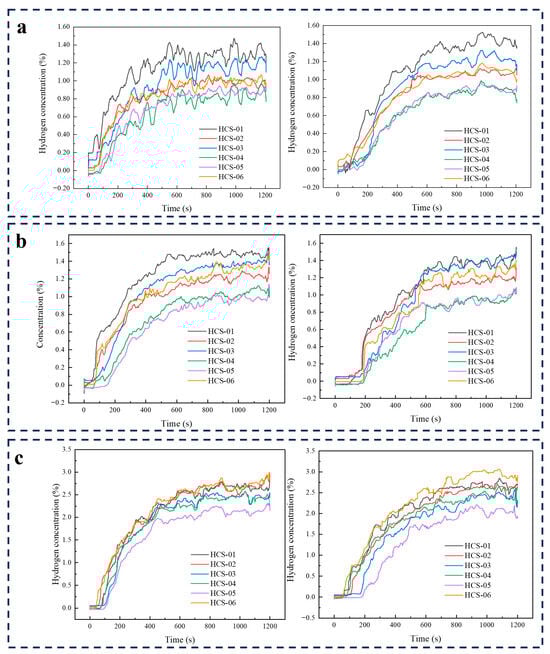
Figure 6.
Slit-orifice leakage at 3 MPa—concentration–time curves: (a) 0.25 mm, (b) 0.5 mm, (c) 1.0 mm.
4.1.3. Y-Type Leakage Hole Test
At 3 MPa with Y-type orifices, the leakage showed rapid buildup and higher concentration levels compared to circular and slit holes, with quasi-steady states generally reached between 750 and 800 s, or tests halted due to nearing the lower explosive limit (Figure 7). For 0.1 mm, concentrations stabilized after ~800 s, with Nos. 1 and 6 highest (~2.643%), followed by No. 2 (~2.519%), No. 5 (~2.675%), and Nos. 3 and 4 (~2.27% and ~2.249%). Response times ranged from 51–90 s, earliest at No. 6 (51 s) and latest at No. 3 (90 s). For 0.5 mm, equilibrium occurred by ~750 s, with No. 1 highest (~3.406%), then No. 3 (~3.187%), and Nos. 2, 5, and 6 near ~3.089%; No. 4 was lowest at ~2.873%. Response times were faster, 19–62 s, with No. 1 first at 19 s. For 1 mm, concentrations rose quickly toward the 4% LEL, so the test ended before steady state; No. 1 peaked at ~3.501%, Nos. 2 and 6 at ~3.388%, and No. 4 at ~2.767%. Responses were rapid, within 15–30 s, led by No. 1 (15 s). Overall, Y-type orifices produced the highest concentrations, fastest responses, and greatest hazard potential, with larger sizes approaching flammable limits in under 900 s.
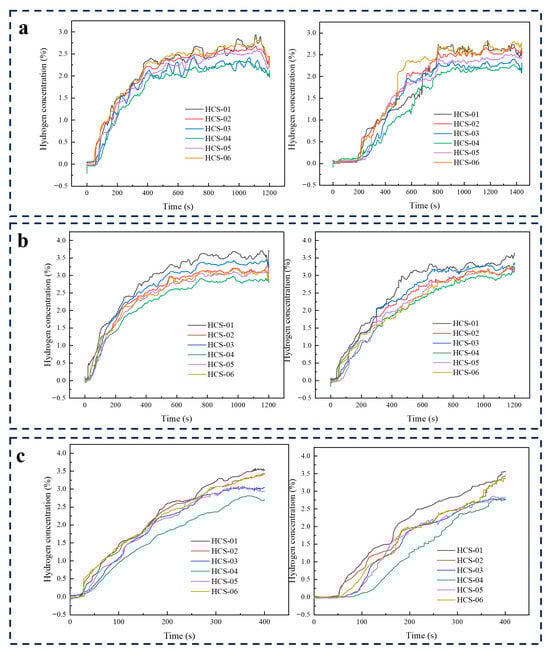
Figure 7.
Y-Type concentration curves at a working pressure of 3 MPa for different specifications: (a) results for the 0.1 mm specification; (b) results for the 0.5 mm specification; (c) results for the 1.0 mm specification.
4.2. Outdoor Hydrogen Leakage and Diffusion Test
4.2.1. Round Hole (0.5 mm, 3 MPa)
When the leakage orifice was a 0.5 mm circular hole and the leakage pressure was 3 MPa, the temporal variations of hydrogen concentration are shown in Figure 8. The response times of all sensors ranged from 8 to 16 s. Sensors No. 1 and No. 5 responded the fastest (≈8 s), followed by sensors No. 2 and No. 3 (≈10 s), while sensors No. 4 and No. 6 responded at about 16 s. Due to the small orifice size, the leakage rate was relatively low, resulting in lower overall concentration levels. The concentration profiles were strongly affected by natural outdoor wind, showing considerable fluctuations. The highest average concentration was observed at sensor No. 5 (≈0.209%), followed by sensor No. 6 (≈0.166%). Sensor No. 4 showed smaller fluctuations, with an average of ≈0.113%. Sensors No. 1, 2, and 3 stabilized at similar levels of ≈0.068%.
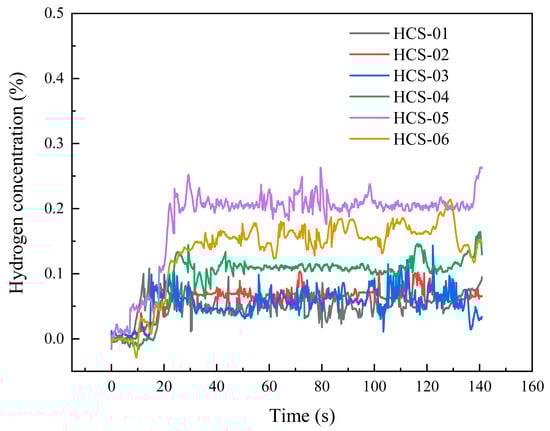
Figure 8.
Circular hole 0.5 mm, concentration curve under 3 MPa operating conditions.
4.2.2. Slit (0.5 mm, 3 MPa)
When the leakage orifice was a 0.5 mm slit and the leakage pressure was 3 MPa, the temporal variation of hydrogen concentration in the outdoor test space is shown in Figure 9. The response times of hydrogen concentration at all sensor positions ranged from 6 to 25 s. Sensor No. 3 responded the fastest, at about 6 s, followed by sensor No. 2. Sensors No. 1 and No. 6 had nearly identical response times of about 13 s. The response time of sensor No. 5 was about 18 s, while that of sensor No. 4 was 25 s. Due to the influence of natural outdoor wind, the concentration curves still fluctuated considerably. Among them, sensor No. 3 showed the highest average concentration and the fastest growth, fluctuating around 2.381%. Sensor No. 6 exhibited the largest fluctuations, with an average concentration of about 1.201%. Sensor No. 1 fluctuated around 1.346%, while sensor No. 2 averaged around 1.736%. At sensor No. 4, the average concentration was about 0.438%, with large fluctuations. Sensor No. 5 also showed strong fluctuations, with an average concentration of around 0.174%.
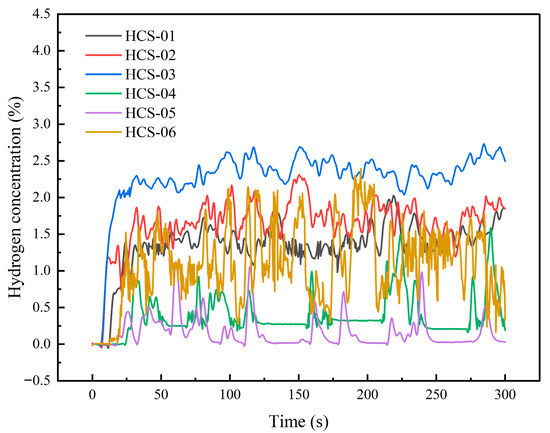
Figure 9.
Concentration curve under operating conditions with a 0.5 mm slit and 3 MPa pressure.
4.2.3. Y-Type (0.5 mm, 3 MPa)
When the leakage port is a 0.5 mm Y-type opening and the leakage pressure is 3 MPa, the outdoor test hydrogen spatial concentration curve over time is shown in Figure 10. Compared to circular holes and slit-type leakage ports, the concentration curve for the Y-type port exhibits significantly less fluctuation. Among these, Position 6 shows the highest average concentration and the fastest growth rate, fluctuating around 2.704%. Position 5 exhibited the second-highest average concentration at approximately 2.315%. Positions 1 and 4 showed similar average concentrations around 1.829%, though Position 4 exhibited greater fluctuation. Positions 2 and 3 also had comparable average concentrations, with Position 3 displaying greater fluctuation; both averaged around 0.898%.
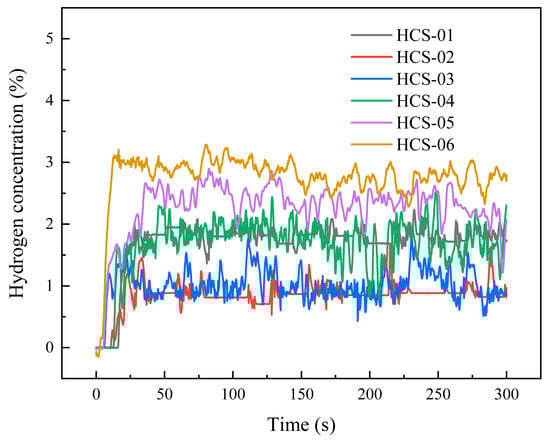
Figure 10.
Concentration curve for Y-type 0.5 mm under 3 MPa operating conditions.
5. Conclusions and Perspectives
To investigate the influence of different leakage orifice geometries on the diffusion characteristics of hydrogen release from high-pressure storage systems, and to clarify their differences in concentration distribution, temporal response, and safety risks, comparative experiments were conducted for three typical orifice shapes: circular, slit, and Y-type. The following summarizes the observed diffusion patterns and key findings, which may provide reference for the safety design and risk prevention of hydrogen storage systems:
- (1)
- The geometry of leakage orifices markedly affects hydrogen concentration distribution. Circular orifices create directional jets with steep gradients and lower concentrations (e.g., 0.725% at 1 mm, sensor No. 6 vs. 0.45% at No. 3). Slit orifices yield orientation-dependent but more uniform diffusion, with concentrations rising to 2.625% at 1 mm. Y-type orifices generate multi-directional dispersion with the highest levels, reaching 2.9% at 0.5 mm and approaching the 4% LEL within 375 s at 1 mm. Their flow-splitting effect smooths gradients across positions but greatly elevates safety risks.
- (2)
- Equilibrium times increased with orifice size, but at different rates: circular orifices doubled from 400 s (0.1 mm) to 800 s (1 mm), slit orifices rose more slowly (600–800 s), while Y-type orifices required the longest times (900 s at 0.5 mm, with some 1 mm cases not reaching steady state). Response times for circular and slit orifices depended on distance from the jet core, whereas Y-type orifices showed overall shorter and more uniform responses (e.g., 10 s at 0.5 mm), reflecting rapid multi-directional dispersion.
- (3)
- Safety risks varied significantly with orifice geometry. Circular orifices produced the lowest concentrations (0.725% at 1 mm), offering greater margins; slit orifices reached higher levels (2.625% at 1 mm, about two-thirds of the LEL); and Y-type orifices posed the greatest hazard, with 2.9% at 0.5 mm and some 1 mm cases approaching the 4% LEL within minutes, requiring strict controls.
Experiments confirm that leakage orifice geometry critically shapes hydrogen dispersion. Circular orifices form directional jets with lower concentrations, slits yield orientation-dependent but more uniform diffusion, while Y-type orifices cause multi-directional spread with the highest risks. Equilibrium concentrations rise with orifice size, especially for Y-type leaks, linking structural complexity to hazard. These results call for geometry-specific safety strategies and future work on complex morphologies, realistic conditions, and intelligent monitoring to enhance the intrinsic safety of hydrogen systems.
Author Contributions
Conceptualization, Y.L. and L.J.; methodology, S.Z.; formal analysis, M.Y.; resources, Y.L.; data curation, L.J.; writing—original draft preparation, Y.W.; writing—review and editing, J.W. and L.J. All authors have read and agreed to the published version of the manuscript.
Funding
This research was supported by the Science and Technology Project of Special Equipment Safety Supervision and Inspection Institute of Jiangsu Province (KJ(Y)202416), and the Fundamental Research Funds for the Central Universities (No. 226-2025-00076).
Data Availability Statement
The original contributions presented in this study are included in the article. Further inquiries can be directed to the corresponding author.
Conflicts of Interest
The authors declare no conflict of interest.
Abbreviations
The following abbreviations are used in this manuscript:
| DAQ | data acquisition |
| FGCs | flammable gas clouds |
| HFCV | hydrogen fuel cell vehicles |
| PRVs | pressure-reducing valves |
| SRVs | safety relief valves |
References
- Boettcher, S.W. Introduction to Green Hydrogen. Chem. Rev. 2024, 124, 13095–13098. [Google Scholar] [CrossRef] [PubMed]
- Lyu, S.; Huang, X.; Peng, S.; Sun, M.; Qi, Q.; Aimaieraili, D. A novel method for analyzing the leakage and diffusion of hydrogen: First arrival time distribution. Renew. Sustain. Energy Rev. 2024, 198, 114451. [Google Scholar] [CrossRef]
- An, R.H.; Luo, S.F.; Zhou, H.S.; Zhang, Y.T.; Zhang, L.G.; Hu, H.L.; Li, P.X. Effects of hydrogen-rich water combined with vacuum precooling on the senescence and antioxidant capacity of pakchoi. Sci. Hortic. 2021, 289, 110469. [Google Scholar] [CrossRef]
- Anekwe, I.M.S.; Mustapha, S.I.; Akpasi, S.O.; Tetteh, E.K.; Joel, A.S.; Isa, Y.M. The hydrogen challenge: Addressing storage, safety, and environmental concerns in hydrogen economy. Int. J. Hydrogen Energy 2025, 167, 150952. [Google Scholar] [CrossRef]
- Wu, J.K.; Chen, S.; Yu, M.; Zhang, X.J.; Jiang, L. Techno-economic analysis on low-temperature and high-pressure cryo-adsorption hydrogen storage. Fuel 2025, 381, 133532. [Google Scholar] [CrossRef]
- Xu, X.; Xu, H.; Zheng, J.; Chen, L.; Wang, J. A high-efficiency liquid hydrogen storage system cooled by a fuel-cell-driven refrigerator for hydrogen combustion heat recovery. Energy Convers. Manag. 2020, 226, 113496. [Google Scholar] [CrossRef]
- Cui, W.; Yuan, Y.; Tong, L.; Shen, B. Numerical simulation of hydrogen leakage diffusion in seaport hydrogen refueling station. Int. J. Hydrogen Energy 2023, 48, 24521–24535. [Google Scholar] [CrossRef]
- Laghlimi, C.; Moutcine, A.; Ziat, Y.; Belkhanchi, H.; Koufi, A.; Bouyassan, S. Hydrogen, Chronology and Electrochemical Production. Solar Energy Sustain. Dev. J. 2024, 14, 22–37. [Google Scholar] [CrossRef]
- Lv, H.; Shen, Y.; Zheng, T.; Zhou, W.; Ming, P.; Zhang, C. Numerical study of hydrogen leakage, diffusion, and combustion in an outdoor parking space under different parking configurations. Renew. Sustain. Energy Rev. 2023, 173, 113093. [Google Scholar] [CrossRef]
- Huang, X.W.; Sun, W.; Li, Z.H.; Shi, J.Y.; Zhang, N.; Zhang, Y.; Zhai, X.D.; Hu, X.T.; Zou, X.B. Hydrogen sulfide gas sensing toward on-site monitoring of chilled meat spoilage based on ratio-type fluorescent probe. Food Chem. 2022, 396, 133654. [Google Scholar] [CrossRef] [PubMed]
- Liang, J.; Li, H.; Chen, L.; Ren, M.; Fakayode, O.A.; Han, J.; Zhou, C. Efficient hydrogen evolution reaction performance using lignin-assisted chestnut shell carbon-loaded molybdenum disulfide. Ind. Crops Prod. 2023, 193, 116214. [Google Scholar] [CrossRef]
- Li, X.; Liu, Z.; Shao, S.; Yu, Y.; Wang, W.; Sun, T.; Wu, S. A Ca-modified Ni/CeO2·Al2O3 bifunctional catalyst for two-stage steam reforming of biomass pyrolysis oil for hydrogen production. Ind. Crops Prod. 2025, 228, 120891. [Google Scholar] [CrossRef]
- Li, H.H.; Geng, W.H.; Sun, X.; Wei, W.Y.; Mu, X.F.; Ahmad, W.; Hassan, M.M.; Ouyang, Q.; Chen, Q.S. Fabricating a nano-bionic sensor for rapid detection of HS during pork spoilage using Ru NPs modulated catalytic hydrogenation conversion. Meat Sci. 2021, 177, 108507. [Google Scholar] [CrossRef]
- Yang, F.; Wang, T.; Deng, X.; Dang, J.; Huang, Z.; Hu, S.; Li, Y.; Ouyang, M. Review on hydrogen safety issues: Incident statistics, hydrogen diffusion, and detonation process. Int. J. Hydrogen Energy 2021, 46, 31467–31488. [Google Scholar] [CrossRef]
- Xiao, J.; Xu, N.; Cai, W.; Zhou, X.; Bénard, P.; Chahine, R.; Tong, L.; Yang, T. Thermodynamic and heat transfer models for refueling hydrogen vehicles: Formulation, validation and application. Int. J. Hydrogen Energy 2024, 52, 172–190. [Google Scholar] [CrossRef]
- Yang, N.; Deng, J.; Wang, C.; Bai, Z.; Qu, J. High pressure hydrogen leakage diffusion: Research progress. Int. J. Hydrogen Energy 2024, 50, 1029–1046. [Google Scholar] [CrossRef]
- Qin, C.; Tian, Y.; Yang, Z.; Hao, D.; Feng, L. Quantitative analysis of hydrogen leakage flow measurement and calculation in the on-board hydrogen system pipelines. Int. J. Hydrogen Energy 2024, 89, 1025–1039. [Google Scholar] [CrossRef]
- Wang, X.; Gao, W. Hydrogen leakage risk assessment for hydrogen refueling stations. Int. J. Hydrogen Energy 2023, 48, 35795–35808. [Google Scholar] [CrossRef]
- Shu, Z.; Liang, W.; Zheng, X.; Lei, G.; Cao, P.; Dai, W.; Qian, H. Dispersion characteristics of hydrogen leakage: Comparing the prediction model with the experiment. Energy 2021, 236, 121420. [Google Scholar] [CrossRef]
- Ji, Q.H.; Yu, X.J.; Chen, L.; Yarley, O.P.N.; Zhou, C.S. Facile preparation of sugarcane bagasse-derived carbon supported MoS2 nanosheets for hydrogen evolution reaction. Ind. Crops Prod. 2021, 172, 114064. [Google Scholar] [CrossRef]
- Shi, T.; Xiong, Z.Y.; Jin, W.G.; Yuan, L.; Sun, Q.C.; Zhang, Y.H.; Li, X.T.; Gao, R.C. Suppression mechanism of L-arginine in the heat-induced aggregation of bighead carp (Aristichthys nobilis) myosin: The significance of ionic linkage effects and hydrogen bond effects. Food Hydrocolloid 2020, 102, 105596. [Google Scholar] [CrossRef]
- Wu, J.K.; Xie, R.Y.; Yu, M.; Luo, C.Y.; Wang, B.; Zhang, X.J.; Jiang, L. Techno-economic analysis on the performance of hydrogen adsorbents in the vacuum layer of cryogenic liquid storage tank. Int. J. Hydrogen Energy 2024, 88, 132–141. [Google Scholar] [CrossRef]
- Ahmed, S.; Xin, H.; Faheem, M.; Qiu, B.J. Stability Analysis of a Sprayer UAV with a Liquid Tank with Different Outer Shapes and Inner Structures. Agriculture 2022, 12, 379. [Google Scholar] [CrossRef]
- Avdeenkov, A.V.; Bessarabov, D.G.; Zaryugin, D.G. Passive electrochemical hydrogen recombiner for hydrogen safety systems: Prospects. Nucl. Sci. Tech. 2023, 34, 89. [Google Scholar] [CrossRef]
- Bi, Y.; Wu, Q.; Wang, S.; Shi, J.; Cong, H.; Ye, L.; Gao, W.; Bi, M. Hydrogen leakage location prediction at hydrogen refueling stations based on deep learning. Energy 2023, 284, 129361. [Google Scholar] [CrossRef]
- Zhai, X.D.; Li, Z.H.; Shi, J.Y.; Huang, X.W.; Sun, Z.B.; Zhang, D.; Zou, X.B.; Sun, Y.; Zhang, J.J.; Holmes, M.; et al. A colorimetric hydrogen sulfide sensor based on gellan gum-silver nanoparticles bionanocomposite for monitoring of meat spoilage in intelligent packaging. Food. Chem. 2019, 290, 135–143. [Google Scholar] [CrossRef] [PubMed]
- Wang, Z.; Xie, R.; Yin, B.; Shi, H.; Yu, X.; Lin, Y.; Li, J. Study of the effects of leakage volume and blockage ratio on the liquid hydrogen leakage diffusion behavior in a tunnel. Int. J. Hydrogen Energy 2025, 145, 322–331. [Google Scholar] [CrossRef]
- Shoushtari, S.; Jafari, A.; Namdar, H.; Khoozan, D. Modeling, qualification, and quantification of hydrogen leakage in multilayered reservoirs. Int. J. Hydrogen Energy 2024, 91, 636–648. [Google Scholar] [CrossRef]
- Birch, A.D.; Brown, D.R.; Dodson, M.G.; Swaffield, F. The Structure and Concentration Decay of High Pressure Jets of Natural Gas. Combust. Sci. Technol. 2007, 36, 249–261. [Google Scholar] [CrossRef]
- De Stefano, M.; Rocourt, X.; Sochet, I.; Daudey, N. Hydrogen dispersion in a closed environment. Int. J. Hydrogen Energy 2019, 44, 9031–9040. [Google Scholar] [CrossRef]
- Gupta, S.; Brinster, J.; Studer, E.; Tkatschenko, I. Hydrogen related risks within a private garage: Concentration measurements in a realistic full scale experimental facility. Int. J. Hydrogen Energy 2009, 34, 5902–5911. [Google Scholar] [CrossRef]
- Lacome, J.M.; Jamois, D.; Perrette, L.; Proust, C.H. Large-scale hydrogen release in an isothermal confined area. Int. J. Hydrogen Energy 2011, 36, 2302–2312. [Google Scholar] [CrossRef]
- Tamura, Y.; Takeuchi, M.; Sato, K. Effectiveness of a blower in reducing the hazard of hydrogen leaking from a hydrogen-fueled vehicle. Int. J. Hydrogen Energy 2014, 39, 20339–20349. [Google Scholar] [CrossRef]
- Matsuura, K.; Nakano, M.; Ishimoto, J. Acceleration of hydrogen forced ventilation after leakage ceases in a partially open space. Int. J. Hydrogen Energy 2012, 37, 7940–7949. [Google Scholar] [CrossRef]
- Dadashzadeh, M.; Ahmad, A.; Khan, F. Dispersion modelling and analysis of hydrogen fuel gas released in an enclosed area: A CFD-based approach. Fuel 2016, 184, 192–201. [Google Scholar] [CrossRef]
- Bauwens, C.R.; Dorofeev, S.B. CFD modeling and consequence analysis of an accidental hydrogen release in a large scale facility. Int. J. Hydrogen Energy 2014, 39, 20447–20454. [Google Scholar] [CrossRef]
- Wang, T.; Huang, T.; Hu, S.; Li, Y.; Yang, F.; Ouyang, M. Simulation and risk assessment of hydrogen leakage in hydrogen production container. Int. J. Hydrogen Energy 2023, 48, 20096–20111. [Google Scholar] [CrossRef]
- Malakhov, A.A.; Avdeenkov, A.V.; du Toit, M.H.; Bessarabov, D.G. CFD simulation and experimental study of a hydrogen leak in a semi-closed space with the purpose of risk mitigation. Int. J. Hydrogen Energy 2020, 45, 9231–9240. [Google Scholar] [CrossRef]
- Soto, V.; Baalisampang, T.; Arzaghi, E.; Garaniya, V. Numerical modelling of hydrogen release and dispersion in under-deck compressed hydrogen storage of marine ships. Int. J. Hydrogen Energy 2024, 59, 1244–1256. [Google Scholar] [CrossRef]
- Xie, Y.; Liu, J.; Qin, J.; Xu, Z.; Zhu, J.; Liu, G.; Yuan, H. Numerical simulation of hydrogen leakage and diffusion in a ship engine room. Int. J. Hydrogen Energy 2024, 55, 42–54. [Google Scholar] [CrossRef]
- Wang, X.; Zhang, C.; Gao, W. Risk assessment of hydrogen leakage in diesel hydrogenation process. Int. J. Hydrogen Energy 2022, 47, 6955–6964. [Google Scholar] [CrossRef]
- Qian, J.-Y.; Li, X.-J.; Gao, Z.-X.; Jin, Z.-J. A numerical study of hydrogen leakage and diffusion in a hydrogen refueling station. Int. J. Hydrogen Energy 2020, 45, 14428–14439. [Google Scholar] [CrossRef]
- Duan, Q.; Xin, J.; Zhang, H.; Hou, Z.; Duan, P.; Jin, K.; Li, M.; Sun, J. Hydrogen leakage in underground garages: Impact of leakage locations on gas diffusion and safety considerations. J. Energy Storage 2025, 117, 116123. [Google Scholar] [CrossRef]
- Wang, L.; Lyu, X.; Zhang, J.; Liu, F.; Li, X.; Qiu, X.; Song, Q.; Lin, J.; Ma, T. Analysis of hydrogen leakage behavior and risk mitigation measures in a hydrogen refueling station. Int. J. Hydrogen Energy 2024, 83, 545–552. [Google Scholar] [CrossRef]
- Niu, Y.; Ma, Z.; Jiang, B.; Li, P.; Zuo, J.; Kou, Y.; Liang, G. Experimental study on high-pressure hydrogen leakage and diffusion in full-scale hydrogen refueling stations. Int. J. Hydrogen Energy 2025, 135, 351–360. [Google Scholar] [CrossRef]
- Wang, J.; Guo, X.; Zhao, Q.H.; Chen, R.; Li, G.L.; Zhou, B.; Cheng, P.F. Subsurface drip irrigation with micro-nano bubble hydrogen water improves the salt tolerance of lettuce by regulating the antioxidant system and soil bacterial community. Appl. Soil. Ecol. 2025, 207, 105948. [Google Scholar] [CrossRef]
- Li, X.; Wang, J.; Teong, S.P.; Chan, S.P.; Zhang, Y. Durable and superhydrophobic hydrogen elimination catalysts for enhanced hydrogen safety. Int. J. Hydrogen Energy 2025, 115, 93–100. [Google Scholar] [CrossRef]
Disclaimer/Publisher’s Note: The statements, opinions and data contained in all publications are solely those of the individual author(s) and contributor(s) and not of MDPI and/or the editor(s). MDPI and/or the editor(s) disclaim responsibility for any injury to people or property resulting from any ideas, methods, instructions or products referred to in the content. |
© 2025 by the authors. Licensee MDPI, Basel, Switzerland. This article is an open access article distributed under the terms and conditions of the Creative Commons Attribution (CC BY) license (https://creativecommons.org/licenses/by/4.0/).