Abstract
While renewable energy deployment has accelerated in recent years, fossil fuels continue to play a dominant role in electricity generation worldwide. This necessitates the development of transitional strategies to mitigate greenhouse gas emissions from this sector while gradually reducing reliance on fossil fuels. This study investigates the potential of blending green hydrogen with natural gas as a transitional solution to decarbonize Jordan’s electricity sector. The research presents a comprehensive techno-economic and environmental assessment evaluating the compatibility of the Arab Gas Pipeline and major power plants with hydrogen–natural gas mixtures, considering blending limits, energy needs, environmental impacts, and economic feasibility under Jordan’s 2030 energy scenario. The findings reveal that hydrogen blending between 5 and 20 percent can be technically achieved without major infrastructure modifications. The total hydrogen demand is estimated at 24.75 million kilograms per year, with a reduction of 152.7 thousand tons of carbon dioxide per annum. This requires 296,980 cubic meters of water per year, equivalent to only 0.1 percent of the National Water Carrier’s capacity, indicating a negligible impact on national water resources. Although technically and environmentally feasible, the project remains economically constrained, requiring a carbon price of $1835.8 per ton of carbon dioxide for economic neutrality.
1. Introduction
The energy sector stands at the forefront of global climate change mitigation efforts, yet it remains one of the largest contributors to greenhouse gas (GHG) emissions. In 2024, electricity generation alone accounted for 13.8 gigatons of CO2-equivalent (Gt CO2-eq), representing more than one-third of total energy-related emissions. Between 2010 and 2023, global electricity demand increased by an average of 2.7% per year, and this growth further accelerated to 4.3% in 2024. This increase had been driven by the expanding electrification of transport, extreme heat-related cooling needs, and the increasing energy intensity of industrial activities [1]. Despite the widespread adoption of Renewable Energy Sources (RESs) for electricity generation, their contribution has not yet been sufficient to offset the continuous rise in global emissions. RESs currently prevent around 2.6 Gt CO2 per year. However, global emissions still increased by 1.3 Gt CO2 between 2019 and 2024 [2,3]. This persistent trend highlights the need for additional transitional pathways to complement RESs and further accelerate global decarbonization efforts.
Among the most promising pathways, green hydrogen technologies have gained significant attention due to their ability to provide versatile energy carriers and chemical feedstocks, offering practical solutions to decarbonize multiple industrial and power-generation applications [4]. Regarding its potential role in decarbonizing the power sector, green hydrogen can be utilized for electricity generation either through fuel cell technologies or hydrogen gas turbines [5,6]. Although fuel cell technologies have emerged as promising solutions for electricity generation, they still face practical and economic barriers that prevent them from commercial-scale implementation. Specifically, the high cost of fuel cell systems along with the lack of infrastructural readiness continues to pose a crucial challenge to their widespread adoption [7]. Similarly, the large-scale use of hydrogen in gas turbines remains limited due to combustion instability, material constraints, and the need for further system modifications [8]. At the same time, fossil fuels are projected to remain a major component of the global energy supply through at least 2050, posing a significant challenge to achieving near-term net-zero emission targets [9]. These concurrent challenges underscore the necessity of transitional pathways capable of bridging the gap between current fossil-fuel dependency and large-scale hydrogen deployment. In this context, green hydrogen blending within existing natural gas infrastructure has been widely discussed as a near-term strategy to reduce emissions from electricity generation while gradually decreasing reliance on fossil fuels [10].
In the case of Jordan, several studies have explored the potential of green hydrogen as a contributor to the national energy transition. However, most have focused on its production potential, policy implications, or industrial applications rather than its integration into the electricity generation sector. Specifically, previous works have assessed hydrogen production potential [11], the use of hydrogen in the industrial sector [12], stakeholder perspectives on technological and infrastructural barriers [13], and Power-to-X opportunities [14,15]. Despite these valuable contributions, no study has yet conducted a comprehensive evaluation of the potential of blending green hydrogen with natural gas in Jordan’s power sector. Therefore, this study addresses this gap by assessing the technical, economic, and environmental aspects of green hydrogen–natural gas blending in Jordan, while focusing on existing natural gas infrastructure, power plants, and renewable energy potential.
The following sub-sections provide an overview of hydrogen–natural gas blending concepts and outline the characteristics of Jordan’s power sector that make the proposed solution technically and contextually relevant.
1.1. Hydrogen–Natural Gas Blending
Blending green hydrogen with natural gas is considered a practical near-term strategy to reduce carbon emissions from power generation. The rationale behind this technology is that hydrogen combustion does not produce CO2 emissions, as the primary combustion product of hydrogen is water vapor (H2O) [16], ultimately reducing the amount of GHG emissions resulting from power generation processes [17]. Figure 1 demonstrates the concept of hydrogen blending into natural gas infrastructure.
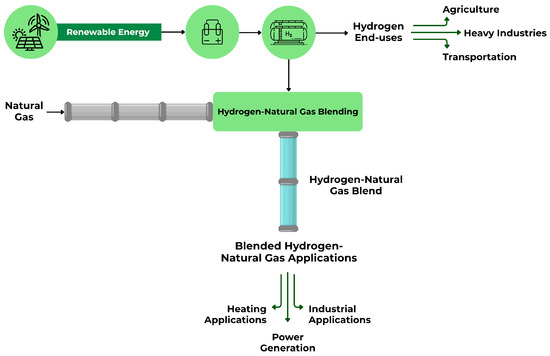
Figure 1.
The concept of hydrogen–natural gas blending.
As shown in Figure 1, green hydrogen is produced from RESs via water electrolysis and stored for use. Hydrogen is blended with natural gas using a blending station, which introduces green hydrogen into the natural gas pipeline network. Hydrogen–natural gas blending can be carried out via direct injection blending or blending skids. Direct injection refers to the process of introducing hydrogen gas directly into the natural gas pipeline at a designated injection point, allowing it to blend with the natural gas stream in real time, while blending skids are modular pre-assembled systems that mix hydrogen with natural gas prior to introducing the mixture to the gas grid [18,19]. The blend is then transmitted through the natural gas network for distribution and end-use applications such as power generation and heating [20,21]. The non-blended hydrogen can also be utilized in numerous applications as previously discussed.
From a practical perspective, the extent to which hydrogen can be blended within the natural gas infrastructure depends on various factors including the material compatibility of existing pipelines, the tolerance of end-use equipment (e.g., gas turbines, burners, and combustion chambers), hydrogen safety limits, the impact on combustion characteristics (e.g., flame speed and temperature), and the adaptability of control and monitoring systems. For instance, Mahajan, D. et al. [22] conducted a comprehensive review of hydrogen blending in natural gas pipeline networks from a global perspective. The authors concluded that current pipeline technologies can practically withstand about 10% hydrogen by volume as an upper limit without the need for major retrofitting [22]. In another study conducted by Tian, X. and Pei J. [23] to assess the safe limits of hydrogen blending across the natural gas infrastructure, the authors concluded that compressors stations along natural gas networks manifest a limiting factor for high blending percentages. Precisely, compressor stations were found to permit only about 10% hydrogen by volume before mechanical and safety concerns arise. On the other hand, static systems such as natural gas pipelines and storage facilities could potentially handle a hydrogen blend of up to 50%. Additionally, the authors concluded that many end-use applications can safely tolerate hydrogen blends with percentages between 20% and 50% [23]. Also, Cecere, D. et al. [24] provide a comprehensive review of how different turbine technologies currently support hydrogen blending and enrichment. The authors showcased that most existing commercial turbines (e.g., Ansaldo Energia’s GT36) can handle moderate blends of less than 70%, while emerging technologies and designs aim to enable full hydrogen compatibility of up to 100% [24].
Globally, blending limits typically range between 5% and 20% hydrogen by volume, depending on the materials and combustion systems involved [25]. Higher blending percentages would require major renovation and retrofitting to the existing natural gas pipeline and systems, hindering the economic feasibility of such upgrades in the near term [26]. Moreover, modern turbines such as GE’s 7HA gas turbine, equipped with the DLN 2.6e combustion system, have demonstrated capabilities to operate with hydrogen blends up to 50% with little or no modifications, while being capable of withstanding higher blending ratios with further modifications [27].
The deployment of hydrogen blending varies significantly across jurisdictions due to differing technical standards. While no global consensus exists on blending limits, most regulators and industry groups recognize 20% by volume as the upper safe limit for existing pipelines without significant upgrades. Beyond this level, dedicated hydrogen infrastructure or extensive retrofitting is generally required [28].
In a study by Franco, A. and Rocca, M. [29], the environmental impact of hydrogen blending with natural gas in industrial blending has been evaluated. The authors concluded that at a blending percentage of 20% H2, CO2 emissions dropped by 7%, while higher blending ratios (e.g., 30% H2) can result in a reduction of up 11% in CO2 emissions [29]. Moreover, Antonescu, N.N. et al. [30] carried out an environmental impact analysis to assess the role of hydrogen blending with natural gas in residential and commercial boilers in Romania. The authors found that conventional boilers can withstand 16% hydrogen blends with no impact on their efficiency. Also, CO2 emissions were reduced by 7%, with a total reduction of 254,700 tons of CO2/year estimated for all boilers to be sold in Romania between 2019 and 2024 [30]. Lastly, Cappello, V. et al. [31] analyzed the environmental role of low-carbon hydrogen in reducing the life cycle GHG emissions resulting from natural gas transmission and end-use. The study concluded that when using zero-carbon hydrogen (i.e., green hydrogen) at a blending ratio of 30% H2, the life cycle-related emissions can potentially drop by 6% while maintaining the nominal energy throughput of the natural gas network [31]. These, among many other studies, suggest that a blend of less than 30% H2 into existing natural gas infrastructures would result in minimal environmental benefits, but would not require any substantial investment. Therefore, the concept of hydrogen–natural gas blending still offers a promising transitional solution for the decarbonization of power generation worldwide.
From an economic perspective, hydrogen–natural gas blending allows utilities to incrementally introduce hydrogen without the high capital costs associated with hydrogen infrastructure. However, the cost of hydrogen, particularly green hydrogen produced via electrolysis using renewable energy, remains significantly higher than that of natural gas [32]. Recent studies estimate that the average global cost of natural gas is expected to stabilize at $4 per million British thermal units (MMBtu) in 2030, while the cost of green hydrogen is expected to decrease to $15 per MMBtu in 2030 and further drop to $7.4 per MMBtu in 2050 [33]. However, the cost of green hydrogen is expected to decline as technology advances and scales in the future, while fossil fuel prices remain volatile and subject to carbon pricing policies [28].
For instance, in a study by Davis, M. et al. [34], a comprehensive scenario analysis has been conducted to assess the economic viability of hydrogen blending with natural gas in Canada. The study showed that hydrogen blends tend to increase the energy delivery costs under all scenarios, especially if the carbon price is neglected. However, when carbon prices were considered, the authors concluded that the increase in energy delivery cost resulting from a 15% hydrogen blend can be compensated if a carbon price of $300 per ton of CO2 is actualized [34]. The same applies to several studies conducted to assess the economic viability of hydrogen blending, where policies and carbon pricing played a significant role in achieving feasibility for blending ratios of 20% H2 and less [35,36,37].
1.2. The Jordanian Electricity Sector
Jordan’s electricity generation sector has undergone a significant transformation over the past two decades, transitioning from heavily relying on imported energy to a diversified energy mix. As of 2023, natural gas accounts for approximately 72% of Jordan’s electricity generation, primarily sourced through imports via the Arab Gas Pipeline (AGP) and Liquefied Natural Gas (LNG) terminals [38]. On the other hand, RESs, mainly solar and wind, contribute to 26% of total generation, positioning Jordan as a regional leader in renewable energy adoption [39]. Despite these advancements, the country remains dependent on imported fuels, which exposes the power sector to supply disruptions and price volatility. Therefore, the Ministry of Energy and Mineral Resources (MEMR) has outlined a comprehensive strategy for the years 2020–2030 in which they aim to increase the contribution of renewable energy in covering the Jordanian electricity demand to 31% by 2030, while reducing reliance on natural gas for electricity generation to 53% [38]. The MEMR has recognized hydrogen’s potential in achieving these goals. Specifically, the Jordan National Green Hydrogen Strategy, released in 2023, outlines a plan to explore hydrogen production, blending, and dedicated hydrogen power generation in partnership with domestic and international stakeholders [40]. Given Jordan’s substantial renewable energy potential, particularly solar and wind, the production of green hydrogen offers a pathway to reduce the carbon intensity of electricity generation and improve long-term independence. However, this transition requires careful evaluation of technical, economic, and regulatory challenges.
Regarding the operational scheme of electricity generation in Jordan, the National Electric Power Company (NEPCO), a government-owned entity, operates as the single buyer and transmitter of electricity, while electricity generation is largely conducted by Independent Power Producers (IPPs) including Central Electric Generating Company (CEGCO), Samra Electric Power Company (SEPCO), Qatrana Electric Power Company (QEPCO), Applied Energy Services (AESs), AES Levant Holding, Amman Asia Electric Power Company (AAEPCO), and the Arabian Company for Water & Power Development (ACWA Power). Further, there are three electricity distribution companies in Jordan, which are the Electricity Distribution Company (EDCO), the Jordanian Electric Power Company (JEPCO), and the Irbid District Electricity Company (IDECO). Each of which is responsible for electricity distribution within specified regions across the country [41]. Figure 2 illustrates how the Jordanian electricity sector is operated.
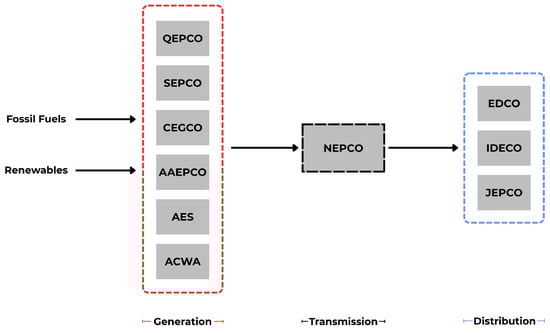
Figure 2.
Jordan’s electricity sector operation scheme [41].
The electricity generation companies shown in Figure 2 currently operate six major power plants across the country. Table 1 includes the most important information regarding each of these plants [41].

Table 1.
Fossil-based power plants in Jordan [41].
All the above-mentioned plants utilize natural gas for power generation, which they directly receive from the AGP. Figure 3 illustrates the specific location of each plant along with the route followed by the AGP across Jordan.
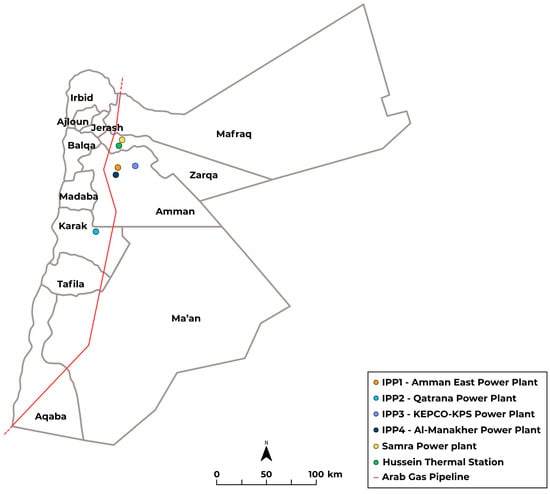
Figure 3.
Locations of fossil-based power plants and natural gas infrastructure in Jordan.
As shown in Figure 3, power plants in Jordan are mostly located in or near the central region of the country. Altogether, the northernmost power plant (Samra Power Plant) is located 100 km apart from the southernmost power plant (Qatrana Power Plant). Moreover, all active power plants in Jordan are relatively far from the Gulf of Aqaba, posing a logistical challenge for the transportation of green hydrogen without significant infrastructural investment.
It is also worth mentioning that the AGP is a transnational pipeline delivering natural gas from Egypt to Jordan, Syria, and Lebanon [42], which complicates its potential use for large-scale national projects. Furthermore, blending hydrogen with natural gas at the Gulf of Aqaba would technically transform the entire AGP downstream into a blended network. This necessitates the adoption of hydrogen-compliant systems throughout the entire AGP across all countries, which is practically challenging given the current state of regional infrastructure.
On the other hand, Jordan is blessed with abundant renewable energy potential, with solar energy standing out as one of the most promising assets. The country enjoys 320 days of sunshine and experiences solar radiation of 5.5 kWh/m2 per day on average [43]. Figure 4 demonstrates the solar map of Jordan, in which significant radiation can be observed throughout the entire country [44,45].
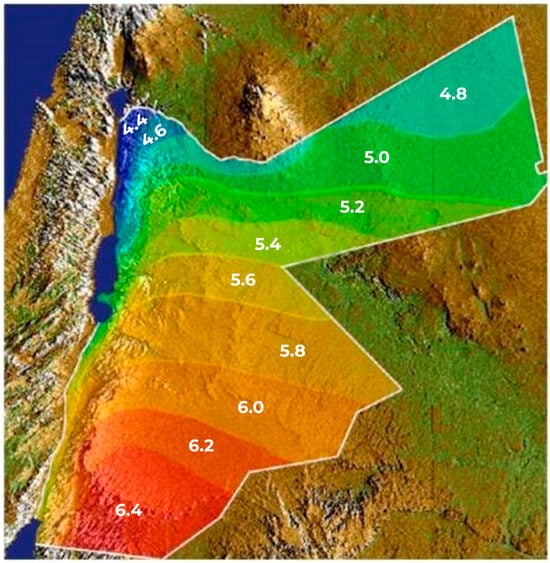
Figure 4.
Jordan’s solar radiation map in kWh/m2/day [44,45].
This immense renewable energy potential can significantly aid Jordan in becoming one of the pioneering countries in the green hydrogen landscape. However, green hydrogen production requires substantial amounts of freshwater, which poses a crucial challenge to the success of the Jordanian green hydrogen endeavor, as Jordan is among the most water-scarce countries worldwide [46]. The most apparent solution for this dilemma is to utilize seawater access in the Gulf of Aqaba to produce freshwater via desalination [47]. However, Aqaba is situated in the far south of the country, posing a challenge for hydrogen transport to end-uses located in the central and northern regions of the country [40].
In this context, the National Water Carrier (NWC) project, announced in 2021, offers a strategic solution to bridge this gap. The NWC is a large-scale infrastructure project designed to transport desalinated water from the Gulf of Aqaba to key population and industrial centers across the country. The project aims to deliver 300 million cubic meters of desalinated water annually and is expected to be operational by 2030 [48]. Figure 5 illustrates the path of the NWC across Jordan [49].
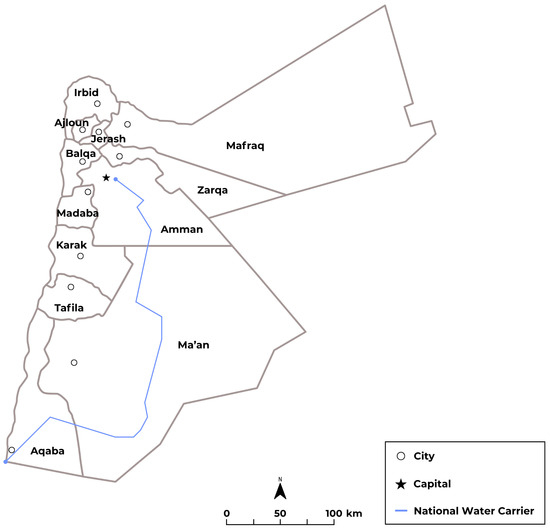
Figure 5.
The National Water Carrier Project path.
As shown in Figure 5, the NWC project spans from the Gulf of Aqaba to the capital city, Amman, covering around 450 km [47]. If integrated with green hydrogen projects, this allows for decentralized production and storage of hydrogen, especially in areas with sufficient RESs and potential end-uses.
2. Materials and Methods
This study follows a sequential approach to evaluate the potential of green hydrogen blending within the natural gas infrastructure in Jordan for electricity generation. The research methodology is demonstrated in Figure 6.
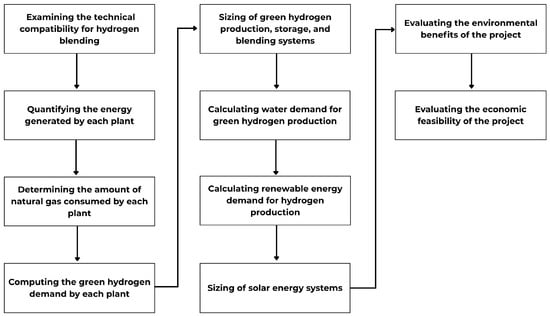
Figure 6.
Research Methodology.
2.1. Technical Compatibility Analysis
The AGP is a high-pressure natural gas transmission pipeline spanning about 1200 km from Egypt through Jordan and onward to Syria and Lebanon. The pipeline is 910 mm in diameter and is designed to transfer 10 billion m3 of natural gas per year [50]. Although the specific material composition of the AGP is not publicly available, major natural gas pipelines in Egypt are made of carbon steel API 5L X60-X65 [51], which meets global standards for high-pressure natural gas transmission pipelines [52]. Hence, in this study, the material of the AGP is assumed to be API 5L X65.
Carbon steel pipelines such as API 5L X65 can potentially withstand hydrogen blends of up to 30% while maintaining mechanical integrity [53]. However, global standards suggest that hydrogen blending in transmission networks must be kept below 20% in the short to medium term [54]. Although a maximum hydrogen blending limit of 20 percent was adopted in this study in line with global best practices for high-pressure transmission systems, exceeding this threshold would necessitate targeted retrofitting and advanced monitoring measures. Specifically, higher hydrogen concentrations (>20%) may require pipe material verification and replacement of susceptible carbon steel sections, upgrading of compressor seals and valves, and enhancement of leak detection and embrittlement monitoring systems. Given the transnational nature of the Arab Gas Pipeline (AGP), such modifications would further depend on harmonized standards and joint operational coordination among the participating countries (Egypt, Jordan, Syria, and Lebanon), as regional variations in pipeline material grades, operating pressures, and maintenance protocols could influence blending feasibility and safety. Therefore, the upper limit for hydrogen blending in the AGP shall be kept at a maximum limit of 20% in this study.
Considering power plants, the technical specifications and compatibility for each are as follows:
- Amman East Power Plant (IPP1): Combined Cycle Gas Turbine (CCGT): two Ansaldo Energia AE94.2 gas turbines (Ansaldo Energia S.p.A, Genoa, Italy) with a Fuji Electric steam turbine (Fuji Electric Co., Tokyo, Japan) [55]. Compatible with 40% hydrogen blends [56].
- Qatrana Power Plant (IPP2): CCGT: two Siemens SGT5-2000E gas turbines (Siemens AG, Berlin, Germany) and a Škoda MTD40 steam turbine (Doosan Škoda Power, Plzeň, Czech Republic) [57]. Compatible with 30% hydrogen blends [58].
- KEPCO-KPS Power Plant, also known as Amman Asia Power Plant (IPP3): 38 Wärtsilä 18V50DF reciprocating engines (Wärtsilä Corporation, Vaasa, Finland) [59]. Compatible with 25% hydrogen blends [60].
- Levant Power Plant, also known as Al-Manakher Power Plant (IPP4): 16 Wärtsilä 18V50DF reciprocating engines (Wärtsilä Corporation, Vaasa, Finland) [55]. Compatible with 25% hydrogen blends [60].
- Samra Power Plant: two General Electric (GE) PG 9171E (General Electric, Belfort, France), two GE 9E (General Electric, Belfort, France), and three GE GT13E2 gas turbines (General Electric, Birr, Switzerland) with four steam turbines: Fuji Electric FK-H130 (Fuji Electric Co., Tokyo, Japan), Dongfang Electric (Dongfang Electric Corporation, Chengdu, Sichuan, China), GE STF15C (General Electric, Belfort, France), and Doosan Skoda Power (Doosan Škoda Power, Plzeň, Czech Republic) [61]. Compatible with 5–30% hydrogen blends [62].
- Zarqa Power Plant: CCGT: three GE Frame 9E.03 (an upgraded version of GE 9E) (General Electric, Belfort, France) and 183 MW Škoda steam turbine (Doosan Škoda Power, Plzeň, Czech Republic) [63]. Compatible with 5% hydrogen blends [64].
It is important to note that the study focuses strictly on assessing the maximum allowable hydrogen blending limits determined by the technical compatibility of the Arab Gas Pipeline and the associated power plants in Jordan. This approach ensures that the analysis reflects realistic operational conditions within the country’s current infrastructure and regulatory context.
2.2. Calculation of Energy, Natural Gas, and Hydrogen Requirements
Based on historical data obtained from NEPCO annual reports, the contribution of each power plant under study to electricity generation in Jordan is shown in Table 2 [41].
Table 2.
Historical electricity generation by power plant (2013–2023) in GWh/year [41].
Furthermore, considering the period between 2018 and 2023, each power plant contributed to electricity generation via natural gas, as shown in Figure 7 [41].
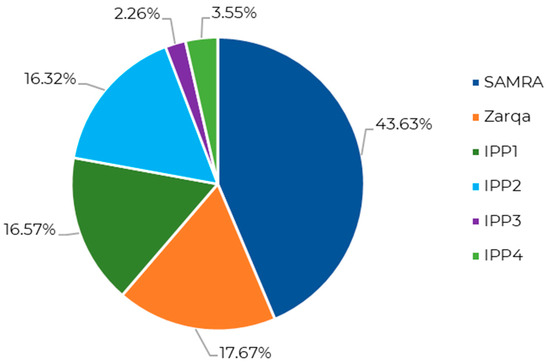
Figure 7.
Power plants’ contribution to electricity generation via natural gas (2018–2023) [41].
To assess the amount of energy produced by each power plant in 2030, the contribution of each power plant in electricity generation via natural gas is assumed to be constant. Furthermore, the total consumption of natural gas in 2030 was based on the MEMR’s estimate within their 2020–2030 plan to align with national targets. The MEMR estimates that Jordanian electricity generation will reach 19,701 GWh by 2030, with 53% covered by natural gas, equivalent to 10,441.5 GWh of electricity.
Therefore, the electricity to be generated by each power plant can be calculated using the following equation:
where is the electricity generated by plant x during 2030 (GWh/year), is the average contribution of plant x in electricity generation from natural gas (%), and is the targeted electricity generation from natural gas in Jordan in 2030 (=10,441.5 GWh/year).
To ensure the hydrogen–natural gas blend provides sufficient energy for the targeted electricity generation at each power plant, the total fuel input volume was adjusted based on the net calorific value of the blended fuel. Accordingly, higher blending ratios of hydrogen require a proportionally larger total fuel volume to compensate for the lower volumetric energy content of hydrogen.
The required total fuel volume to be consumed annually to meet the MEMR 2030 target can be calculated using the following equation:
where is the total fuel volume to be consumed at power plant x in thousand cubic meters per year at normal conditions (thousand Nm3/year), is the thermal efficiency of power plant x, is the adopted hydrogen blend percentage (%) for power plant x based on the maximum allowable limits, is the net calorific value of hydrogen at normal conditions in Megajoules per cubic meter (=10.8 MJ/Nm3), and is the net calorific value of natural gas at normal conditions (=37 MJ/Nm3) [65]. The multiplication of 1000 is to convert the electricity generated from GWh to MWh, while the multiplication of 3.6 is to convert MWh to Gigajoules (GJ). A unified efficiency of 45% has been assumed for all power plants due to the lack of data [66].
Furthermore, the annual consumption of hydrogen and natural gas for each power plant can be calculated using the following equations:
where and are the volumes of hydrogen and natural gas consumed by power plant x (thousand Nm3/year). It is worth mentioning that the hydrogen–natural gas blend is assumed to have a pressure of 20 bar to match practical pressure ranges for natural gas lateral pipelines [67].
2.3. Sizing of Production and Storage Systems
In order to determine the size of the hydrogen production facility for each power plant, the following equation applies [68]:
where is the electrolyzer power required to produce hydrogen for power plant x in (MW), is required mass of hydrogen on a daily basis by power plant x (kg/day), is the specific energy consumption of electrolyzer (kWh/kg H2), and is the number of daily operational hours (hours/day), which is assumed to equal Jordan’s average sunshine hours (=5.5 h/day) [43]. The division by 1000 is meant to convert the capacity of the electrolyzer from kW to MW. Also, it is worth mentioning that the SEC for most modern electrolyzers falls around 50 kWh/kg H2 [68]. Moreover, the required mass of hydrogen can be calculated using the following simple equation:
where is hydrogen’s density at normal conditions (=0.0899 kg/Nm3) [68]. The multiplication of 1000 is to convert the volume of hydrogen to Nm3/year, while the division of 365 is to convert the required volume of hydrogen from an annual to a daily basis.
Since green hydrogen relies on renewable energy for production, hydrogen storage must be included to account for fluctuations in energy input [69]. Moreover, in cases where hydrogen is produced near the end-use, gaseous hydrogen storage in silos/vessels is highly preferred [28]. To determine the required volume of hydrogen storage vessels, the following equation applies [68]:
where is required hydrogen’s storage volume at power plant x (m3) and is the density of hydrogen at the storage pressure (kg/m3). In practice, gaseous hydrogen in rapid applications is stored at a pressure of around 200, at which it has a density of around 15.6 kg/m3 [68].
Another crucial component for hydrogen production and storage is the compression station. Polymer Exchange Membrane (PEM) electrolyzers produce hydrogen at a pressure of around 35 bar, while hydrogen storage takes place at pressures of around 200 bar [68]. To select a suitable compressor to interlink hydrogen production and storage, the following equation applies:
where is the required compressor flow rate to store hydrogen for utilization at power plant x (Nm3/h). Similarly to Equation (6), the multiplication of 1000 is to convert the volume of hydrogen to Nm3/year, while the division of 365 is to convert the required volume of hydrogen from an annual to a daily basis.
2.4. Calculation of Water and Renewable Energy Requirements
As previously mentioned, Jordan is among the most water-scarce countries in the world. Hence, careful consideration must be given to ensuring a sustainable, yet equitable, supply of freshwater for green hydrogen production. For this purpose, the selection of the NWC as the primary source of freshwater for hydrogen production must be evaluated.
The amount of freshwater required for hydrogen production from each power plant can be determined using the following equation [68]:
where is the water required for hydrogen production for power plant x (m3/day) and is the specific water consumption of electrolyzer to produce 1 kg of hydrogen (L/kg) [68]. Also, the division by 1000 is done to convert liters to cubic meters. Practically, PEM electrolyzers consume 10–12 L of freshwater to produce 1 kg of hydrogen [70]. Hence, assuming the upper limit accounts for the worst-case scenario in water consumption for hydrogen production.
Regarding the required renewable energy to power the hydrogen production and compression facilities, the following equation applies [71]:
where is the overall power required by photovoltaic systems (MWp) and is the required load to be covered by photovoltaic systems (MW), and is the performance ratio of the photovoltaic system. A performance ratio of 0.8 is generally accepted under typical operation conditions [72].
The required load to be covered by the photovoltaic systems can be calculated using the following equation:
where is the required water electrolysis capacity for power plant x in MW (obtained from Equation (5)) and is the power required to drive the compressor at power plant x in MW, which is calculated through the following equation [73]:
where is the specific energy consumption of the compressor (kWh/kg) [73]. The specific energy consumption of compressors to compress hydrogen typically lies within the range of 1.7–6.4 kWh/kg [74]. For the purpose of this study, this value has been assumed at 2 kWh/kg.
2.5. Environmental and Economic Analysis
The environmental impact of hydrogen blending is evident in the reduction in natural gas consumption in favor of green hydrogen, which alleviates some of the environmental stress imposed by fossil-based electricity generation in Jordan.
To quantify the environmental impact of the proposed project, the carbon emissions savings can be calculated using the following equation:
where is the reduction in carbon dioxide emissions from power plant x after hydrogen–natural gas blending in kilo tons of CO2 (kt CO2), is the annual reduction in natural gas consumption (thousand Nm3/year) and is the amount of carbon dioxide emissions resulting from combusting 1 cubic meter of natural gas (kg CO2/Nm3), which is 1.9 kg CO2 per m3 of natural gas at normal conditions [75]. The reduction in natural gas consumption can be calculated as follows:
where is the volume of natural gas that would be consumed at power plant x by 2030 without being blended with hydrogen (thousand Nm3/year). Recall that is the volume of natural gas to be blended with hydrogen at power plant x for electricity generation in Jordan in 2030 (thousand Nm3/year).
The pure natural gas volume without blending can be calculated using the following equation:
Regarding the economic feasibility of the hydrogen–natural gas blending endeavor in Jordan, the Net Economic Benefit of Blending (NEBB) can be calculated as follows:
where is the carbon price ($/kg CO2), is the cost of natural gas ($/m3), is the Capital Recovery Factor, is the cost of hydrogen production ($/kg H2), and is the total mass of hydrogen utilized per annum (kg H2/year). Also, can be calculated using the following equation:
where is the discount rate and L is the project’s lifetime (years).
Regarding the cost of natural gas, Jordan purchases natural gas at a cost of $6.30/MMBtu, which is equivalent to $0.22/m3 of natural gas [76]. On the other hand, the cost of green hydrogen in Jordan is expected to reach $2.49/kg by 2030 [77]. Also, the lifetime of the project implementation is assumed at 20 years (2030–2050) at a discount rate of 5%. Furthermore, the CAPEX of the project was calculated considering that the initial cost of PEM electrolyzers is $2000/kW [78], $270/kW of compressors [79], $700/kg for hydrogen storage [80], $1000/kWp for photovoltaic systems [81], and an assumed $2 million per blending skid for each power plant [82]. On the other hand, the OPEX values have been dealt with as percentages of the CAPEX for each system. OPEX has been calculated at 4% of CAPEX for PEM electrolyzers [83], 4% for compressors [28], 2% for photovoltaic systems [84], 4% for hydrogen storage tanks [85], and 3% for blending skids.
3. Results and Discussion
3.1. Technical Compatibility of AGP and Power Plants in Jordan
The technical assessment of hydrogen blending compatibility revealed a variation in the blending ratios each power plant can withstand. This supports the utilization of separate hydrogen blending skids at lateral connections of the AGP. Even though most power plants can withstand hydrogen blends of more than 20%, hydrogen delivery to each power plant is governed by the compatibility limits of the AGP. Therefore, for power plants capable of withstanding more than 20% blends, the upper limit has been chosen considering the maximum allowable hydrogen blending for the AGP (=20% H2). In contrast, for power plants with lower hydrogen compatibility (<20% H2), the plant’s maximum allowable blend has been used as the threshold. Table 3 summarizes these findings.
Table 3.
Hydrogen Blending Limits for AGP and Power Plants in Jordan.
3.2. Energy, Natural Gas, and Hydrogen Requirements
By applying Equation (1), the annual electricity generated from each power plant has been calculated, and the results are shown in Figure 8.
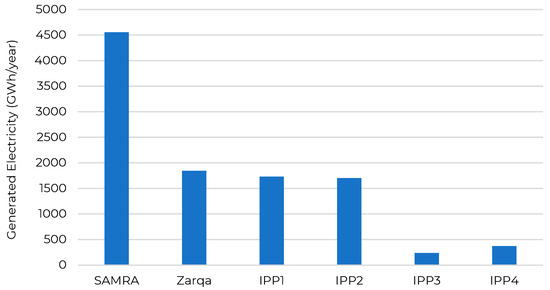
Figure 8.
Estimated electricity generation from each power plant in Jordan in 2030.
As shown in Figure 8, with the current average contribution to electricity generation, the Samra power plant will account for a significant portion of electricity generation in 2030. Specifically, the Samra power plant will produce 4555.7 GWh per year, followed by the Zarqa power plant with an estimated electricity generation of 1845.4 GWh/year. Similarly, IPP1 is expected to generate 1730.0 GWh/year, slightly more than IPP2, which is expected to generate 1703.3 GWh/year of electricity. Further, IPP4 is estimated to generate 371.1 GWh/year, while IPP3 is assumed to have the least contribution with an annual electricity generation of 235.8 GWh.
By applying Equations (2)–(4), the annual and daily volumes of natural gas and hydrogen to be blended and consumed at each power plant are shown in Table 4.
Table 4.
Annual and daily volumes of natural gas and hydrogen consumed at each power plant in 2030.
As shown in Table 4, the distribution of annual and daily hydrogen consumption across power plants is primarily governed by the adopted hydrogen blending percentage and the scale of electricity generation associated with each power plant. Plants such as IPP1 and IPP2, which operate at relatively high blending limits of 20%, exhibit the largest annual hydrogen requirements despite producing less total electricity than the Samra Power Plant. This outcome arises from the direct volumetric dependency of hydrogen demand on the blending ratio. At higher hydrogen fractions, a larger share of the total volumetric fuel input is substituted by hydrogen, even when the plant’s overall generation is moderate.
Conversely, the Samra Power Plant, although responsible for the highest share of national electricity generation in 2030, shows a comparatively smaller hydrogen volume. This is primarily attributed to its lower allowable blending threshold of 5%, which reflects the technical limitations of its multi-turbine configuration and combustion system. In this case, the larger absolute fuel throughput is offset by the conservative hydrogen fraction permitted to maintain operational safety and combustion stability. The result highlights a non-linear relationship between plant generation capacity and hydrogen utilization. In other words, higher energy output does not necessarily correspond to higher hydrogen consumption unless supported by compatible turbine design and material tolerance.
Smaller plants such as IPP3 and IPP4, which operate at 20% blending, exhibit lower hydrogen volumes primarily due to their limited electricity generation capacities. These reciprocating engine plants typically operate as mid-merit or peaking units, resulting in reduced annual utilization.
Overall, these results underscore that the interaction between blending limits, plant technology, and operational role is the principal mechanism shaping hydrogen demand across Jordan’s power sector. Facilities with advanced combustion systems and higher permissible blending ratios dominate volumetric hydrogen utilization, whereas large-scale but conservatively rated plants contribute mainly through the scale of their natural gas consumption. This interplay defines the practical boundaries for near-term hydrogen integration into the national energy mix.
3.3. Hydrogen Systems’ Capacities
By applying Equations (5)–(8), the sizes of hydrogen production, storage, and compression facilities to cover the demand of power plants in Jordan, assuming a SEC of 50 kWh/kg and a 5.5 h/day operation, are shown in Table 5.
Table 5.
Capacity of hydrogen production facilities for power plants in Jordan in 2030.
As presented in Table 5, the sizing of hydrogen production and storage systems are directly proportional to the hydrogen requirements of each power plant. Moreover, the results reflect the interdependence between daily hydrogen demand, electrolyzer operation hours, and process energy requirements. Since the electrolyzers are assumed to operate only 5.5 h per day (Jordan’s average daily solar irradiation), plants must install sufficiently large capacities to generate their required hydrogen volumes within this limited window. This temporal constraint directly explains the high-rated capacities of the electrolyzers, particularly for facilities requiring continuous hydrogen supply.
Furthermore, the storage volumes listed in Table 5 correspond to the buffering capacity required to maintain a stable hydrogen supply between production cycles. These capacities are not merely proportional to daily hydrogen production but also depend on the temporal mismatch between solar availability and power plant operation, highlighting the role of storage as a bridging mechanism for dispatchable power generation.
Similarly, the compressor flow rates are directly determined by the instantaneous hydrogen output from the electrolyzers. Because hydrogen production occurs within a short time window, compressors must accommodate high volumetric flow rates to pressurize the produced hydrogen for storage or blending.
Collectively, these results demonstrate that the sizing of hydrogen production infrastructure in a solar-driven system is governed not only by annual hydrogen demand but also by the temporal and process constraints of renewable operation.
3.4. Water and Renewable Energy Requirements
Applying Equation (9), the water consumption values for producing hydrogen at each power plant are shown in Table 6, assuming an SWC of 12 L/kg of H2.
Table 6.
Water consumption for hydrogen production for electricity generation in Jordan in 2030.
As shown in Table 6, the total daily consumption for hydrogen production for all power plants combined is limited to 813.6 m3/day. When translated to an annual consumption, this yields a total of around 296,980 m3/year. Considering the total capacity of the NWC, which is estimated at 300 million m3/year, the total water consumption for hydrogen production would account for 0.099% (≃0.1%).
From a Water–Energy–Food (WEF) Nexus perspective, the minimal water footprint associated with hydrogen production is justified by the strategic energy and environmental co-benefits it provides. In this regard, allocating a marginal portion of desalinated water to hydrogen production represents an integrated resource optimization, where a small water input yields systemic sustainability gains across the energy and environmental domains.
Furthermore, given that the NWC project is designed to expand Jordan’s desalinated water capacity over time, the projected 0.1% utilization rate underscores the scalability and feasibility of incorporating hydrogen production within national water planning frameworks.
By applying Equations (10)–(12), the electrolyzers’ capacity (retrieved from Table 5), the compressors’ load, and photovoltaic systems requirements for each power plant were calculated and are shown in Table 7.
Table 7.
Load capacity of hydrogen production and compression facilities and the required photovoltaic systems requirements for power plants in Jordan in 2030.
As shown in Table 7, the combined load required to operate hydrogen production and compression systems in 2030 reaches 641.1 MW, supported by 801.3 MWp of photovoltaic capacity. The larger PV capacity reflects the need to compensate for system losses and the limited 5.5-h daily operating window of solar-powered electrolysis. This temporal constraint necessitates oversizing the PV system relative to the electrolyzer and compressor loads to ensure sufficient energy generation during daylight hours.
The distribution of PV capacity follows the hydrogen demand of each plant, where IPP1 and IPP2 dominate due to their higher blending limits and corresponding electrolyzer sizes. Conversely, Samra and Zarqa require smaller renewable systems because of their lower 5% hydrogen limits. The compressor loads, which represent less than 5% of the total power demand, mainly reflect the high gas throughput associated with hydrogen pressurization.
Overall, these results emphasize that PV system sizing is primarily driven by hydrogen demand, solar operation hours, and efficiency considerations. Given Jordan’s leading position in renewable energy deployment and its abundant solar potential, the country possesses the necessary resource base to sustainably support large-scale solar-powered hydrogen production projects.
3.5. Environmental and Economic Impact
By applying Equations (13)–(15), the CO2 savings from each power plant, along with the total savings, are shown in Figure 9.
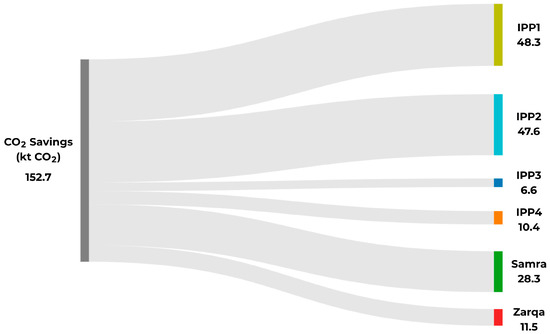
Figure 9.
Estimated CO2 savings from hydrogen–natural gas blending for electricity generation in Jordan in 2030.
The results illustrated in Figure 9 above indicate that the total CO2 savings achieved through hydrogen blending across all evaluated power plants amount to approximately 152.7 kt CO2 per year. The largest individual contributions originate from IPP1 (48.3 kt CO2) and IPP2 (47.6 kt CO2), together accounting for nearly two-thirds of the total reduction. This dominant share is primarily attributed to their higher hydrogen blending ratios (20%) and substantial annual fuel throughput, which directly enhances their emission-reduction potential.
In contrast, the Samra Power Plant, despite having the highest total electricity generation, achieves a smaller reduction (28.3 kt CO2) due to its conservative hydrogen blending limit of 5%. A similar pattern is observed for the Zarqa Power Plant (11.5 kt CO2), where lower blending tolerance limits the achievable substitution of natural gas. Smaller facilities such as IPP3 and IPP4 contribute modestly (6.6 kt CO2 and 10.4 kt CO2, respectively) owing to their limited generation capacity and operational roles as mid-merit or peaking units.
Altogether, these findings highlight the strong correlation between hydrogen blending fraction, annual fuel use, and achievable CO2 savings. Plants operating at higher blending ratios provide greater absolute emission reductions, even when their electricity output is moderate. This outcome underscores the importance of technology-specific blending optimization, where maximizing hydrogen integration within combustion and material safety limits can yield the highest environmental benefit without compromising plant operability. The results further demonstrate that even partial hydrogen substitution can produce measurable decarbonization impacts at the sectoral level, aligning with Jordan’s 2030 low-carbon energy transition targets.
It is worth mentioning that further analyses on the formation of nitrogen oxides due to hydrogen blending are essential to determine the full environmental impact of hydrogen–natural gas blending.
Using the previously detailed parameters, the CAPEX and OPEX for each major system are shown in Table 8:
Table 8.
CAPEX and OPEX of major systems for hydrogen–natural gas blending in Jordan.
Considering a project lifetime of 20 years (2030–2050) and a discount rate of 5%, the minimum carbon pricing to achieve zero NEBB was found to be $1835.8/tCO2. Such an exceptionally high threshold underscores that under current cost structures and technological maturity levels, hydrogen–natural gas blending remains economically unviable in Jordan, especially without substantial reductions in hydrogen production costs or significant policy incentives. Furthermore, the results indicate that relying solely on carbon pricing is insufficient to achieve economic feasibility, given the current market prices.
4. Conclusions
This study assessed the technical, environmental, and economic feasibility of blending green hydrogen with natural gas in Jordan’s electricity generation sector as a transitional decarbonization pathway. The analysis incorporated the compatibility of the Arab Gas Pipeline (AGP) and the major natural gas power plants, energy-adjusted blending calculations, and a detailed techno-economic framework that accounts for realistic operational parameters and costs.
From a technical perspective, the findings confirm that hydrogen blending at maximum allowable limits of up to 20% (and 5% for Samra and Zarqa power plants) can be safely implemented without major infrastructure modifications. Under the projected 2030 energy scenario, the total annual hydrogen demand required to achieve these blending levels was estimated at 24.75 million kg, corresponding to a hydrogen volume of approximately 456 million Nm3 per year.
Environmentally, the proposed blending strategy would achieve an annual CO2 reduction of 152.7 kt CO2, representing a meaningful but partial contribution to Jordan’s broader decarbonization targets. Importantly, the water required for electrolysis (296,980 m3/year) constitutes only 0.1% of the National Water Carrier’s (NWC) annual capacity, confirming that hydrogen production can proceed without materially affecting national water security.
On the energy-supply side, a total PV capacity of 801 MWp would be required to power the hydrogen production and compression systems, corresponding to an electrical load of 641 MW. These values demonstrate the technical feasibility of coupling large-scale hydrogen production with renewable resources under Jordan’s high solar irradiance conditions.
Economically, the project remains financially infeasible under current conditions. The Net Economic Benefit of Blending (NEBB) analysis revealed a break-even carbon price of approximately $1835.8 per ton of CO2, indicating that substantial reductions in hydrogen production and capital costs, as well as the introduction of targeted carbon pricing mechanisms, are necessary for commercial viability.
Overall, the study establishes a quantitative baseline for hydrogen–natural gas blending in Jordan, presenting the first evaluation of its potential. The results emphasize that while the concept is technically achievable and environmentally beneficial, it is economically constrained at present cost levels. Future efforts should therefore focus on reducing electrolyzer and PV costs and leveraging international financing mechanisms to accelerate the transition toward a low-carbon power system in Jordan.
Author Contributions
Conceptualization, H.M. and R.T.; methodology, H.M. and R.T.; software, H.M. and R.T.; validation, H.M.; formal analysis, H.M. and R.T.; investigation, H.M. and R.T.; resources, H.M.; data curation, H.M. and R.T.; writing—original draft preparation, R.T.; writing—review and editing, H.M. and R.T.; visualization, R.T.; supervision, H.M.; project administration, H.M.; funding acquisition, H.M. All authors have read and agreed to the published version of the manuscript.
Funding
The Deanship of Scientific Research funded this research at the German Jordanian University through the CLUS-SATS/01/2024 cluster grant.
Data Availability Statement
The datasets generated and/or analyzed during the current study are available from the corresponding author upon reasonable request.
Conflicts of Interest
The authors declare that they have no known competing financial interests or personal relationships that could have appeared to influence the work reported in this paper.
Abbreviations
The following abbreviations are used in this manuscript:
| AAEPCO | Amman Asia Electric Power Company |
| ACWA | Arabian Company for Water & Power Development |
| AESs | Applied Energy Services |
| AGP | Arab Gas Pipeline |
| CCGT | Combined Cycle Gas Turbine |
| CEGCO | Central Electric Generating Company |
| EDCO | Electricity Distribution Company |
| GE | General Electric |
| GHGs | Greenhouse Gases |
| IDECO | Irbid District Electricity Company |
| IPP | Independent Power Producers |
| JEPCO | Jordan Electric Power Company |
| LNG | Liquified Natural Gas |
| MEMR | Ministry of Energy and Mineral Resources |
| NEBB | Net Economic Benefit of Blending |
| NEPCO | National Electric Power Company |
| NWC | National Water Carrier |
| PEM | Polymer Exchange Membrane |
| QEPCO | Qatrana Electric Power Company |
| RESs | Renewable Energy Sources |
| WEF | Water–Energy–Food |
References
- International Energy Agency. Electricity 2025: Analysis and Forecast to 2027. Available online: https://iea.blob.core.windows.net/assets/0f028d5f-26b1-47ca-ad2a-5ca3103d070a/Electricity2025.pdf (accessed on 7 May 2025).
- International Energy Agency. Global Energy Review 2025. Available online: https://iea.blob.core.windows.net/assets/5b169aa1-bc88-4c96-b828-aaa50406ba80/GlobalEnergyReview2025.pdf (accessed on 6 May 2025).
- Hassan, Q.; Viktor, P.; Al-Musawi, T.J.; Ali, B.M.; Algburi, S.; Alzoubi, H.M.; Al-Jiboory, A.K.; Sameen, A.Z.; Salman, H.M.; Jaszczur, M. The renewable energy role in the global energy transformations. Renew. Energy Focus 2024, 48, 100545. [Google Scholar] [CrossRef]
- Du, L.; Yang, Y.; Zhou, L.; Liu, M. Greenhouse gas reduction potential and economics of green hydrogen via water electrolysis: A systematic review of value-chain-wide decarbonization. Sustainability 2024, 16, 4602. [Google Scholar] [CrossRef]
- Salam, M.A.; Shaikh, M.A.A.; Ahmed, K. Green hydrogen based power generation prospect for sustainable development of Bangladesh using PEMFC and hydrogen gas turbine. Energy Rep. 2023, 9, 3406–3416. [Google Scholar] [CrossRef]
- Nasser, M.; Awad, M.M.; Hassan, A.A. 4E assessment of all-day clean electricity generation systems based on green hydrogen integrated system using PV and PVT solar collectors and wind turbines. Int. J. Hydrogen Energy 2025, 104, 393–406. [Google Scholar] [CrossRef]
- Lee, Y.; Lee, M.C.; Kim, Y.J. Barriers and strategies of hydrogen fuel cell power generation based on expert survey in South Korea. Int. J. Hydrogen Energy 2022, 47, 5709–5719. [Google Scholar] [CrossRef]
- Alhuyi Nazari, M.; Fahim Alavi, M.; Salem, M.; Assad, M.E.H. Utilization of hydrogen in gas turbines: A comprehensive review. Int. J. Low-Carbon Technol. 2022, 17, 513–519. [Google Scholar] [CrossRef]
- International Energy Agency. Net Zero by 2050: A Roadmap for the Global Energy Sector. Available online: https://iea.blob.core.windows.net/assets/deebef5d-0c34-4539-9d0c-10b13d840027/NetZeroby2050-ARoadmapfortheGlobalEnergySector_CORR.pdf (accessed on 20 May 2025).
- Calabrese, M.; Ademollo, A.; Busi, L.; Meazzini, M.; Carcasci, C. Techno-economic assessment of green hydrogen production for blending in the natural gas network. J. Phys. Conf. Ser. 2024, 2893, 012066. [Google Scholar] [CrossRef]
- Jaradat, M.; Alsotary, O.; Juaidi, A.; Albatayneh, A.; Alzoubi, A.; Gorjian, S. Potential of producing green Hydrogen Jordan. Energies 2022, 15, 9039. [Google Scholar] [CrossRef]
- Ayadi, O. Assessment of Green Hydrogen for Industrial Heat in Jordan; Ministry of Energy and Mineral Resources (MEMR): Amman, Jordan, 2024. Available online: https://www.memr.gov.jo/ebv4.0/root_storage/en/eb_list_page/aghihj2025_v2-0.pdf (accessed on 4 September 2025).
- Khasawneh, H.J.; Maaitah, R.A.; AlShdaifat, A. Green hydrogen in Jordan: Stakeholder perspectives on technological, infrastructure, and economic barriers. Energies 2025, 18, 3929. [Google Scholar] [CrossRef]
- Muhsen, H.; Hamida, F.; Tarawneh, R. The potential of green hydrogen and power-to-X to decarbonize the fertilizer industry in Jordan. Agriculture 2025, 15, 608. [Google Scholar] [CrossRef]
- Muhsen, H.; Al-Mahmodi, M.; Tarawneh, R.; Alkhraibat, A.; Al-Halhouli, A.A. The potential of green hydrogen and pow-er-to-X utilization in Jordanian industries: Opportunities and future prospects. Energies 2023, 17, 213. [Google Scholar] [CrossRef]
- Habib, M.A.; Abdulrahman, G.A.; Alquaity, A.B.; Qasem, N.A. Hydrogen combustion, production, and applications: A review. Alex. Eng. J. 2024, 100, 182–207. [Google Scholar] [CrossRef]
- Di Lullo, G.; Oni, A.O.; Kumar, A. Blending blue hydrogen with natural gas for direct consumption: Examining the effect of hydrogen concentration on transportation and well-to-combustion greenhouse gas emissions. Int. J. Hydrogen Energy 2021, 46, 19202–19216. [Google Scholar] [CrossRef]
- Eames, I.; Austin, M.; Wojcik, A. Injection of gaseous hydrogen into a natural gas pipeline. Int. J. Hydrogen Energy 2022, 47, 25745–25754. [Google Scholar] [CrossRef]
- National Renewable Energy Laboratory (NREL). Hydrogen Blending into Natural Gas Pipeline Infrastructure: Review of the State of Technology. Available online: https://docs.nrel.gov/docs/fy23osti/81704.pdf (accessed on 8 May 2025).
- Zhou, D.; Yan, S.; Huang, D.; Shao, T.; Xiao, W.; Hao, J.; Wang, C.; Yu, T. Modeling and simulation of the hydrogen blended gas-electricity integrated energy system and influence analysis of hydrogen blending modes. Energy 2022, 239, 121629. [Google Scholar] [CrossRef]
- Mayrhofer, M.; Koller, M.; Seemann, P.; Prieler, R.; Hochenauer, C. Assessment of natural gas/hydrogen blends as an alternative fuel for industrial heat treatment furnaces. Int. J. Hydrogen Energy 2021, 46, 21672–21686. [Google Scholar] [CrossRef]
- Mahajan, D.; Tan, K.; Venkatesh, T.; Kileti, P.; Clayton, C.R. Hydrogen blending in gas pipeline networks—A review. Energies 2022, 15, 3582. [Google Scholar] [CrossRef]
- Tian, X.; Pei, J. Study progress on the pipeline transportation safety of hydrogen-blended natural gas. Heliyon 2023, 9, e21454. [Google Scholar] [CrossRef]
- Cecere, D.; Giacomazzi, E.; Di Nardo, A.; Calchetti, G. Gas turbine combustion technologies for hydrogen blends. Energies 2023, 16, 6829. [Google Scholar] [CrossRef]
- Bloj, M.D.; Ripeanu, R.G.; Diniță, A.; Oprea, V.O.; Tănase, M. Comprehensive review of hydrogen-natural gas blending: Global project insights with a focus on implementation and impact in Romanian gas networks. Heliyon 2025, 11, e43090. [Google Scholar] [CrossRef]
- Sodwatana, M.; Kazi, S.R.; Sundar, K.; Zlotnik, A. Optimization of hydrogen blending in natural gas networks for carbon emissions reduction. In Proceedings of the 2023 American Control Conference (ACC), San Diego, CA, USA, 31 May–2 June 2023; IEEE: Piscataway, NJ, USA, 2023; pp. 1229–1236. [Google Scholar] [CrossRef]
- Eroglu, A.; Larfeldt, J.; Klapdor, E.V.; Yilmaz, E.; Prasad, V.N.; Prade, B.; Witzel, B.; Koenig, M. Hydrogen capabilities of Siemens Energy gas turbines: An OEM perspective. In Proceedings of the Gas Turbines—A Carbon-Neutral Society, 10th International Gas Turbine Conference, Brussels, Belgium, 11–15 October 2021; pp. 1–12. [Google Scholar]
- International Energy Agency. Global Hydrogen Review 2024. Available online: https://www.iea.org/reports/global-hydrogen-review-2024 (accessed on 24 May 2025).
- Franco, A.; Rocca, M. Industrial decarbonization through blended combustion of natural gas and hydrogen. Hydrogen 2024, 5, 519–539. [Google Scholar] [CrossRef]
- Antonescu, N.N.; Stănescu, D.P.; Calotă, R. CO2 emissions reduction through increasing H2 participation in gaseous combustible—Condensing boilers functional response. Appl. Sci. 2022, 12, 3831. [Google Scholar] [CrossRef]
- Cappello, V.; Sun, P.; Elgowainy, A. Blending low-carbon hydrogen with natural gas: Impact on energy and life cycle emissions in natural gas pipelines. J. Nat. Gas Sci. Eng. 2024, 128, 205389. [Google Scholar] [CrossRef]
- Farhana, K.; Mahamude, A.S.F.; Kadirgama, K. Comparing hydrogen fuel cost of production from various sources—A competitive analysis. Energy Convers. Manag. 2024, 302, 118088. [Google Scholar] [CrossRef]
- Weerakoon, A.S.; Assadi, M. Techno-economic analysis and performance-based ranking of 3–200 kW fuel flexible micro gas turbines running on 100% hydrogen, hydrogen fuel blends, and natural gas. J. Clean. Prod. 2024, 477, 143819. [Google Scholar] [CrossRef]
- Davis, M.; Okunlola, A.; Di Lullo, G.; Giwa, T.; Kumar, A. Greenhouse gas reduction potential and cost-effectiveness of economy-wide hydrogen-natural gas blending for energy end uses. Renew. Sustain. Energy Rev. 2023, 171, 112962. [Google Scholar] [CrossRef]
- Huang, H.; Sun, X.; Li, J.; Yu, B.; Wang, X.; Pu, M.; Ma, L. Economic analysis of blending hydrogen into natural gas pipelines: Supply chain and station modification. Int. J. Hydrogen Energy 2025, 118, 300–311. [Google Scholar] [CrossRef]
- Zacepins, A.; Kotovs, D.; Komasilovs, V.; Kviesis, A. Economic modelling of mixing hydrogen with natural gas. Processes 2024, 12, 262. [Google Scholar] [CrossRef]
- Ryu, J.Y.; Park, S.; Lee, C.; Hwang, S.; Lim, J. Techno-economic analysis of hydrogen–natural gas blended fuels for 400 MW combined cycle power plants (CCPPs). Energies 2023, 16, 6822. [Google Scholar] [CrossRef]
- Ministry of Energy and Mineral Resources. Summary of the Jordan Energy Strategy for 2020–2030. Available online: https://www.memr.gov.jo/EBV4.0/Root_Storage/EN/EB_Info_Page/Summery_of_the_Comprehensive_Strategy_of_the_Energy_Sector_2020_2030.pdf (accessed on 27 May 2025).
- Ministry of Energy and Mineral Resources. Energy Balance Data 2023. Available online: https://www.memr.gov.jo/ebv4.0/root_storage/en/eb_list_page/energy_balance_2023.pdf (accessed on 26 May 2025).
- Ministry of Energy and Mineral Resources. Draft National Green Hydrogen Strategy for Jordan. Available online: https://www.memr.gov.jo/EBV4.0/Root_Storage/AR/EB_Info_Page/GH2_Strategy.pdf (accessed on 27 May 2025).
- National Electric Power Company. Annual Report 2023. Available online: https://www.nepco.com.jo/store/DOCS/web/2023_EN.pdf (accessed on 28 May 2025).
- Tsakiris, T. The energy security evolution of the Eastern Mediterranean: The rise of Turkish revisionism, its counter-coalitions and the geopolitical significance of the East Med Gas Pipeline. In The New Eastern Mediterranean Transformed: Emerging Issues and New Actors; Springer International Publishing: Cham, Switzerland, 2021; pp. 139–158. [Google Scholar] [CrossRef]
- Al-Rousan, N.; Al-Najjar, H.; Alomari, O. Assessment of predicting hourly global solar radiation in Jordan based on Rules, Trees, Meta, Lazy and Function prediction methods. Sustain. Energy Technol. Assess. 2021, 44, 100923. [Google Scholar] [CrossRef]
- Royal Scientific Society—National Energy Research Centre. About Photovoltaic—Solar Energy. Available online: http://www.nerc.gov.jo/EN/Pages/About_Photovoltaic_EN (accessed on 27 May 2025).
- Alrwashdeh, S.S.; Alsaraireh, F.M.; Saraireh, M.A. Solar radiation map of Jordan governorates. Int. J. Eng. Technol. 2018, 7, 1664–1667. [Google Scholar] [CrossRef]
- Shboul, B.; Zayed, M.E.; Marashdeh, H.F.; Al-Smad, S.N.; Al-Bourini, A.A.; Amer, B.J.; Qtashat, Z.W.; Alhourani, A.M. Comprehensive assessment of green hydrogen potential in Jordan: Economic, environmental and social perspectives. Int. J. Energy Sect. Manag. 2024, 18, 2212–2233. [Google Scholar] [CrossRef]
- Rehman, S.; Kotb, K.M.; Zayed, M.E.; Menesy, A.S.; Irshad, K.; Alzahrani, A.S.; Mohandes, M.A. Techno-economic evaluation and improved sizing optimization of green hydrogen production and storage under higher wind penetration in Aqaba Gulf. J. Energy Storage 2024, 99, 113368. [Google Scholar] [CrossRef]
- Al-Addous, M.; Bdour, M.; Alnaief, M.; Rabaiah, S.; Schweimanns, N. Water resources in Jordan: A review of current challenges and future opportunities. Water 2023, 15, 3729. [Google Scholar] [CrossRef]
- Strategiecs. Water Security in Jordan and Its Future Horizons. Available online: https://strategiecs.com/en/analyses/water-security-in-jordan-and-its-future-horizons (accessed on 28 May 2025).
- Ministry of Energy and Mineral Resources. Projects—Natural Gas Pipeline Project from Aqaba to the North of the Kingdom. Available online: https://www.memr.gov.jo/EN/ListDetails/Projects/72/31 (accessed on 29 May 2025).
- Petroleum Safety & Environmental Services Company. Environmental Impact Assessment Study for El Tina–Abu Sultan Onshore Gas Pipeline Project. Available online: https://www.eib.org/files/pipeline/1162_Eltina_Abusultan_en.pdf (accessed on 29 May 2025).
- American Petroleum Institute. API Specification 5L—46th Edition. Available online: https://www.botopsteelpipes.com/wp-content/uploads/2024/08/API-5L-46th.pdf (accessed on 30 May 2025).
- Cui, D.; Bai, Y.; Xiong, L.; Yu, B.; Wei, B.; Sun, C. Effects of hydrogen blending ratios and CO2 on hydrogen embrittlement of X65 steel in high-pressure offshore hydrogen-blended natural gas pipelines. J. Mater. Res. Technol. 2024, 33, 4763–4771. [Google Scholar] [CrossRef]
- International Energy Agency of Bioenergy. Renewable Gases—Hydrogen in the Grid. Available online: https://www.ieabioenergy.com/wp-content/uploads/2022/02/Renewable-Gases-H2-in-the-grid.pdf (accessed on 30 May 2025).
- Combined Cycle Journal. Best Practices: Amman East. Available online: https://www.ccj-online.com/best-practices-amman-east/#:~:text=,engines%2C%20commissioned%20in%20July%202014 (accessed on 1 June 2025).
- Ansaldo Energia. Hydrogen Technology. Available online: https://www.ansaldoenergia.com/fileadmin/Brochure/AnsaldoEnergia-HYDROGENTECHNOLOGY-20220622.pdf#:~:text=Retrofit%20solution%20for%20AE%2FV94,run%20on%20hydrogen%20up%20to (accessed on 1 June 2025).
- LOTTE E&C. Past Projects—Jordan Al-Qatrana Power Plant. Available online: https://www.lottecon.co.kr/eng/projects/showings?seq=564 (accessed on 2 June 2025).
- Siemens Gas and Power. Hydrogen Power with Siemens Gas Turbines: Reliable Carbon-Free Power with Flexibility. Available online: https://www.infrastructureasia.org/-/media/Articles-for-ASIA-Panel-2021/Siemens-Energy---Hydrogen-Power-with-Siemens-Gas-Turbines.ashx (accessed on 2 June 2025).
- Wärtsilä. Commissioning to Gas Operation Improves Economy and Reduces Emissions—Case Study: IPP3 Power Plant. Available online: https://www.wartsila.com/docs/default-source/services-documents/learning-center/references/w%C3%A4rtsil%C3%A4-reference-ipp3-power-plantada7f54a7f0f601bb10cff00002d2314.pdf?sfvrsn=5ca89545_2 (accessed on 3 June 2025).
- Electric Power Research Institute. Executive Summary—Hydrogen Blending Demonstration at UMERC’s A. J. Mihm Generating Station: Wärtsilä 18V50SG Reciprocating Internal Combustion Engine. Available online: https://www.epri.com/research/products/000000003002026305 (accessed on 3 June 2025).
- Power Technology. Power Plant Profile: Samra Power Plant, Jordan. Available online: https://www.power-technology.com/data-insights/power-plant-profile-samra-power-plant-jordan/?cf-view&cf-closed (accessed on 3 June 2025).
- General Electric Vernova. Gas Turbines—GT13E2 Heavy Duty Gas Turbine. Available online: https://www.gevernova.com/gas-power/products/gas-turbines/gt-13e2 (accessed on 4 June 2025).
- Jordan Times. ACWA Power Zarqa IPP Enters Commercial Operations to Add 485 MW Electricity to National Grid. Available online: https://jordantimes.com/news/local/acwa-power-zarqa-ipp-enters-commercial-operations-add-485mw-electricity-national-grid#:~:text=ACWA%20Power%20Zarqa%20IPP%20enters,agreement%20executed%20in%20September (accessed on 4 June 2025).
- Clarion Events Inc. GE, India’s Largest Power Company Reach Agreement on Co-Firing Hydrogen in Gas Turbines. Available online: https://www.power-eng.com/gas/turbines/ge-indias-largest-power-company-reach-agreement-on-co-firing-hydrogen-in-gas-turbines/#:~:text=GE%20says%20its%20E,may%20need%20to%20be%20modified (accessed on 4 June 2025).
- Cengel, Y.A.; Boles, M.A.; Kanoğlu, M. Thermodynamics: An Engineering Approach, 5th ed.; McGraw-Hill: New York, NY, USA, 2011; p. 445. [Google Scholar]
- Zaichenko, M.N.; Khokhlov, D.A.; Sterkhov, K.V.; Maslov, R.S. An assessment of the feasibility of creating a biofuel-powered CCGT plant. In Proceedings of the 2024 6th International Youth Conference on Radio Electronics, Electrical and Power Engineering (REEPE), Moscow, Russia, 1–2 February 2024; IEEE: Piscataway, NJ, USA, 2024; pp. 1–6. [Google Scholar]
- Gas Processing & LNG. Natural Gas Pipeline Systems and Operations. Available online: http://www.gasprocessingnews.com/articles/2020/04/natural-gas-pipeline-systems-and-operations/ (accessed on 26 June 2025).
- International Energy Agency. The Future of Hydrogen. Available online: https://www.iea.org/reports/the-future-of-hydrogen (accessed on 5 July 2025).
- Giannakoudis, G.; Papadopoulos, A.I.; Seferlis, P.; Voutetakis, S. Optimum design and operation under uncertainty of power systems using renewable energy sources and hydrogen storage. Int. J. Hydrogen Energy 2010, 35, 872–891. [Google Scholar] [CrossRef]
- Khormi, N.A.; Fronk, B.M. Feasibility of high temperature concentrated solar power for cogeneration of electricity and hydrogen using supercritical carbon dioxide receiver technology. In Proceedings of the Energy Sustainability 2023, Washington, DC, USA, 10–12 July 2023; American Society of Mechanical Engineers: New York, NY, USA, 2023; Volume 87189, p. V001T05A005. [Google Scholar] [CrossRef]
- Mendler, F.; Garcia, J.F.; Kleinschmitt, C.; Voglstätter, C. Global optimization of capacity ratios between electrolyser and renewable electricity source to minimize levelized cost of green hydrogen. Int. J. Hydrogen Energy 2024, 82, 986–993. [Google Scholar] [CrossRef]
- Khalid, A.M.; Mitra, I.; Warmuth, W.; Schacht, V. Performance ratio—Crucial parameter for grid connected PV plants. Renew. Sustain. Energy Rev. 2016, 65, 1139–1158. [Google Scholar] [CrossRef]
- Khan, M.A.; Young, C.; Mackinnon, C.; Layzell, D.B. The techno-economics of hydrogen compression. Transit. Accel. Tech. Briefs 2021, 1, 1–36. [Google Scholar]
- General Electric. Hydrogen for Power Generation: Experience, Requirements, and Implications for Use in Gas Turbines. Available online: https://www.gevernova.com/content/dam/gepower-new/global/en_US/downloads/gas-new-site/future-of-energy/hydrogen-for-power-gen-gea34805.pdf (accessed on 7 June 2025).
- Innovation Norway. Conversion Guidelines—Greenhouse Gas Emissions. Available online: https://www.eeagrants.gov.pt/media/2776/conversion-guidelines.pdf (accessed on 7 June 2025).
- Saadeh, O.; Dalala, Z.; Niet, T.; Ramos, E.P.; Howells, M. Technoeconomic data adopted for the development of a long-term electricity supply model for the Hashemite Kingdom of Jordan. Data Brief 2020, 30, 105391. [Google Scholar] [CrossRef]
- European Bank of Reconstruction and Development. Low Carbon Hydrogen Economy in Jordan. Available online: https://www.ebrd.com/content/dam/ebrd_dxp/assets/pdfs/green-economy-transition/EBRD_Policy_Academy.Low_Carbon_Hydrogen_Economy_in_Jordan.pdf (accessed on 8 June 2025).
- U.S. Department of Energy. Clean Hydrogen Production Cost Scenarios with PEM Electrolyzer Technology. Available online: https://www.hydrogen.energy.gov/docs/hydrogenprogramlibraries/pdfs/24005-clean-hydrogen-production-cost-pem-electrolyzer.pdf (accessed on 7 June 2025).
- Electric Power Research Institute. Electrolysis Techno-Economic Analysis—CAPEX Rates. Available online: https://apps.epri.com/lcri-electrolysis-tea/en/capex-rates.html (accessed on 8 June 2025).
- Jenkin, T. Hydrogen Production and the Role Infrastructure: Mainly Storage and Transport Related. Available online: https://www.esmap.org/sites/default/files/2022/Presentations/February_22_2024_v2.1_Hydrogen_and_role_of_storage_and_transportation_related_infrastructure_DRAFT.pdf (accessed on 8 June 2025).
- Ministry of Energy and Mineral Resources. Annual Report 2022. Available online: https://www.memr.gov.jo/ebv4.0/root_storage/en/eb_list_page/annual_report_2022.pdf (accessed on 8 June 2025).
- Fuel Cell & Hydrogen Energy Association. Road Map to a US Hydrogen Economy. Available online: https://fchea.org/press-releases/new-report-offers-road-map-to-us-hydrogen-energy-leadership/ (accessed on 8 June 2025).
- Hydrogen Council. Hydrogen Insights 2023. Available online: https://hydrogencouncil.com/en/hydrogen-insights-2023/ (accessed on 9 June 2025).
- International Energy Agency. World Energy Outlook 2023. Available online: https://www.iea.org/reports/world-energy-outlook-2023 (accessed on 9 June 2025).
- Moran, C.; Deane, P.; Yousefian, S.; Monaghan, R.F. The hydrogen storage challenge: Does storage method and size affect the cost and operational flexibility of hydrogen supply chains? Int. J. Hydrogen Energy 2024, 52, 1090–1100. [Google Scholar] [CrossRef]
Disclaimer/Publisher’s Note: The statements, opinions and data contained in all publications are solely those of the individual author(s) and contributor(s) and not of MDPI and/or the editor(s). MDPI and/or the editor(s) disclaim responsibility for any injury to people or property resulting from any ideas, methods, instructions or products referred to in the content. |
© 2025 by the authors. Licensee MDPI, Basel, Switzerland. This article is an open access article distributed under the terms and conditions of the Creative Commons Attribution (CC BY) license (https://creativecommons.org/licenses/by/4.0/).