Abstract
Given the urgent need to decarbonize the global energy system, green hydrogen has emerged as a key alternative in the transition to renewables. However, its production via electrolysis demands high water quality and raises environmental concerns, particularly regarding reject water discharge. This study employs an experimental and analytical approach to define optimal water characteristics for electrolysis, focusing on conductivity as a key parameter. A pilot water treatment plant with reverse osmosis and electrodeionization (EDI) was designed to simulate industrial-scale pretreatment. Twenty water samples from diverse natural sources (surface and groundwater) were tested, selected for geographical and geological variability. A predictive algorithm was developed and validated to estimate useful versus reject water based on input quality. Three conductivity-based categories were defined: optimal (0–410 µS/cm), moderate (411–900 µS/cm), and restricted (>900 µS/cm). Results show that water quality significantly affects process efficiency, energy use, waste generation, and operating costs. This work offers a technical and regulatory framework for assessing potential sites for green hydrogen plants, recommending avoidance of high-conductivity sources. It also underscores the current regulatory gap regarding reject water treatment, stressing the need for clear environmental guidelines to ensure project sustainability.
1. Introduction
The collapse of the current energy model has resulted in a drive for renewable energies [1]. This results in a need to identify products that minimize the negative impacts of the carbon emissions [2] generated by energy systems based on fossil fuels such as coal, then oil, and now natural gas. Hydrogen has emerged as an alternative fuel to enable decarbonization by maintaining energy generation capacity while reducing CO2 emissions. In this regard, on 7 August 2021, the Intergovernmental Panel on Climate Change (IPCC) indicated that the point of zero emissions must be reached by the year 2050 [3]. The International Energy Agency (IEA) then established a roadmap to reach the point where all hydrogen consumed will be generated from renewable sources, as well as increasing its use in new applications [4]. This results in a prediction that hydrogen consumption will increase from the current value of 70 Mt/year to about 435 Mt/year by 2050, but with no associated emissions due to either its production or consumption. The European Union accepted this challenge by establishing the European Green Pact [5] and the EU Hydrogen Strategy [6], the REPowerEU Plan [7], and the Paris Agreement [8].
Investors and producers (especially large fossil fuel and energy companies) have thus begun a race to develop projects for the renewable production of hydrogen to contribute to this energy transition process. However, despite the tools currently in place, growth is not being achieved at the desired rate owing to technical problems with production, since the installation of production plants does not meet the environmental requirements specified in national regulations. Specifically, one of the most critical problems is to ensure that the waste produced by such plants based on water is acceptable for release into the natural environment. Hydrogen production is based on the extraction of water from a natural system followed by an electrolysis process to separate the hydrogen and oxygen by applying external energy. The electrolyzers used to achieve this rely on water of very high quality, which thus requires previous preparation. This step involves the generation of large amounts of reject water that must be discharged back into natural water cycles. Herein lies the problem, as reject water does not have characteristics suitable for its incorporation into the natural environment, which is not permitted when it exceeds certain parameter values.
A further problem is the additional energy cost required for the electrolysis process, which is increased if the water requires further preparation [9]. Moreover, to achieve green hydrogen production as driven and subsidized by the European Union, this energy must only come from renewable sources. All of these conditions limit the establishment of green hydrogen production plants, but they have not yet been studied sufficiently owing to the relatively recent introduction of these processes [10].
The aim of this work is to identify the most appropriate characteristics and establish a range of water parameter values that will enable the installation of a 2.8-MW microplant for green hydrogen production as recommended by Lima in 2025 [11].
Several phases are required to achieve this final objective:
- A pilot water treatment plant will be designed and built to achieve the conditions required for the electrolyzer of a green hydrogen generation plant.
- A series of experiments will be carried out using this plant to purify water from different natural sources with varying conductivity and hardness values and different origins (groundwater or surface water) to classify water from different sources according to its potential for renewable hydrogen production.
- The characteristics of the reject water produced when using each type of water will be evaluated to assess whether it could be discharged directly into the natural environment or will require previous treatment, which would drastically reduce the profitability of such a plant.
- On the basis of all these results, we aim to establish the water quality limits corresponding to the feasible production of renewable hydrogen on an industrial scale.
2. Materials and Methods
2.1. Construction of a Test Plant to Evaluate Different Types of Water for the Production of Green Hydrogen
2.1.1. Plant Description and Water Requirements
First, an exhaustive literature review of existing techniques for the production of green hydrogen was carried out, revealing that electrolysis is the most widely used and environmentally friendly process [12,13,14,15,16]. The underlying mechanism of production based on water electrolysis is the controlled breakdown of water molecules into hydrogen and oxygen by applying energy obtained from a renewable source. Two partial reactions thereby occur: (1) hydrogen production and (2) oxygen release. Through this process, molecular hydrogen is obtained in a gaseous state in the cathodic zone or at the negative electrode, while oxygen is produced in a gaseous state in the anodic zone or at the positive electrode, under the same conditions.
The water required for such green hydrogen production must undergo a series of processes. The key point regarding the impact of large-scale production is to evaluate the water treatment stage applied to make it suitable for use in the electrolyzer. Only water that is adequately pretreated and that meets the characteristics required by the electrolyzer can be used. The energy required and the number of process steps, and thus the amount of reject water produced, depend greatly on the type of water available as input to the system. Determining the water requirements of the electrolyzer thus becomes very important, to ensure that these requirements can be met.
2.1.2. Electrolyzer Requirements
Four types of commercial electrolyzer exist for such electrolysis processes and are classified according to the type of electrolyte they use [17]: alkaline electrolyzers (AEL/AWE) [18], which use an alkaline solution; polymeric exchange membrane (PEM) electrolyzers [19,20], which rely on a polymeric electrolyte; anion electrolysis membrane (AEM) electrolyzers [21], which use an anionic membrane and combine the principles of alkaline and PEM technologies; and solid oxide electrolyzer cells (SOECs) [22,23], distinguished by the fact that they are composed entirely of ceramic components, with electrolytes made from yttrium-stabilized zirconia (ZrO2) and scandium oxides [24] (Table 1). The operating parameters depend on the type of electrolyzer used, differentiating between those operating at low (AEL/AWE, PEM, and AEM devices) versus high temperature (SOECs). Electrolyzers that require operation at high temperature are less efficient, as resources must be consumed to reach such temperatures. Moreover, note that, among these four types of electrolyzer, the technology for two (SOEC and AEM) is less well developed, as they were introduced only recently, thus requiring further studies to confirm their feasibility [25]. The use of SOEC and AEM/AWE electrolyzers in the pilot plant studied herein was thus ruled out (Figure 1). Another important parameter to consider is the feasibility in terms of the average durability in operating hours, which is longer for PEM and AEL/AWE equipment. Analyzing all these aspects, it was decided to use a PEM-type electrolyzer, which is also the most commercially developed and frequently applied in plants today, as well as offering the lowest water consumption.

Table 1.
A description and comparison of the different types of electrolyzer.
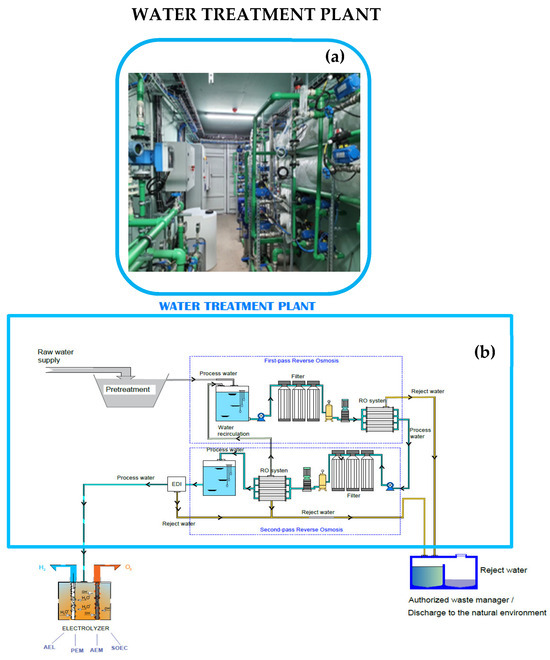
Figure 1.
The technical design of the pilot treatment plant: (a) a photograph of the treatment plant built at the University of León and (b) its technical design.
The operation of all of these technologies requires water, in either liquid (AEL/AWE, PEM, and AEM) or gaseous state (SOEC). Electrolyzers consume an average of 15–20 L of water per kg of H2 produced, typically with conductivity values below 0.1 µS/cm. In this work, we mainly focus on the conductivity, since the other parameters analyzed, e.g., the amount of sulfates and chlorides, temperature, suspended solids, hardness, and pH, are indirectly related to the conductivity value.
The conductivity thus becomes a limiting factor, as it leads to the most difficult requirement to meet among all the parameters considered (Table 1). Using the consumption of the electrolyzer to calculate the total amount of water required to produce green hydrogen is difficult because it also depends on the purity of the initial input water [26]. However, these calculations suggest that, to achieve the objectives set by Europe for 2030 for hydrogen production corresponding to 40 GW, that is, ten million metric tons of renewable hydrogen generation [27], the amount of water required is equivalent to that used in France in eight years, even with optimal water input. This result underlines the importance of studying water in areas of plant implantation, to avoid possible environmental problems due to the availability of water, especially in countries in Southern Europe, which are considered to suffer from high water stress and in terms of the quality of this raw material [28].
A water footprint analysis of the hydrogen production process reveals that the water entering in a plant can be divided into three parts, one recoverable and two non-recoverable. The recoverable part of the water used corresponds to that effectively converted into hydrogen since the consumption of the hydrogen produced will naturally result in the production of water again. The two remaining, non-recoverable portions of water are the cooling water and the reject water. The cooling water part is not recoverable owing to the additives used to increase its performance, but this is used in a closed cycle, so the amount of water that cannot be recovered for this reason is not significant compared with the total water consumed by the plant [29]. But the total amount of reject water is a much more significant quantity, which will depend on the quality of the input water and will be directly proportional to the production volume throughout the entire lifetime of the plant. The fraction of reject water versus that actually converted into hydrogen will depend on the water quality. However, owing to a lack of studies, the specific water volume fractions that will end up as reject water or that are effectively converted into hydrogen are not currently known. Studies of plant efficiency depending on various water characteristics can thus provide critical information for environmental protection by contributing to the optimization of the amount of water consumed during production and minimizing the discharge that must be managed, which is essential to ensure plant viability. The objective is to select the optimal raw or input water so as to minimize the amount of reject water discharged into the river while also enabling cost savings by avoiding the management of large volumes of effluent, as this water would not meet the requirements for unrestricted discharge into the river. Herein lies the importance of this highly practical work, which is imperative owing to the legal vacuum and the lack of information and specific studies on this question of determining the optimal water characteristics for sustainable green hydrogen production. During the water treatment stage prior to entering the electrolyzer, the water is separated into reject water and water for use in production.
2.1.3. Preparation of Water for Entry into the Electrolyzer
This treatment stage, consisting of a sequence of reverse osmosis followed by electrodeionization (EDI), ensures that water with the required characteristics enters the EDI (Figure 1). The osmosis process must be repeated until the water meets the requirements described in Table 1 for the (most common) PEM electrolyzer. The amount of reject water will increase as the required number of osmosis processes increases. Therefore, not all water sources are suitable for hydrogen production, since quality below certain limiting values will result in the production of reject water in quantities that prevent its feasible use. To determine the amount of reject water produced when using different water samples, an experimental treatment plant was designed and constructed in-house (Figure 1). This plant was built at the facilities of the H-4 laboratory at the University of León (León, Spain) and consists of an osmosis + EDI skid unit.
2.1.4. Construction of the Pilot Water Treatment Plant In-House
The design of the prototype treatment microplant to prepare water suitable for hydrogen production followed basic industrial procedures. The most basic industrial osmosis systems always include a double osmosis process. However, for the prototype, a reverse osmosis plant was designed, enabling recirculation before entering EDI equipment. After performing empirical tests using this plant, it was observed that the water recirculated after the second osmosis process could be used, while that recirculated after the first osmosis process never showed improvements in water quality beyond 0.02% of conductivity, so it was not considered for the tests with the different types of water to analyze the optimal characteristics for sustainable H2 green production. Unlike an industrial plant, water samples were monitored before and after each of the reverse osmosis processes in this experimental plant. The ultrapure water needed for electrolyzers requires an initial demineralization pretreatment of the input water (Figure 1 and Table 2) to avoid the formation of metal hydroxide precipitates in subsequent stages [10,30]. Becker et al. and Zhang et al. emphasize that these metallic precipitates are formed during electrolysis because the Ca2+ and Mg2+ ions react with the OH− generated and are deposited on the electrode surface, reducing their efficiency and service life. Subsequently, the water was subject to a demineralization process, for which osmosis was chosen among all the existing technologies, owing to the input volume required. Currently, membrane technologies are used in the water purification sector [31], differing in that some (such as ultrafiltration, microfiltration, nanofiltration, and reverse osmosis) require the application of a pressure gradient, while others (such as electrodialysis) use electricity as the driving force. A combination of reverse osmosis with EDI was chosen here because this also eliminates turbidity (corresponding to organic compounds in Table 2) and retains a greater quantity of salts by eliminating monovalent ions as well as organic compounds of very low molecular weight, as filters have a pore size of approximately 0.0001 microns, enabling the production of high-quality drinking water (Table 2).
Table 2.
Evaluation of the different membrane techniques according to the requirements of the electrolyzer.
The prototype plant (Figure 2) starts with the collection of water in two 100-L tanks (A), where it is also analyzed before undergoing purification treatment. Initially, these 100 L of water are subject to physical pretreatment (B) by fine filtration using a cartridge filter with absolute selectivity of 5 microns. Chemical pretreatment (B) is then carried out using a dosing pump and a tank with 100-L capacity, using an average antifoulant dose of 1.5–3 mg per liter of input or raw water.
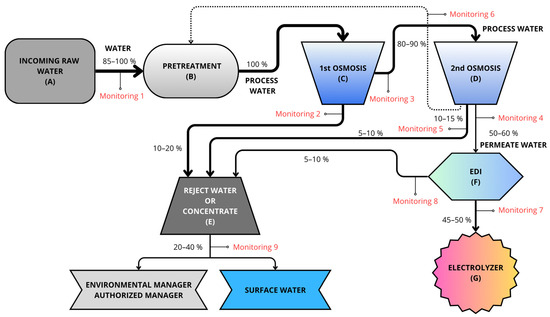
Figure 2.
Water flow before entering the electrolyzer. Gray indicates incoming water, blue implies that it is more deionized, and darker colors indicate higher salt concentration. Therefore, at the end of the treatment, the water appears light blue (deionized water).
The water then undergoes the first reverse osmosis stage (C), a process that combines ion exchange resins and membranes to transfer ionic impurities into a waste or concentrated water stream. The water inlet pressure for these membranes is regulated by using a pump with a frequency controller. This process results in the loss of ions, causing a drop in pH. A pH value of 7.5 is required for the second osmosis stage (D), so bicarbonates are added to increase the pH, then the second reverse osmosis stage is applied. This second reverse osmosis stage results in a very low percentage of reject water. The reject water from both reverse osmosis stages is called the concentrate (E) owing to its high salt content (with almost all the salts that entered in the feed water being concentrated therein). The remaining water is then called demineralized water and is passed to the final, fine-processing stage based on EDI (F). This water treatment technology uses electricity (requiring continuous electrical supply) to remove ions from the water. This results in fully purified water with conductivity below 0.1 µS/cm, which can be fed to the inlet of the electrolyzers (G) to produce green H2. The whole process is monitored so that, if limit values are exceeded, automatic purges and draining can be applied to remove water from the process.
To evaluate the different types of water, a monitoring system was installed (Figure 2). The nine installed monitors are used both to measure parameters and to control the inflow of water into the subsequent tanks, up to a maximum of 100% capacity. An example of this can be seen in Figure 2 (Monitoring 1); the Monitoring 1 line allows 100% water inflow only when the recirculation line from the second reverse osmosis stage does not supply any water. Otherwise, the Monitoring 1 line allows the entry of complementary water (85–90%) so as to reach 100% of the pretreatment tank’s capacity.
On the basis of the hydraulic circuit of the process, this indicates the characteristics of the deionized water in terms of the flow rate, pressure, conductivity, pH, hardness, and dissolved oxygen content, with two sensors for each measurement variable (Figure 2). Two additional channels are provided in each transmitter to read flow and pressure variables.
2.2. Water Performance Analysis Phase
2.2.1. Selection of Different Natural Water Sources for the Production of Green Hydrogen
To consider a broad spectrum of possible water sources that might feed future green hydrogen generators, water from different origins were selected, including 13 from groundwater and 7 from surface sources (Figure 3 and Table 3). In addition to taking the type of source into consideration, these 20 sites were selected by considering the most favorable locations in terms of their proximity to renewable energy sources and access to water catchments, and their water was used in the plant. These sites represent the greatest variability in terms of conductivity, pH, and hardness values. The map shows that, in addition to these 20 sites, 57 other sites have been sampled, but the water from these sites has not been used in the plant.
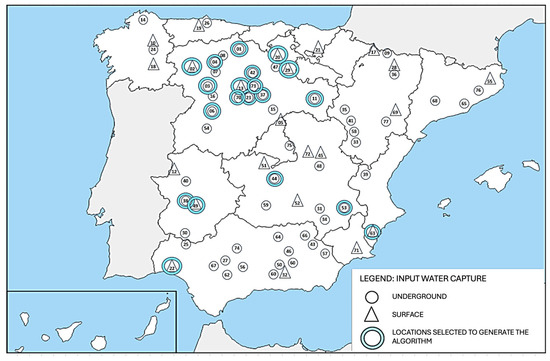
Figure 3.
Location map of water sources used for the raw water treatment pilot plant. Triangles indicate surface springs, while circles indicate underground sources. The numbers indicate each location as indicated in Table 3.
Table 3.
Characteristics of water samples used to evaluate the treatment efficiency, type of soil, type of clays in the area, and conductivity of the water.
Table 3.
Characteristics of water samples used to evaluate the treatment efficiency, type of soil, type of clays in the area, and conductivity of the water.
| Water Characteristics | Köppen–Geiger Climate Classification * [32] | Soil Types | Presence of Clay | Input Water Conductivity (µs/Cm) | |
|---|---|---|---|---|---|
| 01 | Cervera de Pisuerga (Palencia) | Csb | Chalky/rocky | Low | 32.00 |
| 02 | Bembibre (León) | Csb | Slate/clays | None | 39.00 |
| 03 | Santibáñez de Vidriales (Zamora) | Csb | Slate | Low | 55.00 |
| 04 | Villadangos del Páramo (León) | Cfb | Clay–loam | None | 83.00 |
| 05 | Altazar (Madrid) | Csb | Entisols and Inceptisols over shales and sandstones | Low | 94.00 |
| 06 | Villamayor (Salamanca) | Csb | Sandy and sandy loam soils | None | 116.00 |
| 07 | Onzonilla (León) | Csb | Alluvial soils (Fluvisols) and sandy loam | Moderate | 153.50 |
| 08 | Almanza (León) | Csb | Brown chalky and clayey soils | Low | 156.00 |
| 09 | Panticosa (Huesca) | Cfb | Leptosols and poorly evolved mountain soils | None | 183.00 |
| 10 | Lugo (Lugo) | Csb | Umbrisols and Cambisols | None | 214.00 |
| 11 | Almazán (Soria) | Cfb | Fluvisols and Cambisols over alluvial terraces | Moderate | 228.00 |
| 12 | Alcántara (Cáceres) | Csa | Leptosols and Regosols over slate and quartzite | Low | 260.00 |
| 13 | Arroyo de la Encomienda (Valladolid) | Csb | Fluvisols and chalky Cambisols | Moderate | 266.00 |
| 14 | As Pontes (A Coruña) | Csb | Metamorphic soils with the presence of alluvium | None | 275.00 |
| 15 | Muñoveros (Segovia) | Csb | Sandy soils and sandy loam | Low | 288.00 |
| 16 | Manganeses de la Lampreana (Zamora) | Csb | Sandy and silty | Low | 302.00 |
| 17 | Sabiñanigo (Huesca) | Cfb | Alluvial and Quaternary terraces | None | 303.00 |
| 18 | Orense (Orense) | Csb | Acid soils (Umbrisols and Cambisols) and sandy loam. | None | 304.00 |
| 19 | Llanera (Asturias) | Cfb | Deep soils, loamy to clayey loam in texture | Low or moderate | 314.00 |
| 20 | Pineda Trasmonte (Burgos) | Cfb | Brown limestone and clayey soils | None or low | 357.00 |
| 21 | Salvatirra (Álava) | Csb | Soils over alluvial deposits | Low | 375.00 |
| 22 | Palos de la Frontera (Huelva) | sa | Sandy and sandy loam, with alluvial deposits | High | 375.00 |
| 23 | Bercero (Valladolid) | Csb | Luvisols and alluvial terrace soils | Moderate | 387.00 |
| 24 | Lugo (Lugo) | Csb | Shallow with silty or sandy-loam texture | None | 397.00 |
| 25 | Cala (Huelva) | Csa | Regosols and Leptosols over shales and quartzite | High | 418.00 |
| 26 | Silvota (Asturias) | Cfb | Deep soils, loamy to clayey loam in texture | Low or moderate | 430.00 |
| 27 | Marismas (Sevilla) | Csa | Loamy/clayey | High | 441.00 |
| 28 | Jaca (Huesca) | Cfb | Rocky/pebbly | None | 446.00 |
| 29 | Miranda de Ebro (Burgos) | Csb | Claystones, limestones, and sandstones | Low | 463.00 |
| 30 | Cabeza de Vaca (Badajoz) | Csa | Brown limestone and clayey soils | Low | 473.00 |
| 31 | El Bonillo (Albacete) | Csa | Limestone and dolomitic soils | Low | 474.00 |
| 32 | Iznajar (Córdoba) | Csa | Clayey and limestone soils | Moderate | 500.00 |
| 33 | Villarquemado (Teruel) | Cfb | Brown limestone and clayey soils | Moderate | 510.00 |
| 34 | Yeste (Albacete) | Csa | Mediterranean rendzina, brown limestone, and alluvial | Low | 515.00 |
| 35 | Berrueco (Zaragoza) | Cfb | Xerophytic (desert), loose, dusty soils | Low | 516.00 |
| 36 | Jaca (Huesca) | Cfa | Fluvisoles, Leptosoles, Cambisoles | None | 533.00 |
| 37 | Rueda (Valladolid) | Cfa | Sandy loam and limestone soils | Moderate | 572.00 |
| 38 | La Venta Usagre (Badajoz) | Csa | Brown limestone and clayey soils | Low | 576.00 |
| 39 | Requena (Valencia) | Csa | Fluvisols and Cambisols with clay accumulation | Low | 617.00 |
| 40 | Torico (Cáceres) | Csa | Leptosols and Regosols developed over shales | Low | 636.00 |
| 41 | Used (Zaragoza) | Cfb | Ordovician quartzites and dolomitic limestones | Low | 664.00 |
| 42 | Villaviudas (Palencia) | Cfb | Rendzinas with brown limestone soils in higher areas | Moderate | 667.00 |
| 43 | Puebla de Don Fabrique (Granada) | BSk | Chalky and clayey soils over Mesozoic materials | Low | 670.00 |
| 44 | Fuensalida (Toledo) | BSk | Fluvisols and Cambisols over alluvial materials | Low | 706.00 |
| 45 | Nohales (Cuenca) | Csa | Chalky and clayey soils | Moderate | 712.00 |
| 46 | La Guardia de Jaén (Jaén) | BSk | Clayey and limestone soils | Moderate | 720.00 |
| 47 | Miranda de Ebro (Burgos) | Cfb | Clayey, limestone, and sandstone soils | Low | 788.00 |
| 48 | Villarez de Saz (Cuenca) | Csa | Limestone and clayey soils over Mesozoic materials | Moderate | 823.00 |
| 49 | Torremejia (Badajoz) | Csa | Southern brown earth and clayey red soils | Low | 927.00 |
| 50 | Colomera (Granada) | Csa | Limestone and clayey soils over Mesozoic materials | Low | 970.00 |
| 51 | Villamiel de Toledo (Toledo) | BSk | Fluvisols and Cambisols over alluvial materials | Moderate | 1060.00 |
| 52 | Argamasilla de Alba (Ciudad Real) | BSk | Clayey loam and chalky clay soils | Moderate | 1080.00 |
| 53 | Chinchilla de Montearagón (Albacete) | BSk | Limestone, clayey, and gypsiferous soils | Moderate | 1087.00 |
| 54 | Calzada de Don Diego (Salamanca) | Csb | Sandy and sandy loam over granitic peneplains | Low | 1100.00 |
| 55 | Santa Julia de Ramis (Girona) | Cfa | Granitic and alluvial materials | None | 1160.00 |
| 56 | Puente Genil (Córdoba) | BSk | Clayey and limestone soils | Moderate | 1240.00 |
| 57 | Orce (Granada) | BSk | Calcium Cambisols and chalky Regosols | Low | 1250.00 |
| 58 | Moreal del Campo (Teruel) | Cfb | Brown limestone and clayey soils over Tertiary soils | Moderate | 1263.00 |
| 59 | Almagro (Ciudad Real) | BSk | Clayey and limestone soils with Miocene sediments | Moderate | 1431.00 |
| 60 | Montejicar (Granada) | BSk | Limestone, clayey, and marly limestone Subbetic mountain ranges | Moderate | 1480.00 |
| 61 | Vega de Granada (Granada) | BSk | Fluvisols with alluvial soils, with clay–loam texture | Moderate | 1677.00 |
| 62 | Sierra de los Caballos (Sevilla) | Csa | Limestone, clayey and stony with Mesozoic material | High | 1786.00 |
| 63 | Santa Cruz De La Muela (Alicante) | BSh | Clayey and limestone soils | Moderate | 1800.00 |
| 64 | Bailen (Linares) | BSk | Strongly to slightly chalky soils | Moderate | 1826.00 |
| 65 | L’Hospitalet de Llobregat (Barcelona) | Csa | Alluvial soils with Fluvisols | Low | 1880.00 |
| 66 | Navas de San Juan (Jaén) | Csa | Marls, clays, and gypsum | High | 1887.00 |
| 67 | Carmona (Sevilla) | Csa | Alluvial and chalky soils | High | 1975.00 |
| 68 | Verdu (Lleida) | BSk | Chalky and sandy loam soils over Tertiary soils | Moderate | 2010.00 |
| 69 | Caspe (Zaragoza) | BSk | Chalky, stony, and loose soils over Tertiary soils | Moderate | 2300.00 |
| 70 | Peñafiel (Valladolid) | Csb | Sandy loam and limestone soils | High | 2580.00 |
| 71 | Mazarrón (Murcia) | BSk | Soils with chalky crust and ferruginization | High | 2800.00 |
| 72 | Torrejoncillo Del Rey (Cuenca) | Cfb | Chalky and clayey soils over Mesozoic materials | Moderate | 2834.00 |
| 73 | Villafuerte (Valladolid) | Csb | Chalky moor and sandy or sandy loam soils | High | 3126.00 |
| 74 | La Luisiana (Sevilla) | Csa | Alluvial Fluviosols and clayey soils | High | 3285.00 |
| 75 | Mejorada del Campo (Madrid) | Csa | Soils with chalky crust and ferruginization | High | 3380.00 |
| 76 | Girona (Girona) | Cfa | Sandy loam to clay–loam soils | Low | 3563.00 |
| 77 | Caspe (Zaragoza) | BSk | Chalky, stony, and loose soils over marls | High | 3857.00 |
Notes: Based off of a geological map and map of risk prevention due to clay expansivity in Spain (Geological and Mining Institute of Spain (IGME)). Numbers in blue indicate that water samples taken at these points were used for algorithm development. * BSh: hot steppe; BSk: cold steppe; Csa: temperate with a dry or hot summer; Csb: temperate with a dry or temperate summer; Cfa: temperate with a dry season and hot summer; Cfb: temperate with a dry season and temperate summer.
Water analysis was performed by an authorized laboratory using samples collected on site at each of the 20 locations in blue (Figure 3 and Table 3). These 20 locations were selected on the basis of a proportional distribution according to the Köppen–Geiger climate classification, ensuring the inclusion of both groundwater and surface water samples. From each location, 175 L was collected, of which 25 L was used for analysis, 100 L for purification by the treatment process in the pilot water treatment plant, and 50 L for recirculation in the circuit. The water was collected in three 50-L polyethylene containers for input into the treatment plant described above (Point A in Figure 2). In the first pretreatment phase, relying on decantation and filtration (Point B in Figure 2), visible impurities such as stones, plant debris, and microorganisms were removed. Subsequently, chlorine was added and left to act for two hours. Then, the free chlorine particles and colloids were mainly removed. The water flowed through the double-pass reverse osmosis stages (Point C and Point D in Figure 2), while the permeate and intermediate water was monitored at monitoring points 2 (reject water) and 3 (water continuing in the process to the second reverse osmosis stage). After the second reverse osmosis stage, the water was divided into three streams: 10–15% was sent to the pretreatment tank (monitoring point 6), 5–10% was directed to reject water or concentrate (monitoring point 5), and 50–60% continued in the process toward EDI (monitoring point 6). During EDI, the water was treated by electrodeionization to remove the remaining ions, again generating reject water (monitoring point 8). Finally, the water leaving the EDI passed by an ultraviolet lamp for bacteria reduction treatment, where a water sample was also taken (monitoring point 7), before passing through to the electrolyzer to confirm that it had the desired composition according to the requirements of the electrolyzer.
2.2.2. Analysis of Existing Water Legislation
In addition to meeting the minimum requirements for the feed water at the electrolyzer input, it is also essential to define the minimum parameters for discharge of the water generated by the hydrogen generation plant so as to determine whether the reject water can be discharged directly into the environment.
Water legislation defines discharge as the act of introducing water with parameter values that exceed certain limits or contain pollutants by mixing it with inland water or with the rest of the public water system [33]. Hydrogen production, being an industrial activity, must comply with these parameter limits. Currently, there is no specific Spanish or European legislation defining the limits and specific parameters in relation to discharges generated during renewable hydrogen production. Given this lack of an established standard to define maximum allowable values, we studied the limit values found in both legislation and literature to determine the limiting conductivity value that might affect the receiving system. Conductivity values above this would require further treatment by an authorized waste manager or the application of other systems such as forced vacuum evaporation to reduce the conductivity.
The results presented in Table 4 indicate that conductivity values below 1000 µS/cm do not affect crops, human health, or freshwater species. Meanwhile, water with conductivities above 6000 µS/cm would not be appropriate for any use. Also, water with higher conductivity can only be used for certain crops.
Table 4.
Conductivity limit values, the sector affected, and information source.
Table 4.
Conductivity limit values, the sector affected, and information source.
| Limit Values | Sector Affected | Source |
|---|---|---|
| >6000 µS/cm | Crops | [34] Ismayilov et al. (2021) |
| >5000 µS/cm | Surface water | [35] Degree 141/2012, of June 21 (Galicia, Spain) |
| Human health | [36] Martín and Ángel (2023) | |
| >4000 µS/cm | Surface water | [37] R.D 38/2004, BOA 10 March 2004, (Spain) |
| Irrigation | [34] Ismayilov, A., et al. (2021) | |
| >3000 µS/cm | Irrigation | [34] Ismayilov, A., et al. (2021) [38] Álvarez, M., et al. (2004) |
| Crops | [39] Pérez-Vázquez et al. (2020) | |
| >2500 µS/cm | Human consumption | [40] European Directive 2020/2184 [41] European Directive 98/83/EC [42] European Council Directive 98/83/EC, 1998 [43] R.D. 1138/90 of 14 September 1990 [44] R.D. 140/2003 |
| >2000 µS/cm | Freshwater species | [45] Flores and Jara (2017) [46] Cañedo-Argüelles et al. (2016) |
| >1800 µS/cm | Discharges into the natural environment | [47] R.D. 606/2003 (CNAE 3519) |
| >1000 µS/cm | Human consumption | [31] Solís-Carvajal (2017) [39] European Council Directive 75/440/EEC of 16 June 1975 |
| Crops | [48] Porta and Herrero (1996) |
2.2.3. Trial Monitoring and Data Collection
The water samples of the 20 sites were introduced into the pilot pretreatment plant while monitoring the most important parameters (conductivity, alkalinity, hardness, and contents of different minerals) in each of the stages. All of the parameters were found to be related to conductivity. As it was impossible to perform a continuous process in the pilot plant, the analysis was performed by introducing 150 L and analyzing a volume of 100 L per sample.
2.2.4. Analysis of Results
After each stage of the pilot plant process, the following parameters were measured: temperature, flow rate, pressure, conductivity, pH, hardness, and dissolved oxygen content.
The following monitoring equipment was used, with two sensors per variable: for conductivity, Hamilton Conducell in-line sensors with a range of 0.1 µS/cm to 200 mS/cm; for pH, Mettler Toledo glass electrode sensors; for flow rates, Endress + Hauser Promag electromagnetic flowmeters; for pressure, WIKA S-20 transducers for input values between 10 and 15 bar; for temperature, a PT100 resistance temperature detector; for dissolved oxygen, Mettler Toledo optical sensors; and for hardness, HACH HQ440D automatic titrators. All these parameters were monitored by using a centralized system for data acquisition and alarms (SCADA, Siemens WinCC, Loveland, Colorado–EEUU).
2.3. Development of an Algorithm to Estimate the Amounts of Reject Water and Usable Water
With the detailed results from the pilot pretreatment plant, with 13 groundwater samples and 7 surface samples, an algorithm was developed (Figure 3 and Table 3). After introducing 100 L of each of these water samples into the constructed pretreatment plant, we studied the values of temperature, flow rate, conductivity, pH, and hardness obtained after each stage of the process. These data were input into the ChatGPT Version 1.2025.203 artificial intelligence system, asking it to integrate them into Python version 3.13.2.
The algorithm is based on the following main formulas (Equation (1)):
Conductivity of filtered water, process water, or output water: C_filtered = C_input × (1 − salt_rejection)
Reject water conductivity (by mass balance): (inflow_flow × inflow_conductivity) = (filtered_flow × filtered_conductivity) + (reject_flow × reject_conductivity)
Filtered or process water flow rate: filtered_flow = input_flow × recovery
Reject water flow rate: reject_flow = input_flow − filtered_flow
On the basis of this analysis and simulations, a program was generated (registered as intellectual property with code 00765-02622024) to predict, using data for the conductivity of water streams, the potential production of reject and output water when used in a hydrogen plant.
This algorithm was subsequently validated via analysis of 26 other new water samples (13 surface and 13 groundwater) (Table 8) that were also introduced and monitored after putting in the treatment plant to compare the results obtained by the algorithm with the final results obtained when using the plant.
Finally, the algorithm was applied to 46 water samples that had not been tested in the plant to calculate the amount of water that would theoretically have to be managed to implement such a hydrogen generation plant with water from each source (Figure 4).
2.4. Determination of the Limit Values Corresponding to Optimum, Moderate, and Restricted Water Quality for Green Hydrogen Production
On the basis of the analysis of our 20 tests monitored in the experimental treatment plant (Table 5), it was possible to determine the conductivity and volume of the reject water that would be generated by such a plant when installed. There are legal and health requirements, as recommended and described in Section 2.2.2 (Table 4), which demand the management and treatment of water with values above certain limits. Combining these two concepts, one can determine the maximum conductivity of the input water that will result in reject water exceeding established limit values. Using this information, three grades of water quality for hydrogen production were determined with the following values:
Table 5.
Conductivity values of the reject water measured for the 20 water sampling points selected for the algorithm design.
- Optimum: when the incoming raw water has a conductivity between 0 and 410 µS/cm.
- Moderate: when the incoming raw water has a conductivity between 411 and 900 µS/cm.
- Restricted: when the incoming raw water has a conductivity above 900 µS/cm.
These parameters, together with the algorithm, allowed us to classify the 77 water samples whose conductivity was measured into qualities and to analyze the geographical distribution and its relationship with groundwater and surface water locations (Figure 3).
3. Results and Discussion
3.1. Analysis of the Limit Values in Legislation
Our search of current legislation showed that high water conductivity is a critical indicator of contamination and salinization, having adverse effects on health and the environment, so its control is essential to ensure the sustainability and viability of renewable hydrogen production plants.
There is no harmonized standard, and limits vary according to the Water Framework Directive (WFD), which prioritizes the non-alteration of ecosystems. The absence of a single conductivity standard requires case-by-case analysis, prioritizing the receiving medium and subsequent uses of the water.
3.2. Flow Analysis and Water Analysis at the Pretreatment Plant
The analysis of the flow rate, hardness, conductivity, and pH for water from the 20 water sampling points showed that all these parameters are related to conductivity, so the conductivity is the parameter with the highest influence on the possible behavior of the water for generation of hydrogen [49,50]. According to the flow analyses throughout the pretreatment plant, shown in Figure 2, the reject water has a higher flow rate after the first osmosis, but this decreases after the second osmosis and after EDI.
It is observed from these results that surface water is slightly more optimal than groundwater (46% versus 57%), considering that surface water benefits from dilution of salts via precipitation. However, this difference is minimal, and industrial uses of surface water are always subject to the requirement to maintain natural flows and supply urban centers. Therefore, when possible, it is preferable to obtain water from groundwater sources rather than directly from surface water, owing to the greater flow stability, reduced susceptibility to short-term seasonal and climatic variations, and less exposure to immediate regulatory restrictions, especially for an industrial process where operational continuity, predictability of supply, and minimization of risks from external factors are paramount.
The viability of green hydrogen production plants is directly related to the quality of the water used, mainly its conductivity, but no reference values are available to help delimit the suitability of water when installing such a plant. This value is of great interest since the amount of reject water produced by a plant, as well as the cost of the maintenance and membranes in the plant, will increase strongly when water with high conductivity is used. After empirically analyzing these reference values, it was found that water with conductivity values below 410 µS/cm would be optimal. Such water will allow the generation of reject water with salinity suitable for discharge directly into the environment, and always at quantities of less than 30% of the input water entering the plant, which also reduces the consumption of raw materials as well as the cost of membranes (Table 5). Conductivity values between 410 and 900 µS/cm mean managing volumes of reject water that approach 50% of the input water volume (Table 5), associated with much higher maintenance costs. In addition, the electricity consumption will be almost three times higher than in green areas (consumption of ~1.32 kWh/m3 in green areas versus ~3.88 kWh/m3 in red areas).
In addition, hydrogen production in such areas may suffer from interruptions at certain times of the year when environmental restrictions prohibit discharge above certain regulatory limits. The results of this study also show that input water with conductivity values above 900 µS/cm will make the process nonviable, owing to the strong increase in the cost of membranes used in the plant as well as the management of reject water volumes that could reach up to 80% (Table 5).
Raw water with conductivity values below 410 µS/cm has quality suitable for hydrogen production, generating reject water with salinity values suitable for direct discharge into the receiving medium. Meanwhile, the consumption of raw materials necessary for the operation of the renewable hydrogen plant is also reduced.
Several conclusions can be drawn from Table 5. The first and most obvious is that the conductivity of the input water is closely related to the conductivity of the reject water, increasing by approximately threefold while passing through the plant.
However, the table also reveals that, when using input water from locations with the highest water quality, that is, optimum quality, the reject water volume is always less than 20% of the input water. Meanwhile, when the water quality is moderate, this reject water can reach 20–35% of the input water, and for restricted water levels, at least 47% of the input volume will end up as reject water. Indeed, for a plant where the conductivity of the input water exceeds 1800 µS/cm, the reject water would account for almost 56% of the total. Moreover, this reject water would have such an increased conductivity that it would require prior treatment before discharge into the receiving medium, via an authorized waste manager.
This means that, to produce 1 kg of green hydrogen with a PEM-type electrolyzer, the most widely used today, about 21 L of input water classified as optimal quality would be required, while up to about 38 L of water in the restricted category would be needed. For hydrogen production plants using other types of electrolyzers, a theoretical estimate of the water consumption required for the production of 1 kg of green hydrogen is presented in Table 6, revealing that AEL/AEW-type electrolyzers would require the most water, reaching almost 44.44 L in the worst conditions.
Since the water consumption depends on the electrolyzer type and water quality, we do not propose using only the amount of water available as a viable indicator for selecting a particular location for a hydrogen generation plant. This study shows that, as pointed out in other works [51], water consumption for green hydrogen production is not very high, since the water is partly returned to the receiving medium. The analysis reveals that, if current energy demands were to be met only through the production of green hydrogen, the water consumption required would be only a very small percentage of the volume of water consumed worldwide for energy production currently, namely 0.6%.
The results of this study argue instead for a dual indicator for the location of hydrogen generation plants that considers both the quantity and quality of water available, with the quality of the available water being the most important indicator. The main contribution of this work is the proposed classification of input water quality, which will make it possible to minimize risks related to increased production costs and predict feasibility as early as the implementation and performance study phases of projects under development.
Table 6.
Average amount of input ultrapure water required (in liters) to produce 1 kg of green hydrogen depending on the water quality and the type of electrolyzer (AEL/AWE, PEM, AEM, or SOEC).
Table 6.
Average amount of input ultrapure water required (in liters) to produce 1 kg of green hydrogen depending on the water quality and the type of electrolyzer (AEL/AWE, PEM, AEM, or SOEC).
| Water Quality | Percentage Average Water Use | Ultrapure Water Required to Generate 1 kgH2 [52] | |||||||
|---|---|---|---|---|---|---|---|---|---|
| Category | |||||||||
| AEL/AWE [53] | PEM [53,54] | AEM [55] | SOEC [56] | ||||||
| 15 l | 22.3 l | 11 l | 17 l | 13 l | 18 l | 10 l | 16 l | ||
| Optimum | 81% | 18.52 | 24.69 | 13.58 | 21.01 | 16.05 | 22.22 | 12.35 | 19.75 |
| Moderate | 75% | 20.00 | 26.67 | 14.66 | 22.68 | 17.33 | 23.98 | 13.33 | 21.33 |
| Restricted | 45% | 33.3 | 44.44 | 24.44 | 37.74 | 28.88 | 40.00 | 22.22 | 35.56 |
Therefore, when designing a green hydrogen production plant, raw water being of poor quality, especially in areas with water conductivity values above 900 µS/cm, means an increase in the raw water flow consumption, an increase in the energy required for the reverse osmosis process, and an increase in discharges with high conductivity requiring treatment by an authorized waste manager. This entails a high production cost. Normally, costs corresponding to wastewater treatment after the osmosis and EDI stages are not calculated for projected renewable hydrogen production plants, since it is assumed that the wastewater will have properties appropriate for direct discharge into the receiving environment or the existing sewage system, but this is not the case. The costs of replacing the membranes when they are clogged, which will occur much more frequently in the case of raw water with low quality, are also not taken into account. Hydrogen production with water in the restricted category would face frequent interruptions, in addition to being exposed to the risk of uncertainties surrounding environmental regulations regarding discharge management and obtaining combined environmental authorization, in extreme cases making the plant unfeasible. This classification could also be useful for the design of plants of different sizes and powers by scaling the flow requirements.
Intensive research is currently being conducted on both fuel cell and electrolyzer components to reduce costs and make hydrogen technology more competitive. However, a technically and economically viable technology or system that can meet the limits for the dissolved salt concentration in the reject water discharged into the receiving environment has yet to be developed.
In addition, to study the temporal stability and the effect of the different seasons, in case of changes in the water table through the year, we selected 11 random points from the 20 blue points in Table 3 (Table 7) representing the most frequent Köppen–Geiger climate types (BSk, Csa, Csb, Cfb). Water from these 11 points was resampled after a few months and reintroduced into the plant to analyze the conductivity of the reject water. These results revealed that the water quality classification remained constant for all values except site 44. In the first sampling, site 44 was placed in the moderate category but was very close to the cut-off for the restricted group, to which it switched when the water table dropped.
Table 7.
Comparison of conductivity values measured in water taken at 11 points on two occasions over time, showing the temporal variability of conductivity over time.
Having established that the quality and quantity of the incoming raw water are the indicators necessary to determine the optimal location of the plant, it became essential to develop a tool that, on the basis of an analysis of the input water and flow rate, could determine the hydrogen production achievable with a given electrolyzer. Under this premise, a validation algorithm was designed and developed.
3.3. Algorithm Development and Validation
On the basis of a very simple and efficient analysis of conductivity, the designed algorithm estimates the costs of an installation in terms of the water to be treated as well as the electricity and membrane consumption.
The validation of the algorithm revealed that the relative error between the predicted values and those obtained by the algorithm was a maximum of 4.54% with respect to the real values (Table 8), confirming that the algorithm is valid to justify the location of a specific power plant. This validation is suitable for both groundwater and surface water sources.
Table 8.
Validation of the designed algorithm.
Following its validation, the algorithm was extended to locations of the Iberian landmass representing different geologies and edaphological characters (Table 3). The results revealed no relationship between the data calculated using the algorithm and the geology at each site, or with the different edaphological characteristics. This lack of relationship makes sense considering that the water will have passed through different agricultural or industrial lands that could significantly alter its conductivity by mixing with certain byproducts; in addition, changes could occur owing to hydromorphological alterations due to channeling or intensive extraction, or the presence of pathogenic microorganisms such as E. coli and Streptococci sp. associated with poor health practices and variations in pH and hardness due to the dissolution of minerals or the introduction of chemical residues. In addition, the breadth of the geologic map, which includes many different geologic characters in each square, greatly hinders any comparison with specific water sampling points, yielding inconclusive results. However, an effect on the quality of water is found when correlating the classification of the sampling points with the map of clays (Figure 4). It appears that, in those locations where there is no clay or low-expansivity clay, the water seems to have better quality for use in green hydrogen production. The relationship between water conductivity and clays is determined by the physicochemical and hydrodynamic mechanisms that influence the expansivity and electrical properties of these materials. In the case of sulfate-rich clays, the concentration of sulfates (SO42) would be directly linked to their electrical conductivity since these chemicals dissociate in water, releasing mobile ions that contribute significantly to the water’s ability to carry electric current.
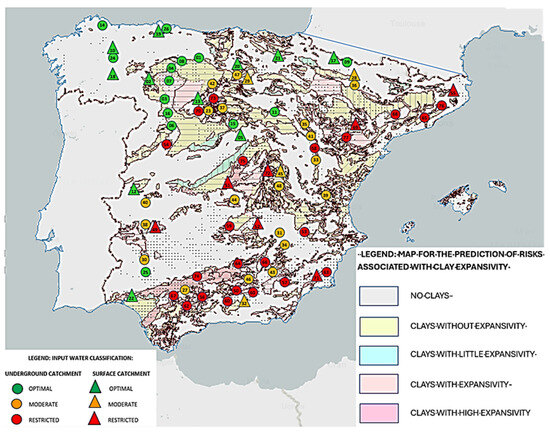
Figure 4.
Predictive Map of Risks due to Clay Expansivity (Geological and Mining Institute of Spain (IGME)), with the location of the selected [57] water sampling points overlaid. Optimal or higher-quality water locations are indicated in green, moderate or medium-quality water sources in orange, and restricted-quality water sources in red. Circles indicate underground sources, while triangles indicate surface sources. Numbers indicate each location as indicated in Table 3.
Researchers such as Coitiño López [58] have indicated that water sources located on the margins of surface water bodies (rivers, reservoirs, etc.), especially those with shrub vegetation, as well as areas with detrital aquifers and granitic (not chalky) soils, usually have more suitable conditions in terms of conductivity, so these would be more suitable sites for the production of green hydrogen. Installations on sedimentary rock are less beneficial since this implies higher conductivity [57]. Our analysis of the sampling data herein confirms these results.
Finally, it is interesting to note that this analysis in the Iberian Peninsula could be extrapolated to the European Union, as it includes locations with very different geomorphological and catchment characteristics. This could contribute to the development of a more intelligent management policy and the promotion of green hydrogen production in Europe. However, such management would require the establishment of standards to regulate the quality of input water and associated conductivity limits to ensure the sustainability of the renewable hydrogen industry.
The current results align with the sixth Sustainable Development Goals related to efficient water management and water stress reduction, indicating that sustainable water management is essential for energy production and the preservation of aquatic ecosystems [59]. Indeed, the sustainability of green hydrogen production plants is more related to adequate water quality in terms of conductivity than to being located in areas with abundant renewable resources, which is the parameter used currently.
4. Future Research
This study highlights the issues related to the installation of green hydrogen production plants and the establishment of water quality values to draft the necessary compliance standard specifying the limiting parameters for the quality of the raw input water, as well as the annual volumes of extraction permits that regulate this type of activity in a sustainable manner. We look forward to contributing to the development of this legislation in the future.
5. Conclusions
The following conclusions can be drawn from the work carried out in this research:
1. There is no legislation or literature describing established limit values for hydrogen production. At present, a legal vacuum exists regarding hydrogen generation plants with respect to protocols for which parameters should be analyzed when it comes to sampling reject water. Instead, one must refer to general regulations applicable to industrial production, which do not take into account the specific characteristics of electrolysis processes, which result in an increase in the concentration of salts and very high conductivity. Therefore, we recommend the development of specific regulatory frameworks to define such parameters and help drive hydrogen production, reducing the uncertainty faced by companies in this sector; this would be highly beneficial for society, as it would guarantee a sustainable and responsible process.
2. From the analysis of the parameters of the water produced during generation of hydrogen, it can be concluded that conductivity is the most important parameter when it comes to classifying the viability of using a given water source for green hydrogen production, as this affects both the technical and economic viability of the electrolysis process. A criterion has thereby been established to classify raw water from different locations according to its potential for green hydrogen production on the basis of conductivity.
3. Tests in a pilot plant confirmed that, for input water conductivities above 900 µS/cm, the production of reject water and waste from the filters would compromise the viability of the process by greatly increasing the operating costs, the consumption of raw materials, and the generation of waste not suitable for direct discharge into the receiving environment, making such green hydrogen production plants unfeasible. A comparative calculation of the average amount of water required to produce 1 kg of renewable hydrogen using water of different quality and different types of electrolyzer revealed values between 21 and 58 L. We have proposed a classification of natural water from various locations based on their conductivity to determine the potential usefulness of water from these locations for green hydrogen production.
4. An algorithm was developed and validated in Python to enable the automatic determination of the amount of reject water production, as well as the consumption of membranes required during the production process. The results of the algorithm indicated the flow behavior and the flow rates and conductivities in each part of the plant, with a maximum difference of 5% with respect to the real values, which will facilitate decision-making regarding location selection and the initial stage of project evaluation. This study involved the selection of 20 (algorithm development) + 26 (validation of the algorithm) water sampling points on the basis of their variability and proximity to renewable sources and water access. This underlines the importance of prior detailed hydrogeological analyses to ensure adequate water supply and minimize the impact of water stress, especially in vulnerable regions.
5. This paper has demonstrated that the quality of the input water used at the pretreatment plant and the efficiency of the purification process (reverse osmosis and EDI) are crucial not only to the performance of the PEM electrolyzer but also when it comes to minimizing the volume of reject water. The need to manage large volumes of reject water, especially when not meeting the parameter requirements for direct discharge, can drastically reduce the profitability and sustainability of such plants.
6. The pilot plant designed in this study includes a detailed monitoring system, and an algorithm to estimate the amount of reject and useful water was developed. These tools are vital for real-time decision-making, the fine-tuning of treatment processes, and prediction of performance on the basis of the input water quality.
6. Patents/Records
The algorithm resulting from this research has been registered under file number 00765-02622024 on 6 June 2025.
Author Contributions
Conceptualization, M.Á.-M. and M.F.-R.; Methodology: M.Á.-M., M.F.-R. and G.B.-S.; Investigation, M.Á.-M. and M.F.-R.; Resources, M.Á.-M.; Writing—Original Draft Preparation, M.F.-R. and G.B.-S.; Writing—Review & Editing, M.Á.-M., G.B.-S. and M.F.-R. Supervision, G.B.-S. and M.F.-R. Project administration, M.F.-R.; All authors have read and agreed to the published version of the manuscript.
Funding
This research received no external funding.
Data Availability Statement
The data presented in this study are available on request from the corresponding author.
Acknowledgments
We thank Global Virtualizza Ingenieros for their technical support and expertise in green hydrogen projects and water resource management, which were essential for the design and implementation of the pilot plant and the experimental validation in this study. Their specialized collaboration was key to the quality and relevance of the results obtained. This work also benefited from institutional support and laboratory facilities that enabled the experimental analyses required to characterize the water samples and validate the predictive algorithm developed.
Conflicts of Interest
The authors state that they have no conflicts of interest.
Abbreviations
The following abbreviations are used in this manuscript:
| EDI | Electrodeionization |
| IEA | International Energy Agency |
| AEL/AWE | Alkaline electrolyzers |
| PEM | Polymeric exchange membrane |
| AEM | Anion electrolysis membrane |
| SOEC | Solid oxide electrolyzer cells |
References
- Jacobson, M.Z. 100% Clean, Renewable Energy and Storage for Everything; Cambridge University Press: Cambridge, UK, 2020. [Google Scholar]
- Kharissova, A.B.; Kharissova, O.; Kharisov, B.; Méndez, Y.P. Carbon negative footprint materials: A review. Nano-Struct. Amp Nano-Objects 2024, 37, 101100. [Google Scholar] [CrossRef]
- Intergovernmental Panel on Climate Change. Climate Change 2021—The Physical Science Basis: Working Group I Contribution to the Sixth Assessment Report of the Intergovernmental Panel on Climate Change, 1st ed.; Cambridge University Press: Cambridge, UK, 2023. [Google Scholar] [CrossRef]
- Bouckaert, S.; Pales, A.F.; McGlade, C.; Remme, U.; Wanner, B.; Varro, L.; D’Ambrosio, D.; Spencer, T. Net Zero by 2050—A Roadmap for the Global Energy Sector; International Energy Agency: Paris, France, 2021. [Google Scholar]
- Consejo Europeo, 12 y 13 de Diciembre de 2019—Consilium. Available online: https://www.consilium.europa.eu/es/meetings/european-council/2019/12/12-13/ (accessed on 10 January 2024).
- TA-9-2021-0241_ES.pdf. Available online: https://www.europarl.europa.eu/doceo/document/TA-9-2021-0241_ES.pdf (accessed on 10 January 2024).
- REPowerEU. Available online: https://commission.europa.eu/topics/energy/repowereu_en (accessed on 8 July 2025).
- United Nations. Adoption of the Paris Agreement. 2015. Available online: https://unfccc.int/resource/docs/2015/cop21/eng/l09r01.pdf (accessed on 26 January 2024).
- Terlouw, T.; Bauer, C.; McKenna, R.; Mazzotti, M. Large-scale hydrogen production via water electrolysis: A techno-economic and environmental assessment. Energy Environ. Sci. 2022, 15, 3583–3602. [Google Scholar] [CrossRef]
- Becker, H.; Murawski, J.; Shinde, D.V.; Stephens, I.E.L.; Hinds, G.; Smith, G. Impact of impurities on water electrolysis: A review. Sustain. Energy Fuels 2023, 7, 1565–1603. [Google Scholar] [CrossRef]
- Lima, A.; Torrubia, J.; Valero, A.; Valero, A. Non-Renewable and Renewable Exergy Costs of Water Electrolysis in Hydrogen Production. Energies 2025, 18, 1398. [Google Scholar] [CrossRef]
- Lim, T.; Kim, S.-K. Non-precious hydrogen evolution reaction catalysts: Stepping forward to practical polymer electrolyte membrane-based zero-gap water electrolyzers. Chem. Eng. J. 2022, 433, 133681. [Google Scholar] [CrossRef]
- Marouani, I.; Guesmi, T.; Alshammari, B.M.; Alqunun, K.; Alzamil, A.; Alturki, M.; Abdallah, H.H. Integration of Renewable-Energy-Based Green Hydrogen into the Energy Future. Processes 2023, 11, 2685. [Google Scholar] [CrossRef]
- Naqvi, S.R.; Kazmi, B.; Taqvi, S.A.A.; Chen, W.-H.; Juchelková, D. Techno economic analysis for advanced methods of green hydrogen production. Curr. Opin. Green Sustain. Chem. 2024, 48, 100939. [Google Scholar] [CrossRef]
- Nasser, M.; Megahed, T.F.; Ookawara, S.; Hassan, H. A review of water electrolysis–based systems for hydrogen production using hybrid/solar/wind energy systems. Environ. Sci. Pollut. Res. 2022, 29, 86994–87018. [Google Scholar] [CrossRef]
- Chi, J.; Yu, H. Water electrolysis based on renewable energy for hydrogen production. Chin. J. Catal. 2018, 39, 390–394. [Google Scholar] [CrossRef]
- Oliveira, A.M.; Beswick, R.R.; Yan, Y. A green hydrogen economy for a renewable energy society. Curr. Opin. Chem. Eng. 2021, 33, 100701. [Google Scholar] [CrossRef]
- Egert, F.; Ullmer, D.; Marx, S.; Taghizadeh, E.; Morawietz, T.; Gerle, M.; Le, T.A.; Schneider, L.P.C.; Biswas, I.S.; Wirz, R.E.; et al. Intensification of Alkaline Electrolyzer with Improved Two-Phase Flow. Adv. Energy Mater. 2025, 15, 2405285. [Google Scholar] [CrossRef]
- Ceballos-Alvarez, C.; Maziar, J.; Moradizadeh, L.; Siaj, M.; Shahgaldi, S.; Izquierdo, R. Enhanced Graphene Oxide-Nafion® membranes for proton exchange membrane water electrolysis. J. Membr. Sci. 2025, 734, 124267. [Google Scholar] [CrossRef]
- Ceballos-Alvarez, C.; Jafari, M.; Siaj, M.; Shahgaldi, S.; Izquierdo, R. Influence of Graphene Oxide on Mechanical and Morphological Properties of Nafion® Membranes. Nanomaterials 2025, 15, 68. [Google Scholar] [CrossRef] [PubMed]
- Ma, W.; Tian, L.; Zhang, Q.; Shangguan, L.; Wang, F.; Zhu, H. Hydrophilic and hydrophobic dual-side-linked poly(carbazole-butanedione) anion exchange membranes for water electrolysis and fuel cells applications. J. Membr. Sci. 2025, 722, 123840. [Google Scholar] [CrossRef]
- Li, L.; Watanabe, M.; Inada, M.; Ishihara, T. Planer type solid oxide cells using La0.9Sr0.1Ga0.8Mg0.2O3-δ thin-film electrolyte prepared by dip-coating method for high performance CO2/H2O co-electrolysis. Appl. Catal. Gen. 2025, 694, 120146. [Google Scholar] [CrossRef]
- Magnino, A.; Marocco, P.; Santarelli, M.; Gandiglio, M. Economic viability and CO2 emissions of hydrogen production for ammonia synthesis: A comparative analysis across Europe. Adv. Appl. Energy 2025, 17, 100204. [Google Scholar] [CrossRef]
- Mosiałek, M.; Hanif, M.B.; Šalkus, T.; Kežionis, A.; Kazakevičius, E.; Orliukas, A.F.; Socha, R.P.; Łasocha, W.; Dziubaniuk, M.; Wyrwa, J.; et al. Synthesis of Yb and Sc stabilized zirconia electrolyte (Yb0.12Sc0.08Zr0.8O2–δ) for intermediate temperature SOFCs: Microstructural and electrical properties. Ceram. Int. 2023, 49, 15276–15283. [Google Scholar] [CrossRef]
- Brey, J.J. La electrolisis como una herramienta clave de la descarbonización del siglo XXI. Econ. Ind. 2022, 424, 87–96. [Google Scholar]
- Rey, J.; Segura, F.; Andújar, J. Green Hydrogen: Resources Consumption, Technological Maturity, and Regulatory Framework. Energies 2023, 16, 6222. [Google Scholar] [CrossRef]
- Clerici, A.; Furfari, S. Future energy scenarios, impact on hydrogen development and EU green energy strategy. In Proceedings of the en 2021 AEIT International Annual Conference (AEIT), Milan, Italy, 4–8 October 2021; pp. 1–6. [Google Scholar] [CrossRef]
- Garrote, L.; Iglesias, A.; Granados, A. Country-level assessment of future risk of water scarcity in Europe. In Proceedings of IAHS; Copernicus GmbH: Göttingen, Germany, 2018; pp. 455–462. [Google Scholar] [CrossRef]
- Kim, Y.; Jung, S.; Kim, S.; Choi, S.T.; Kim, M.; Lee, H. Heat transfer performance of water-based electrospray cooling. Int. Commun. Heat Mass Transf. 2020, 118, 104861. [Google Scholar] [CrossRef]
- Zhang, Y.; Zhang, Y.; Li, Z.; Yu, E.; Ye, H.; Li, Z.; Guo, X.; Zhou, D.; Wang, C.; Sha, Q.; et al. A Review of Hydrogen Production via Seawater Electrolysis: Current Status and Challenges. Catalysts 2024, 14, 691. [Google Scholar] [CrossRef]
- Solís-Carvajal, C.A.; Pasos, C.A.V.; Ramírez-Navas, J.S. Tecnología de membranas: Ultrafiltración. Entre Cienc. E Ing. 2017, 11, 26–36. [Google Scholar] [CrossRef]
- Cunha, S.; Silva, A.P.; Herráez, C.F.; Pires, V.C.; Chazarra, A.; Mestre, A.; Nunes, L.F.; Mendes, M.T.; Neto, J.; Marques, J.; et al. Atlas Climático Ibérico—Iberian Climate Atlas; Portugal Instituto de Meterologia: Lisbon, Portugal, 2011. [Google Scholar]
- Real Decreto Legislativo 12001, de 20 de julio, p.pdf. Available online: https://www.boe.es/buscar/pdf/2001/BOE-A-2001-14276-consolidado.pdf (accessed on 14 April 2025).
- Ismayilov, A.I.; Mamedov, A.I.; Fujimaki, H.; Tsunekawa, A.; Levy, G.J. Soil Salinity Type Effects on the Relationship between the Electrical Conductivity and Salt Content for 1:5 Soil-to-Water Extract. Sustainability 2021, 13, 3395. [Google Scholar] [CrossRef]
- DOG 129 del 6/07/2012—DECRETO 141/2012; De 21 de Junio, Por el Que se Aprueba el Reglamento Marco del Servicio Público de Saneamiento y Depuración de Aguas Residuales de Galicia. Xunta de Galicia: Santiago, Spain, 2012. Available online: https://www.xunta.gal/dog/Publicados/2012/20120706/AnuncioCA02-270612-0001_es.html (accessed on 28 May 2024).
- Martín, P.; Ángel, M. Modelo Distribuido de Simulación del Ciclo Hidrológico y Calidad del Agua, Integrado en Sistemas de Información Geográfica para Grandes Cuencas. Aportación al Análisis de Presiones e Impactos de la Directiva Marco del Agua. ene. Ph.D. Thesis, Universitat Politècnica de València, Valencia, Spain, 2023. Available online: https://riunet.upv.es/handle/10251/191462 (accessed on 2 July 2025).
- DECRETO 38/2004; de 24 de Febrero, del Gobierno de Aragón, Por el Que se Aprueba el Reglamento de los ver-tidos de Aguas Residuales a las Redes Municipales de Alcantarillado. Available online: https://www.boa.aragon.es/cgi-bin/EBOA/BRSCGI?CMD=VEROBJ&MLKOB=376569325554 (accessed on 8 July 2025).
- Olías, M.; Cerón, J.C.; Fernández, I. Sobre la utilización de la clasificación de las aguas de riego del U.S. Laboratory Salinity (USLS). Geogaceta 2005, 37, 111–113. [Google Scholar]
- Pérez-Vazquez, E.L.; Gaucín-Delgado, J.M.; Ramírez-Rodríguez, S.C.; Sariñana-Aldaco, M.d.L.Á.; Sifuentes, G.Z.; Valenzuela, E.Z. Electrical conductivity of the nutrient solution its effect on the yield and nutraceutical quality of bell pepper. Rev. Mex. Cienc. Agríc. 2020, 11, 1669–1675. [Google Scholar] [CrossRef]
- Directive—2020/2184—EN—EUR-Lex. Available online: https://eur-lex.europa.eu/eli/dir/2020/2184/oj/eng (accessed on 8 July 2025).
- Directiva 98/83/CE; Del Consejo de 3 de Noviembre de 1998 Relativa a la Calidad de las Aguas Destinadas al Consumo Humano. European Union: Brussels, Belgium, 1998; Volume 330. Available online: http://data.europa.eu/eli/dir/1998/83/oj/spa (accessed on 8 July 2025).
- Directive—98/83—EN—EUR-Lex. Available online: https://eur-lex.europa.eu/eli/dir/1998/83/oj/eng (accessed on 8 July 2025).
- Ministerio de Relaciones con las Cortes y de la Secretaría del Gobierno. Real Decreto 1138/1990, de 14 de septiembre, por el que se aprueba la Reglamentación Técnico-Sanitaria para el abastecimiento y control de calidad de las aguas potables de consumo público. BOE 1990, BOE-A-1990-23231, 27488–27497. Available online: https://www.boe.es/eli/es/rd/1990/09/14/1138 (accessed on 8 July 2025).
- BOE-A-2003-3596 Real Decreto 140/2003; de 7 de Febrero, Por el que se Establecen los Criterios Sanitarios de la Calidad del Agua de Consumo Humano. Available online: https://www.boe.es/buscar/act.php?id=BOE-A-2003-3596 (accessed on 8 July 2025).
- Guerra Jara, D.A. Alteración Física y Fisiológica en un Macroinvertebrado Acuático (Género Smicridea) Como Efecto de Cambios en la Salinidad. Bachelor’s Thesis, Universidad de las Américas, TPuebla, Mexico, 2017. Available online: https://www.researchgate.net/publication/315701621_ALTERACION_FISICA_Y_FISIOLOGICA_EN_UN_MACROINVERTEBRADO_ACUATICO_GENERO_SMICRIDEA_COMO_EFECTO_DE_CAMBIOS_EN_LA_SALINIDAD (accessed on 9 July 2025).
- Cañedo-Argüelles, M.; Prat, N.; Ladrera, R. Impact of potash mining in streams: The Llobregat basin (northeast Spain) as a case study. J. Limnol. 2016, 76, 343–354. [Google Scholar] [CrossRef]
- Ministerio de Medio Ambiente. Real Decreto 606/2003, de 23 de mayo, por el que se modifica el Real Decreto 849/1986, de 11 de abril, por el que se aprueba el Reglamento del Dominio Público Hidráulico, que desarrolla los Títulos preliminar, I, IV, V, VI y VIII de la Ley 29/1985, de 2 de agosto, de Aguas. BOE 2003, BOE-A-2003-11384, 22071–22096. Available online: https://www.boe.es/eli/es/rd/2003/05/23/606 (accessed on 8 July 2025).
- Porta, J.; Herrero, J. Vulnerability of Soils Under Irrigation; Springer: Dordrecht, The Netherlands, 1996; pp. 85–96. [Google Scholar] [CrossRef]
- Yousefi, M.; Esrafili, A.; Gholami, M.; Mohammadi, A.A.; Khan, N.A.; Baziar, M.; Oskoei, V. Modeling and analysis of the groundwater hardness variations process using machine learning procedure. Desalination Water Treat. 2021, 238, 135–141. [Google Scholar] [CrossRef]
- Casanova, J.F.; Figueroa, A. Determinación Del Caudal Ambiental Y Su Relación Con Variables Indicadoras De Calidad Del Recurso Hídrico. Luna Azul 2015, 40, 5–24. [Google Scholar] [CrossRef]
- Jiao, Y.-J.; Jiang, K.-J.; Chen, S.; Xiang, P.-P.; He, C.-M. Water use in the industrial sector based on the IPAC model under the carbon-neutral transformation path in China. Adv. Clim. Change Res. 2024, 15, 1130–1146. [Google Scholar] [CrossRef]
- Saulnier, R.; Minnich, K.; Sturgess, K. Water for the Hydrogen Economy; WaterSMART Solutions Ltd.: Calgary, AB, Canada, 2025; p. 13. [Google Scholar][Green Version]
- Lin, N.; Arzumanyan, M.; Calzado, E.R.; Nicot, J.-P. Water Requirements for Hydrogen Production: Assessing Future Demand and Impacts on Texas Water Resources. Sustainability 2025, 17, 385. [Google Scholar] [CrossRef]
- Newborough, M.; Cooley, G. Green hydrogen: Water use implications and opportunities. Fuel Cells Bull. 2021, 2021, 12–15. [Google Scholar] [CrossRef]
- Azam, A.M.I.N.; Ragunathan, T.; Zulkefli, N.N.; Masdar, M.S.; Majlan, E.H.; Yunus, R.M.; Shamsul, N.S.; Husaini, T.; Shaffee, S.N.A. Investigation of Performance of Anion Exchange Membrane (AEM) Electrolysis with Different Operating Conditions. Polymers 2023, 15, 1301. [Google Scholar] [CrossRef] [PubMed]
- Harrison, S. Electrolyser innovations PEM, alkaline, SOEC, and AEM. In Proceedings of the Presentado en Hydrogen Tech World, Essen, Germany, 26–27 June 2024; Available online: https://hydrogentechworld.com/wp-content/uploads/sites/22/2024/07/1.7.-Stephen-B-Harrison-sbh4-consulting.pdf (accessed on 15 June 2025).
- Grozier, R.U.; Land, L.F. Water Resources Activities of the U.S. Geological Survey in Texas Fiscal Years 1982-84; U.S. Geological Survey: Austin, TX, USA, 1984. [Google Scholar]
- Coitiño-López, J.; Barbazán, M.; Ernst, O. Conductividad eléctrica aparente para delimitar zonas de manejo en un suelo agrícola con reducida variabilidad en propiedades físico-químicas. Agrociencia Urug. 2015, 19, 102–111. [Google Scholar] [CrossRef]
- Maru, B.T. Sustainable Production of Hydrogen and Chemical Commodities from Biodiesel Waste Crude Glycerol and Cellulose by Biological and Catalytic Processes. Universitat Rovira i Virgili, Tarragona, Spain. 2013. Available online: https://dialnet.unirioja.es/servlet/tesis?codigo=84088 (accessed on 28 May 2025).

Disclaimer/Publisher’s Note: The statements, opinions and data contained in all publications are solely those of the individual author(s) and contributor(s) and not of MDPI and/or the editor(s). MDPI and/or the editor(s) disclaim responsibility for any injury to people or property resulting from any ideas, methods, instructions or products referred to in the content. |
© 2025 by the authors. Licensee MDPI, Basel, Switzerland. This article is an open access article distributed under the terms and conditions of the Creative Commons Attribution (CC BY) license (https://creativecommons.org/licenses/by/4.0/).