Article

Data-Driven Modelling and Simulation of Fuel Cell Hybrid Electric Powertrain

1
Centre for Engineering Research, School of Physics, Engineering and Computer Science, University of Hertfordshire, Hatfield AL10 9AB, UK
2
School of Business and Engineering, ESTA Belfort, UMLP, 90000 Belfort, France
3
Université Marie et Louis Pasteur, UTBM, CNRS, Institut FEMTO-ST, FCLAB, F-90000 Belfort, France
*
Author to whom correspondence should be addressed.
Hydrogen 2025, 6(3), 53; https://doi.org/10.3390/hydrogen6030053 (registering DOI)
Submission received: 7 May 2025 / Revised: 27 June 2025 / Accepted: 11 July 2025 / Published: 1 August 2025

Abstract

Inspired by the Toyota Mirai, this study presents a high-fidelity data-driven approach for modelling and simulation of a fuel cell hybrid electric powertrain. This study utilises technical assessment data sourced from Argonne National Laboratory’s publicly available report, faithfully modelling most of the vehicle subsystems as data-driven entities. The simulation framework is developed in the MATLAB/Simulink environment and is based on a power dynamics approach, capturing nonlinear interactions and performance intricacies between different powertrain elements. This study investigates subsystem synergies and performance boundaries under a combined driving cycle composed of the NEDC, WLTP Class 3 and US06 profiles, representing urban, extra-urban and aggressive highway conditions. To emulate the real-world load-following strategy, a state transition power management and allocation method is synthesised. The proposed method dynamically governs the power flow between the fuel cell stack and the traction battery across three operational states, allowing the battery to stay within its allocated bounds. This simulation framework offers a near-accurate and computationally efficient digital counterpart to a commercial hybrid powertrain, serving as a valuable tool for educational and research purposes.

1. Introduction

Fuel cell hybrids are increasingly regarded as promising long-term alternatives to conventional vehicles, despite certain limitations. Hydrogen, as an energy carrier in these hybrids, offers a sustainable solution for green mobility, with fuel cells providing higher energy density than traction batteries and emitting only water as a by-product [1]. Automotive fuel cell systems offer higher energy conversion efficiency than internal combustion engines but fall short with respect to traction batteries. Nonetheless, their superior energy density and faster refuelling position them as an adequate compromise between the two [2]. The current commercial viability of fuel cell hybrids remains constrained, primarily due to the higher manufacturing costs and underdeveloped hydrogen refuelling infrastructure [3]. However, this presents an opportunity for researchers and academics alike to explore improvements in these areas and develop strategies for assessing existing hybrid powertrains.
Among various vehicles, the Toyota Mirai stands out as a leading example of automotive fuel cell technology, holding the largest market footprint to date. In 2014, after more than two decades of research and development, Toyota introduced the Mirai to the automotive market. Consequently, it has become a technological benchmark in sustainable mobility [4]. The Mirai features a sophisticated and interdisciplinary hybrid powertrain, where various components interact in a complex manner to ensure consistent on-road performance. Modelling such a system holistically is challenging, as it requires not only capturing the behaviour of individual subsystems but also accurately representing the interactions between them. Several efforts have been made in the existing literature [5,6,7,8], where some studies have focused more on specific aspects, while others have attempted to model and simulate the entire powertrain.
As discussed above, automotive fuel cells offer class-leading energy density. However, their power density remains comparatively low [9]. To have an adequate balance between these two characteristics, fuel cell powertrains often incorporate a modest traction battery, which serves multiple functions, including recuperating regenerative energy and assisting the fuel cell under various driving conditions [10]. This integration introduces an additional layer of complexity to the modelling and simulation process, as it necessitates a dedicated control system to manage the power split between two energy sources. In the Mirai, this subsystem is a crucial part of the power control unit [11,12].
As suggested in Argonne National Laboratory (ANL)’s report, the Mirai has a strong load-following control strategy, whereby the fuel cell closely follows traction demand and the battery provides mild to moderate assistance, depending on its state of charge (SoC) [13]. The fuel cell, meanwhile, does not operate below a defined power threshold and consumes significantly less hydrogen in the idle phase. The study in [4] presented a promising lumped-parameter low-order model for the first-generation Toyota Mirai. It also evaluated vehicle energy management with a particular focus on fuel economy, as well as battery and fuel cell degradation. The authors designed a rule-based control strategy to replicate the operational behaviour of the Mirai’s original load-following strategy. Another relevant study in [14] compared three control strategies: a rule-based approach, an optimisation-based equivalent consumption minimisation strategy (ECMS) and the actual strategy used in the Toyota Mirai using regression analysis. The ECMS enabled optimised hydrogen usage, showing a reduction in consumption by 0.4% to 15.6% across the considered driving cycles. The modelling was based on power dynamics, and converter effects were neglected for simplicity. However, integrating such complex local optimisers within the actual powertrain may pose significant challenges in terms of system compatibility and complexity.
The focus on the development and deployment of digital twins is currently very common. In context, the study in [15] developed a digital twin model for the condition monitoring of fuel cell hybrids, using energetic macroscopic representation coupled with an echo state network to predict fuel cell degradation. The study in [16] introduced a digital twin for fuel cell hybrid vehicles evaluated over the WLTP cycle, comparing range-extender and fuzzy logic control strategies, demonstrating a 30 km range improvement and reduced battery stress through better control design. A similar study [17] presented a Simulink-based fuel cell hybrid’s digital twin, focusing on mechanical and thermal subsystems, showing that auxiliary systems account for 28–40% of the total energy demand. These works collectively emphasised the value of high-fidelity digital modelling, control strategy evaluation and auxiliary system characterisation.
This work, building on these principles, adopts a system-level modelling approach to replicate the operational behaviour of the Toyota Mirai’s hybrid powertrain through a digital simulator. While physical modelling can capture detailed component-level dynamics, it is often complex and computationally intensive. Instead, a data-driven approach is employed, using experimental data from the ANL report to develop simplified yet accurate models for each subsystem, which show strong agreement with the source data. Unlike a conservative approach, which cautiously manages the battery’s energy to prevent overuse, this study introduces a dynamic state transition method for effective power management. The proposed method allows for more efficient use of the battery while keeping its SoC within predefined limits, ensuring a balanced interaction between the fuel cell and the battery. The simulation captures power dynamics and the complex interactions among different powertrain components, while ignoring the converter dynamics to enhance computational efficiency. The resulting simulator serves as a valuable tool for researchers and educators, enabling the analysis and illustration of real-world vehicle behaviour.

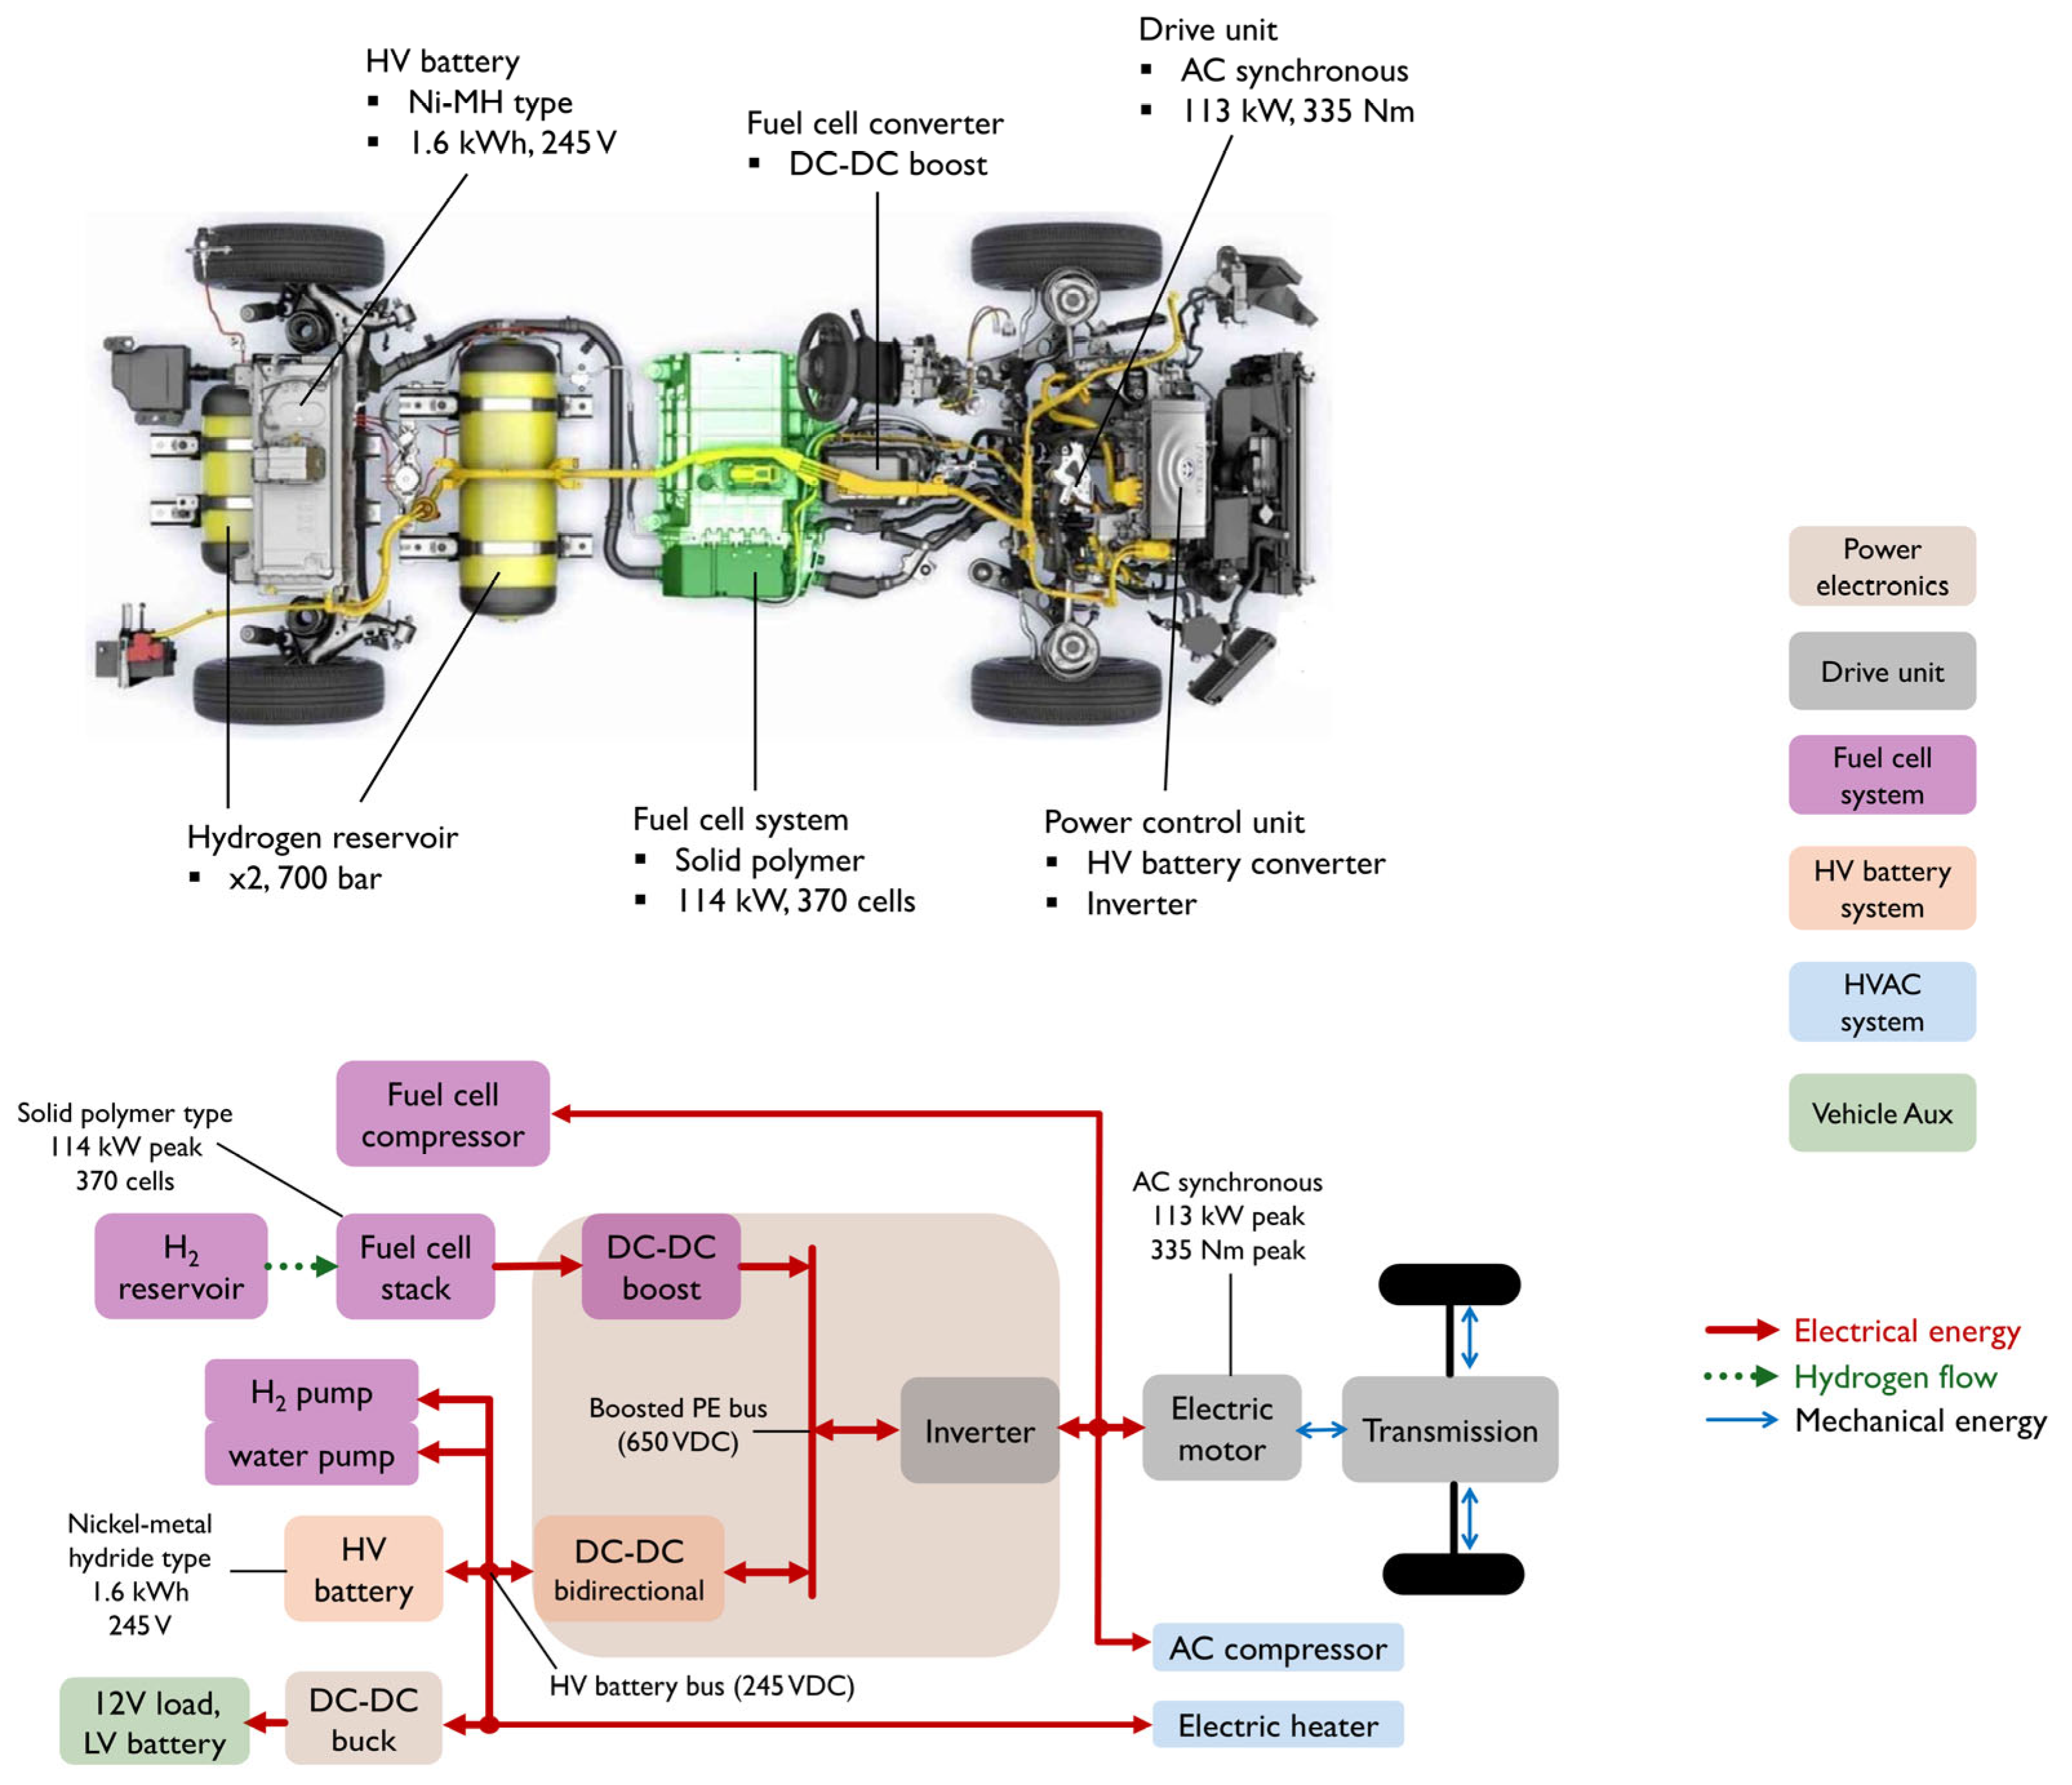
2. Hybrid Powertrain Layout and Modelling

In this study, a hybrid powertrain system analogous to that of the Toyota Mirai (2017 model) is modelled and simulated. The layout of this hybrid powertrain system is presented in Figure 1. The data required to model various subcomponents are sourced from an assessment report made publicly available by ANL [13].
The simulated vehicle has a mass of 4250 lbs and is equipped with 5 kg of onboard hydrogen. It utilises a humidifier-less solid polymer electrolyte fuel cell comprising 370 cells, with a peak power rating of 114 kW. To support the fuel cell under specific traction conditions and recover regenerative braking energy, the hybrid system integrates a high-voltage Nickel–Metal Hydride (NiMH) battery pack with a capacity of 1.6 kWh and a nominal voltage of 245 V. These two power sources jointly supply energy to the traction motor, a permanent magnet AC synchronous motor with a peak power rating of 113 kW and a maximum torque of 335 Nm.
A key aspect of this hybrid system is the interaction between components via power electronic buses. Each energy source is equipped with its own power converter, connected to the central boosted bus operating at 650 VDC. Both the traction motor and the fuel cell compressor are powered via this central boosted bus, while the fuel cell auxiliary pumps and low-voltage systems are powered directly from the battery bus. The considered modelling approach captures the power dynamics between hybrid powertrain components. The behaviour of each component is characterised using polynomial equations fitted to the data provided. The converter dynamics are neglected; this simplification does not compromise the accuracy of the results but significantly enhances simulation performance.

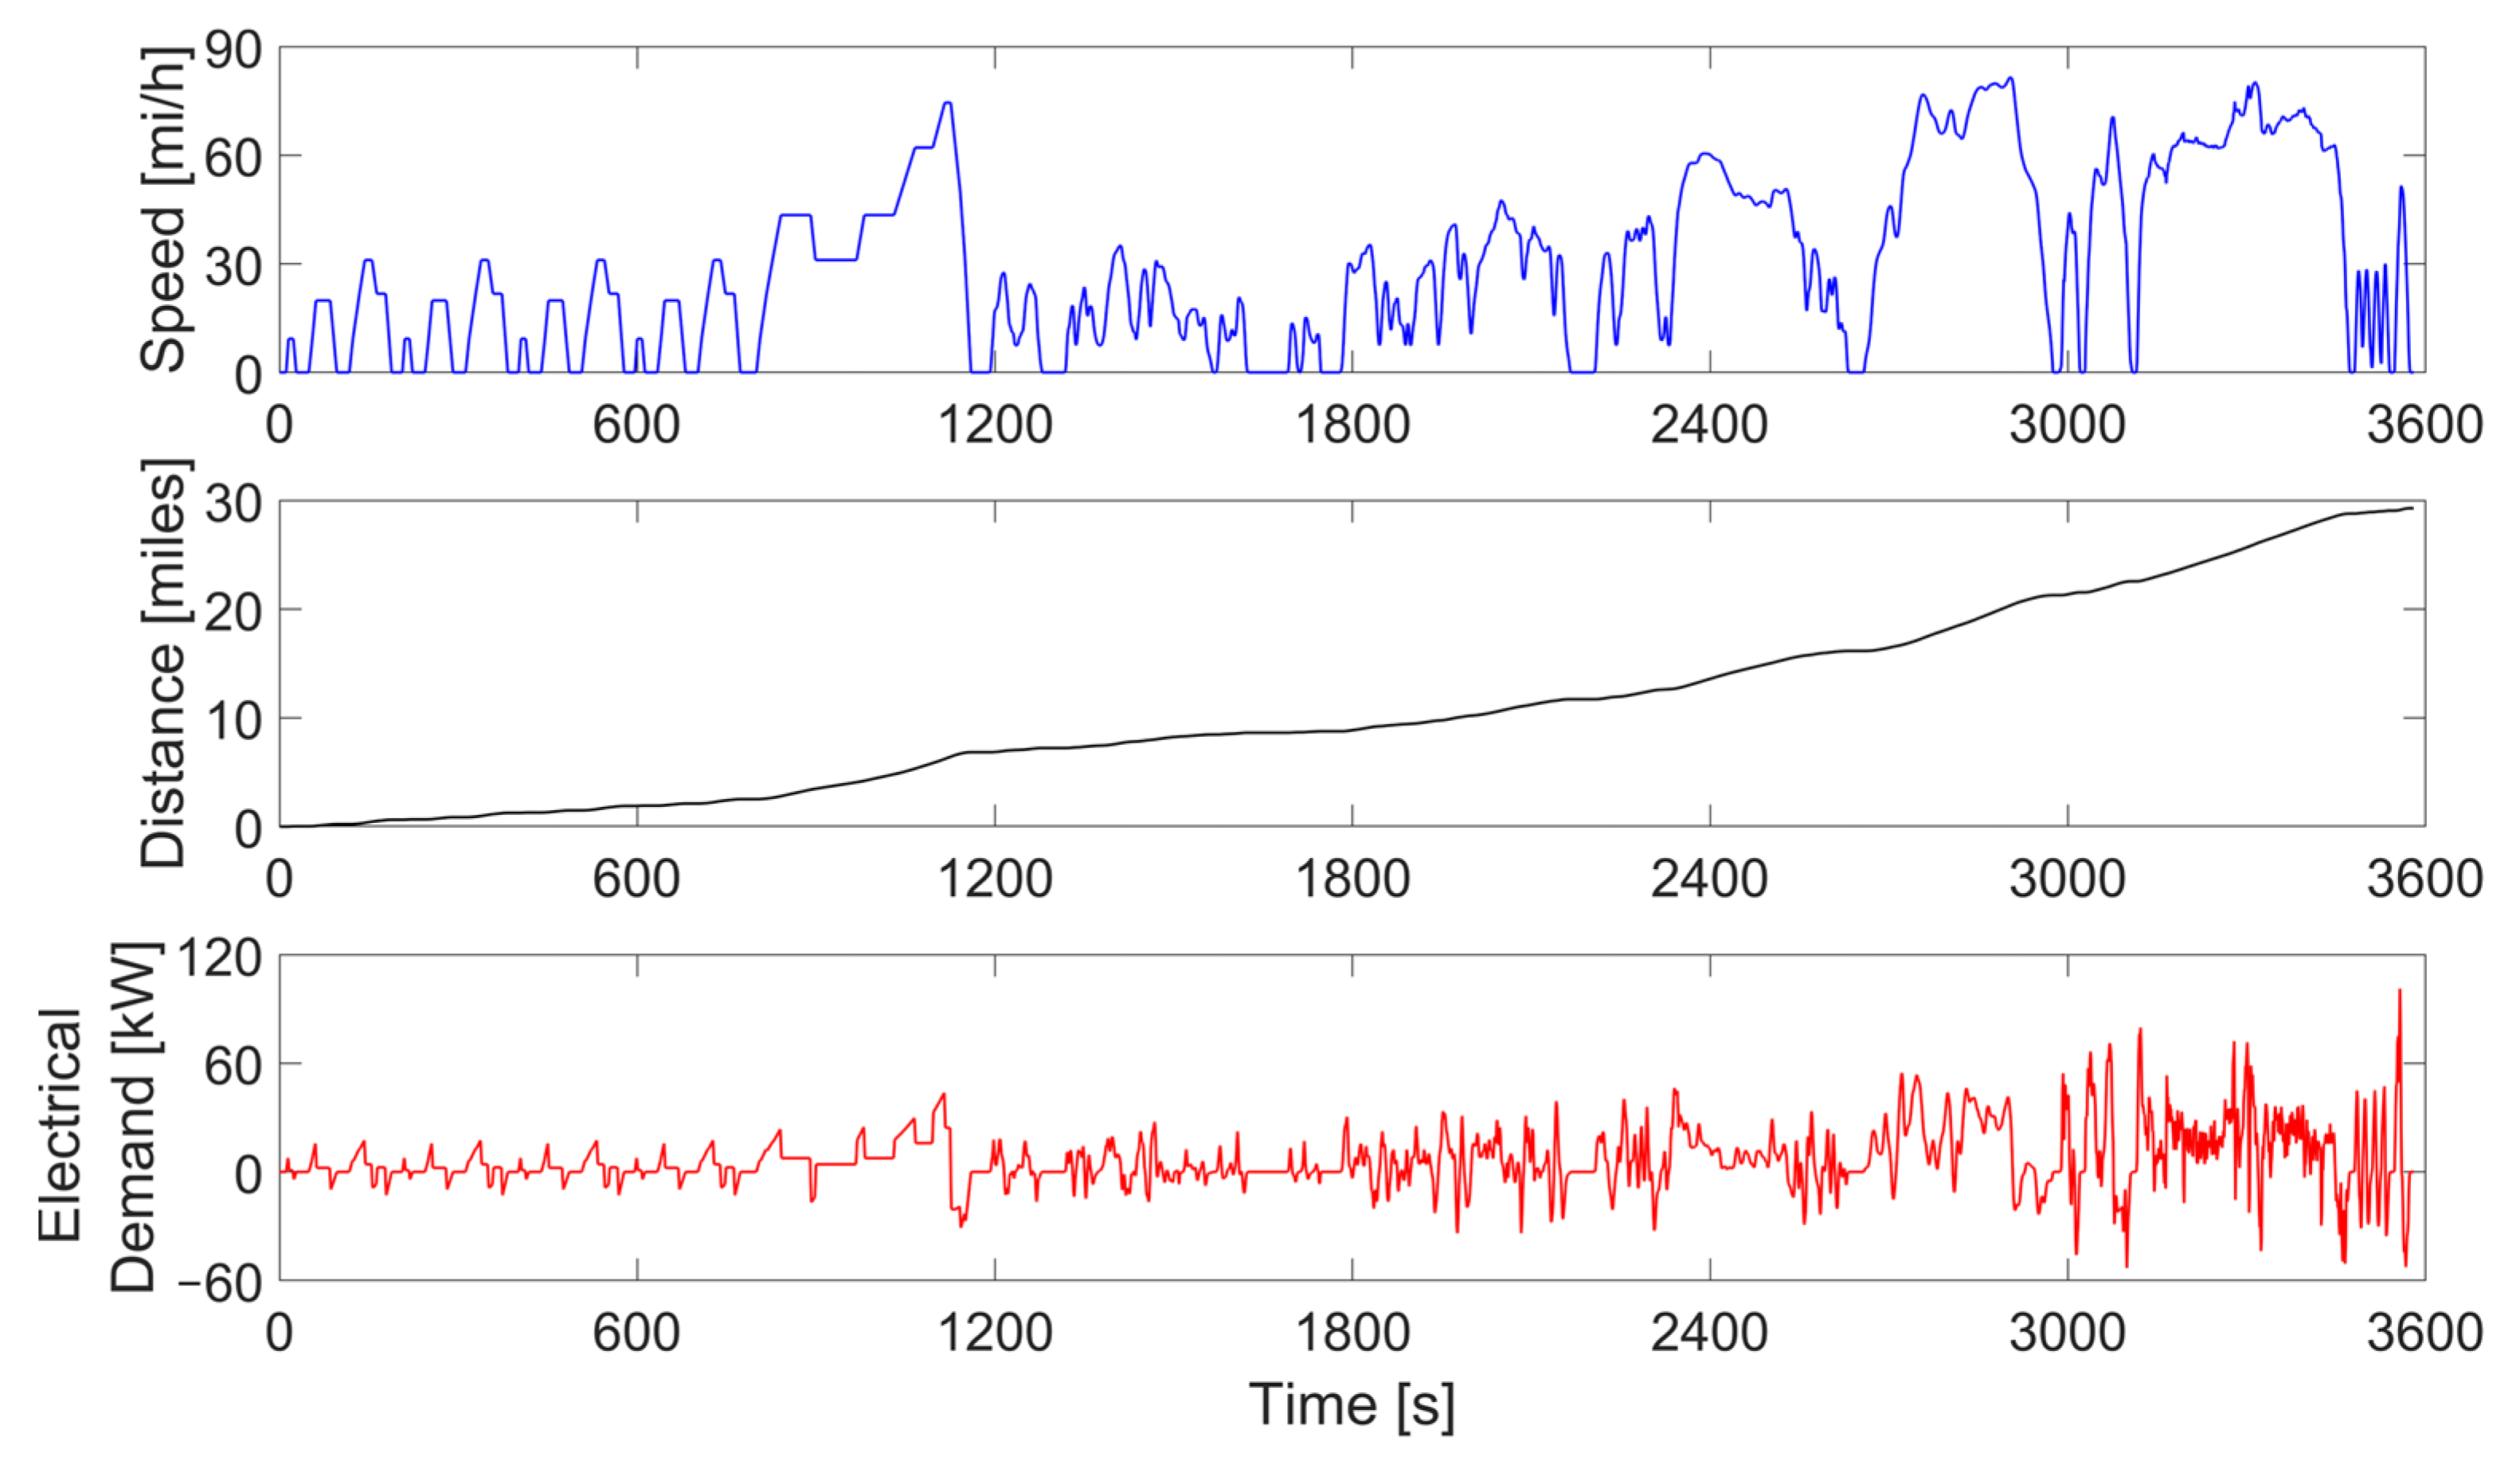
2.1. Drivetrain Power Demand
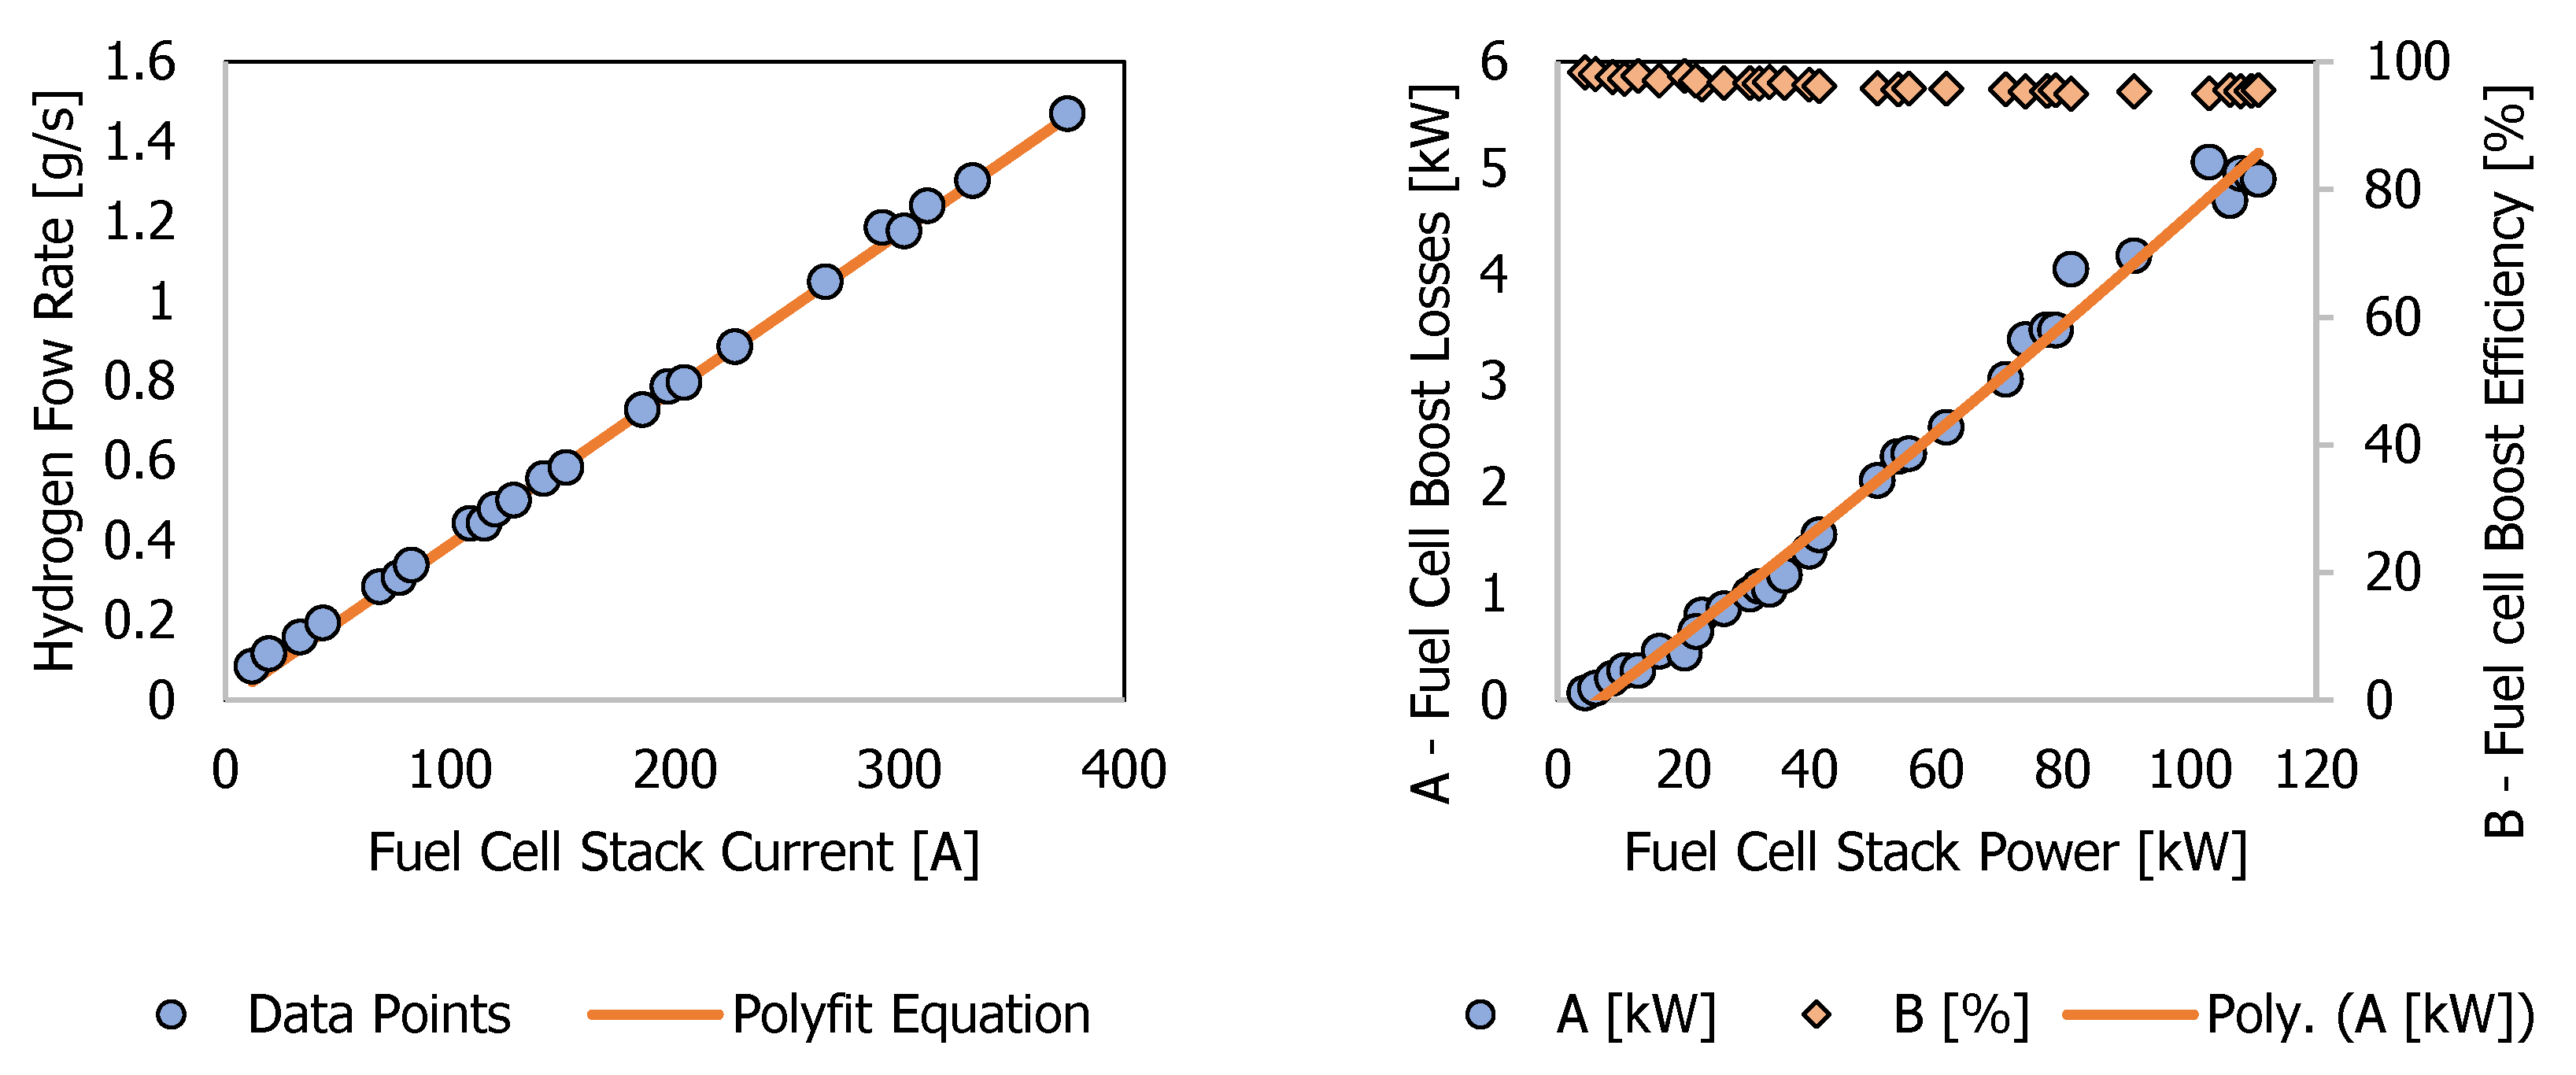
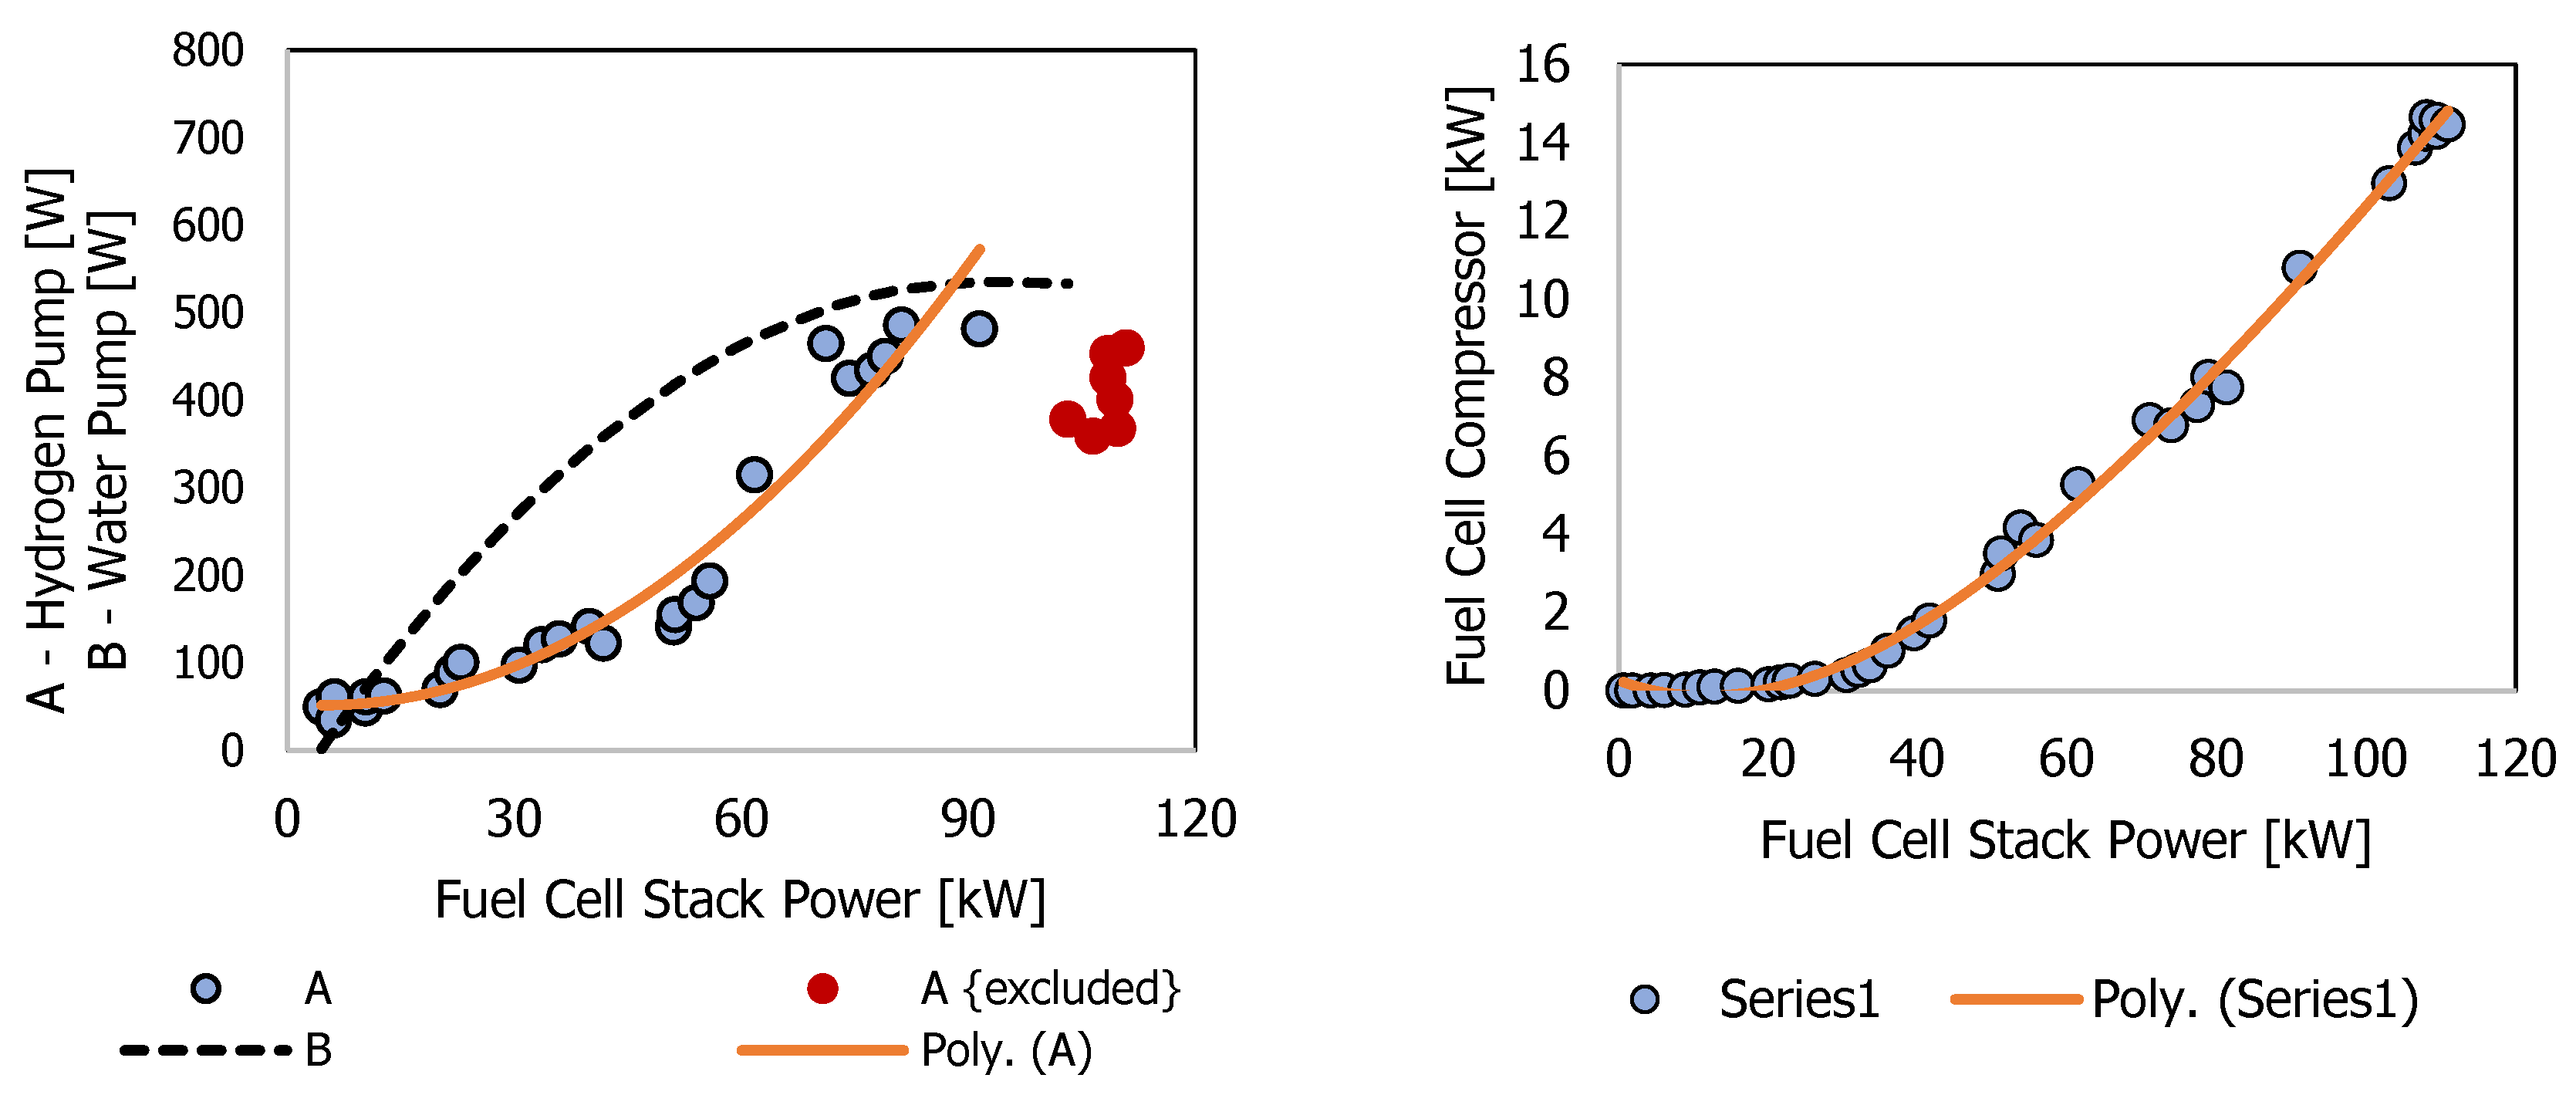
This study employs the vehicle dynamic model to capture the vehicle power demand. The model first calculates the net traction force ( F t ) using Equation (1), which represents the force required to propel the vehicle under a given driving profile defined by speed ( v ) and acceleration ( d v / d t ) [18].
F t = M d v d t + M g sin θ + M g C r cos θ + 1 2 v 2 ρ C d A f
The specifications of the simulated vehicle are matched to those of the Toyota Mirai and are adopted from the literature [4], the Toyota booklet [19] and the ANL report [13]. These specifications include a vehicle mass ( M ) of 4250 lbs, a frontal surface area ( A f ) of 2.23 m2 and a road grade angle ( θ ), assumed to be ‘zero’ for simplicity. The constants g (gravitational constant) and ρ (air density) are universal values, 9.81 m/s2 and 1.29 kg/m3, respectively. The rolling resistance coefficient ( C r ) and aerodynamic drag coefficient ( C d ) are adopted from the literature, with values of 0.01 and 0.29. The traction force calculated from (1) is then converted into equivalent electrical power ( P e ) using Equation (2). It is important to note that this represents only the traction power demand and does not account for any auxiliary loads.
P e = P m η t η m η c = F t v η t η m η c
where η t ,   m ,   c < 100% in combination denotes the average efficiency of one stage speed reducer ( η t ), electric motor ( η m ) and motor controller ( η c ). In this work, these coefficients are chosen as follows: 98% for η t [20], 95% for η m [21] and 98% for η c [22].
Using the model presented in (1) and (2), the power demand pattern for the synthesised driving cycle is shown in Figure 2. This cycle consists of a sequential combination of three popular endurance tests: NEDC (1180 s), WLTP Class 3 (1800 s) and US06 (600 s). The purpose is to evaluate the simulated hybrid powertrain across a range of driving conditions. For instance, the US06 cycle represents an extreme scenario with rapid accelerations and decelerations at high speeds, while the NEDC and WLTP Class 3 cycles represent more typical mixed driving conditions. As shown in Figure 2, the NEDC cycle imposes a modest and repetitive power demand, while the US06 cycle pushes the hybrid powertrain to its operational limits. It is also evident that the maximum power demanded by the traction system does not exceed its peak power rating (113 kW), although it comes close during the US06 cycle.

2.2. Hybrid System

The fuel cell system is the core element of the Mirai hybrid powertrain, consisting of several subsystems that work in harmony, including the fuel cell stack, DC-DC boost converter, air compressor, hydrogen reservoir and fuel/coolant pumps. The stack is of the solid polymer electrolyte type, comprising 370 cells, with each cell featuring an active area of 237 cm2. It can deliver a peak power output of 114 kW, which theoretically means that the fuel cell is sufficient to meet peak demand in most cases. In the Mirai, engineers have designed a humidifier-less fuel cell system with an integrated inner circulation system [13].
The data used for modelling purposes are sourced from the publicly available ANL report [13]. Within the context of the power dynamics modelling approach, efforts are primarily focused on relating the behaviour of subcomponents to either the fuel cell stack’s power or current. To characterise the power consumption and operational behaviour of various components, the polynomial fitting models are employed using data provided in the ANL report. While these data-driven polynomial models are relatively simple, they capture the complexities and dynamic behaviour of the fuel cell system with a high degree of accuracy. Furthermore, they are straightforward to implement and offer fast simulation performance.
The single most crucial element regarding the fuel cell stack is the polarisation relation between the current drawn from it ( A f c ) and the voltage across its terminal ( V f c ). In this work, a current-dependent voltage source ( V d ,   f c ) is used to model this behaviour. The relationship derived by fitting a polynomial model to data provided in the ANL report is presented in Equation (3). The resulting polarisation curve, as captured by the polynomial model, is presented in Figure 3.
V f c = V d ,   f c R f c A f c V d , f c = min V m , f c   ; α 1 A f c 3 + α 2 A f c 2 + α 3 A f c + α 4
where R f c is the internal resistance of the stack; this factor mostly ranges between 100 mΩ and 120 mΩ, as shown in Figure 3. In this work, the average value is assumed (106.561 mΩ). The notations α 1,2 , . . , 4 are the polynomial coefficients, as detailed in Appendix A. V d ,   f c is the dependent source that captures the polarisation nonlinearities, and V m , f c denotes the no-load voltage, which is 315 V in this study.
Another key element is the hydrogen flow rate ( m ˙ h 2 ), which is modelled as a linear function of the stack current ( A f c ) using the coefficient β , as shown in Equation (4) and presented in Figure 4. The value of this coefficient is provided in Appendix A.
m ˙ h 2 = β A f c
Toyota has implemented several tricks in the control mechanism to save hydrogen during the idle phase, which accounts for any driving scenario where the fuel cell stack contribution is less than 7 kW. The stack does not operate below 7 kW under normal conditions due to its poor efficiency in this region.
Four fuel cell auxiliaries are modelled in this work, including the air compressor, the hydrogen and water pumps, and the boost converter. The latter part boosts the stack voltage to a suitable level for the electric motor. From the data presented in the ANL report [13], the boosted voltage varies from 320 V to 650 V, depending on the demanded power. In this work, boost converter efficiency points are used to fit the power losses ( P c l , f c ), as shown in Equation (5) and Figure 4.
P c l , f c = max 0   ;   δ 1 P f c 2 + δ 2 P f c + δ 3 P a c , f c = max 0   ;   γ 1 P f c 3 + γ 2 P f c 2 + γ 3 P f c + γ 4 P f p , f c = max 0   ;   ω 1 P f c 2 + ω 2 P f c + ω 3 P w p , f c = σ P f c P f p , f c
where the values for the coefficients δ 1,2 , . . , 3 are provided in Appendix A. The fuel cell air compressor is powered through the boosted bus. In this work, the compressor’s consumption ( P a c , f c ) is modelled as a polynomial function of the stack’s power using (5) and coefficients γ 1,2 , . . , 4 . This relation is presented in Figure 5.
The last two auxiliary components considered are hydrogen and water pumps. The data between 60 and 100 kW (Figure 5), interestingly, represent higher power consumption, as the fuel pump works harder to overcome the increased hydrogen flow. However, a discrepancy arises beyond 100 kW, where the data points do not follow the expected trend. It is also important to note that as evidenced by ANL testing, the fuel cell stack rarely exceeds 100 kW, except under certain harsh conditions, and it normally stabilises at a lower steady value during its continuous operation. Considering this, a second-order polynomial fitting model has been applied across the entire range but excluding data points in the vicinity of 100 kW and beyond. This yields an R2 (coefficient of determination) value of 0.9415, demonstrating the adequacy of the applied second-order polynomial fit. While it could be argued that this fitting model does not include a certain portion of the dataset, the counter argument is that the fuel cell stack in this work and under the specified driving scenarios never exceeded 100 kW. Therefore, this model to calculate the hydrogen pump’s consumption ( P f p , f c ), as presented in (5), is suitable.
Although the ANL report does not specifically detail the water pump’s consumption, it does provide a comprehensive raw dataset for the combined consumption of both the water and hydrogen pumps [23]. This raw dataset exhibits high variance and is generally scattered across the entire range. However, it is worth noting that the combined consumption peaks at around 1350 W, when the fuel cell stack operates near to its peak power. By assuming a linear relationship between this trend and the fuel cell stack’s power ( P f c ), the water pump’s consumption ( P w p , f c ) is calculated using (5) and is presented in Figure 5.
In Equation (5), ω 1,2 , . . , 3 are the poly fitting coefficients (Appendix A). The coefficient σ linearly maps the combined pump consumption to the fuel cell stack’s power output. The Toyota Mirai is a fuel cell-dominant vehicle; given this, the fuel cell and electric motor are dimensioned alike. As shown in the ANL report, the fuel cell powers the electric motor with moderate to low battery assist under diverse acceleration patterns. Other benefits to integrating the battery include the recuperation of regenerative energy, powering the electric motor when the fuel cell is idle (below 7 kW) and powering auxiliary components. The modelled hybrid powertrain has an air-cooled NiMH battery pack with a nominal capacity ( Q n ) of 6.5 Ah (1.6 kWh) and a voltage rating of 245 V, unlike the lithium-ion chemistry very common these days [13,24]. The experimental data indicate that this battery can deliver and receive a peak power of 30 kW [13]. The battery has its own bidirectional converter, which then ties to the electric motor via a boosted bus. The data points available from the ANL report are insufficient for accurate fitting. Therefore, an average efficiency of 97.8% is assumed for both modes. This assumption is not arbitrary but aligns with the existing published studies [4].
The model already provided in the MATLAB/Simulink specialised power systems library is utilised for integrating the HV battery pack with the fuel cell. A traditional Coulomb counter is used to calculate the SoC using Equation (6); the initial value of SoC is assumed to be 62.5% in comparison scenarios.
S o C t = S o C t 1 A b ( t ) t Q n

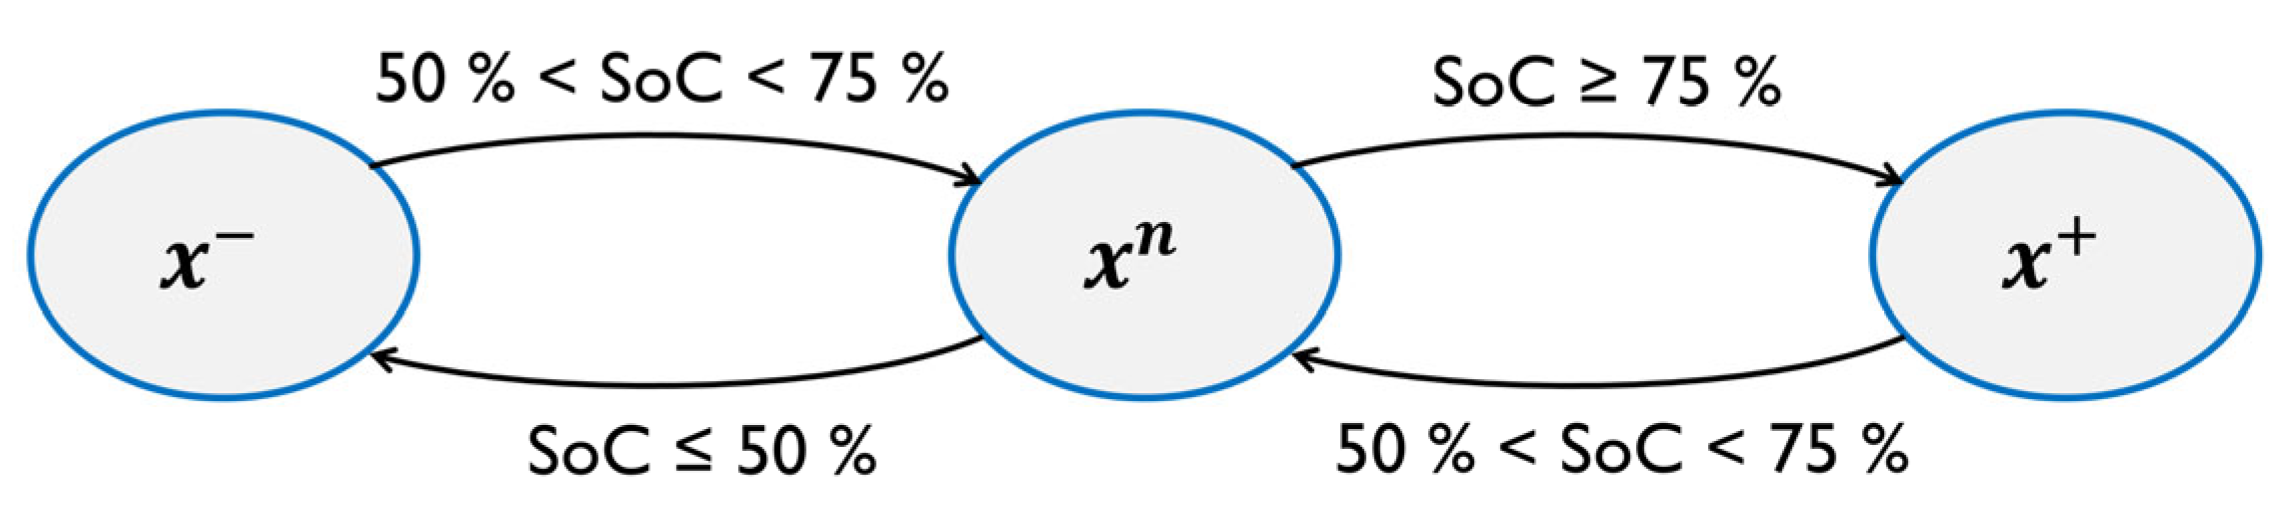
2.3. Power Management System

The power management system (PMS) is a crucial component that ensures that the hybrid powertrain delivers traction energy in a consistent and reliable manner. In this work, the system is first defined through the power balance Equations (7)–(8). The first expression (7) describes the allocation of traction demand ( P e ), as the battery can accept a maximum of 30 kW ( P e ), while the traction motor can demand up to 110 kW ( P e + ). The subsequent expression (8) establishes the power balance, whereby the fuel cell stack ( P f c ) and the battery ( P b ) together supply the traction demand and auxiliary loads ( P ¯ ). It is important to distinguish between P f c , b * and P f c , b ; the former part is actively manipulated by the proposed PMS and excludes auxiliary power demand.
P e + = max ( 7   kW , min P e , + 110   kW ) P e = max P e P e + , 30   kW
P e + + P e + P c l , f c ¯ + P a c , f c ¯ + P f p , f c ¯ + P w p , f c ¯ + P a u x , v ¯ = P f c + P b P e + + P e = P f c * + P b * P f c * = P f c P c l , f c ¯ P b * = P b P a c , f c ¯ P f p , f c ¯ P w p , f c ¯ P a u x , v ¯
By design, the Toyota Mirai is a fuel cell-dominant hybrid vehicle with a strong load-following nature. The fuel cell and the electric motor are dimensioned alike, allowing the fuel cell to deliver peak traction power under certain conditions. In contrast, the traction battery operates in three distinct scenarios: during regenerative braking, it recuperates energy; in EV mode, when the traction demand is below 7 kW, the fuel cell remains idle, and the battery alone powers the traction motor; and in hybrid mode, the battery supplements the fuel cell based on its SoC.
The credible literature [4] suggests that the actual PMS employed in the Toyota Mirai resembles a rule-based approach. At its core, the fuel cell is turned on or off based on whether the power demand exceeds or falls below 7 kW. Beyond this threshold, the PMS controls battery contribution according to the available SoC, operating in charge-sustain/charge-deplete (CSCD) mode. Given that the Mirai is a non-plug-in hybrid vehicle with a relatively small battery, it is reasonable to maintain tighter constraints on battery charge and discharge rates. In [14], a linear regression approach is used to model six distinct operating modes, and it is suggested that the actual PMS may be significantly more complex with fuzzy logic rules. The same study identifies an SoC of 57% as the trigger point for transitioning between CSCD modes, with a typical operational SoC window of 50–65%. However, this range appears somewhat conservative and presents an opportunity for further optimisation.
Building on the preceding discussion, this work proposes a state transition controller as an alternative PMS. In this approach, the system transitions between three operational states, denoted by x n , + , . The transition SoC thresholds are deliberately defined to be less conservative, enabling more effective utilisation of the battery’s energy while remaining within the CDCS framework. This allows for a better trade-off between capturing regenerative braking energy and using it later to support the traction demand, thereby indirectly reducing hydrogen consumption. The proposed state controller is presented in Figure 6. This approach offers flexibility, maintains an effective power balance, supports reliable system operation and is computationally efficient.
The mathematical formulation of the three operational states is provided in Equation (9). In state x n , the battery does not significantly contribute, except for absorbing the regenerative energy and feeding the traction load if it is below 7 kW. When the battery has sufficient charge, the system transitions to x + , where the battery aggressively supports the traction load as governed by the dynamic gain k + . Conversely, when the battery’s charge is low, the system shifts to state x , where the battery is recharged at a rate determined by the dynamic gain k . This control mechanism ensures that the battery remains within the defined SoC bounds as it transitions between the three operational states.
x n P b * = P e P f c * = P e + x + P b * = P e + min   ( 30   kW ,   k +   P e + ) P f c * = P e + max   ( 0 ,   P b * ) x P b * = 7   kW k + P e P f c * = P e + + 7   kW k
The value of these dynamic gains depends on the battery’s pack relative SoC in relation to the introduced SoC bounds; their mathematical formulation is provided in Equation (10).
k + = 1 90 % S o C t 90 % 75 % k = 2 S o C t 25 % 50 % 25 %

3. Simulation Results and Discussion

In this work, the simulations are performed at a standard temperature of 72 °F. At this temperature, the heating, ventilation and air conditioning (HVAC) load is zero, with both the electric heater and cooling compressor consuming ‘zero’ energy. Vehicle accessories are powered through the 12 V rail, which is connected to the HV traction battery through a DC-DC converter. For this, a constant consumption of P a u x , v = 239 W is assumed [13]. The simulations are set up in MATLAB/Simulink 2022a, where the system is graphically modelled in Simulink and the script is designed in MATLAB for generating plots. The simulation step size is set to ∆t = 0.1 s. The driving scenarios used for simulation and validation are described as follows, and these scenarios are implemented using MATLAB Simulink’s built-in driving scenario library [25]:
(1)
A combination of three synthetic driving cycles (Figure 2). This composite cycle consists of a sequential combination of three widely used endurance tests: NEDC (1180 s), WLTP Class 3 (1800 s) and US06 (600 s). This cycle is used to capture baseline performance and evaluate the proposed power allocation strategy.
(2)
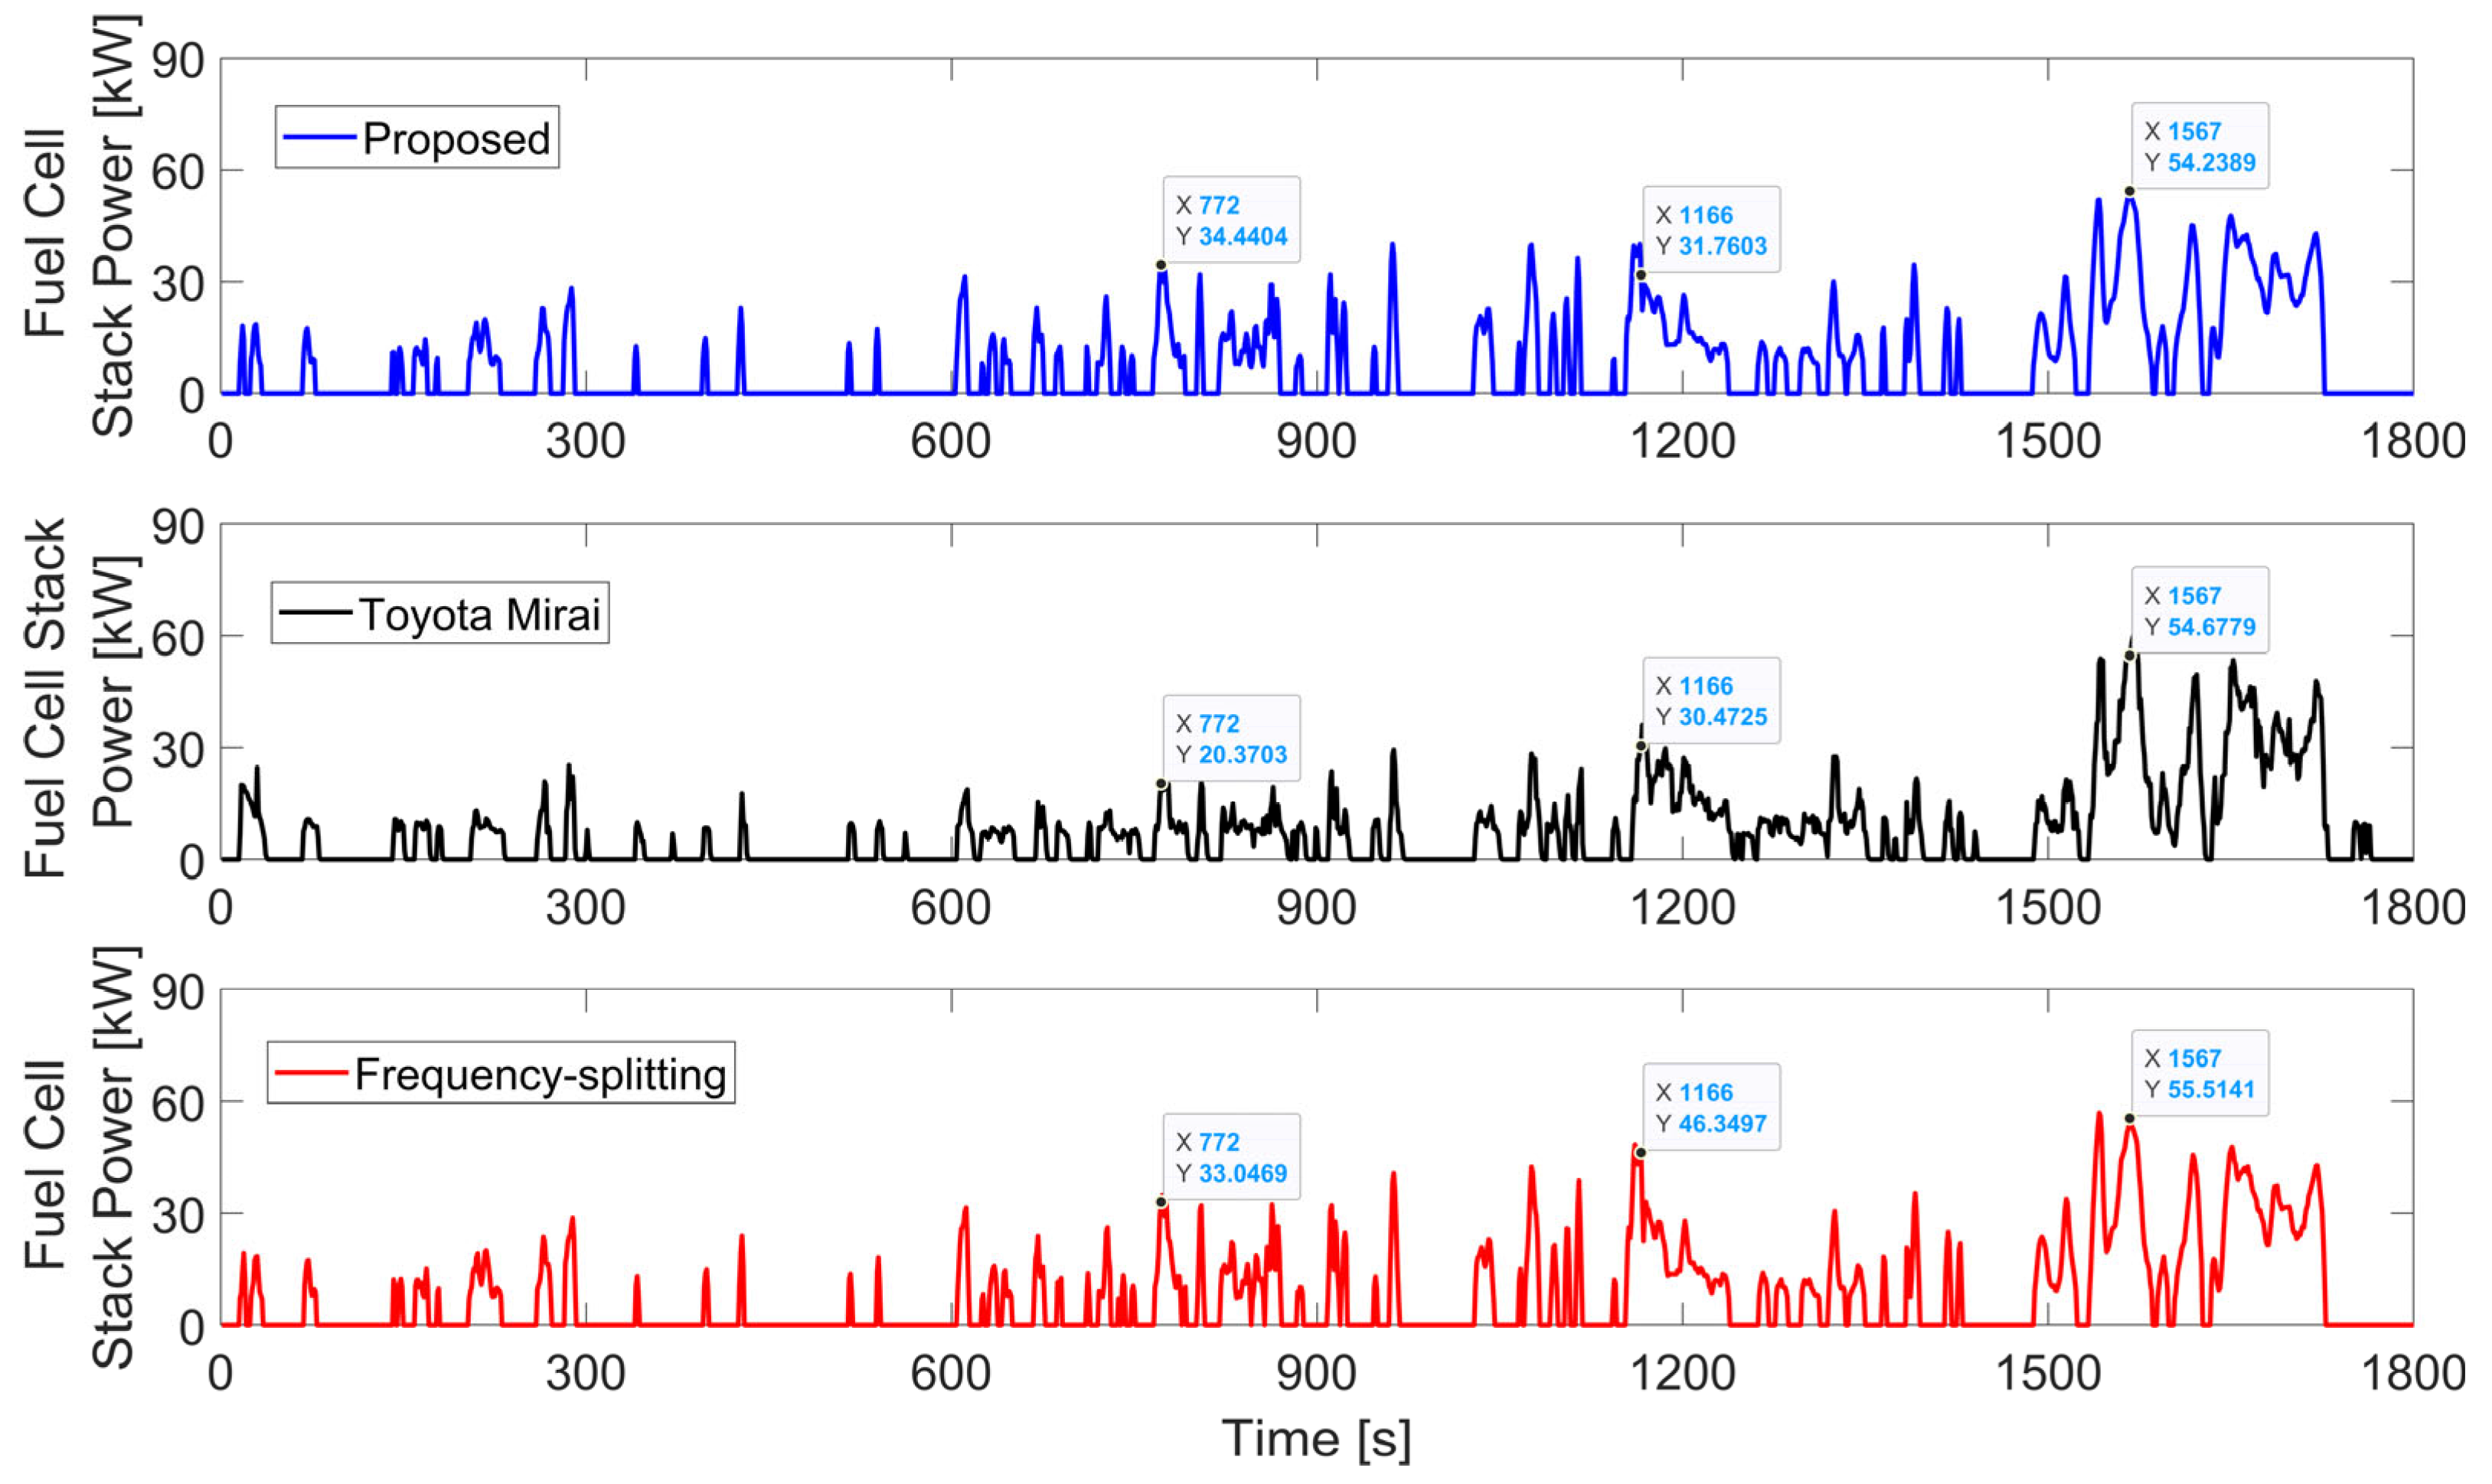
A driving scenario to benchmark against actual data from the Toyota Mirai [23] and compare with a similar tiered frequency-splitting power allocation method [26,27,28]. For benchmarking purposes, various statistical measures are evaluated to highlight the merits and limitations of the proposed approach.

3.1. Baseline Performance

These results are presented in three parts. The first part, shown in Figure 7, illustrates the contribution of the fuel cell stack as the primary power source and the resulting hydrogen consumption. It can be observed that the fuel cell supplies most of the traction power across the considered driving scenario, particularly during the US06 segment (final 600 s), which is the most demanding condition. The total hydrogen consumption over the 29 miles driving period is approximately 376 g. This corresponds to an estimated driving range of around 385 miles, assuming 5 kg of onboard hydrogen. However, this estimate does not account for hydrogen consumption during idle phase or other system losses. Therefore, the actual achievable range is likely to be lower than this number. These results demonstrate the capability of the fuel cell stack to reliably power the traction motor across a range of driving conditions.
The second part focuses on power consumption and losses associated with the auxiliary components, including fuel cell-specific and general vehicle auxiliaries. The vehicle auxiliary load is assumed to be constant at 239 W, while the consumption of other components is presented in Figure 8. Among the HV auxiliary components, the hydrogen pump motor exhibits the lowest power demand. In this study, it is consistently powered by the HV traction battery and can reach a peak consumption of 500 W; corresponding units are reported in hectowatts (hW) for clarity. The fuel cell boost converter, which is an integral part of the fuel cell system, is always powered by the stack itself, as all fuel cell output must pass through it. Losses in this converter can reach up to 5 kW under high-load conditions. The final auxiliary component is the fuel cell air compressor, an HV device powered via a 650 VDC boosted bus. In this work, the compressor is always powered by the HV traction battery. According to the report in [13], its consumption can reach up to 15 kW when the fuel cell stack operates at peak power. As expected, the US06 cycle (final 600 s) results in significantly higher auxiliary power demand, pushing the hybrid system and drawing a substantial portion of energy from the available power sources.
The final part, shown in Figure 9, is the most crucial and requires careful discussion. It provides insight into the functioning of the proposed state transition PMS and demonstrates how the system actively shifts between different operational states. During the last 600 s (the US06 driving cycle), the battery contributes a substantial portion of the traction energy while staying within its allocated operational limits. This behaviour is triggered when the battery SoC exceeds 75%, prompting a transition from state 1 ( x n ) to state 2 ( x + ). In this state, the battery possesses sufficient energy to assist the traction motor more aggressively, as governed by the state-dependent gain ( k + ). Consequently, the load on the fuel cell stack is reduced, resulting in lower hydrogen consumption than would otherwise be expected under such demanding conditions. The adaptive gain k + also ensures that the battery is not overloaded, while the overall state transition logic ensures that the battery stays within its designated SoC bounds throughout the subjected driving cycle.

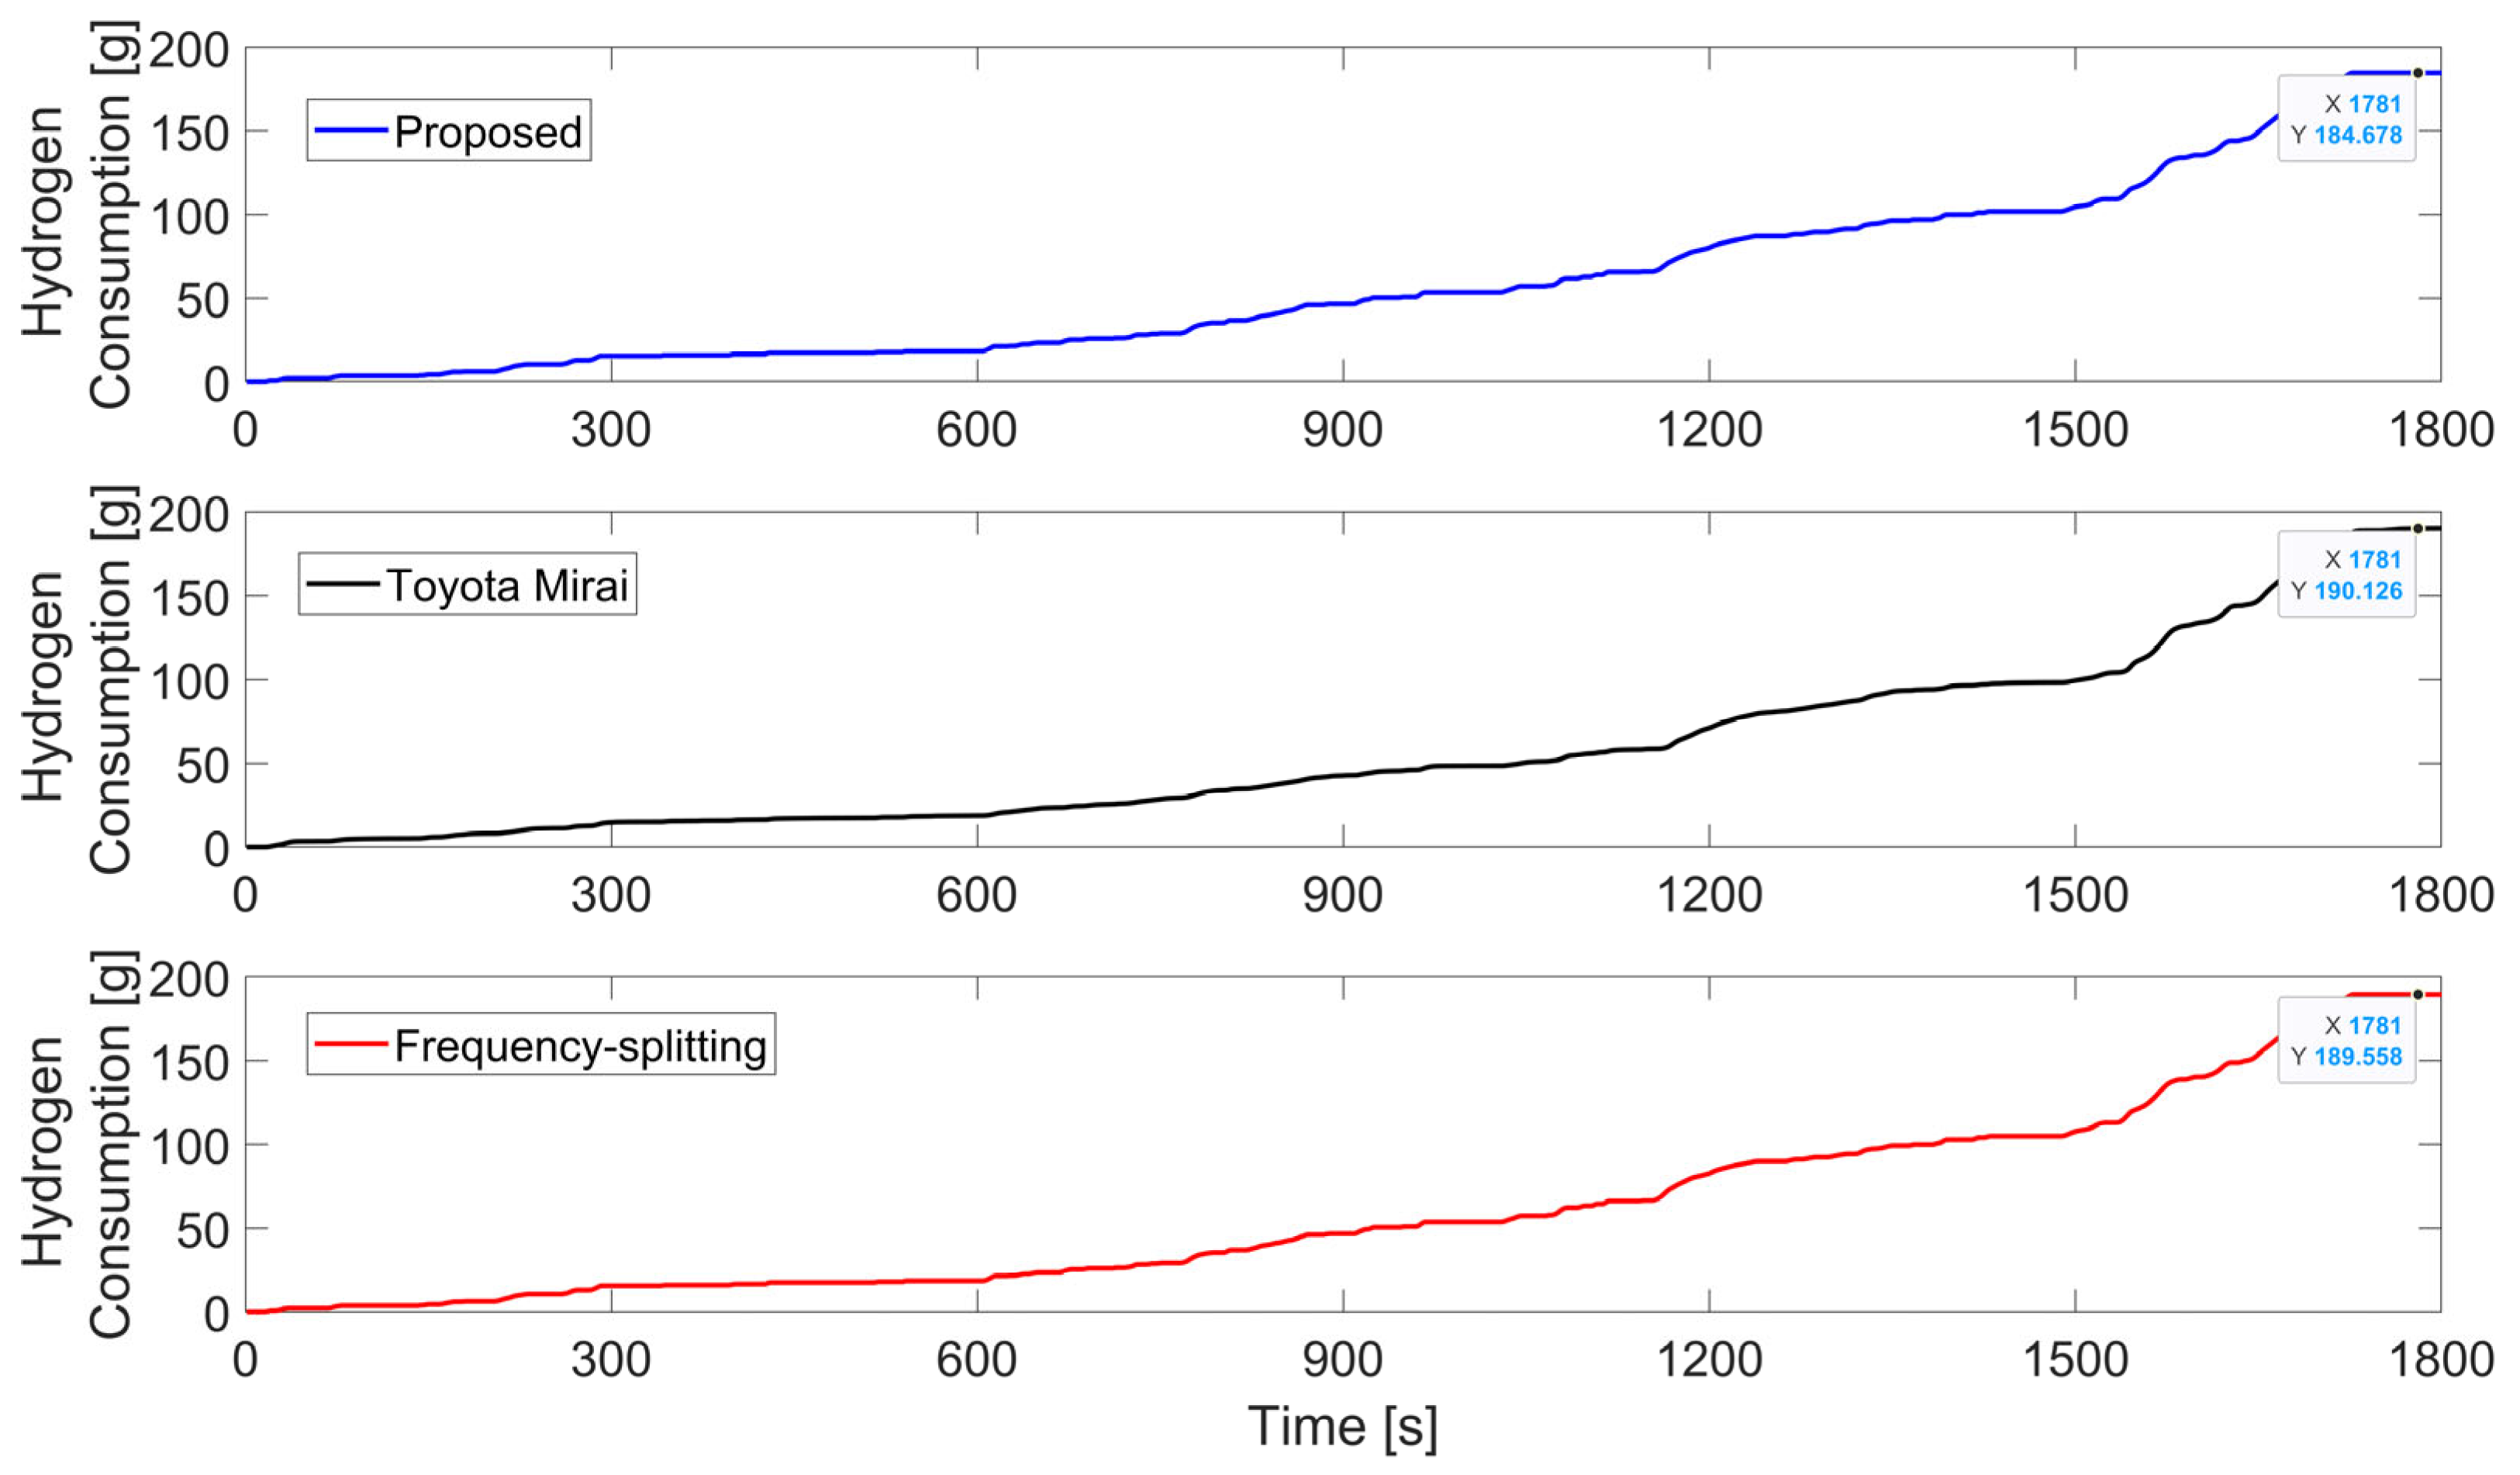
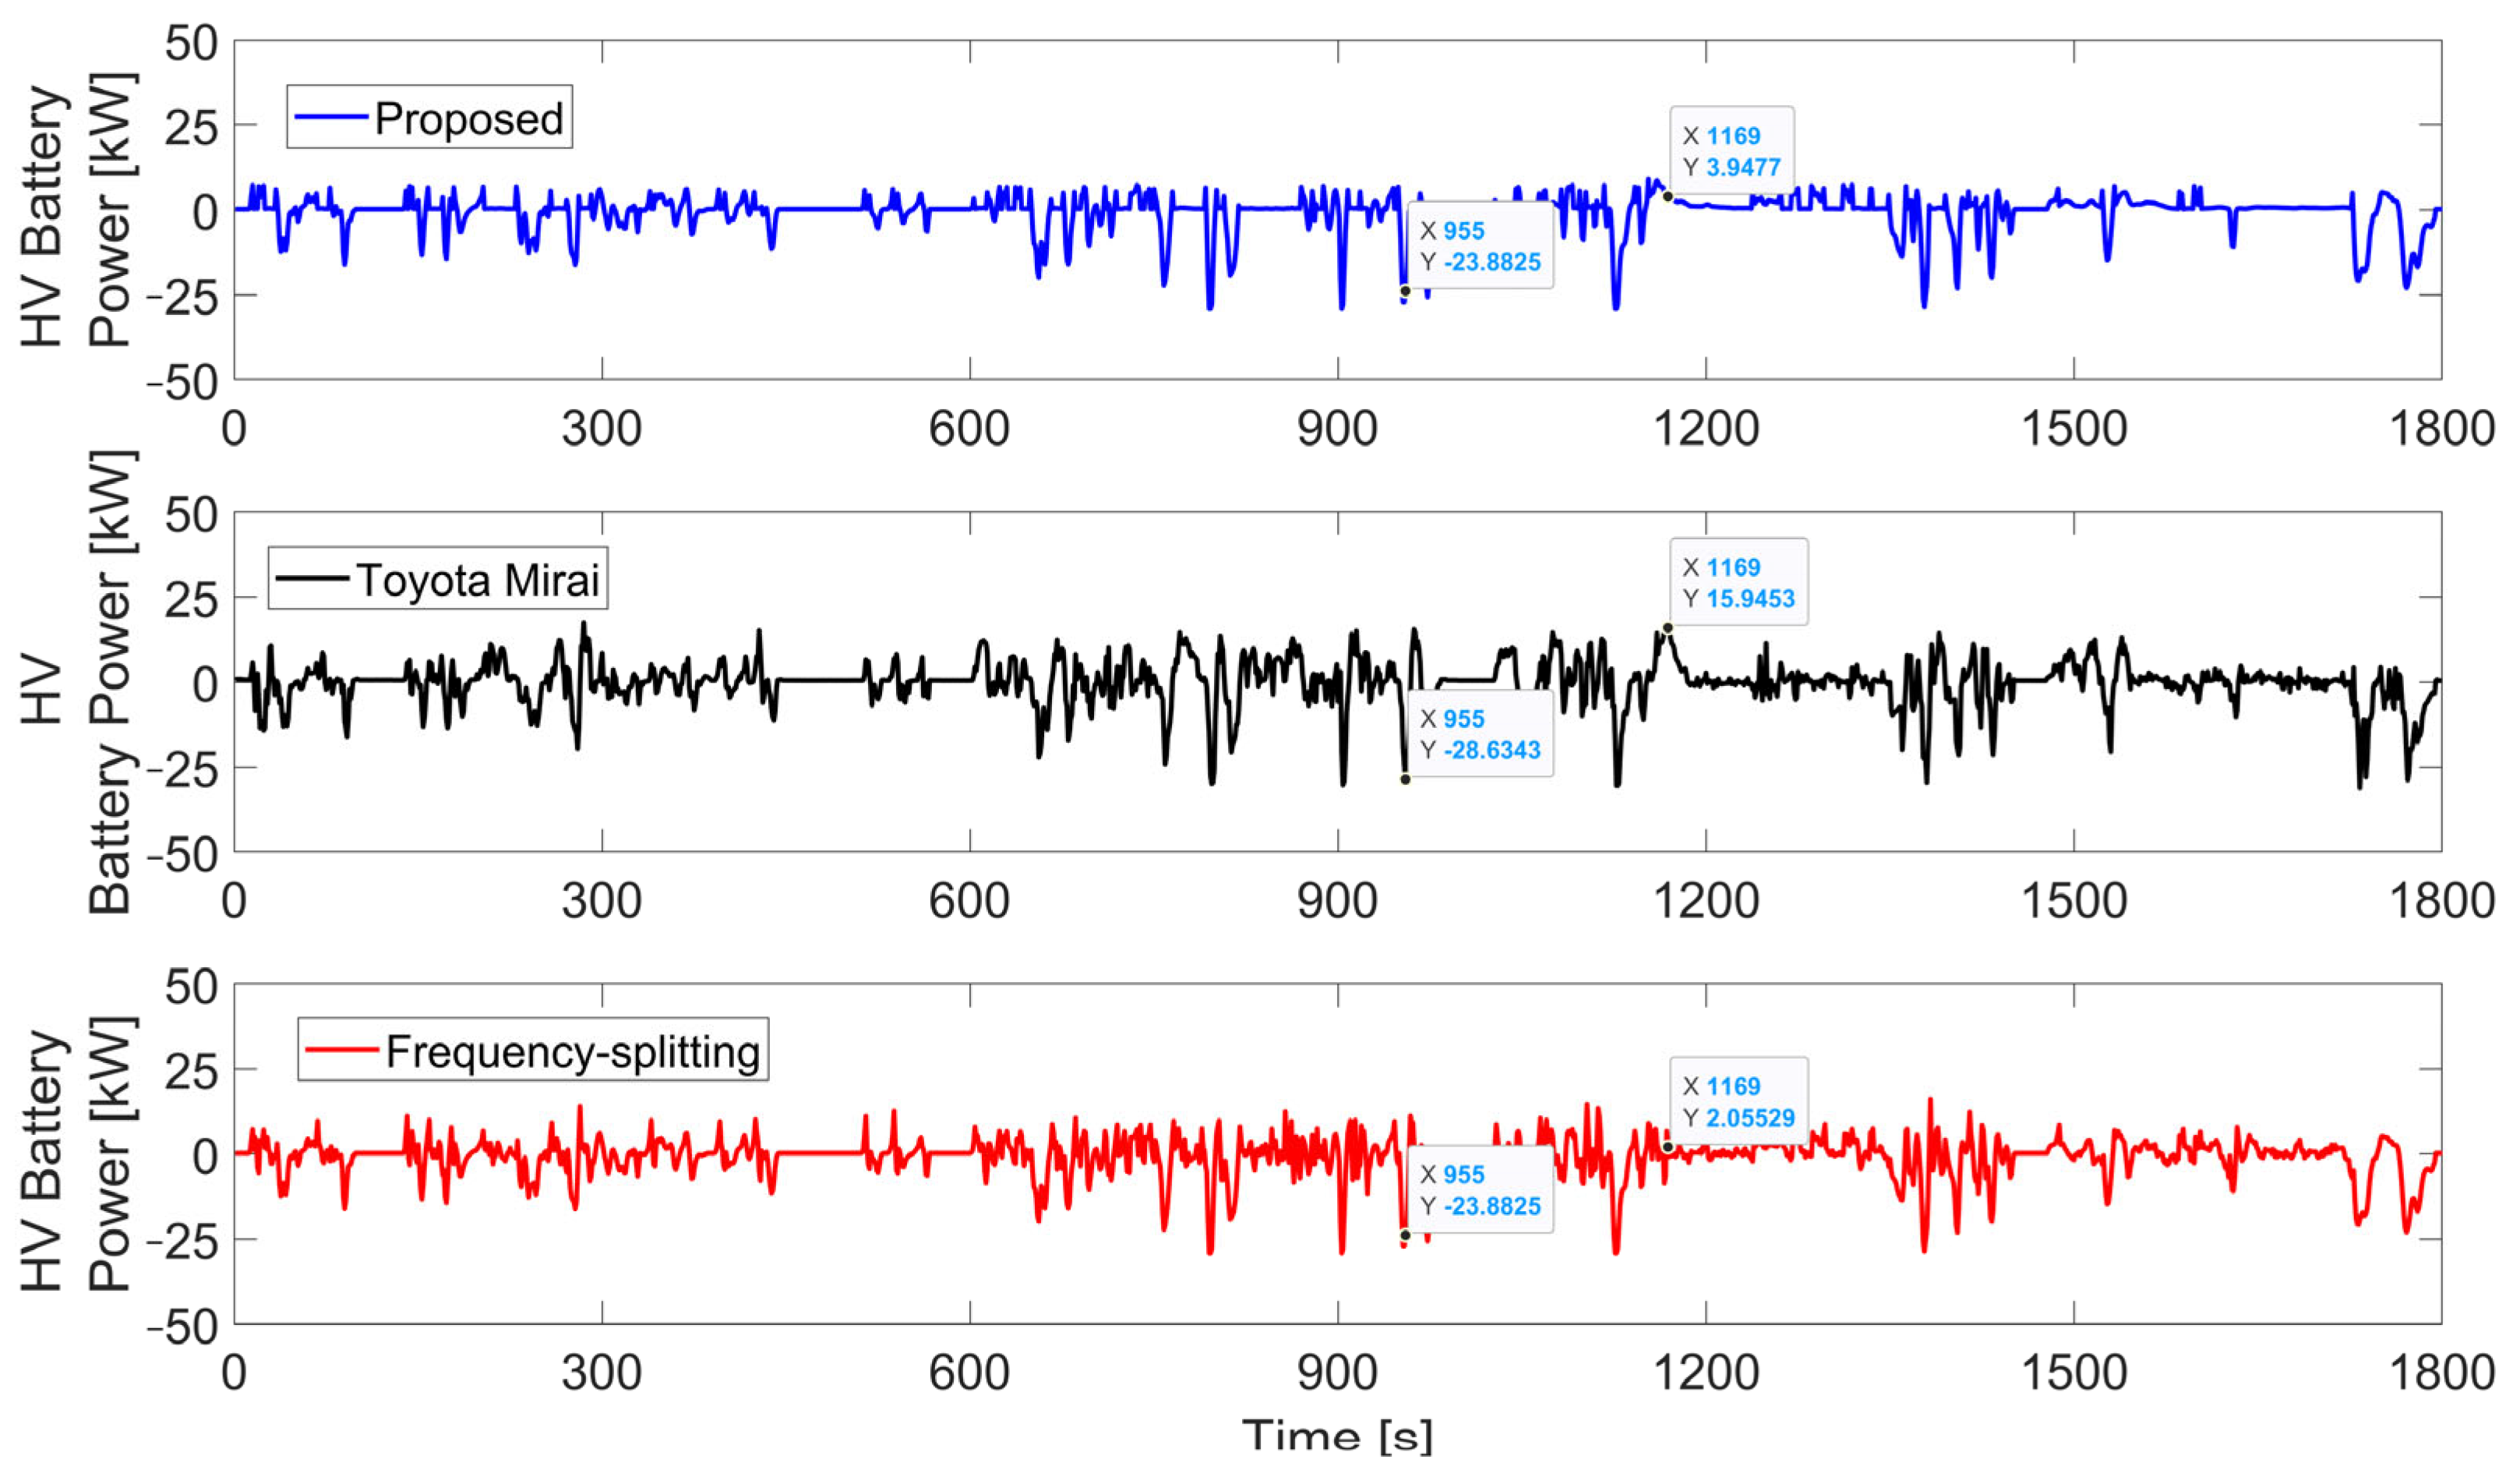
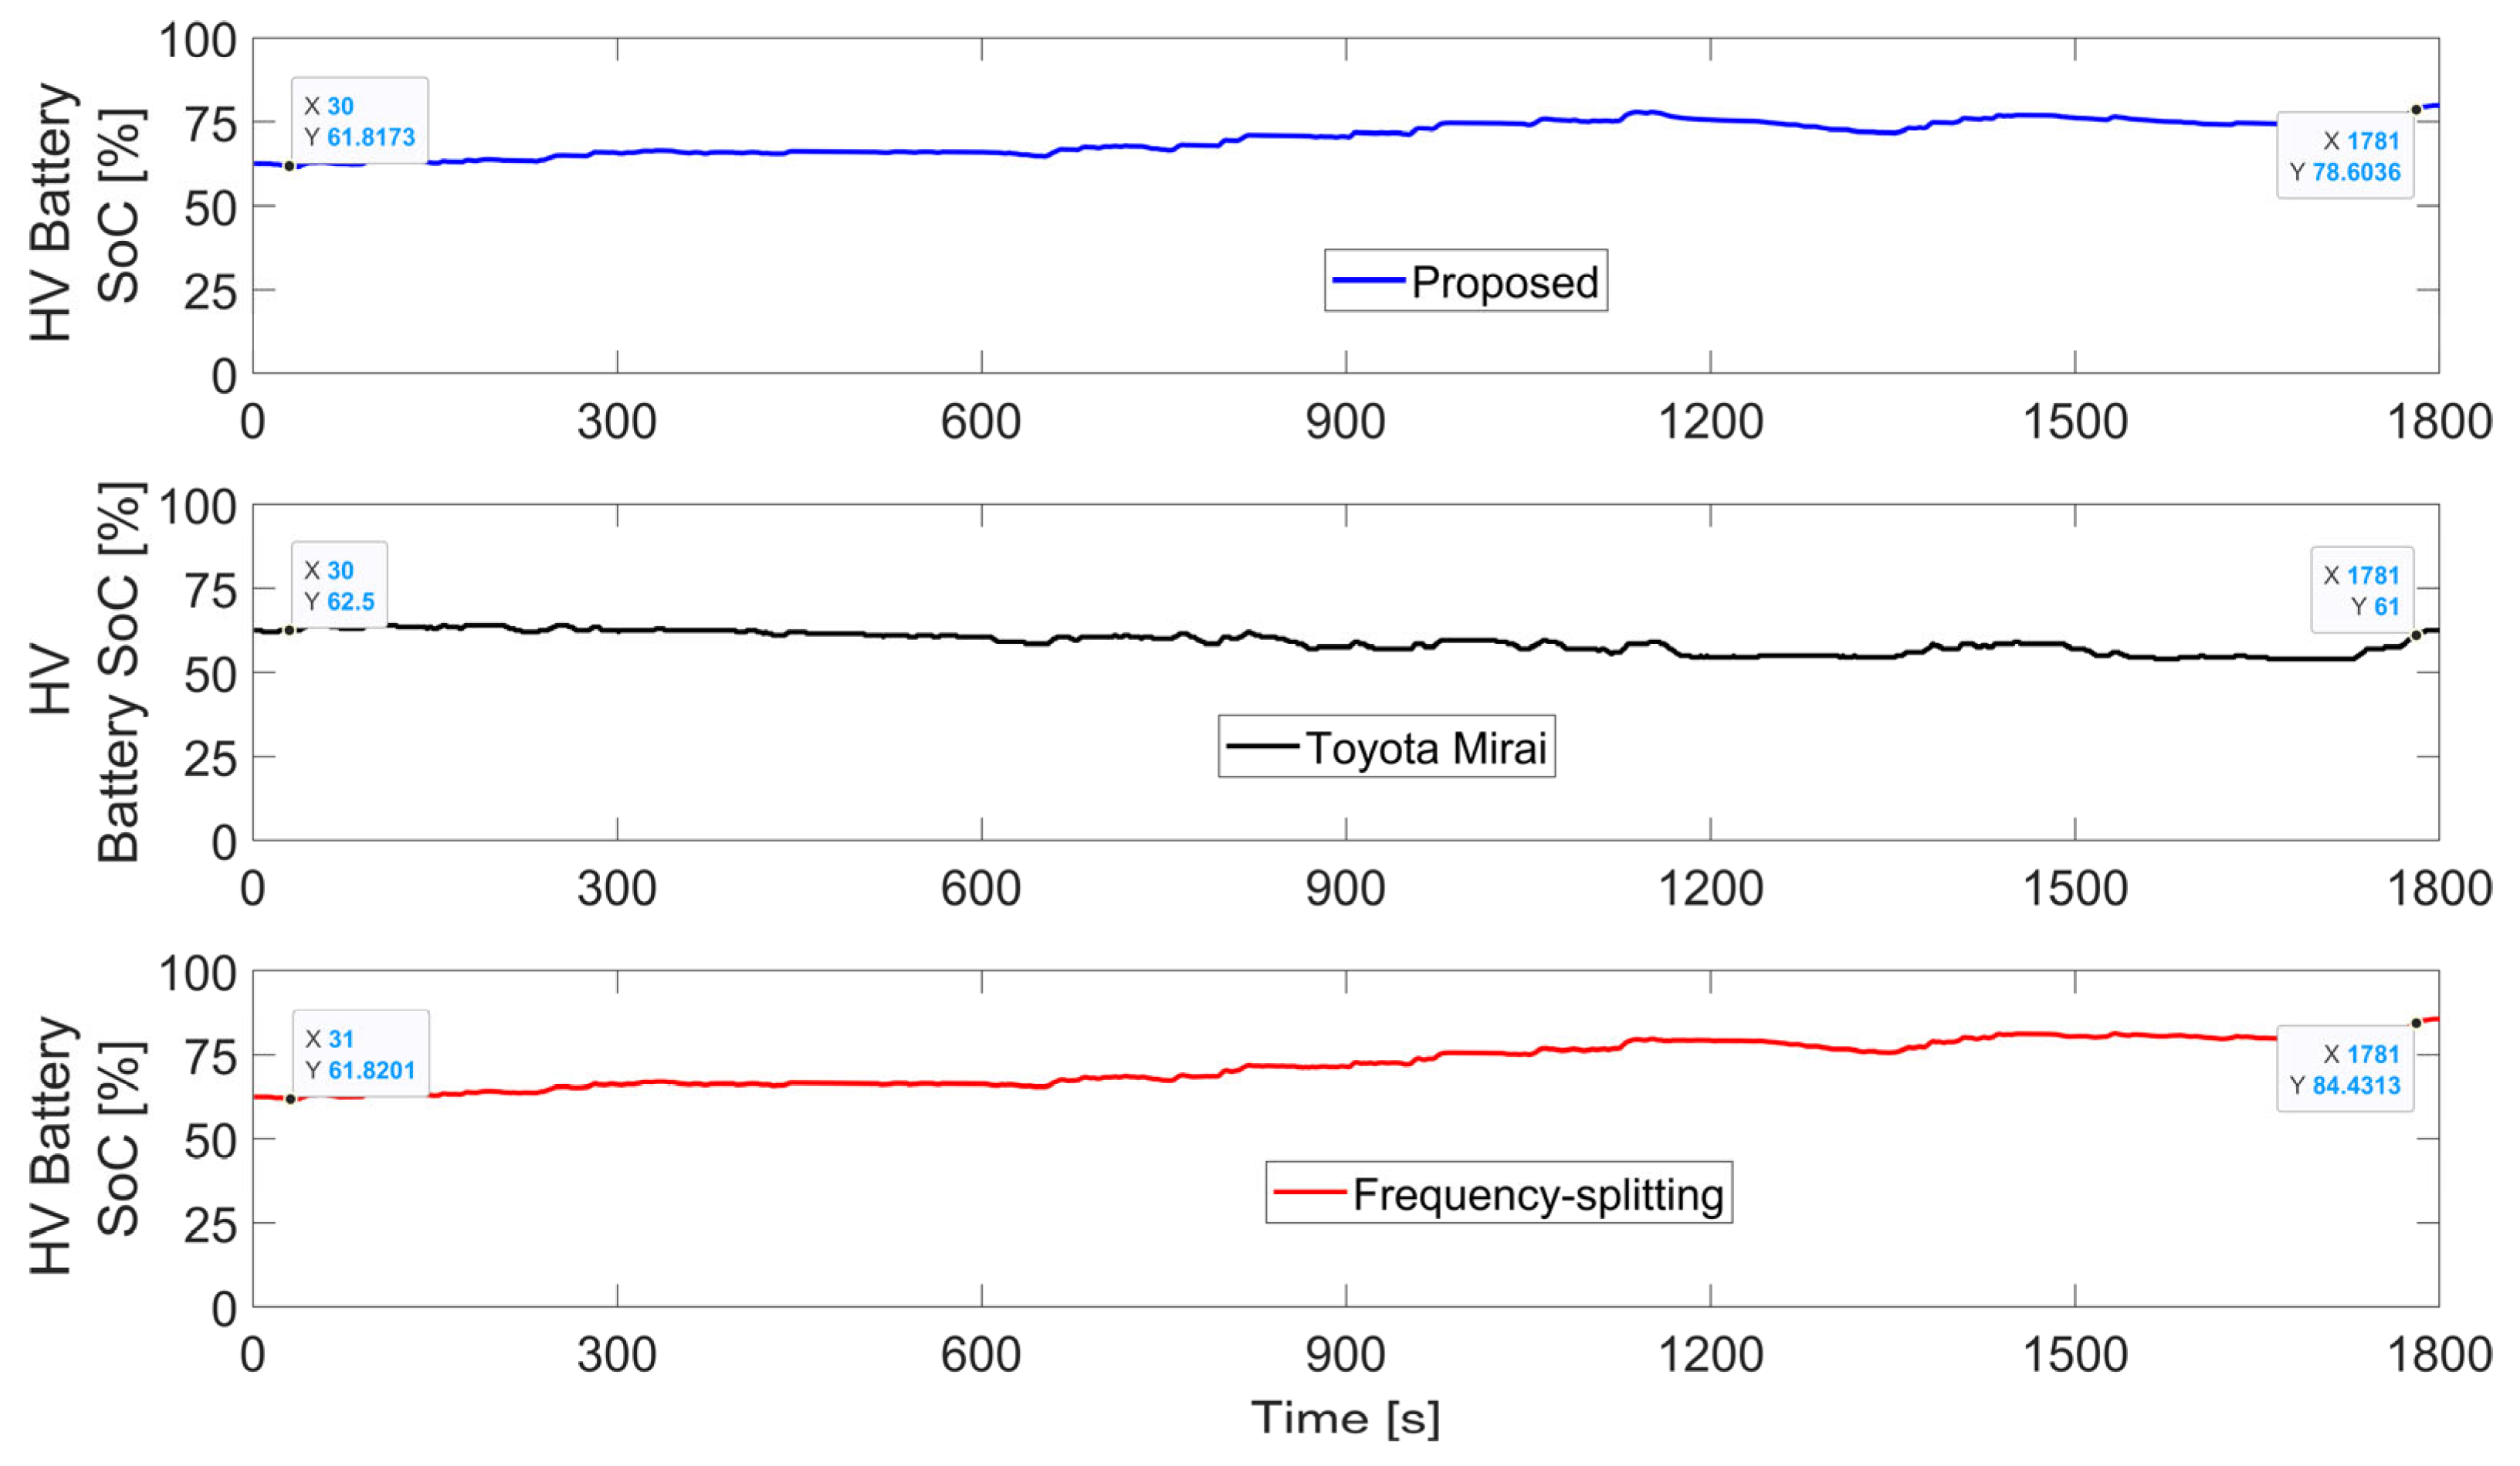
3.2. Performance Benchmarking

The comparative data are collected from the existing power allocation strategy in the Toyota Mirai, as reported in the raw dataset provided by ANL [23], and from a frequency-splitting based PMS, the design of which is inspired by [26,27,28]. This frequency-splitting method is adopted due to its similarity to the Mirai’s power allocation approach, where the load-following rate can be adjusted using a first-order transfer function governed by a predefined power-split rule ( τ r ), as given in Equation (11). The power-split rule is configured to match the aggressive load-following behaviour observed in the Mirai.
P f c = m a x 0   ,   1 τ r s + 1 τ r P e P b = P e P f c
The comparison with data from the existing Toyota Mirai strategy and the frequency-splitting method provides a comprehensive review of how the proposed state transition PMS performs. It also highlights its merits, limitations and potential improvements over existing prevalent approaches. This section corresponds to the WLTP cycle (1800 s).
The fuel cell stack’s power profile (Figure 10) and hydrogen consumption (Figure 11) are first compared across three cases: the proposed approach, test data from the actual vehicle and the frequency-splitting method. The overall evolution of how the fuel cell powers the electric motor appears closely aligned across all three methods. However, the selected data cursors placed at different time frames reveal clear differences, indicating that the methods do not exactly match. This observation supports the objective of this work: not solely replicate the behaviour of the real vehicle but also introduce an alternative power allocation strategy that performs comparably while offering tangible improvements. These improvements become more evident in the subsequent figures. It is also apparent that the frequency-splitting strategy is appropriately configured, as its performance is in line with the other two methods. Notably, all three approaches perform satisfactorily and ensure that the fuel cell stack operates within its designated bounds.
The tangible advantage of the proposed method is evident in Figure 11, where it demonstrates a saving of approximately 6 g of hydrogen during the WLTP cycle, equating to around 14.5 miles of driving distance. While this may appear modest, it is important to remember that this saving applies to a single driving cycle. Given the current limitations of the hydrogen refuelling infrastructure, even such incremental improvements are promising. This benefit can be attributed to the proposed state transition power allocation strategy, which utilises less conservative SoC limits. This allows for better use of the battery’s energy while still respecting the defined safety bounds (25% < SoC < 90%). As a result, the fuel cell stack experiences reduced load under certain conditions, leading to lower hydrogen consumption.
The HV battery profile exhibits greater variation compared with other characteristics, as illustrated in Figure 12. This is primarily due to the operational nature of the proposed strategy. When the battery SoC is below its upper soft limit (SoC < 75%), it powers the electric motor only when the demand is less than or equal to 7 kW. At the same time, it captures all available recuperated energy, provided this remains within its peak power limits. However, once the SoC exceeds its allocated upper soft limit, the system transitions to a state in which a significant portion of load is supplied by the HV battery (again within the allocated power constraints). This shift results in the reduced demand on the fuel cell stack during such periods, thereby contributing to lower hydrogen consumption.
The SoC of the HV battery is a particularly interesting aspect, as it highlights key differences among the three competing strategies: the proposed state transition approach, the existing strategy used in the Toyota Mirai and the frequency-splitting strategy. As discussed earlier, the Mirai adopts a conservative CSCD mode of operation. As a result, the HV battery functions within a narrow SoC range while ensuring it never breaches the predefined bounds. In contrast, the proposed strategy introduces a flexible SoC range by dividing it into two zones. As illustrated in Figure 13, when the HV battery’s SoC exceeds 75% (the upper soft limit in the proposed method), the system transitions into a new state in which the HV battery contributes more significantly towards the traction load. The further the SoC is from the soft limit, the greater the battery’s contribution towards load, creating a feedback loop that regulates battery usage. This feedback mechanism is absent in the frequency-splitting approach, where battery energy continues to accumulate without a corrective process in place. As a result, the proposed strategy not only ensures more effective utilisation of the battery’s energy but also does so within flexible and real-time-adjustable boundaries.
The quantified results are summarised in Table 1, which compares the three competing strategies on equal terms, highlighting the potential merits and limitations of the proposed method. The comparison is organised into two main categories, operational characteristics and sources profile, with the latter reflecting degradation-related behaviour. This structured assessment provides a balanced perspective on both the performance and the long-term potential wear on the key powertrain components under each strategy. The source profile includes metrics that reflect the time spent in operating states known to accelerate source ageing. These factors indirectly capture ageing mechanisms, for example, the frequent exposure of the fuel cell stack to rapid power fluctuations in excess of 10 kW/s [4,29]. Several relevant metrics have been introduced to consider the degradation of both the fuel cell stack and the HV battery, as outlined below:
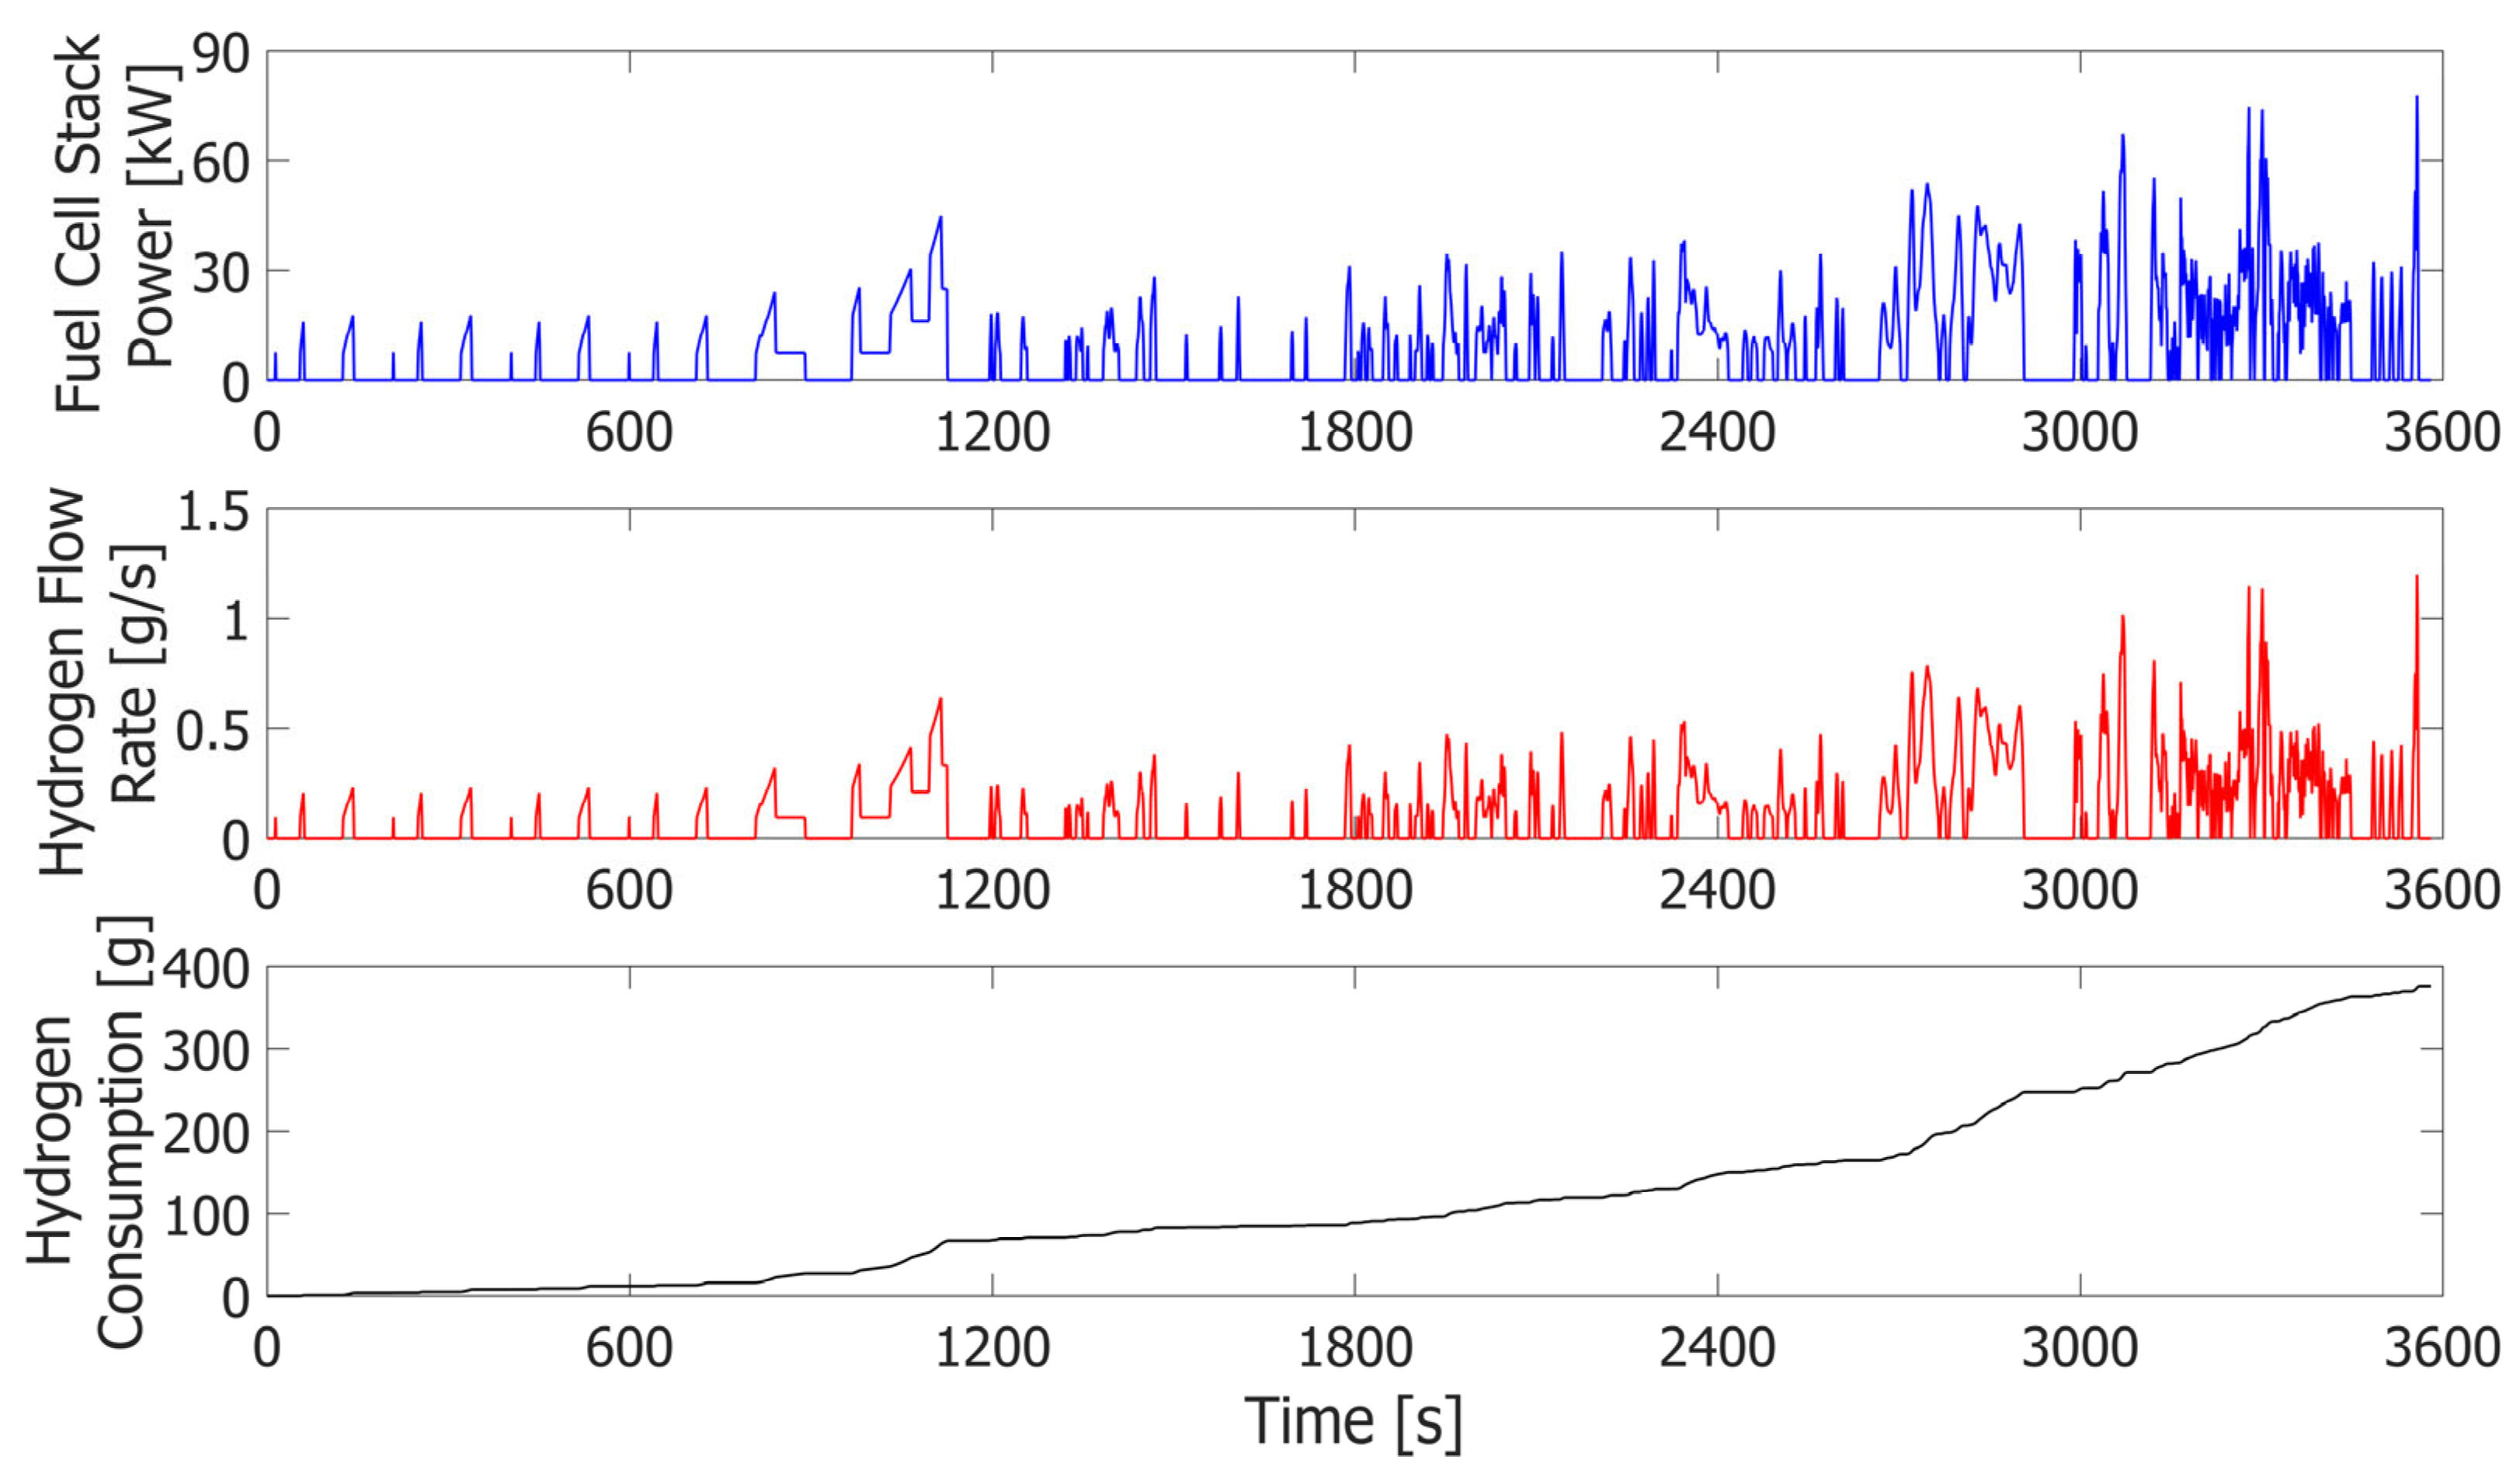
  • The total hydrogen consumed in kg.
  • The cost factor in euros (EUR) per kilogram is adopted from [30] and based on the green hydrogen production pathway.
  • Overall efficiency (eta) expressed in both miles per kilogram and miles per EUR.
  • Δidle is the % of total driving time during which the fuel cell stack remains idle.
  • Δramp is the % of total driving time during which the fuel cell power change rate exceeds 10 kW/s.
  • Δswitch is the % of total driving time spent switching between idle and active states.
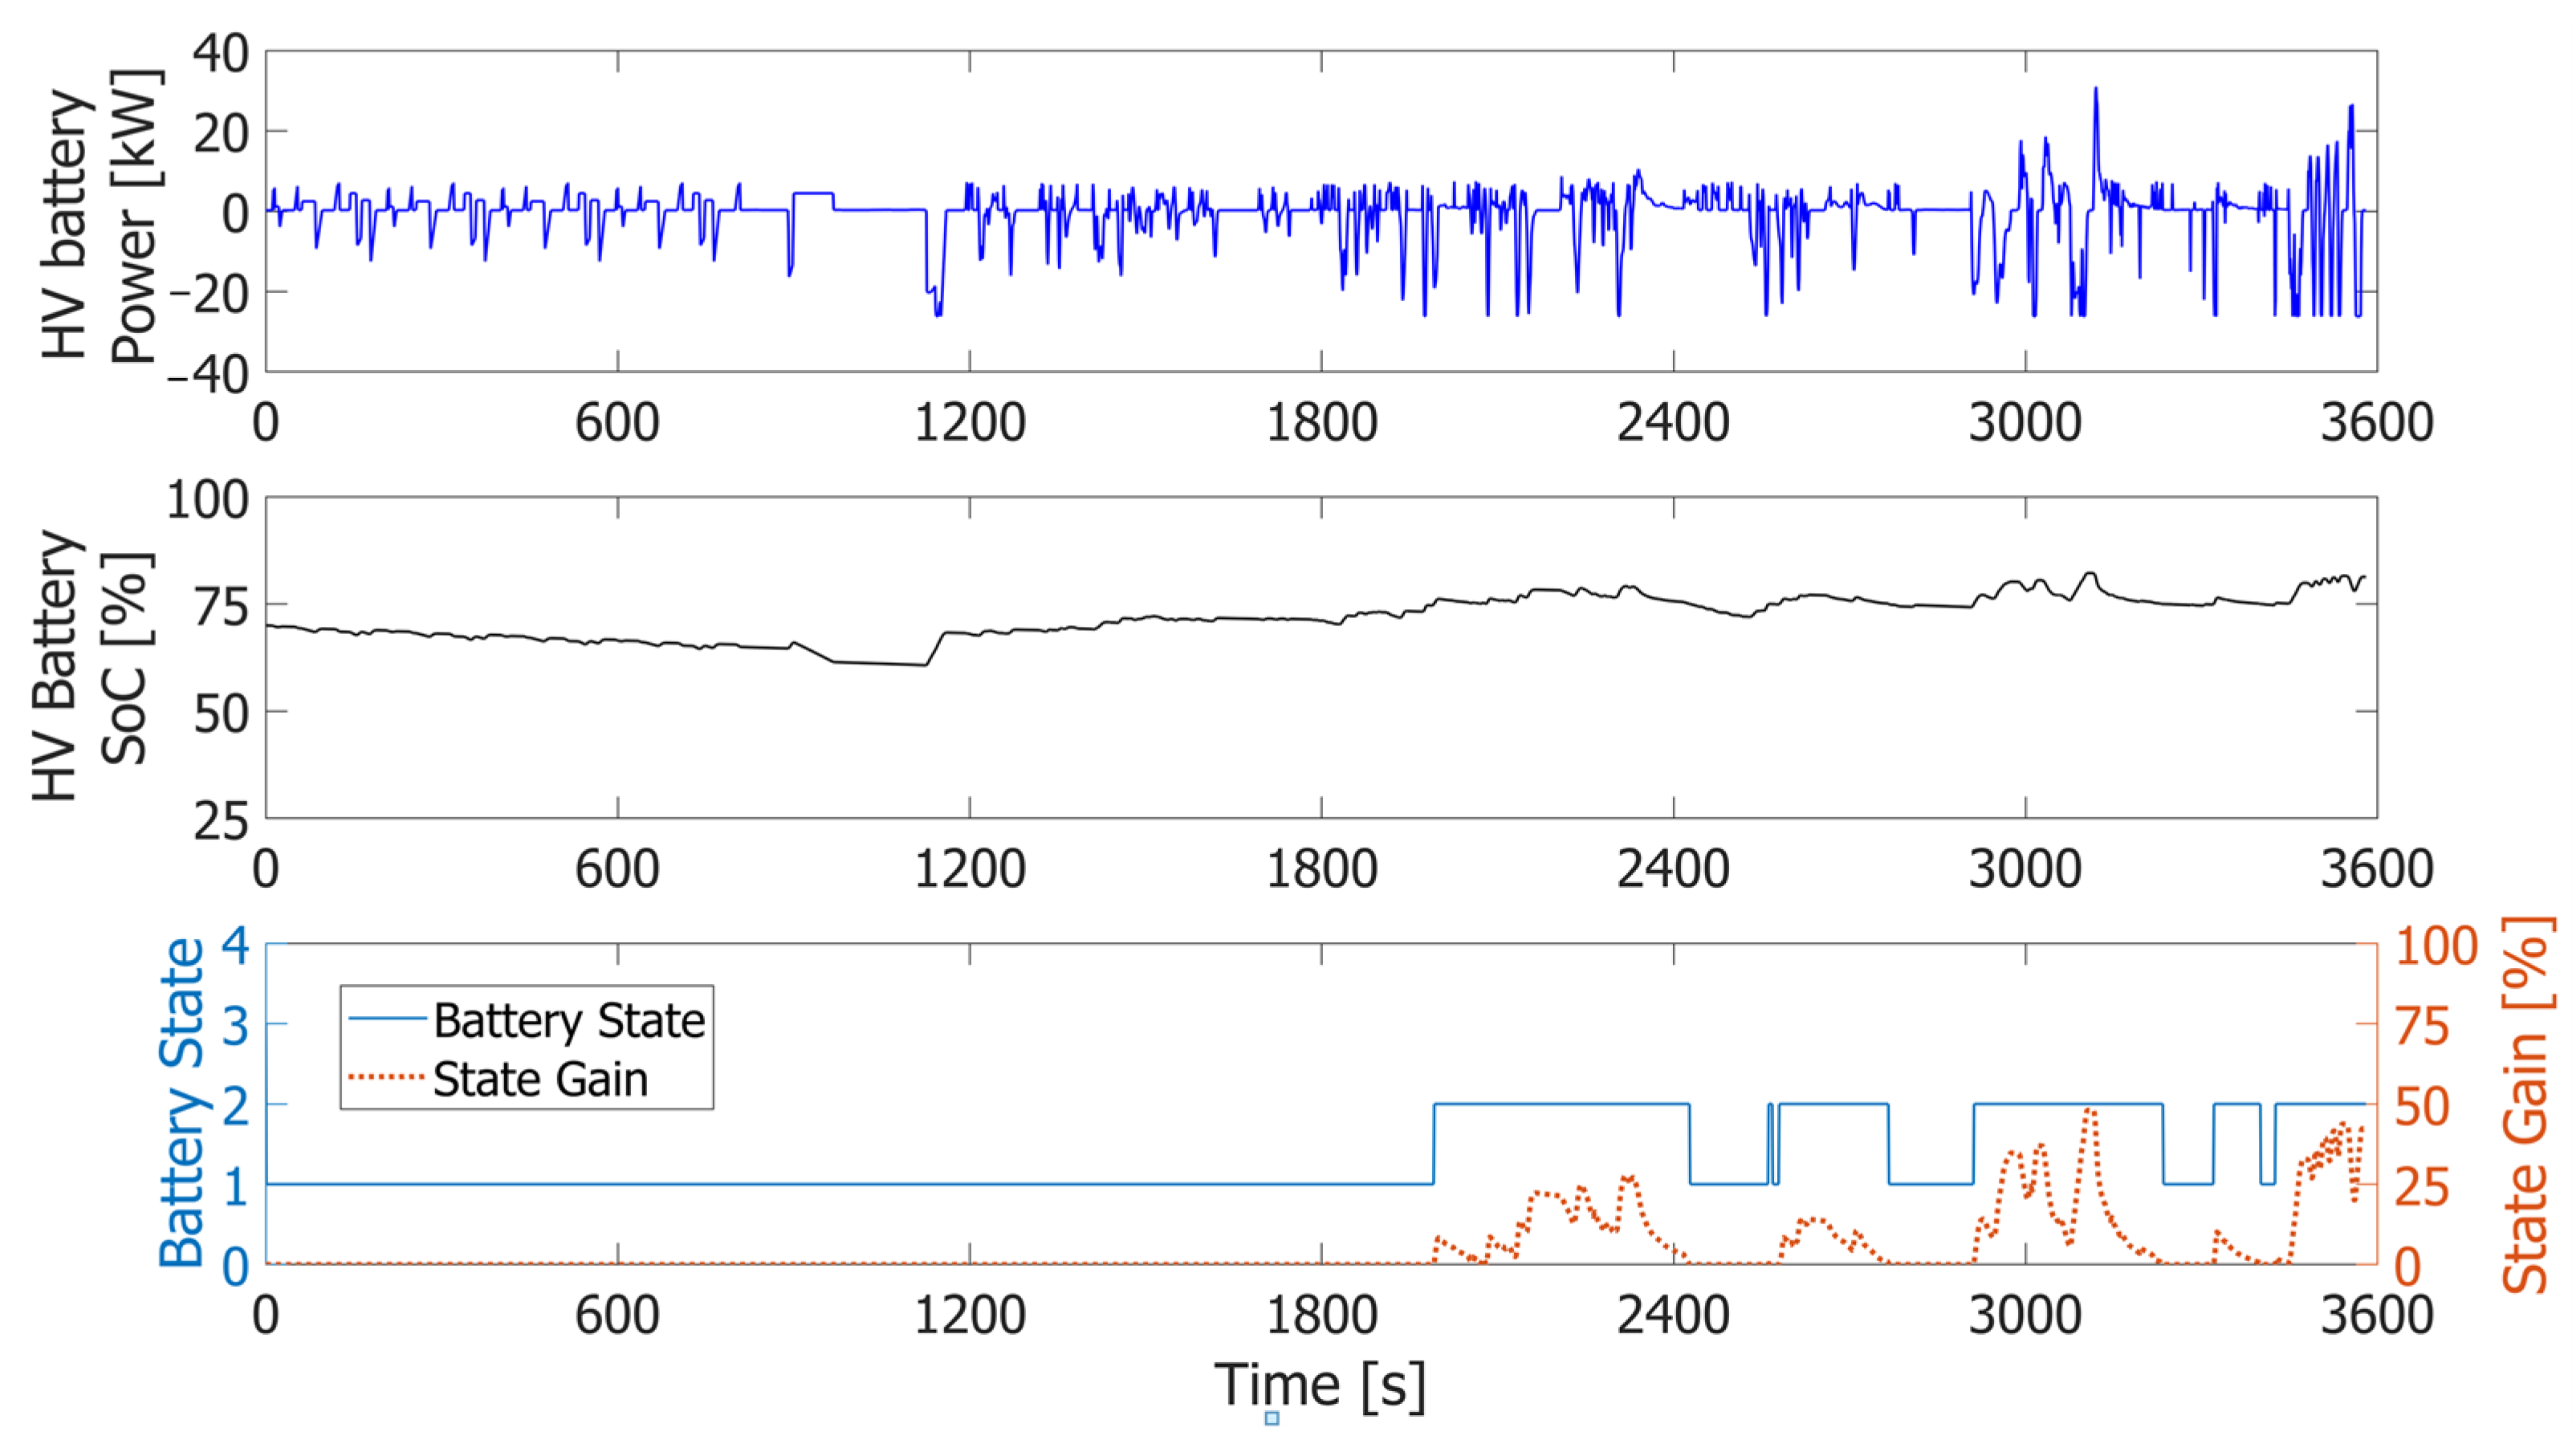
  • The percentage of total driving time during which the HV battery’s SoC exceeds the soft limits (50% < SoC < 75%).
  • The number of instances where the battery power exceeds the 30 kW peak threshold.
From Table 1, the superiority of the proposed method is evident, as previously discussed, with a reduction of 6 g in hydrogen consumption in the WLTP endurance cycle, which covers 14.44 miles. Although this may seem modest, it can translate into more substantial savings over extended driving cycles or in iterative real-world applications. This improvement aligns with the earlier discussion, highlighting how the proposed power allocation strategy enables more effective utilisation of battery energy within its defined, less conservative limits. By doing so, it reduces the load on the fuel cell under certain conditions, leading to lower hydrogen consumption.
However, this benefit comes with a trade-off. For instance, the battery exceeds its soft upper SoC limit of 75% for approximately 11.87% (ΔSoC) of the total time. While this may raise concerns, the proposed strategy compensates by allowing for a more aggressive battery contribution the further the SoC deviates from this 75% soft limit, creating a feedback mechanism. Nonetheless, this could potentially contribute to accelerated battery degradation over time.
As for the fuel cell stack, two key ageing-related parameters, Δramp and Δswitch, are slightly higher in the proposed method compared with the existing Mirai strategy. Although the increase is marginal, it indicates that while fuel savings are achieved, there may be a corresponding increase in the ageing rate of energy sources. This trade-off between efficiency and long-term durability reflects a complex design challenge. While the degradation impact is indirectly accounted for, thermal modelling is beyond the scope of this paper and is reserved for future work or left open for readers to explore further.
The benchmark is extended by including articles based on their consistency and coherence with this work, for example those having similar specifications, evaluation criteria and driving cycle. Table 2 presents a diverse set of results; however, the comparison criteria remain consistent, and the quantitative outcomes are generally in close proximity. From this comparison, the optimisation-based strategy (ECMS) demonstrates clear superiority, offering significant savings in hydrogen consumption, around 24 and 19 g reductions compared with the Mirai dataset and the proposed approach, respectively, in the WLTP cycle (14.44 miles). However, as anticipated, this improvement comes at the cost of increased battery utilisation, resulting in a lower final SoC, which may pose concerns in extended driving scenarios. Rule-based strategies are generally comparable in performance. The proposed strategy shows potential to outperform other rule-based counterparts in terms of fuel efficiency. Nonetheless, it appears to impose greater demand on the HV battery, as evidenced by a larger deviation from its initial setpoint. This behaviour is expected, since the proposed method leverages less conservative SoC boundaries while ensuring that the battery remains within its safe operating limits. When the SoC exceeds its upper threshold of 75%, the proposed strategy dynamically reallocates power distribution, pushing the fuel cell to contribute more.

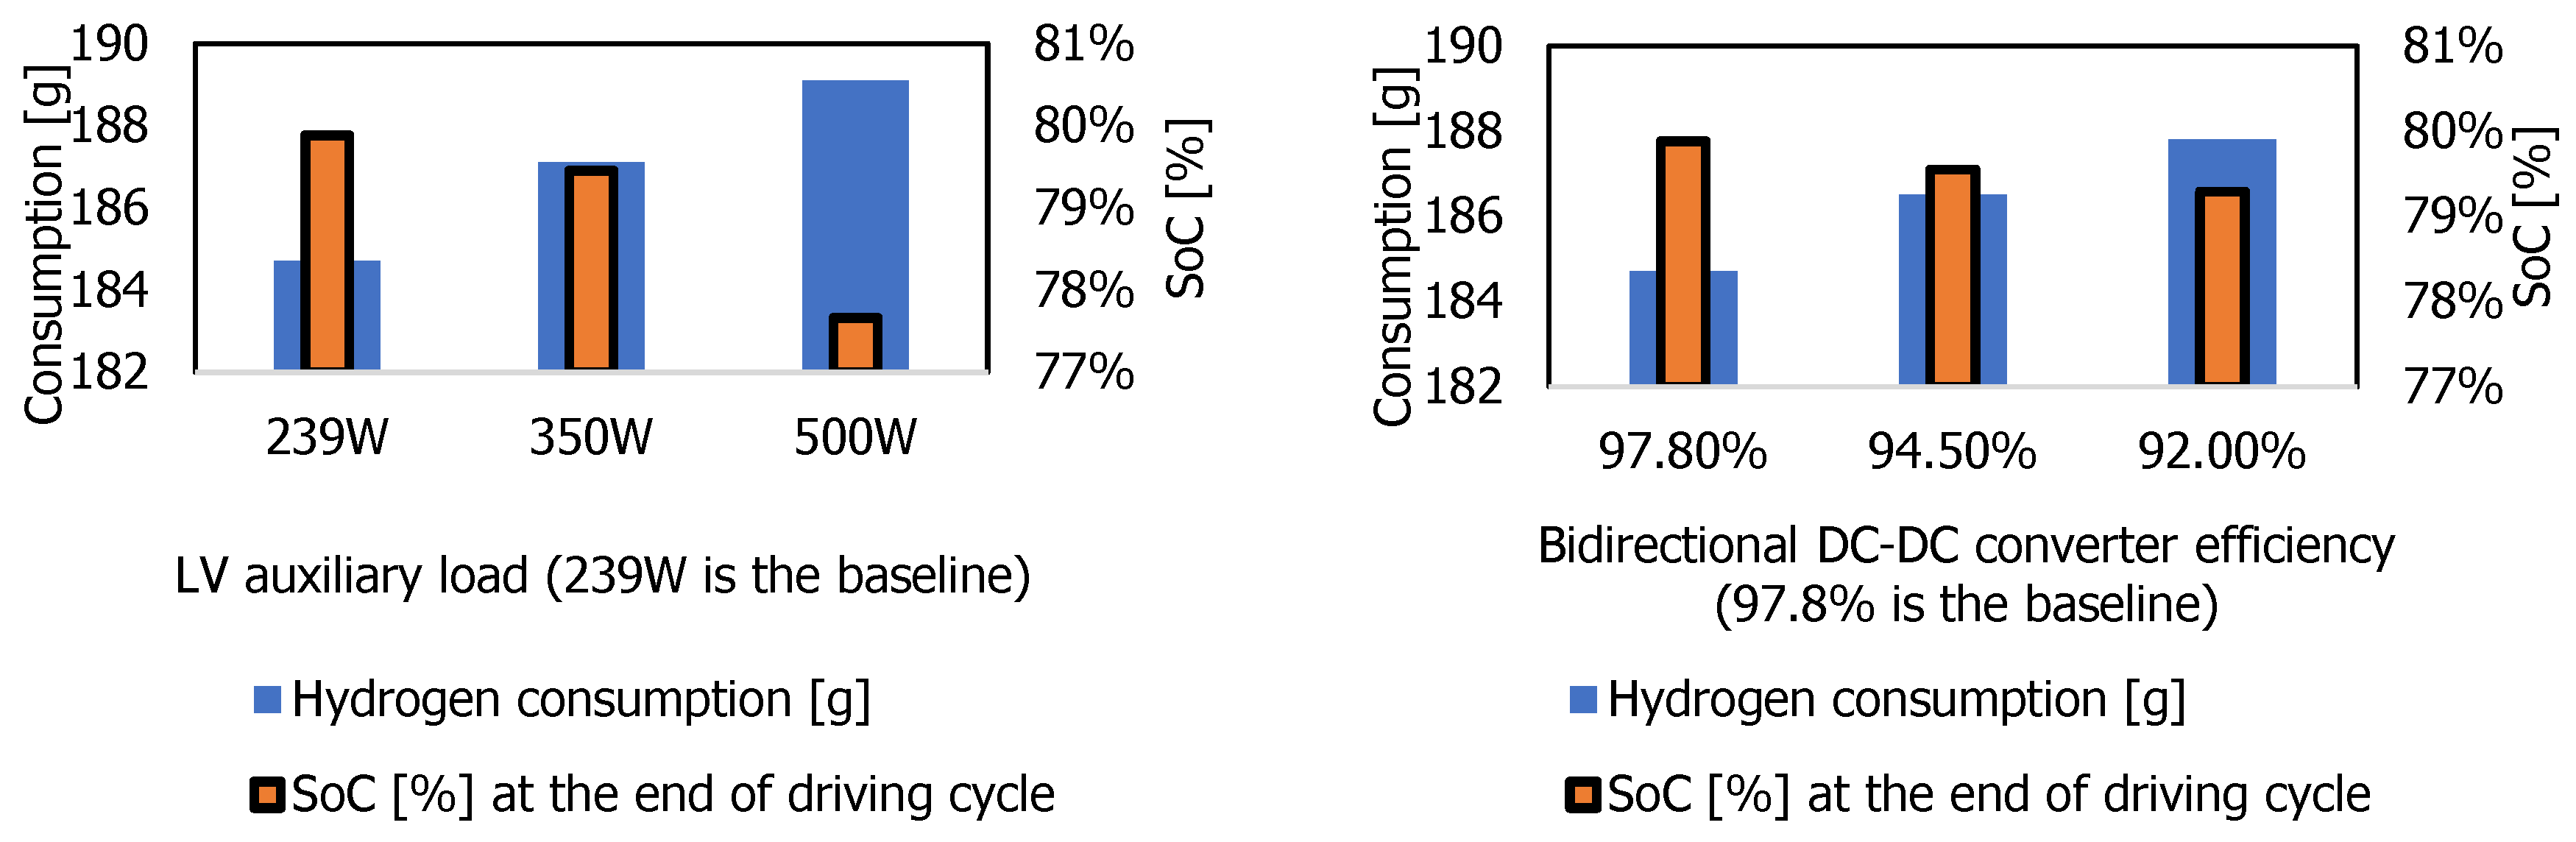
3.3. Sensitivity and Emission Analysis

As this study aims to replicate the specifications of the Toyota Mirai, it is appropriate to conduct a sensitivity analysis on the assumptions made. One such assumption is the LV auxiliary load, set to a constant 239 W based on data from the ANL report, assuming an ambient temperature of 72 °F with no HVAC demand. However, under colder conditions, the HVAC load can significantly impact overall system efficiency. Three alternative scenarios are introduced: (i) a 500 W auxiliary load reflecting cold-weather conditions, including HVAC; (ii) an intermediate case with an elevated LV load but no HVAC; and (iii) the baseline case. Additionally, the HV battery’s DC-DC bidirectional converter efficiency represents another key assumption. Due to limited data in the ANL report, an average efficiency of 97.8% is assumed. Although this is supported by the published literature [4], this work also models two additional scenarios: a worse-case efficiency of 92% and an intermediate value of 94.5%. While one factor is varied in sensitivity analysis, the other is held constant at its baseline value.
Figure 14 illustrates the impact of varying two key assumed factors: the LV auxiliary load and the HV battery’s DC-DC converter efficiency. The impact is shown on hydrogen consumption [g] and the SoC profile [%] over the WLTP cycle. As expected, increasing the LV auxiliary load beyond the baseline value of 239 W affects the power allocation between the fuel cell stack and the HV battery. To ensure that the battery remains within its permissible SoC range and peak power limit of 30 kW, the proposed strategy increases the fuel cell’s contribution, leading to higher hydrogen consumption. It is worth noting that had the HV battery offered greater flexibility, it would have supported this additional load by itself. Therefore, this graph highlights a trade-off between SoC constraints and hydrogen consumption, which is actively managed by the proposed power allocation strategy in response to varying the LV auxiliary load.
From the emission perspective, reference [30] highlights that the green hydrogen production pathway has significantly lower carbon emissions compared with other production methods, hence preferred. The production cost of green hydrogen is reported to range from 3.04 to 13.27 EUR per kg, depending on the location and availability of renewable energy [31]. For this analysis, the upper limit of 13 EUR per kg is adopted. Within the same green pathway, the associated CO2 emissions are reported to be less than 5 kg per kg of hydrogen produced. This also includes emissions from waste management and considers that the electrolyser operates on a mix of 35% solar and 65% wind power [32]. Using these parameters and based on prior results, the expected CO2 emissions for one WLTP driving cycle (14.44 miles) amount to 0.92 kg, with 0.184 kg of hydrogen consumed. This equates to approximately 6.38 kg of CO2 per 100 miles driven. In contrast, an equivalent petrol-powered ICE vehicle produces around 15–16 kg of CO2 per 100 km [30]. Although the current cost of green hydrogen is substantially higher, its environmental benefits are significant. Over time, as the cost of green hydrogen decreases, its use as a sustainable transport fuel will become increasingly justifiable and impactful.

4. Conclusions

This study presents a data-driven simulation framework for a commercial-scale fuel cell hybrid electric powertrain, drawing inspiration from the Toyota Mirai. Using publicly available technical data from Argonne National Laboratory, simplified yet accurate component models were developed to reflect real-world behaviour. Implemented in MATLAB/Simulink, the framework captures key power dynamics and nonlinear interactions while maintaining computational efficiency.
A core contribution of this work is the integration of a dynamic state transition power management and allocation strategy. This system regulates power flow between the fuel cell and the high-voltage battery, ensuring the battery’s SoC remains within defined operational bounds. The strategy enables more effective battery utilisation without over-exploitation, thereby contributing to balanced and efficient performance.
System evaluation under a composite driving cycle comprising NEDC, WLTP Class 3 and US06 demonstrates the simulator’s capacity to replicate diverse real-world driving conditions. The proposed method achieves a reduction of up to 6g in hydrogen consumption over a single WLTP driving cycle (14.44 miles). While this figure may appear modest, it has the potential to scale significantly over an extended period of driving.
However, this efficiency gain introduces certain trade-offs. The battery operates above its soft SoC limit (75%) for 11.87% of the total driving time (14.44 miles), potentially accelerating the degradation process. Similarly, the fuel cell ageing indicators such as ramp rate violations and state switching are marginally elevated compared with the Mirai’s baseline data. While the proposed strategy improves efficiency, it may slightly increase wear on the energy sources. These findings underscore the design challenge of balancing efficiency with longevity; an area identified for future investigation or further reader exploration.

Author Contributions

Conceptualisation, M.I.; methodology, M.I. and A.B.; software, M.I.; validation, M.I., A.B. and M.B.; resources, M.I. and M.B.; writing—original draft preparation, M.I. and A.B.; writing—review and editing, M.I. and M.B.; visualisation, M.I.; supervision, M.B.; funding acquisition, M.B. All authors have read and agreed to the published version of the manuscript.

Funding

No specific funding was received for this work.

Data Availability Statement

The dataset, preliminary results, and model/simulation scripts will be provided upon request.

Acknowledgments

The authors thank the Hydrogen Editorial Office for their support.

Conflicts of Interest

The authors declare no conflicts of interest.

Appendix A

Table A1. The polynomial coefficients used in this work.
α 1 α 2 α 3 α 4 β γ 1 γ 2 γ 3
5 × 10−70.0006−0.2483318.270.0039−8 × 10−60.0026−0.0541
γ 4 ω 1 ω 2 ω 3 σ δ 1 δ 2 δ 3
0.18860.0691−0.64953.25312.14 × 10−50.0443−0.291

References

  1. Jayakumar, A.; Madheswaran, D.K.; Kannan, A.; Sureshvaran, U.; Sathish, J. Can hydrogen be the sustainable fuel for mobility in India in the global context? Int. J. Hydrogen Energy 2022, 47, 33571–33596. [Google Scholar] [CrossRef]
  2. Togun, H.; Basem, A.; Abdulrazzaq, T.; Biswas, N.; Abed, A.M.; Dhabab, J.M.; Chattopadhyay, A.; Slimi, K.; Paul, D.; Barmavatu, P.; et al. Development and comparative analysis between battery electric vehicles (BEV) and fuel cell electric vehicles (FCEV). Appl. Energy 2025, 388, 125726. [Google Scholar] [CrossRef]
  3. Sulaiman, N.; Hannan, M.; Mohamed, A.; Ker, P.; Majlan, E.; Daud, W.W. Optimization of energy management system for fuel-cell hybrid electric vehicles: Issues and recommendations. Appl. Energy 2018, 228, 2061–2079. [Google Scholar] [CrossRef]
  4. Carignano, M.; Costa-Castelló, R. Toyota Mirai: Powertrain model and assessment of the energy management. IEEE Trans. Veh. Technol. 2023, 72, 7000–7010. [Google Scholar] [CrossRef]
  5. Nonobe, Y. Development of the fuel cell vehicle MIRAI. IEEJ Trans. Electr. Electron. Eng. 2016, 12, 5–9. [Google Scholar] [CrossRef]
  6. Tanaka, Y. Development of the mirai fuel cell vehicle. In Hydrogen Energy Engineering; Springer: Berlin, Germany, 2016; pp. 461–475. [Google Scholar]
  7. Legala, A.; Kubesh, M.; Chundru, V.R.; Conway, G.; Li, X. Machine learning modeling for fuel cell-battery hybrid power system dynamics in a Toyota Mirai 2 vehicle under various drive cycles. Energy AI 2024, 17, 100415. [Google Scholar] [CrossRef]
  8. Iqbal, M.; Laurent, J.; Benmouna, A.; Becherif, M.; Ramadan, H.S.; Claude, F. Ageing-aware load following control for composite-cost optimal energy management of fuel cell hybrid electric vehicle. Energy 2022, 254, 124233. [Google Scholar] [CrossRef]
  9. Manoharan, Y.; Hosseini, S.E.; Butler, B.; Alzahrani, H.; Foua, B.; Ashuri, T.; Krohn, J. Hydrogen Fuel Cell Vehicles; Current Status and Future Prospect. Appl. Sci. 2019, 9, 2296. [Google Scholar] [CrossRef]
  10. Tokieda, J.; Ozawa, T.; Yoshida, T.; Aida, S.; Oya, L. The MIRAI Life Cycle Assessment Report; Toyota Motor Corporation: Toyota City, Japan, 2015. [Google Scholar]
  11. Davis, S.; Williams, R.B.; Moore, S. 2016 Vehicle Technologies Market Report; Oak Ridge National Laboratory: Oak Ridge, TN, USA, 2016. [Google Scholar]
  12. Available online: https://global.toyota/pages/global_toyota/mobility/technology/toyota-technical-review/TTR_Vol66_E.pdf (accessed on 10 July 2025).
  13. Lohse-Busch, H.; Stutenberg, K.; Duoba, M.; Iliev, S. Technology Assessment of a Fuel Cell Vehicle: 2017 Toyota Mirai (No. ANL/ESD-18/12); Argonne National Laboratory (ANL): Argonne, IL, USA, 2018. [Google Scholar]
  14. Usmanov, U.; Ruzimov, S.; Tonoli, A.; Mukhitdinov, A. Modeling, simulation and control strategy optimization of fuel cell hybrid electric vehicle. Vehicles 2023, 5, 464–481. [Google Scholar] [CrossRef]
  15. Hua, Z.; Li, X.; Bai, H.; Zhao, D.; Wang, Y.; Dou, M.; Liu, C. Nonintrusive Condition Monitoring of FCEV Using System-Level Digital Twin Model. IEEE Trans. Transp. Electrif. 2023, 10, 1314–1323. [Google Scholar] [CrossRef]
  16. Bartolucci, L.; Cennamo, E.; Cordiner, S.; Mulone, V.; Pasqualini, F.; Boot, M.A. Digital twin of a hydrogen Fuel Cell Hybrid Electric Vehicle: Effect of the control strategy on energy efficiency. Int. J. Hydrogen Energy 2023, 48, 20971–20985. [Google Scholar] [CrossRef]
  17. Bartolucci, L.; Cennamo, E.; Cordiner, S.; Mulone, V.; Pasqualini, F.; Boot, M.A. Digital Twin of Fuel Cell Hybrid Electric Vehicle: A detailed modelling approach of the hydrogen powertrain and the auxiliary systems. In E3S Web of Conferences; EDP Sciences: London, UK, 2022; Volume 334, p. 06003. [Google Scholar]
  18. Iqbal, M.; Becherif, M.; Ramadan, H.S.; Badji, A. Dual-layer approach for systematic sizing and online energy management of fuel cell hybrid vehicles. Appl. Energy 2021, 300, 117345. [Google Scholar] [CrossRef]
  19. Available online: https://media.toyota.co.uk/wp-content/uploads/sites/5/pdf/210223M-Mirai-Tech-Spec.pdf (accessed on 10 July 2025).
  20. Available online: https://khkgears.net/new/gear_knowledge (accessed on 10 July 2025).
  21. Available online: https://motoranalysis.com/motoranalysis-pm/ (accessed on 10 July 2025).
  22. Huang, Q.; Huang, Q.; Guo, H.; Cao, J. Design and research of permanent magnet synchronous motor controller for electric vehicle. Energy Sci. Eng. 2023, 11, 112–126. [Google Scholar] [CrossRef]
  23. Available online: https://www.anl.gov/taps/d3-2016-toyota-mirai (accessed on 10 July 2025).
  24. Iqbal, M.; Benmouna, A.; Becherif, M.; Mekhilef, S. Survey on battery technologies and modeling methods for electric vehicles. Batteries 2023, 9, 185. [Google Scholar] [CrossRef]
  25. Available online: https://uk.mathworks.com/help/autoblks/ref/drivecyclesource.html (accessed on 10 July 2025).
  26. Badji, A.; Abdeslam, D.O.; Becherif, M.; Eltoumi, F.; Benamrouche, N. Analyze and evaluate of energy management system for fuel cell electric vehicle based on frequency splitting. Math. Comput. Simul. 2020, 167, 65–77. [Google Scholar] [CrossRef]
  27. Iqbal, M.; Ramadan, H.S.; Becherif, M. Health-aware frequency separation method for online energy management of fuel cell hybrid vehicle considering efficient urban utilization. Int. J. Hydrogen Energy 2021, 46, 16030–16047. [Google Scholar] [CrossRef]
  28. Snoussi, J.; Elghali, S.B.; Benbouzid, M.; Mimouni, M.F. Optimal sizing of energy storage systems using frequency-separation-based energy management for fuel cell hybrid electric vehicles. IEEE Trans. Veh. Technol. 2018, 67, 9337–9346. [Google Scholar] [CrossRef]
  29. Huo, H.; Cai, H.; Zhang, Q.; Liu, F.; He, K. Life-cycle assessment of greenhouse gas and air emissions of electric vehicles: A comparison between China and the US. Atmos. Environ. 2015, 108, 107–116. [Google Scholar] [CrossRef]
  30. Durkin, K.; Khanafer, A.; Liseau, P.; Stjernström-Eriksson, A.; Svahn, A.; Tobiasson, L.; Andrade, T.S.; Ehnberg, J. Hydrogen-powered vehicles: Comparing the powertrain efficiency and sustainability of fuel cell versus internal combustion engine cars. Energies 2024, 17, 1085. [Google Scholar] [CrossRef]
  31. Tang, O.; Rehme, J.; Cerin, P. Levelized cost of hydrogen for refueling stations with solar PV and wind in Sweden: On-grid or off-grid? Energy 2022, 241, 122906. [Google Scholar] [CrossRef]
  32. Gerloff, N. Comparative Life-Cycle-Assessment analysis of three major water electrolysis technologies while applying various energy scenarios for a greener hydrogen production. J. Energy Storage 2021, 43, 102759. [Google Scholar] [CrossRef]
Figure 1. The Mirai’s hybrid powertrain layout, as provided in Toyota’s official documentation and interpreted from the publicly available ANL report [4,12,13].
Hydrogen 06 00053 g001
Figure 2. Speed and power demand profiles for the synthesised driving cycle: a sequential combination of NEDC (1180 s), WLTP class 3 (1800 s) and US06 (600 s).
Hydrogen 06 00053 g002
Figure 3. On the left is the fuel cell stack polarisation curve. On the right is the fuel cell stack internal resistance.
Hydrogen 06 00053 g003
Figure 4. On the left is the hydrogen flow rate. On the right is the boost converter efficiency.
Hydrogen 06 00053 g004
Figure 5. The modelling of the fuel cell auxiliaries. On the left is the hydrogen and water pumps consumption. On the right is the fuel cell compressor consumption.
Hydrogen 06 00053 g005
Figure 6. The proposed power management system is based on a state transition controller.
Hydrogen 06 00053 g006
Figure 7. The fuel cell stack’s contribution and the overall hydrogen consumption.
Hydrogen 06 00053 g007
Figure 8. The fuel cell auxiliary components’ power consumption and losses.
Hydrogen 06 00053 g008
Figure 9. The HV battery power profile, SoC and transition behaviour between the operating states.
Hydrogen 06 00053 g009
Figure 10. The fuel cell stack’s power profile for three competing power allocation strategies.
Hydrogen 06 00053 g010
Figure 11. The hydrogen consumption for three competing power allocation strategies.
Hydrogen 06 00053 g011
Figure 12. The HV battery’s power profile for three competing power allocation strategies.
Hydrogen 06 00053 g012
Figure 13. The HV battery’s SoC profile for three competing power allocation strategies.
Hydrogen 06 00053 g013
Figure 14. The sensitivity analysis performed on the assumed constant values. The sensitivity analysis for the LV auxiliary load is shown on the left, while that for the HV battery’s DC-DC converter efficiency is shown on the right.
Hydrogen 06 00053 g014
Table 1. The quantified results for the three competing power allocation strategies.
Method
(WLTP C3 Cycle)
Operational CharacteristicsBattery
Degradation
Fuel Cell Degradation
Fuel h2
Consumed
Price FactorMilesEtaEtaΔSoCNbatteryΔidleΔrampΔswitch
[kg][EUR/kg]-[mi/kg][mi/EUR][%]-[%][%][%]
Proposed0.1851314.4478.206.01511.87030.531.6483.072
Toyota Mirai data [23]0.19075.895.8380220.721.5512.796
Frequency
splitting, inspired by [26,27,28]
0.18976.195.8623.01030.493.114.01
Table 2. Simulation results: the proposed approach stacked with similar existing methods.
Method, Dataset and/or Study
(WLTP—14.44 mi)
Fuel h2
Consumed
RangeSoCinitSoCfinalΔSoC-RMSE
[kg][mi/kg][%][%][%]
Proposed—state transition0.18578.2062.579.817.3
Toyota Mirai data [23]0.19075.8961.90.6
Frequency
splitting, idealised [26,27,28]
0.18976.1985.6623.01
Mirai simulation [4]0.18876.8161.70.8
Equivalent consumption minimisation [14]0.16686.9347.3915.11
Rule-based [14]0.19773.363.290.79
Disclaimer/Publisher’s Note: The statements, opinions and data contained in all publications are solely those of the individual author(s) and contributor(s) and not of MDPI and/or the editor(s). MDPI and/or the editor(s) disclaim responsibility for any injury to people or property resulting from any ideas, methods, instructions or products referred to in the content.

