Abstract
This study represents a first step toward improving the repeatability, reproducibility, and accuracy of a process designed to enhance dynamic water structuring. We aim is to investigate the optical reflectivity of a watery magnesium chloride solution treated with electromagnetic waves, we employ a novel methodology derived from human plethysmography (PPG) with three wavelengths spanning the visible and infrared spectra. We measured the reflectance of 17 flasks at 536 nm, 660 nm, and 940 nm before and after treatment, first using the succussion method (control) and second using a 50 Hz signal. The observed variability was acceptable, with repeatability errors below 0.15% and reproducibility errors below 3.5% across all wavelengths before and after treatment. Out of 51 samples dynamically structured using the succussion method, we obtained two false negatives, while one false negative was recorded out of 51 samples dynamically structured using the electromagnetic (EM) method. PPG appears to be a relevant sensor, as it correctly detected dynamically structured water in 99 out of 102 cases, using either the succussion or electromagnetic method. Our results show significant differences in reflectance (supposedly correlated with water’s structured status) at 536 nm between dynamically structured and dynamic non-structured samples (p < 0.001). Future improvements will include a validation protocol against gold-standard spectrophotometry with a larger sample size.
1. Introduction
Franks [1] or Teixeira [2] began to describe the formation of a network of water molecules tied by links named H-bonds. However, to fit experimental data [3], H-bonds had to be conceived as short-lived, of the order of the femtosecond (10−15).
Although several hypotheses suggest the existence of dynamically structured water, there is no evidence for stable water clusters. Any structural information present in water appears to be purely dynamic in nature. Del Giudice [4] characterized liquid water as a free electric dipole laser, emphasizing that the typically neglected interaction between the electric dipole moment of water molecules and the quantized electromagnetic field can be meaningfully addressed within a modern quantum field theoretical framework of collective dynamics. Wexler [5] provided experimental evidence of a phase transition in a hydrogen-bonded liquid, manifested through long-range dipole–dipole interactions. In particular, liquid water subjected to an external electric field was observed to undergo collective oscillations arising from the spontaneous breakdown of symmetry. These experimental observations were interpreted in the context of quantum field theory applied to macroscopic quantum systems. Henry [6] completed the explanation. If we consider N quanta (eV) vibrating with a frequency f (Hertz). According to the Planck–Einstein relation, each quantum carries an energy as presented in Equation (1),
with the energy E being in Joules per second, f frequency in Hertz and h the constant of Planck (6.62607015 × 10⁻³⁴ m2 kg/s).
E = h × f,
Under these conditions, the total energy E in Equation (1) is associated with N quanta, all of which are identical and written in Equation (2),
with the energy E being in Joules per second, f frequency in Hertz, h the constant of Planck (6.62607015 × 10⁻³⁴ m2 kg/s) and N the quanta in eV.
E = N × (h ×·f),
However, in quantum field physics, the number of particles is allowed to fluctuate by an amount ∆N. This then results in the modification of Equation (2) in a delta of energy in Equation (3):
with the energy E being in Joules per second, f frequency in Hertz, h, the constant of Planck (6.62607015 × 10⁻³⁴ m2 kg/s) and N the quanta in eV.
∆E = ∆N × (h ×·f),
On the other hand, the phase angle φ of the wave associated with the quanta of frequency f varies in Equation (4),
with the phase angle φ being in radians, f frequency in Hertz, and the time t in seconds.
φ = 2π ×·f·× t,
If we derive Equation (4), we obtain Equation (5),
with the phase angle φ being in radians, f frequency in Hertz, and the time t in seconds.
∆φ = 2π ×·f·× ∆t,
However, according to Heisenberg’s uncertainty principle, ∆E and ∆t must always be such that Equation (6) becomes as follows:
with the energy E being in Joules per second, f frequency in Hertz, h, the constant of Planck (6.62607015 × 10⁻³⁴ m2 kg/s) and the time t in seconds.
∆E·∆t ≥ h/2π,
Crossing Equations (3), (5) and (6), we obtain the fundamental uncertainty relation of quantum field physics through Equation (7),
with the phase angle φ being in radians and N the quanta in eV.
∆N × ∆φ ≥ ½,
This relationship informs us about the existence of two types of states for matter, such as water. A “separable” or even “incoherent” state where the number of objects does not fluctuate, i.e., ∆N = 0.
However, this state of incoherence is opposed to another “inseparable” or even “coherent” state. The consequence is that the quantum phase takes an increasingly precise value since under these conditions ∆φ → 0. To acquire this quantum coherence, the quanta behave collectively. This is how the coherence domains of water appear, called dynamically structured water. Bono [7] demonstrated that to treat in a static approximation an electric charge structure (the H-bond), it is necessary to introduce an electromagnetic field having the same time oscillation. They demonstrated the presence of an electromagnetic field in those networks of water molecules (begetting an energy of about 12 eV), allowing very low energy to ionize water molecules at about 0.54 eV and explaining the facility of dynamically structured water to absorb more photons than free water. That is why we can think that it is possible to detect the presence of dynamically structured water by visible spectrum wavelength (photon energy from 1.7 eV to 3.3 eV, from 380 nm to 780 nm). Then, we hypothesize that we can estimate the structuration level of water by estimating the variations in reflectance of that water.
Pollack [8] proposed another hypothesis, the Exclusion Zone water (a form of dynamically structured water), based on a non-validated structure that supposedly forms multi-layers thousands of layers thick close to a polymeric structure of water (H3O2−).
The oldest method of obtaining dynamically structured water is suction or vortexing. It is regularly used as a control method. Another method is to use electromagnetic fields, as Lorenzen [9] patented a process for preparing micro clustered water. He also provided micro clustered water stably producing a 17 O NMR resonance signal less than 115 Hz, preferably between 25 Hz and 70 Hz.
The role of dynamically structured water in biological processes is substantial. The fact that water dynamically structured by electromagnetic radiation could exhibit bactericidal activity, for example, may be explained by a model involving radical species [10]. The fundamental idea is that all living systems derive the energy they need for development from redox reactions, in which electrons are transferred from a substance that holds them weakly to another that retains them more strongly. The energy yield is maximized when electrons are transferred directly or indirectly to the oxygen molecule. Broadly speaking, three main reactions are involved.
The production of superoxide radicals (O2−) by the enzyme NADPH oxidase, as described by the overall reaction (Equation (8)):
with ∆E = 4 × 74 = 296 zJ corresponding to a photon with a wavelength of λ = 198.645/296 = 0.67 µm.
The production of hydrogen peroxide (H2O2) and oxygen (O2) by the enzyme superoxide dismutase (SOD), as described by the overall reaction (Equation (9)):
with ∆E = 157 zJ being equivalent to a photon with a wavelength of λ = 198.645/157 = 1.28 µm.
The dismutation of hydrogen peroxide into water and oxygen by the enzyme catalase, as described by the overall reaction (Equation (10)):
with ∆E = 358 zJ corresponding to a photon with a wavelength of λ = 198.645/358 = 0.56 µm.
2 H2O2 → 2 H2O + O2 + ∆E,
This corresponds to an overall balance (Equation (11)):
with ∆E ≈ 811 zJ equivalent to a photon with a wavelength of λ = 198.645/811 = 0.245 µm = 245 nm, i.e., an ultraviolet photon.
4 O2 + 4 e− + 4 H+ → 2 H2O + 3 O2 + ∆E,
The consequence of this series of reactions is that if the concentration of oxygen is insufficient, radicals will accumulate and react with organic biomolecules, rendering them nonfunctional and ultimately leading to cell death.
Zhen [11] explained the mechanisms of cell death induced by reactive oxygen species (ROS), which involve lipid peroxidation of phospholipids and oxidative damage to proteins. This process can be divided into four main phases:
- -
- Initiation phase: Lipid peroxidation typically begins with the generation of ROS, such as superoxide anion (O2•−), hydrogen peroxide (H2O2), and hydroxyl radicals (•OH). In this context, ROS may be generated as a consequence of exposure to electromagnetic fields.
- -
- Propagation phase: These ROS attack polyunsaturated fatty acids (PUFAs) within cellular membranes, abstracting hydrogen atoms and forming lipid radicals. These lipid radicals rapidly react with molecular oxygen to form lipid peroxyl radicals (ROO•), which subsequently propagate the chain reaction by attacking adjacent lipids, proteins, or nucleic acids.
- -
- Degradation phase: Lipid peroxides decompose into secondary reactive aldehydes, such as malondialdehyde (MDA) and 4-hydroxynonenal (4-HNE), which can further impair cellular components, including proteins and DNA, thereby compromising essential cellular functions.
- -
- Termination phase: The chain reaction is terminated by antioxidants that scavenge free radicals. These include enzymatic antioxidants such as superoxide dismutase (SOD), catalase, and glutathione peroxidase, as well as non-enzymatic antioxidants like vitamins E and C and glutathione. These molecules donate electrons to neutralize ROS without becoming radicals themselves, effectively halting lipid peroxidation.
These peroxidative mechanisms, particularly those involving superoxide anions, are physiologically relevant in human phagocytes, which utilize ROS to eliminate pathogens. They also find application in industry, notably in photo disinfection protocols for surface sterilization and in antibacterial polymeric materials that release superoxide ions upon light exposure.
However, as can be observed, we can convert the involved chemical energies into their electromagnetic equivalents, which allows us to see that, from a quantum perspective, these reactions that enable the cell to find the energy it needs to live involve photons ranging from ultraviolet to infrared.
From this perspective, there is theoretically a possible coupling between electromagnetic fields from an external source and the electromagnetic fields associated with the metabolic activity of a living cell, as the same frequency ranges are involved.
If two bacterial strains can be distinguished to the point of being given two different names, it is because their corresponding genomes, and thus their DNAs, are different. If we accept that DNA is the primary source of electromagnetic activity in a cell, as suggested by certain studies [12,13], it is clear that each bacterial strain must possess its own electromagnetic spectrum. A model has even been published to predict the characteristic resonance frequencies for proteins, DNA, or RNA [14,15]. The only visible manifestation to an external observer is a change in metabolic activity and a modification of biochemical responses following contact with dynamically structured water.
As illustrated by Watson [16], Goodsell [17], and Quillin [18], particularly in cellular hydration, energy conversion processes, cellular exchanges, blood flow, and joint flexibility, as well as its impact on various biological systems, from growth to immune response, as detailed by Lindinger [19] and others. Pan (2003) [20] showed that using dynamic, structured water could significantly lower blood sugar level from 8.92 ± 0.21 mMol/L to 7.67 ± 0.18 mMol/L in 2.5 weeks in a human population.
Pollack [8] also explained the importance of dynamic structured water in joint function. Cartilage is composed of gel-like materials consisting of highly charged polymers and water. As such, cartilage is thought to induce water splitting, generating a high concentration of hydronium ions (H3O+) within the synovial fluid. A significant accumulation of these ions is found in the region where the two cartilaginous surfaces face each other. The repulsive force between the hydronium ions helps to maintain separation between the cartilage surfaces.
The significance of detecting dynamic, non-structured water, given its potential health benefits, cannot be overstated. Techniques like near-infrared (NIR) spectroscopy, particularly the WAMACS method, have shown promise in distinguishing between different states of water molecules [21,22,23,24,25,26,27,28,29,30,31,32,33,34,35,36,37,38] or, more recently, a fluorescent perspective to detect water structuring [39]. This method offers a simpler alternative to Nuclear Magnetic Resonance [40,41] or X-Ray techniques.
Our study aims to investigate optical reflectivity of a watery magnesium chloride solution treated with electromagnetic waves, employing a simplified process derived from human plethysmography (PPG) and spanning both visible and infrared spectra.
2. Materials and Methods
2.1. Devices
In our experiments, we used seventeen flasks (for the first test of succussed water (control) and the second test of electromagnetic dynamic structured water), each containing 100 mL of deionized and sterilized water with added MgCl2. Measurements were taken three times for each flask, according to Figure 1, before and after the structuration process. For these measurements, a RunSys photoplethysmograph (RunSys, France [42]) was used. This device, compatible with everyday applications, is designed for non-invasive application through the flask, comprising optical PPG sensors equipped with three LEDs and two photodiodes (sample rate 100 Hz, pulse width 115.2 ms) and controlled via an Android smartphone app (Android 9.0, API Level 28) communicating through Bluetooth Low Energy (BLE).
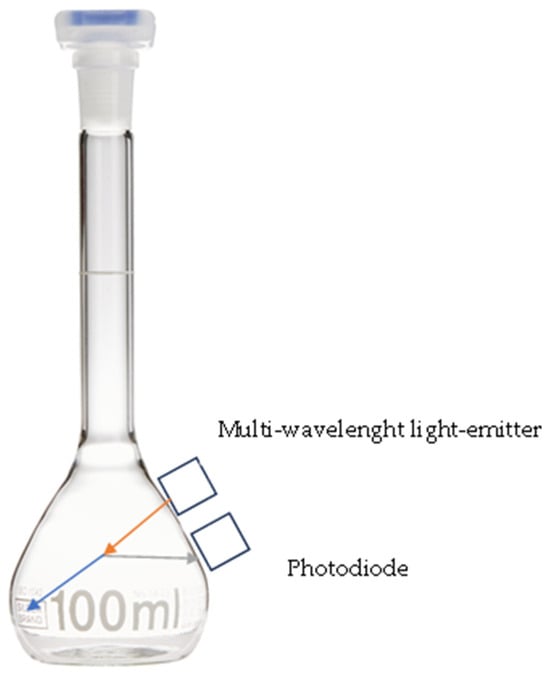
Figure 1.
Schema of the flask and the sensor. Orange, incident ray; gray, reflected ray; blue, refracted ray. LED, multi-wavelength light-emitter; photodiode, sensor of reflected ray.
Beer’s law defined the absorbance of a medium according to Equation (12),
with A being absorbance without a unit; ε being molar absorptivity (cm2/mol); b being path length (cm); and c being concentration of medium (mol/L).
A = ε b c,
In the experimentation, the medium is a mix between the glass of the flask and the salt water. Due to that medium and its absorbance, the refracted ray will be modified, but also the reflected ray.
Usual spectrophotometers analyze the absorbance of media. In our case, the new PPG sensors analyze the reflectance of the media. These two characteristics linked by Equation (13) [43] allow the study of variations in environments,
with A being absorbance (%), T transmittance (%) and R reflectance (%).
A = 100 − T − R,
When a wave reflects on a reflective material (glass and salted water), part of the wave is returned to the transmitter as an equal angle of incident ray. Then we can measure the reflectance via the photodiode. We can define the reflectance as the ratio of the amplitude of each ray by Equation (14),
with I0 being the incident ray (mV) and I the reflected ray (mV), and reflectance expressed in %. We recorded I0 and I and calculated reflectance at wavelengths of 536 nm (green), 660 nm (red), and 940 nm (infrared). Structuration of each flask was conducted using the Aequil Technology (patent pending), presented Figure 2, based on electromagnetic fields from a configurable flat coil (0–30 kHz; 0–100 mA, pulsed range from <0 to 5 s), with a 50 Hz signal to produce dynamic structured water [44,45].
Reflectance % = I0/I,
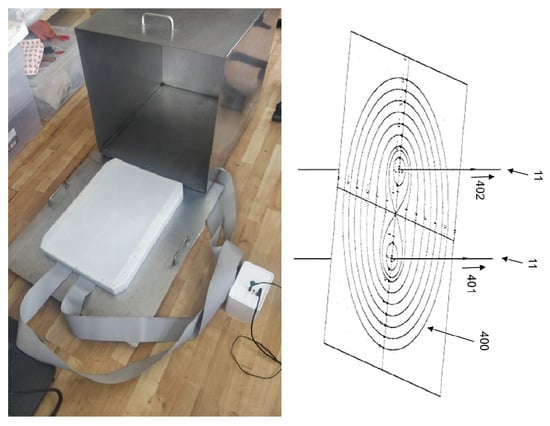
Figure 2.
Aequil Technology emitting electromagnetic fields to dynamically structure water [4,45] in its Faraday cage.
2.2. The Algorithms
2.2.1. Repeatability and Reproducibility
To ensure measurement repeatability and reproducibility (noise threshold (%)), we calculated the coefficient of variation (CV) for each raw signal using Equation (15),
Variation Coefficient (CV) % (repeatability or reproducibility) = (Standard Deviation/Mean) × 100.
The significance of rays’ amplitude I, I0 (mV) and reflectance (%) changes pre- and post-structuration was analyzed (after verifying data normality by a Jarque–Bera test) by applying paired Fisher’s parametric test or non-parametric paired Wilcoxon signed ranks tests to derive p-values for significance levels (first grade of significance, * p < 0.05; second grade, ** p < 0.01 and third grade, *** p < 0.001).
2.2.2. Dynamic Threshold of Structured Water
Firstly, we used Equation (16) to indirectly estimate the water’s dynamically structured level, knowing the reflectance of the medium before structuration (by succussed method or electromagnetic method),
We hypothesize that there is an indirect link between the reflectance level of liquid water and the dynamic structuration of water. Then we deduced the structuration status, considering that if the variation in the reflectance characteristics of the medium is greater than the reproducibility rate, then the medium has been supposedly dynamically structured, according to Equation (17),
Structuration status = If (Structuration Level (%) > Noise Threshold (%); “Dynamically structured”; “non-dynamically structured”).
In a second step, an algorithm was developed to estimate the water’s dynamically structured level, using a logistic multinomial law as shown in Equation (18), considering that we would not know the reflectance value of the medium before structuration,
where a, b, …, i are constants and x1, x2, …, xi are experimental variables of the equation.
The algorithm was initially created with 17 observations and later validated on an independent subgroup of 17 observations.
3. Results
3.1. Dynamically Structured Water by Succussions
3.1.1. Repeatability and Reproducibility of Each Measurement
For each measurement, we obtained (Table 1) three observations per flask composed of ten measurements for each wavelength.

Table 1.
Reflectance (%) obtained for flask 1 as an example.
Table 2 shows the mean CV (%) obtained on repeatability and reproducibility before and after treatment of water by the succussed method. We can note a relevant mean repeatability CV less than 0.15% whatever the wavelength and a mean reproducibility CV of less than 2%.
Table 2.
Mean CV (%) obtained on repeatability and reproducibility before and after treatment of water by the succussed method.
3.1.2. Reflectance Variations (as Supposedly Linked with Dynamic Structuration of Water’s Level)
Table 3 presents the reflectance variation obtained before and after treatment of water by the succussed method. the noise threshold and the supposed structuration level and status for each flask. We obtained 2 false negatives out of 51 in two different flasks, one at 940 nm and the other at 536 nm.
Table 3.
Difference in reflectance (%) obtained before and after treatment of water by succussed method: the noise threshold (%), the dynamic structuration level (%) and the structuration status for each flask.
We can notice that the three wavelengths included in the sensor, presented Table 4, could be interesting to minimize false negatives, taking into account that water could be considered dynamically structured if the structuration status is true on at least two of three wavelengths.
Table 4.
Mean CV (%) obtained on repeatability and reproducibility before and after treatment of water by the EM method.
3.1.3. Structuration Level: Knowing the Reflectance Value of the Flask Before Treatment by Electromagnetic Fields
Table 5 presents the reflectance variation obtained before and after treatment of water by EM method. The noise threshold and the supposedly structuration level and status for each flask. We obtained 1 false negative out of 51 at 940 nm.
Table 5.
Difference in reflectance (%) obtained before and after treatment of water by the EM method: the noise threshold (%), the structuration level (%) and the structuration status for each flask.
After considering each flask, we want to study the group of flasks as a sample.
Data normality was tested by Jarque–Bera and Shapiro–Wilk. We obtained p < 0.05, and then we used non-parametric paired tests. Wilcoxon signed-rank tests revealed significant differences (p = 0.05) in reflectance delta at 536 nm (Table 6).
Table 6.
Mean reflectance (%) for each wavelength before and after treatment of water by EM fields (NS: non-significant).
We notice a significant difference at 536 nm, but we cannot significantly discriminate the samples at 660 or 940 nm.
As the sensor crosses the wavelength emissions, we can think that there is an effect of the measurement on the medium or the other wavelengths, i.e., red and infrared (Figure 3). We therefore tested the significance considering not each wavelength separately but all three.
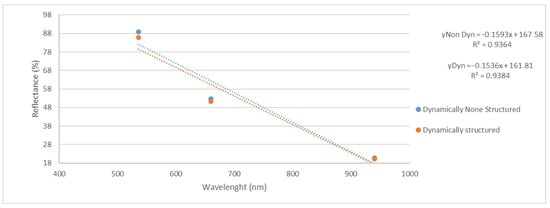
Figure 3.
Evolution of the three reflectance at 536 nm, 660 nm and 940 nm before and after treatment of water by EM fields. Dash lines are the linear regression of each group of data.
We obtained, in that case, a significant difference of p = 0.003 (**) between the reflectance measured in the sample before and after EM treatment.
This reinforces the idea of analyzing samples according to three wavelengths and not just one.
3.1.4. Ratio of Wavelength Variation
Like phenomena observed in human blood, certain changes are not directly visible in the raw wavelength data. By calculating the ratio of red/infrared and red/green absorbance variations. Significant changes were quantified (Table 7). Data normality was tested by Jarque–Bera. We obtained p > 0.05, allowing us to use paired parametric Fisher tests.
Table 7.
Fisher p-values for each wavelength (*** for p < 0.001 and * for p < 0.05).
The ratios of I red/I infrared and I red/I green in dynamically structured water were significantly higher than in dynamic non-structured samples (p > 0.0001). Even the infrared/green ratio showed a significant increase in dynamic read structured water (p = 0.015).
3.1.5. Prediction of Water Status/Dynamic Structuration Level, Without Knowing the Reflectance Value of the Flask Before Treatment
The algorithm’s accuracy in predicting water structuration levels was tested. demonstrating high accuracy for dynamically structured water but some false positives in dynamic non-structured flasks (Table 8 and Table 9).
Table 8.
Results on prediction of the level of water structuration (the higher the water is dynamically structured, the closer the prediction is to 100%).
Table 9.
Classification of prediction of water status (dynamically structured level).
As indicated, the prediction was 100% accurate for dynamically structured water. However, there were five false positives in dynamically non-structured water samples, leading to an overall prediction accuracy of 66.7%. This performance is based on the reflectance measurements at 536 nm, 660 nm and 940 nm.
4. Discussion
We obtain two false negatives at 940 nm, estimating the dynamically structured status of water in the two flasks by the measurements of the variation in reflectance. This anomaly could be attributed to photon emission resulting from water restructuration, which potentially affects this wavelength. The observed changes in absorbance may be attributed to differences in hydrogen bonding.
Considering the reflectance properties of oxyhemoglobin and deoxyhemoglobin, it is plausible that free water and dynamically structured water absorb different wavelengths differently. This variance may be linked to changes in hydrogen bonding as indicated by the WAMACS method at higher wavelengths. The observed instability in dynamically structured water due to its continual aggregation and disaggregation might impact detection at a single wavelength except for 536 nm.
We noticed a significant mean delta of −3.0 ± 4.7% of reflectance at 536 nm between dynamically non-structured and dynamically structured flasks. For each wavelength, the sample showed less reflectance after structuration due to maybe the presence of coherent water domains absorbing photons.
The five out of nine false positives in predicting dynamically structured water in dynamically non-structured samples (without considering the reflectance value before structuration) suggest the need for a larger sample size to enhance the algorithm’s robustness. Alternatively, the presence of dynamically structured water on the glass flasks’ surface might have influenced certain wavelength measurements, leading to inaccurate predictions (Pollack [46]).
As shown by V. Guiheneuf [47], the reflectance of glass can be considered negligible, about 10% at the wavelengths considered. But we can hypothesize that some flasks were poorly cleaned (fingerprints), and the reflectance was thus increased after structuration despite increased absorbance of photons by the dynamically structured medium.
We obtained a mean reflectance of about 80%, 10–15% more than expected for water at our wavelengths, as mentioned by the SEOS project [48].
We can hypothesize that it is due to the presence of MgCl2 in the water. Mougenot [49] showed that the presence of salt in a medium can improve the reflectance by 50%.
If we focus on a detailed spectrum of water absorbance proposed by Henry [6], we can underline a specific window from 400 to 700 nm where the absorbance is very law (about 1–10%). Then the reflectance is high (about 90–99%), which converges to our results.
5. Conclusions
We observed acceptable variability (less than 0.15% for repeatability and less than 3.5% for reproducibility) across all wavelengths before and after treatment of water by electromagnetic fields.
We obtained 2 false negatives out of 51 in two different flasks, one at 940 nm and the other at 536 nm, predicting the structuration status (supposedly correlated with the variation in reflectance) of the sample dynamically structured by the succussed method, and 1 false negative out of 51 at 940 nm in the sample dynamically structured by the EM method.
Photoplethysmography sensor (PPG) seems to be a relevant sensor, as we detected dynamically structured water 99 times out of 102 using the succussed method or electromagnetic method.
We observed a lower reflectance in the flasks after treatment, significant at 536 nm (p < 0.05, *). Considering the three wavelengths as a spectral configuration of water, we obtained in that case a significant difference of p = 0.003.
A significant difference in reflectance ratios (I 536 nm/I 940 nm, I 940 nm/I 536 nm and I 660 nm/I 536 nm) between dynamically structured and dynamically non-structured water samples was observed, which may be attributed to the presence of dynamically structured water in the dynamically structured samples.
The developed algorithm to predict the presence of dynamically structured water achieved an average accuracy of 66.7%, although it also produced five false positives in dynamically non-structured water samples. To improve accuracy, future work will involve a validation protocol against gold-standard spectrophotometry and/or microscopy methods. A priority will be addressing the issue of false positives, potentially by increasing the number of test flasks or minimizing glass surface contact.
Author Contributions
Conceptualization. M.-V.M., S.A.B.M. and F.R.; methodology. M.-V.M., S.A.B.M. and F.R.; validation. M.-V.M., S.A.B.M. and F.R.; investigation. M.-V.M. and S.A.B.M.; writing—original draft M.-V.M. and F.R. All authors have read and agreed to the published version of the manuscript.
Funding
This research received no external funding.
Data Availability Statement
Data is contained within the article.
Acknowledgments
We would like to thank the students who participated in this study, Elea Herrera-Moreno and Emma Herrera-Moreno, for their rigor and commitment.
Conflicts of Interest
The electrophysiological module and the EMF device were developed by the authors.
Abbreviations
| NIR | near-infrared spectroscopy |
| Hz | Hertz |
| SD | Standard Deviation |
| EZ Water | Exclusion Zone water |
| ADP | Adenosine Diphosphate |
| ATP | Adenosine Triphosphate |
| WAMACS | Water Matrix Coordinates System |
| PPG | Photoplethysmography |
| API | Application Programming Interface |
| BLE | Bluetooth Low Energy |
| NS | non-significant |
| EM | electromagnetic wave |
References
- Franks, F. Water: A Comprehensive Treatise; Plenum Press: New York, NY, USA, 1982. [Google Scholar]
- Teixeira, J.; Luzar, A. Physics of liquid water: Structure and dynamics. In Hydration Processes in Biology: Theoretical and Experimental Approaches (NATO ASI Series A); IOS Press: Amsterdam, The Netherlands, 1999; pp. 35–65. [Google Scholar]
- Bertolini, D.; Cassettari, M.; Ferrario, M.; Grigolini, P.; Salvetti, G.; Tani, A. Diffusion effects of hydrogen bond fluctuations. I. The long-time regime of the translational and rotational diffusion of water. J. Chem. Phys. 1989, 91, 1179–1190. [Google Scholar] [CrossRef]
- Del Giudice, E.; Preparata, G.; Vitiello, G. Water as a free electric dipole laser. Phys. Rev. Lett. 1988, 61, 1085. [Google Scholar] [CrossRef]
- Wexler, A.D.; Fuchs, E.C.; Woisetschläger, J.; Vitiello, G. Electrically induced liquid–liquid phase transition in water at room temperature. Phys. Chem. Chem. Phys. 2019, 21, 18541–18550. [Google Scholar] [CrossRef]
- Henry, M. L’eau et la Physique Quantique—Vers Une Révolution de la Médecine; Dangles: Labege, France, 2016; ISBN 13/978-2703311478. [Google Scholar]
- Bono, E.; Del Giudice, E.; Gamberale, L.; Henry, M. Emergence of the Coherent Structure of Liquid Water. Water 2012, 4, 510–532. [Google Scholar] [CrossRef]
- Pollack, G. The Fourth Phase of Water: Beyond Solid, Liquid, and Vapor; Ebner & Sons: Seattle, WA, USA, 2013. [Google Scholar]
- Lorenzen, L.H. Process for Preparing Microclustered Water. Patent US571 1950, 1998. [Google Scholar]
- Ehnert, S.; Fentz, A.K.; Schreiner, A.; Birk, J.; Wilbrand, B.; Ziegler, P.; Reumann, M.K.; Wang, H.; Falldorf, K.; Nussler, A.K. Extremely low frequency pulsed electromagnetic fields cause antioxidative defense mechanisms in human osteoblasts via induction of •O2− and H2O2. Sci Rep. 2017, 7, 14544. [Google Scholar] [CrossRef] [PubMed] [PubMed Central]
- Zheng, Y.; Sun, J.; Luo, Z.; Li, Y.; Huang, Y. Emerging mechanisms of lipid peroxidation in regulated cell death and its physiological implications. Cell Death Dis. 2024, 15, 859. [Google Scholar] [CrossRef]
- Henry, M. The topological and quantum structure of zoemorphic water. In Aqua Incognita: Why Ice Floats on Water and Galileo 400 Years on; Nostro, P.L., Ninham, B.W., Eds.; Connor Court Pub.: Ballarat, Australia, 2014; Volume chap IX, pp. 197–239. [Google Scholar]
- Henry, M. The hydrogen bond. Inference: Int. Rev. Sci. 2015, 1, 1–19. [Google Scholar] [CrossRef]
- Sen, S.; Gupta, K.S.; Coey, J.M.D. Mesoscopic structure formation in condensed matter due to vacuum fluctuations. Phys. Rev. B 2015, 92, 155115. [Google Scholar] [CrossRef]
- Pierrehumbert, R.T. Infrared radiation and planetary temperature. Phys. Today 2010, 64, 33–38. [Google Scholar] [CrossRef]
- Watson, J.D. Molecular Biology of the Gene, 2nd ed.; Saunders: Philadelphia, PA, USA, 1972. [Google Scholar]
- Goodsell, D.S. The Machinery of Life, 2nd ed.; Springer: Berlin/Heidelberg, Germany, 2009. [Google Scholar]
- Quillin, M.L. The table developed the calculation of the layers around various elements in the cells. Acta Cryst. D 2000, 56, 791. [Google Scholar] [CrossRef]
- Lindinger, M.I. Animal health and wellbeing. Dynamic Dynamically structured water: Effects on animals. J. Anim. Sci. 2021, 99, skab063. [Google Scholar] [CrossRef]
- Pan, J.; Zhu, K.-N.; Zhou, M.; Wang, Z.Y. Low resonant frequency storage and transfer in dynamic Dynamically structured water cluster. In Proceedings of the SMC’03 Conference Proceedings, 2003 IEEE International Conference on Systems, Man and Cybernetics, Washington, DC, USA, 8 October 2003; Conference Theme—System Security and Assurance (Cat. No.03CH37483). Volume 5, pp. 5034–5039. [Google Scholar]
- Cattaneo, T.M.P.; Bazar, G.; Gowen, A.A.; Greppi, G.F.; Mura, S.; Tsenkova, R. Water Monitoring with Hyperspectral Techniques; Transitional Waters Bulletin: Lecce, Italy, 2015. [Google Scholar]
- Tsenkova, R. Aquaphotomics: Near Infrared Spectroscopy and Water States in Biological Systems; Sub-cellular Biochemistry; Springer: Cham, Switzerland, 2015. [Google Scholar] [CrossRef]
- Tsenkova, R.J. Aquaphotomics: Dynamic Spectroscopy of Aqueous and Biological Systems Describes Peculiarities of Water. Near Infrared Spectrosc. 2009, 17, 303–314. [Google Scholar] [CrossRef]
- Kaffka, K.J.; Horváth, L.; Kulcsár, F.; Váradi, M. Investigation of the state of water in fibrous foodstuffs by near infrared spectroscopy. Acta Aliment. 1990, 11, 125–137. [Google Scholar]
- Kojić, D.; Tsenkova, R.; Tomobe, K.; Yasuoka, K.; Yasui, M. Water confined in the local field of ions. ChemPhysChem 2014, 15, 4077–4086. [Google Scholar] [CrossRef]
- Maeda, H.; Ozaki, Y.; Tanaka, M.; Hayashi, N.; Kojima, T. Near infrared spectroscopy and chemometrics studies of temperature-dependent spectral variations of water: Relationship between spectral changes and hydrogen bonds. J. Near Infrared Spectrosc. 1995, 3, 191–201. [Google Scholar] [CrossRef]
- Cattaneo, T.; Cabassi, G.; Profaizer, M.; Giangiacomo, R. Contribution of Light Scattering to near Infrared Absorption in Milk. J. Near Infrared Spectrosc. 2009, 17, 337–343. [Google Scholar] [CrossRef]
- Esquerre, C.; Gowen, A.; Tsenkova, R.; O’Donnell, C.; Downey, G. Identification of water matrix coefficients in mushrooms (Agaricus bisporus) using robust ensemble of Monte Carlo uninformative variable elimination. In Proceedings of the 14th International Conference on Near Infrared Spectroscopy, Bangkok, Thailand, 7 November 2009. [Google Scholar]
- Gowen, A.; Tsenkova, R.; Esquerre, C.; Downey, G.; O’Donnell, C. Use of near infrared hyperspectral imaging to identify water matrix coordinates in mushrooms (Agaricus bisporus) subjected to mechanical vibration. J. Near Infrared Spectrosc. 2009, 17, 363–371. [Google Scholar] [CrossRef]
- Headrick, J.M.; Diken, E.G.; Walters, R.S.; Hammer, N.I.; Christie, R.A.; Cui, J.; Myshakin, E.M.; Duncan, J.; Johnson, M.A.; Jordan, K.D. Spectral signatures of hydrated proton vibrations in water clusters. Science 2005, 308, 1765–1769. [Google Scholar] [CrossRef] [PubMed]
- Iwamoto, M.; Uozumi, J.; Nishinari, K. Preliminary investigation of the state of water in foods by near infrared spectroscopy. In Proceedings of the International NIR/NIT Conference, Budapest, Hungary, 12–16 May 1987. [Google Scholar]
- Ozaki, Y. Applications in Chemistry in Near-Infrared Spectroscopy: Principles, Instruments, and Applications; Siesler, H.W., Ozaki, Y., Kawata, S., Heise, H.M., Eds.; Wiley-VCH Verlag GmbH: Weinheim, Germany, 2002. [Google Scholar]
- Robertson, W.H.; Diken, E.G.; Price, E.A.; Shin, J.W.; Johnson, M.A. Spectroscopic determination of the OH− solvation shell in the OH −· (H2O)n clusters. Science 2003, 299, 1367–1372. [Google Scholar] [CrossRef]
- Segtnan, V.H.; Šašić, S.; Isaksson, T.; Ozaki, Y. Studies on the Structure of Water Using Two-Dimensional Near-Infrared Correlation Spectroscopy and Principal Component Analysis. Anal. Chem. 2001, 73, 3153–3161. [Google Scholar] [CrossRef] [PubMed]
- Tsenkova, R.; Iordanova, I.K.; Toyoda, K.; Brown, D.R. Prion protein fate governed by metal binding. Biochem. Biophys. Res. Commun. 2004, 325, 1005–1012. [Google Scholar] [CrossRef] [PubMed]
- Weber, J.M.; Kelley, J.A.; Nielsen, S.B.; Ayotte, P.; Johnson, M.A. Isolating the spectroscopic signature of a hydration shell with the use of clusters: Superoxide tetrahydrate. Science 2000, 287, 2461–2463. [Google Scholar] [CrossRef] [PubMed]
- Williams, P. Influence of water on prediction of composition and quality factors: The aquaphotomics of low moisture agricultural materials. J. Near Infrared Spectrosc. 2009, 17, 315–328. [Google Scholar] [CrossRef]
- Xantheas, S.S. Ab initio studies of cyclic water clusters (H2O) n. n=1–6. III. Comparison of density functional with MP2 results. J. Chem. Phys. 1995, 102, 4505–4517. [Google Scholar] [CrossRef]
- De Luca, G.; Ferrara, V.; Pignataro, B.; Vetri, V.; Sancataldo, G. A Fluorescent Perspective on Water Structuring: ACDAN in Salt Solutions and Hydrogels. Biophysica 2024, 4, 619–633. [Google Scholar] [CrossRef]
- Yoo, H.; Paranji, R.; Pollack, G.H. Impact of hydrophilic surfaces on interfacial water dynamics probed with NMR spectroscopy. J. Phys. Chem Lett. 2011, 2, 532–536. [Google Scholar] [CrossRef]
- Raingeva, C.; Olivier Cala, I.; Brion, B.; Le Borgne, M.; Eliot Hubbard, R.; Krimm, I. 1D NMR WaterLOGSY as an efficient method for fragment-based lead discovery. J. Enzym. Inhib. Med. Chem. 2019, 34, 1218–1225. [Google Scholar] [CrossRef]
- Moreno, M.-V.; Herrera, E. Evaluation on Phantoms of the Feasibility of a Smart Bra to Detect Breast Cancer in Young Adults. Sensors 2019, 19, 5491. [Google Scholar] [CrossRef]
- Dai, M.; Guo, W.; Liu, X.; Zhang, M.; Wang, Y.; Wei, L.F.; Hilton, G.C.; Hubmay, J. Measurement of optical constants of TiN and TiN/Ti/TiN multilayer films for microwave kinetic inductance photon-number-resolving detectors. J. Low Temp. Phys. 2019, 194, 361–369. [Google Scholar] [CrossRef]
- Moreno, M.-V.; Roscop, F. Device and Method for Imprinting an Active Effect of at Least One Reference Product into a Treatment Product. Patent PCT/EP2023/087145/WO2024133595A1, 27 June 2024. [Google Scholar]
- Moreno, M.-V.; Roscop, F. Device and Method for Capturing a Digital Signature of a Reference Product. Patent PCT/EP2023/087144/WO2024133594A1, 27 June 2024. [Google Scholar]
- Pollack, G.H. Why Hydrogels don’t dribble water. Gels 2017, 3, 43. [Google Scholar] [CrossRef]
- Guiheneuf, V. Approche Multi-Physique du Vieillissement des Matériaux Pour Application Photovoltaïque. Ph.D. Thesis, Université Paris-Est, Paris, France, 2019. [Google Scholar] [CrossRef]
- SEOS Project. Science Education through Earth Observation for High Schools; European Space Agency (ESA): Paris, France, 2022. [Google Scholar]
- Mougenot, B. Effets des sels sur la réflectance et télédétection des sols salés. Cah. Orstom. ser Pedol. 1993, XXVIII, 45–54. [Google Scholar]
Disclaimer/Publisher’s Note: The statements, opinions and data contained in all publications are solely those of the individual author(s) and contributor(s) and not of MDPI and/or the editor(s). MDPI and/or the editor(s) disclaim responsibility for any injury to people or property resulting from any ideas, methods, instructions or products referred to in the content. |
© 2025 by the authors. Licensee MDPI, Basel, Switzerland. This article is an open access article distributed under the terms and conditions of the Creative Commons Attribution (CC BY) license (https://creativecommons.org/licenses/by/4.0/).