Abstract
In this work, the photocatalytic activity of Hydrated Niobium Pentoxide (synthesized by a simple and inexpensive method) was explored in two unknown reactions reported for this catalyst: the photodegradation of phenol in seawater and the photoreforming of methanol. The Hydrated Niobium Pentoxide (Nb1) was synthesized from the reaction of niobium ammoniacal oxalate NH4[NbO(C2O4)2·H2O]•XH2O with a strong base (NaOH). Further treatment of this catalyst with H2O2 led to a light-sensitive Hydrated Niobium Pentoxide (Nb2). The photocatalysts were characterized by XRD, DRS, SEM Microscopy, FTIR-ATR, EDX, and specific surface area (SBET). The characterization results demonstrate that the treatment of Hydrated Niobium Pentoxide sensitized the material, increased the surface area of the material, diminished the average particle size, and modified its surface charge, and formed peroxo groups on the catalytic surface. Although both photocatalysts (Nb1 and Nb2) were active for both proposed reactions, the sensitization of the photocatalyst was beneficial in distinct situations. In the photocatalytic degradation of phenol in seawater, the sensitization of the photocatalyst did not enhance the photocatalytic activity. In both photoreactions studied, the addition of the Pt° promoter readily increased the photocatalytic performance of both photocatalysts; in this case, the sensitized photocatalyst recorded the best results. The presence of OH• radicals was confirmed, and the great contribution of the Pt° promoter was in the increase in OH• radical generation; this increase was more effective in the sensitized photocatalyst. Our work demonstrated a simple and inexpensive way to synthesize niobium photocatalysts that can effectively be used in the photodegradation of phenol in seawater and in the photoreforming of methanol to produce hydrogen.
1. Introduction
Niobium Pentoxide, Nb2O5, is a semiconductor material with acidic properties and a band gap energy of 3.4 eV, which has found several technological applications, such as solar cells, batteries, and electrochromic windows [1]. Additionally, Nb2O5 has been used as a catalyst for dehydration, hydration, hydrolysis, etherification, condensation, dehydrogenation, alkylation, photochemical, electrochemical polymerization, and oxidation reactions [2,3]. Its photocatalytic activity has also been demonstrated in the photodegradation of organic pollutants in aqueous media [4,5,6].
Hydrated Niobium Pentoxide (HNP, Nb2O5·nH2O, also known as niobium oxyhydroxide or hydrated niobium oxide or niobic acid) is an insoluble polymeric oxide with a high acid strength (Hammett function scale, Ho −5.6~−8.2) [7]. It remains bound to the support surface (even in the presence of water) and acts as an effective catalyst for reactions in which water molecules participate or are liberated. Nb2O5·nH2O possesses both Lewis acid sites (which increase with increasing thermal treatment up to 773 K) and Brønsted acid sites (which are most abundant at 373 K and decrease at higher temperatures) on its surface [8,9].
HNP, Nb2O5·nH2O, is amorphous and possesses distorted NbO6 octahedra, NbO7 pentagonal bipyramids, and NbO8 hexagonal bipyramids as structural units [10]. HNP has bifunctional properties, as it has high acidity and the ability to form oxidizing species in the presence of H2O2 by the formation of peroxo surface groups (Nb-O-OH) [3,11]. In addition, the bifunctional character of HNP has been explored in reactions that require dehydration/oxidation properties [2,12].
Heterogeneous photocatalysis currently attracts great interest due to its potential to convert solar energy into fuels or to be used in environmental remediation. The photocatalytic activity of HNP has been demonstrated in CO2 photoreduction (to yield CH4, HCOOH, and CH3COOH) [13] and in the photodegradation of Methylene Blue dye [14]. HNP can be easily separated from an effluent, as its hydrocolloids are not stable in water [14]; this is advantageous in large-scale applications of photocatalysis. Taking into account all the properties explained above, it is possible to consider that HNP may be a good alternative to the very commercial TiO2 photocatalyst.
However, the synthesis methods to obtain niobium oxide photocatalysts with good photocatalytic properties require, in most cases, complex experimental procedures that are carried out under experimental conditions that are far from room conditions; therefore, it turns the synthesis methods into less attractive procedures owing to economic reasons (particularly when scale-up studies are required). This is one of the big challenges in the synthesis of photocatalytic materials.
Among several syntheses of nanocrystalline niobium oxide (or hydrated niobium oxide) it is possible to mention: the polyol-mediated preparation method [15]; peptization method [16], hydrothermal method [17], plasma-assisted method [18], and solvothermal synthesis method [19], among others [20].
On the other hand, phenol is a pollutant molecule, which is highly water-soluble, and it is present in effluents coming from many industries (petrochemical, crude oil treatment, pharmaceutical, paper and cellulose, pesticides, etc.), and it is difficult to degrade it using conventional water treatments. Phenol is toxic for humans and the environment as it is carcinogenic, mutagenic, and teratogenic for human beings and leads to adverse effects on aquatic organisms [4].
Our research paper reports the utilization of a Hydrated Niobium Pentoxide made with a simple and inexpensive synthesis method: the photodegradation of phenol in seawater and the photoreforming of methanol to produce hydrogen. The removal of phenol in seawater is a very important concern in oil-produced water treatment as well as in oil spill remediation [6], whereas the hydrogen production by heterogeneous photocatalysis from water phenol solves two environmental problems through the production of a high-energy carrier (hydrogen) and the degradation of a widely known organic pollutant in water. The photoactivity of such photocatalysts in these reactions has not been reported yet. It is expected that the following results will serve as the solutions to energy and environmental problems.
2. Materials and Methods
2.1. Preparation of Catalysts
Hydrated Niobium Pentoxide (sample name: Nb1) was synthesized from ammoniacal niobium oxalate (NH4[NbO(C2O4)2·H2O]·XH2O) by precipitation with a strong base (NaOH). The steps carried out were as follows: 14 g of ammoniacal niobium oxalate was dissolved in 100 mL of distilled water (under agitation with a magnetic stirrer, 390 rpm) at 70 °C until complete solubilization; after this procedure, a solution of NaOH (1 mol·L−1), was added drop by drop to the ammoniacal niobium oxalate solution until reaching a molar ratio of niobium ammoniacal oxalate/NaOH close to 0.12; then, the final precipitate was regulated to pH 8, and kept for 2 h at room temperature. The formed precipitate was then filtered and washed to remove the excess base, and finally dried in a drying oven at 60 °C.
Sensitized Hydrated Niobium Pentoxide (this catalyst will be identified as Nb2 throughout this study) was prepared by the reaction between Nb1 (prepared previously) and H2O2. The addition of hydrogen peroxide (H2O2) aimed to increase the number of hydroxyl groups on the surface material, which can influence the photocatalytic process [21]. In the preparation of Nb2, 4 mL of hydrogen peroxide (H2O2, 30% v/v) was added to 300 mg of Nb1 (prepared in the previous procedure) contained in 80 mL of distilled H2O. The mixture was kept in contact for 60 min under magnetic stirring, after which it was washed to remove the excess and dried in a drying oven at 60 °C.
2.2. Characterization of the Catalysts
The crystalline structure of the materials was identified by X-ray diffraction analysis (XRD) using a Rigaku Miniflex diffractometer (30 KV–10 mA) (scan of 5° to 80°, speed of 2°·min−1, λ = 1.5406 Å) using CuK-α radiation and a nickel filter. The crystalline structures were identified by comparison with the patterns of the International Center of Diffraction Data (ICDD, JCPDS). The UV–Visible Diffuse Reflectance Spectroscopy analysis (DRS) of the photocatalysts was carried out in a Varian Cary 100 Bio UV/VIS spectrophotometer equipped with an integrating sphere diffusing reflectance accessory. The measured reflectance data (R) were transformed into the Kubelka–Munk function f(R) to determine the value of the band gap via the Tauc plot. The band gap energies of the materials were determined by the linear extrapolation of the steep part of the DRS absorption profile, toward the baseline. The band gap energy (Eg) was estimated by the following formula Tauc plot [22]: (αhν)n = A(hν−Eg); where α is the absorbance, hν is the photon energy, A is related to the effective masses associated with the valence and conduction bands, and n is either n = 2 for an indirect allowed transition or n = 1/2 for the direct forbidden transition.
The BET surface area (SBET) of each material was measured by the single-point standard Micromeritics FlowSorb II 2300 instrument equipped with a Micromeritics AutoMate 23. Adsorption/desorption isotherms were recorded using the Autosorb-iQ automated gas sorption analyzer equipped with ASiQwin data software. Scanning electron microscopy (SEM) images and Energy-Dispersive X-ray Spectroscopy (EDX) measurements were carried out on a JEOL JSM-6700 F field-emission instrument using a secondary electron detector (SE) at an accelerating voltage of 20 kV. The particle size and zeta potential of catalysts were measured in a Zetasizer Nano ZS90 (Malvern).
2.3. Photocatalytic Tests
2.3.1. Photodegradation of Phenol in Seawater
The photocatalytic activities of catalysts were tested in the photodegradation of phenol in seawater at acidic pH (3.5–4), determined as good pH conditions for this photoreaction [4,6,13].
Firstly, fresh seawater was collected from a clean and preserved region of the beach in Guarujá (coast of São Paulo State, Brazil). The seawater had a salinity of 33% (natural pH 8.4) and was passed through a filter membrane (cellulose) of 0.22 µm. This sample was filtered through a polycarbonate filter membrane of 0.22 µm; all particles and sediments that may have been present in natural seawater were removed by this procedure (furthermore, this step leads to sterilizing the seawater, and it traps contaminants larger than the pore size of the membrane). This filtered seawater was used to prepare the stock solution of phenol. A standard phenol solution (1000 mg·L−1 SpecSol®) was diluted with the filtered seawater to reach a concentration of 40 mg·L−1 phenol. The initial concentration of phenol was stipulated following previous works [23,24], since the exact concentration of the phenol in oil-produced water, or in spill oil, is unknown.
Each catalytic test was performed in a Pyrex glass batch reactor (a Becker), open to atmospheric air). The reactor was exposed to radiation from the top. The photocatalytic tests were carried out under magnetic stirring (constant speed of 500 rpm), at room temperature, and under three conditions:
- (a)
- Photolysis: 25 mL of phenolic solution, without catalyst, under UV radiation (253.7 nm) for 120 min.
- (b)
- Adsorption: 25 mL of phenolic solution, catalyst dosage of 0.5 gcat·L−1, in the absence of UV radiation (in dark) for 120 min.
- (c)
- Heterogeneous photocatalysis under UV radiation: 25 mL of phenolic solution, under UV radiation (253.7 nm). In this case, the following parameters were varied: catalyst dosage (0.5–2 gcat·L−1) and time of irradiation under UV light (0–120 min).
- (d)
- Heterogeneous photocatalysis under UV radiation using Pt-promoted catalysts: For this test, Pt (1, 5, and 10% w/w) was loaded on the surface of each catalyst by an in situ photodeposition method by using aqueous H2PtCl6 solution as the Pt source. In this case, the photocatalytic tests were carried out under the optimal conditions determined in experiments described in items a–c.
For the catalytic test detailed in (c) and (d), the suspensions (the mixture of phenolic solution and catalyst) were continuously stirred for 30 min, in the dark, before irradiation (to reach the adsorption equilibrium); after this procedure, the suspensions were irradiated with the UV-C lamp.
Each photocatalytic experiment was performed in triplicate to ensure the accuracy of the results. The reactor was confined in a dark chamber with internal ventilation and exhaust. The irradiation for each reaction condition was provided by six UV lamps (253.7 nm, 15 watts, 220 volts) for testing under UV light irradiation. After each catalytic test, the separation of the catalyst from the liquid solution was performed by centrifugation at 5000 rpm.
The phenol concentration was monitored by spectrophotometry (through the colorimetric method of 4-aminoantipyrine [25,26]); in this case, the calibration curve was read at λ = 510 nm. The colorimetric method quantifies the total phenolic compounds present in the solution, and it was employed by Sun et al. [27], Zhu et al. [28], and Xu et al. [29] as well, for similar studies of photocatalytic degradation of phenol.
The photodegradation efficiency (X%) of phenol was calculated by the following formula: X (%) = [(M0 − Mf/M0] × 100, where M0 and Mf are the concentrations of phenol at the beginning and end of each photocatalytic test, respectively.
2.3.2. Reuse of Catalysts
For evaluating the reusability of the synthesized materials, the efficiency cycle test was carried out in 3 cycles. The material after the photocatalytic test was separated, washed with distilled water, filtered, and finally dried.
2.4. Hydrogen Production by Photoreforming of Methanol
For these photocatalytic tests, the dosage of catalyst of 1 gcat·Lsoluc−1 was used in all experiments. A vial glass (total volume of 10 mL) served as a batch reactor. The tests were carried out with the catalysts forming a suspension using a methanol solution; in this case, the absence and the presence of Pt promoter were evaluated. For the latter, Pt was loaded on the catalyst surface by an in situ photodeposition method by using an aqueous H2PtCl6 solution as the Pt source.
The photoreforming reactions were carried out under the solar simulator system. In these tests, the reactor was exposed to radiation from the top. A 1000 W xenon lamp (Hönle UV Technology, Sol 1200, Gilching, Germany) was used as a simulated solar light.
Each photocatalytic experiment was performed in triplicate to ensure the accuracy of the results. The reactor was confined in a dark chamber with internal ventilation and exhaust. Before the photoreaction, the reactor was degasified for 20 min with argon flow to remove all the oxygen contained in the reactor.
The hydrogen evolution was monitored by a thermal conductivity detector gas chromatograph. A 50 µL gas sample was injected with a Valco gas-tight sampling syringe equipped with a push-button valve into a Shimadzu GC-8A, equipped with a TCD detector and a stainless-steel molecular sieve 5A GC column (Sigma-Aldrich, St. Louis, USA); this column used Ar as a carrier. The column temperature was fixed at 80 °C, while the temperature of both the injector and the TCD detector was maintained at 120 °C.
For these photocatalytic reactions, the following parameters were studied:
% of Pt: 8 mg of catalyst was used in a glass reactor, and the corresponding volumes of H2PtCl6 solution were mixed with the catalysts, forming suspensions, to reach: 0.25, 1, and 1.5 of Pt wt%. For these tests, the liquid solution was composed of 2 mL of methanol and 6 mL of deionized water.
2.5. Hydroxyl Radical (•OH) Measuring Experiments
Terephthalic acid (TA) was used as a scavenger for the detection of •OH radical in this work since it is very well known and reported that TA can react directly with •OH radical to produce 2-hydroxyterephthalic acid (2-HTA), which is a highly fluorescent molecule, and it is relatively easy to detect [30,31]. The irradiation treatment of •OH radical measuring experiments was similar to the degradation experiments but in the absence of organic pollutants. The characterization of •OH radical was carried out using a fluorescence spectrophotometer (Shimadzu RF-5301, Kyoto, Japan) by monitoring the fluorescence emission at the wavelength of 425 nm under excitation at 315 nm.
3. Results and Discussion
3.1. Characterization of the Catalysts
Table 1 shows some chemical properties of Nb1 and Nb2 photocatalysts. According to the EDX analysis of photocatalysts (Table 1), as expected, these materials have Nb and O as principal components. Additionally, there are small quantities of Na (<2.8%), as well as Cl and K (in trace amounts), which are related to the impurities and unreacted reactants that are still present in photocatalysts, even after several washes.

Table 1.
Chemical and physical properties of the photocatalysts.
Figure 1a shows the XRD patterns of both photocatalysts: Nb1 and Nb2. Both XRD patterns show the presence of two broad peaks located at 27° and 53°; these enlargements are characteristic of amorphous niobium oxides, as also found by Marin et al. [32] and Brandão et al. [33], who obtained niobium oxide through other synthesis methods.
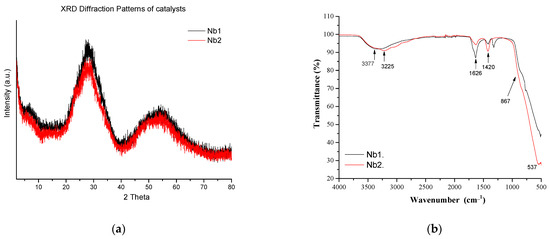
Figure 1.
(a) XRD patterns of the photocatalysts. (b) FTIR-ATR spectra of the photocatalysts.
The FTIR spectra of the photocatalysts are shown in Figure 1b. The broadband located at approximately ca. 3377 cm−1 of the spectra of Nb1 can be attributed to the surface O–H group in the stretching vibration mode of the niobium oxyhydroxide structure; however, the treatment with H2O2 (to form its sensitized form, Nb2) shifted this peak downward to ca. 3225 cm−1, thus meaning that such treatment modified the O–H of the structure, as both positions indicate that they are in different regions of the catalyst (for example, at the surface and in bulk part, respectively). [2]. The small peaks located at 1625 and 1420 cm−1 of the spectra of Nb1 are due to stretching and bending of O–H surface groups and H2O adsorbed from the air; these peaks suffered from modification by the H2O2 treatment. [34,35]
Broad peaks around 564 cm−1 usually represent the bridging Nb-O-Nb [35]. However, in Figure 1b, the formation of peroxo groups after treatment with H2O2 can be confirmed in the spectrum of the Nb2 catalyst by the stronger appearance of the peak at ca. 537 cm−1 (in comparison to Nb1), which can be assigned to the O–O asymmetrical stretching bonded to Nb (Nb–O–O). The peroxo groups can also be confirmed by the stronger shoulder at 867 cm−1, which is associated with the stretching vibration of the peroxo group (O–O) (see Figure 1b). [2].
Figure 2a shows the DRS spectra of photocatalysts. The spectra of photocatalysts show a steep absorption edge in the UV-visible region, which is characteristic of a direct “valence band”–“conduction band” transition (VB → CB). According to the DRS spectra, the Nb1 sample reflects mainly in the UV region; however, the treatment of this photocatalyst with H2O2, which resulted in sample Nb2, led to the sensitization of the photocatalyst under the visible region (see the black arrow in Figure 2a). The Nb2 profile shows a decay in the reflectance in the visible range (320–500 nm); this can justify why Nb2 photocatalyst is yellow, whereas Nb1 is white (see Figure 2c). This color variation may be ascribed to the formation of defects such as neutral vacancies (that generate levels located within the forbidden band) and Nb4+ species (electrons being trapped by Nb5+ ions). Additionally, an intervalence transition (Nb5+ → Nb4+) should be observed, but it is probably masked by the strong VB → CB transition, which has already been explained [36,37].
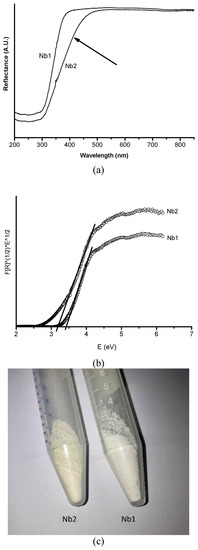
Figure 2.
Reflectance diffusion spectra of the photocatalysts. (a) DRS spectra; (b) Tauc plot; and (c) catalyst pictures.
In general terms, it was clear that the treatment of the photocatalysts with H2O2 modified the arrangement of energetic levels of the electrons of the valence band of HNP, leading to the modification of its band gap energy. The profiles obtained by the application of the Tauc plot formula to the DRS profiles are shown in Figure 2b, and the band gap energies (eV) calculated from these profiles are in Table 1; the band gap energies for Nb1 and Nb2 are 3.44 eV, and 3.20 eV, respectively; the difference between these values confirms the sensitization of the Nb2 photocatalyst. This means that the energy required for the formation of electron–hole pair in Nb2 is lower than that required by Nb1; such a property could favor the photocatalytic activity of this material, as will be discussed in the respective section.
The calculated band gap energy values of Nb1 and Nb2 are very close to those previously determined by Clechet et al. [36], Brayner et al. [37], and Nogueira et al. [38] for niobium oxides obtained by other methods.
Figure 3 shows the particle size distribution of photocatalysts Nb1 and Nb2. According to this figure, a narrow distribution can be observed for both samples; most parts of the particles present in these photocatalysts are smaller than 250 nm. Sample Nb2 has particles smaller than particles of sample Nb1, which means that the treatment of Nb1 with H2O2 reduced the particle diameter size of the resultant material. This can also be related to the surface area of the materials, which, according to the adsorption–desorption of N2 measurements, were 14 m2·g−1 (Nb1) and 22.8 m2·g−1 (Nb2), confirming that the smaller particle diameter size led to the larger surface area.
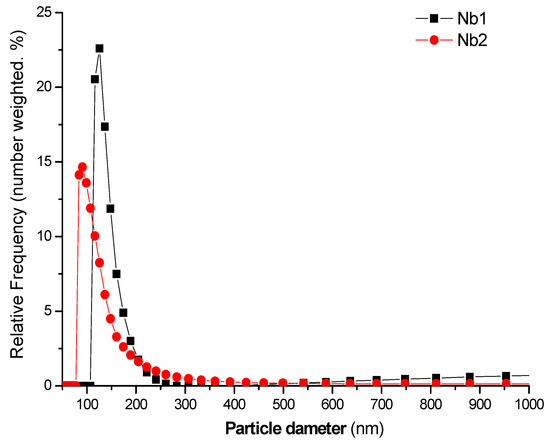
Figure 3.
Particle size distribution of photocatalysts.
According to the zeta potential measurements (see Table 1), Nb1 and Nb2 have values −41.38 mV and −45.65 mV, respectively. These values mean that Nb1 and Nb2 are composed of very established particles that are negatively charged. The particles of Nb2 are slightly more negative than Nb1, probably owing to the treatment with H2O2 (a strong oxidant compound), which led to the modification of the surface. The surface charges will influence the adsorption of molecules, which is the first step of photocatalysis. This will be discussed in the respective test section.
Figure 4 shows the SEM image obtained for Nb1(Figure 4a) and Nb2 (Figure 4b) photocatalysts. According to this figure, the samples present a non-regular morphology; most of the material is formed by agglomerated particles of a circular shape. There was not any difference between the morphologies of Nb1 and Nb2.
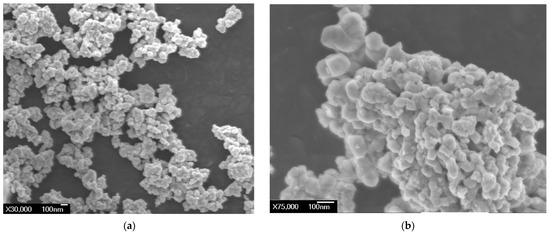
Figure 4.
Image of the Nb1 (a) and Nb2 (b) photocatalyst obtained by Scanning Electron Microscopy SEM (30 K).
3.2. Photocatalytic Tests
3.2.1. Photocatalytic Degradation of Phenol in Seawater
Variation in Irradiation Time and Catalyst Dosage
The results for the variation in the irradiation time are shown in Figure 5a; according to this figure, the photocatalysis of both catalysts reached stability after 90 min of UV irradiation. The photocatalytic activity of the photocatalysts was very significant, despite the presence of salts corresponding to seawater.
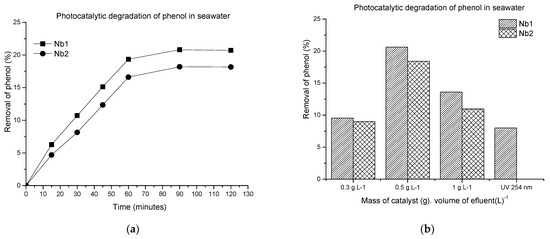
Figure 5.
Photocatalytic degradation of phenol in seawater under UV radiation: (a) variation in irradiation time; and (b) variation in catalyst dosage (gcat·L−1). (All the calculated errors were far below 1).
Figure 5b shows the results for the variation in catalyst dosage (grams of catalyst per liter of phenolic solution, gcat·L−1). According to these results, for both catalysts, it was observed that the rise in catalyst dosage increased the photocatalytic degradation of phenol; however, higher catalyst dosages (above 0.5 g·L−1) did not favor the phenol photodegradation, indicating that under UV radiation, high catalytic dosages led to the saturation of the active centers for photocatalysis. It is also possible that the number of active centers might have decreased due to the aggregation of particles caused by high catalyst dosage (in this case at 1 g·L−1); moreover, the increase in the turbidity of the suspension (another cause of the excess of catalyst dosage) reduces light penetration due to the enhancement of light scattering; the global result is the decrease in the number of active sites on the catalytic surface.
We also must consider the possibility that at a high catalyst dosage, the excess of catalysts may have caused a high recombination rate of the pair “photo-promoted electrons at the conducting band (e−CB)” and “photo-promoted holes at the valence band (h+ VB)”, which led to the low performance of the catalyst.
Comparison of Photocatalysis in Seawater and Distilled Water
Figure 6a,b show the removal % of phenol under different conditions: in seawater (Figure 6a) and in distilled water (Figure 6b). In Figure 6a, it can be observed that the salts present in seawater did not interfere significantly in the photocatalytic processes occurring for Nb1 and Nb2 (the % of removal is similar in both situations: distilled and seawater, see Figure 6b). The effect of seawater salts will be discussed in the following paragraphs below.
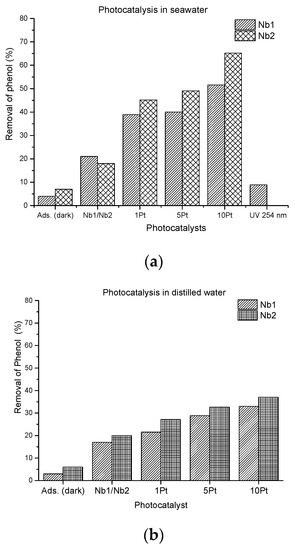
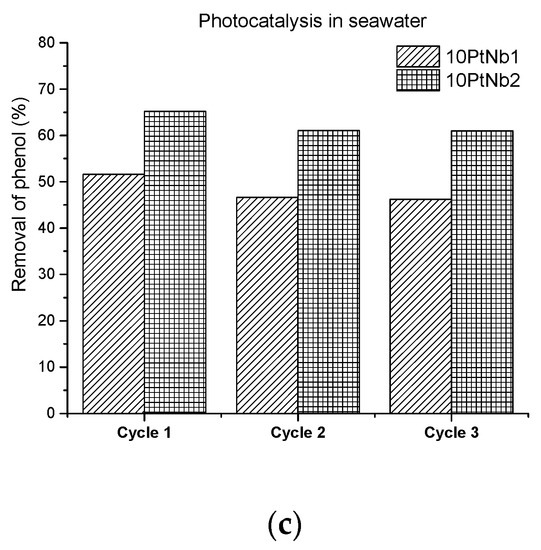
Figure 6.
Comparison of the removal of phenol carried out under different conditions: adsorption in dark conditions; heterogeneous photocatalysis of Nb1 and Nb2; heterogeneous photocatalysis in the presence of Pt° promoter on all catalysts (Nb1 and Nb2); and UV photolysis. (a) In seawater. (b) In distilled water. (c) Reuse of photocatalysts after photocatalysts in seawater. (All the calculated errors were far below 1).
It is important to remember that heterogeneous photocatalysis of solid photocatalysts is the result of two phenomena: adsorption and photocatalysis. The removal of phenol by adsorption of Nb1 and Nb2 (tests in the dark conditions) is low, but significant enough to affirm that the adsorption process has contributed to the photocatalytic process of each photocatalyst.
In dark conditions (in seawater and distilled water), the slightly superior phenol adsorption of Nb2 in comparison to Nb1 can be explained by the superior specific surface area of Nb2 in comparison to Nb1 (see Table 1). It seems that under dark conditions, the influence of surface area is more predominant than the surface charge, as the surface charge of Nb2 is more negative than Nb1.
A different situation can be observed in the heterogeneous photocatalysis in seawater (Figure 6a), where the phenol removal % of Nb1 is slightly higher than that of Nb2 (that superiority can be observed in Figure 5a,b and Figure 6a,b). This may be related to the difference in surface charge (see Table 1), as the sensitized Nb2 has a more negative surface charge than Nb1; therefore, the surface of Nb2 attracts greater quantities of cations (present in seawater) than Nb1. This effect seems to affect the photocatalytic activity of sensitized photocatalysts (Nb2) in seawater under UV light. These seawater cations probably interfere in the formation of oxidizing radicals under UV irradiation of Nb2. In the heterogeneous photocatalysis of Nb1 and Nb2 in the absence of seawater cations (tests made in distilled water, see Figure 6b), the contrary effect was observed, as phenol removal % of Nb2 was superior to Nb1, thus supporting our statement that the salts affect the photocatalytic process occurring for Nb2.
In general, the results of photocatalysis in seawater let us formulate the following affirmations regarding the seawater salts:
The salts present in seawater (Na+, K+, Ca2+, Mg2+, C1−, and SO4− as major components) favored the diffusion of phenols to the pores of the catalysts, thus favoring the photocatalytic process. It is known that phenolic compounds can coordinate with metal cations of seawater and enhance their ionization; this property increases their solubility in water [25,26].
The cations of seawater (Na+1, K+1, Ca2+, Mg2+, in major composition) may not hinder the photocatalytic degradation of phenol to a large extent, because these cations are at their maximum oxidation states; therefore, they do not have a significant inhibitory effect on the photocatalytic process of the solid catalysts.
Similar results were found by Iguchi et al. [39], who proved that the addition of NaCl (5844 mg·L−1) during the reduction of CO2 to CO increased the photocatalytic performance (more than twice), using layered double hydroxide (Ni-LHD) photocatalysts. The performance obtained by the presence of this salt was superior to that obtained in the presence of other salts, such as KCl, CsCl, MgCl2, and CaCl2. Similar findings were found by Hippargi et al. [40], and more recently by Asencios et al. [6] reported that seawater cations did not affect significantly the photocatalysis process over activated carbon–TiO2 materials.
The interactions between alkali, alkaline earth metals, and phenolic compounds in seawater are considered very weak. However, owing to the very high concentrations of such cations in seawater (salinity = 33%) and the very low concentrations of phenolic compounds (in this work <40 mg·L−1) make it necessary to take into account the interactions between them to understand the removal of phenol in high-salinity media [41].
According to Patnaik et al. [42], Moussavi et al. [43], Kinney and Ivanuski et al. [44], and the EPA [25,26], UV radiation can initiate a set of photoreactions between phenol and nitrite ions, and nitric ions in the aquatic environment, resulting in the formation of 2-nitrophenol and 4-nitrophenol. Similarly, the interaction between hydroxyl radicals and phenol in water produces 2-nitrophenol [43]. Moreover, the photolysis of phenol can also promote the formation of chlorophenol, which occurs through the chlorination of aromatic compounds in water [44]. According to Demianov et al. [41] at acidic pH, the Kps of the metal–phenol complex is significant, and metal complexes such as (NaL)0, (KL)0, (MgL)+, (CaL)+ (where the L means phenolic compounds) and chlorophenol are expected to exist.
Given these observations, the phenol removal values obtained in seawater for the present research also included a set of other phenol derivatives: phenol–metal complex and those nitrophenols and chlorophenols, as mentioned above (as the analytic method employed here to quantify the total phenolic compounds) [25,26].
Presence of Pt° Promoter
As it is known, the addition of noble metals (e.g., platinum) to a solid photocatalyst can improve the photocatalytic activity of photocatalysts [45]; therefore, the presence of Pt° as a promoter of Nb1 and Nb2 in the photodegradation of phenol was evaluated, and the results are shown in Figure 6a,b.
According to these results, the addition of Pt° greatly increased the performance of photocatalysts. The % of phenol removal increased directly proportional to the amount of Pt° in the catalysts (in both situations: seawater and distilled water). The improvement of photoactivity may be explained by the fact that Pt° decreased the recombination rate of the photopromoted electron (in the conduction band: e−VB) and electron–hole (in the valence band: hCB) pairs in the photocatalysts (Nb1 and Nb2).
Moreover, the benefits obtained by the addition of the Pt° promoter can be attributed to its noble metal property, as its Fermi level is highly electronegative and can be shifted to negative potentials owing to charge-accumulating effects that favor the photocatalytic efficiency of photocatalysts [46]. Additionally, as reported by Lin et al. [47], Pt° particles act as a sink for photoinduced carriers, thus promoting the interfacial charge transfer process; all these effects can explain the high activity of Pt-promoted Nb1 and Nb2.
In the case of heterogeneous photocatalysis under seawater conditions, the seawater salts may be acting as additional hole scavengers for Pt°-promoted Nb catalysts. This effect may have led to an increase in the photooxidation of phenol in seawater in Pt°-promoted Nb. According to Hippargi et al. [40], a hole scavenger is a chemical species that can remove or deactivate unwanted impurities of the photocatalyst to ensure that they do not cause unfavorable reactions. The results of Figure 6a indicate that the seawater salts acted as a hole scavenger facilitating the oxidation of phenol. This hypothesis is supported by the fact that, in the presence of seawater salts, the performances of both Pt°-promoted Nb catalysts were better than the performances observed in distilled water (see Figure 6b).
Curiously, under seawater conditions (Figure 6a), Pt°-promoted Nb2 recorded a better performance than Pt-promoted Nb1 (the contrary effect was found in the absence of Pt°). These results suggest that the seawater salts favored the performance of the sensitized photocatalysts (Nb2) in the presence of the Pt° promoter, as the Pt°-promoted Nb2 catalyst achieved the best performance recorded for this photoreaction.
The superior performance of Nb2 over Nb1 in the presence of the Pt promoter could be related to the fact that Nb2 has a higher surface area than Nb1, which may have allowed the photodeposition of Pt° on the surface of the catalyst (and therefore favored the formation of more active centers). As it is well-known, a high surface area favors a good distribution (and segregation) of the active metal particles, which is good for catalysis. Under this situation, in the presence of Pt°, the more negative surface charge of the Nb2 catalyst (seen in Table 1) seems to hinder the photocatalytic activity of Nb2 during the photocatalysis in seawater, since Nb2 performed better than Nb1.
Possible Mechanism
Despite the complex composition of seawater, it is expected that the mechanism of phenol photodegradation of the photocatalysts of the present research followed three steps: (1) adsorption of phenolic molecules on the surface of the catalyst; (2) surface photodegradation of phenol; and (3) desorption of final products from the surface of photocatalyst. [6].
During the UV irradiation of the catalysts, the electrons from the valence band (e−CB) of the semiconductor are promoted to the conduction band, generating electron vacancies (holes) in the valence band (h+VB), as demonstrated by Equation (1):
photocatalyst + light (hv ≥ Ebg) → e−CB + h+VB
The results shown in Figure 6 indicate that the salts present in the solution (owing to seawater composition) did not hinder the photocatalytic process. Considering that the surface photoreaction of phenol (Step 2) is the lowest step (and subsequently the rate-determining step), in Step (2), we can see that the electron vacancies (h+VB) may induce the oxidation of adsorbed phenol molecules on the surface of the catalyst (a direct mechanism) or that those electron vacancies may also allow the breakdown of the H-O-H bonds of the adsorbed water molecules, leading to the formation of hydroxyl radicals •OH (an indirect mechanism), which attack the phenol molecules adsorbed onto the catalyst (or its close vicinity). [6]
Among hydroxyl radicals, •OH, during UV irradiation, the formation of peroxides species (e.g., superoxide radical ion O2•−, an important source of hydroxyl radical) takes place due to the presence of O2 in the aqueous solution, and it acts as a precursor of other reactive species in photochemical reactions [48,49].
At thermodynamically favorable conditions, photon-generated holes (h+VB), photopromoted electrons (e−CB), hydroxyl radicals (OH•), and superoxide ions (O2•−) take part in heterogeneous photocatalytic reactions. In the current study, we suggest that under the UV irradiation of the photocatalysts, the following reactions took place (starting with Equation (1)) [48,49]:
h+VB + H2O → OH• + H+
O2 + e−CB → O2•−
O2•− + e−CB + 2H+→ H2O2
O2•− + O2•− + 2H+→ H2O2 + O2
phenol + UV light (λ = 254nm) → phenol
phenol• + catalyst → phenol•+ + catalyst (e−)
phenol•+ + OH• (or O2•−) → Intermediates → CO2 + H2O
Water and phenol molecules are adsorbed in porous Nb1 and Nb2, and it is very possible that the photogenerated OH• (and/or O2•−) radicals attack the adsorbed phenol molecule inside the catalysts.
When the phenol photodegradation reaction is carried out in the presence of the Pt° promoter, the following equation may take place (Equation (1a)) [50,51]:
Pt° photocatalyst + light (hv ≥ Ebg) → Pt°(e−)-photocatalyst(h+)
The charge separation shown in Equation (1a) hinders the electron–hole recombination that affects the photocatalytic activity of catalysts; this charge separation increases the life-time of photogenerated carriers, generating more oxidant radicals that react with adsorbed species. Equation (1a) may explain the good performance of photocatalysts in the presence of a Pt° promoter.
Catalyst Reuse
The Nb photocatalysts were reused up to three times to analyze the efficiency of the wasted photocatalysts (The results are shown in Figure 6c). Each experiment (cycle) was carried out under the best conditions found in photocatalytic tests (catalyst dosage of 0.5 gcat·L−1, initial pH solution = 3–4, the reaction time of 120 min under UV light). According to this figure, in the second cycle, all the photocatalysts slightly reduced their removal capacity, and after the second cycle, the removal % of phenol remained almost constant. The decrease in the efficiency of the photocatalysts after the first cycle was expected and may be related to the presence of salts in the seawater; it seems that the time spent washing them with distilled water was not enough to remove these salts completely.
3.2.2. Photoreforming of Methanol
The photocatalytic properties of HNP photocatalysts were tested in hydrogen evolution experiments, in a methanol–water solution (ratio = 2:6); in this case, methanol was used as an electron–donor molecule. Figure 7a,b show the time courses of H2 evolution of HNP photocatalysts, pure and also promoted with different Pt° loads. It is clear that the sensitized photocatalyst (Nb2) showed low photocatalytic activity for hydrogen production; however, it was enough to observe that its photocatalytic activity was higher than Nb1. Both photocatalysts significantly enhanced their photocatalytic activity in H2 production after the addition of Pt°, as compared with their pure form. The production of H2 over this period increased in the following order: 0.25% Pt < 0.5% Pt < 1% Pt < 1.5% Pt. The same trend was found for each catalyst (Nb1 and Nb2). In all cases, the performance of Nb2 was superior to Nb1. After 6 h, the Pt-promoted Nb2 showed the highest photocatalytic activity of H2 production with a rate of 983 µmol/g·h−1 under the simulated sunlight simulator (Figure 7b).
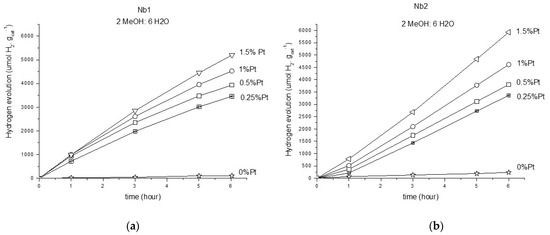
Figure 7.
Hydrogen evolution during methanol photoreforming with photocatalysts (methanol–water ratio = 6:2): (a) Nb1; (b) Nb2.
The action of Pt° as a co-catalyst on the surface of Nb1 and Nb2 was very clear, as the results suggest that the photogenerated electrons of photocatalysts were transferred to Pt°, thus avoiding the recombination effect. For the Nb2 photocatalyst, the photodeposited Pt° particles could take full advantage of the surface (higher surface area and surface charge and light sensitivity) so that the Pt°-promoted Nb2 catalyst showed the highest activity.
As shown in Figure 7, under the simulated sunlight irradiation, the same effect as that explained in Equation (1) is expected to occur, with the corresponding photogeneration of electron–holes and photopromoted electrons. Subsequently, the H+ present in the solution would trap the electrons on the surface of Nb to produce H2, which also inhibited the recombination effect of photogenerated electron–hole pairs. The photogenerated holes would be transferred to the surface of Nb to oxidate the methanol. When Pt° particles are loaded on the surface of catalysts, the photoexcited electrons migrate from the conduction band of Nb to the Pt° particles, and subsequently, the electron reduces H+ to H2. This can explain why photocatalytic activities of Pt-promoted Nb catalysts were much higher than that of pure Nb catalysts. The activity of Nb1 and Nb2 catalysts drastically increased after the addition of Pt. The Nb2 catalyst, which has the largest surface area, offers a higher number of active sites by unit mass, thus leading to a higher photocatalytic activity.
According to our results, methanol acted as an efficient hole scavenger and inhibited the recombination effect during the water-splitting reaction [52]. An insignificant amount of CO2 is expected because the conversion of methanol to CO2 by photogenerated holes is a slow process in the oxidation of methanol [53].
Table 2 shows the values of the hydrogen production rate (µmol H2. h−1·g−1) obtained by other works in comparison with those obtained by our present research.
Table 2.
Comparison of catalysts from this work with others from the literature.
Comparing the values of the hydrogen production rate (µmol H2. h−1·g−1) shown in Table 2, our HNPs (Nb1 and Nb2), pure and Pt-promoted (especially Nb2), are very competitive, and very advantageous since the HNPs were obtained by a very simple method when compared to the mesoporous Nb2O5 obtained by Lin et al. [47] (who prepared Nb2O5 using an evaporation-induced self-assembly method and used thermal treatment of 450 °C); the KNbO3/graphitic carbon nitride composite obtained by Xu et al. [57] (who prepared KNbO3 using a hydrothermal method with heat treatment at 150 °C for 7 days; the graphitic carbon nitride g-C3N4, which was synthesized at 550 °C, and for which the assembly was carried out at 450 °C); and the SrTiO3 synthesized by Puangpetch et al. [54] (in this case, the SrTiO3 photocatalysts were synthesized via the sol–gel process, with the aid of a structure-directing surfactant and calcination at 700 °C). It is known that surface area and crystallinity are competitive factors. As a photocatalyst with a high specific surface area offers a higher number of active sites, high crystallinity, on the other hand, is associated with low specific surface area; however, it leads to less crystalline defects (which act as recombination centers). As was reported in the characterization of our two HNPs (Nb1 and Nb2), they are amorphous, and Nb2 (sensitized catalyst) has a superior surface area to Nb1. We believe that the amorphous nature of Nb2, and its relatively higher surface area and light sensitivity, favored the methanol photoreforming reaction.
Possible Mechanism
The test of hydrogen production in the absence of methanol did not produce a significant amount of hydrogen, this forced us to use a sacrificial electron donor as methanol. The results shown in Figure 6 and Figure 7 demonstrate that the hydrogen comes from the photoreforming of methanol, which takes place under light (in this case, solar irradiation), according to Equation (1):
CH3OH + H2O + light (hv ≥ Ebg) → 3H2 + CO2
The change in Gibbs free energy for Equation (9) is 9.3 kJ/mol [51]. During reaction (9), methanol serves as a sacrificial electron donor, which removes (irreversibly) photogenerated holes (h+) from the valency band of the photocatalyst (Equation (1)), among other formed oxidizing agents (e.g., •OH, O2•−, HO2•, H2O2, see Equations (2)–(5)), thus enhancing H2 production. As the sacrificial compound in solution is consumed, little quantities of CO2 are expected; however, CO2 can form carbonic acids that can be dissolved in water, thus making its detection difficult. When methanol is fully consumed, the rate of hydrogen production drops drastically, because the photogenerated oxidants cannot be removed from the photocatalyst surface.
It is known that the deposition of Pt° crystallites on the surface photocatalyst is a prerequisite for the efficient production of H2 through photoreforming of organic molecules. Photogenerated electrons are trapped by the dispersed Pt° crystallites [50], whereas photogenerated holes remain on photocatalysts (Equation (10)):
Pt° photocatalyst + light (hv ≥ Ebg) → Pt°(e−) photocatalyst(h+)
The photogenerated holes (h+) can oxidize adsorbed organics species, either directly or indirectly, by the formation of hydroxyl radicals (Equation (2)). The charge separation shown in Equation 10 hinders the electron–hole recombination that affects the photocatalytic efficiency and increases the life-time of photogenerated carriers that react with adsorbed species. Besides, Pt° deposits decrease the overpotential for the reduction of H+ to H2, and it is known that Pt can trap the photogenerated electrons within (a few picoseconds) and catalyze the H2 formation reaction, thus enhancing the rate of hydrogen production [51,58] (Equation (11)).
2e− + 2H+ → H2
Dispersed Pt° deposits crystallites may also provide sites for adsorbed species to react by promoting dehydrogenation reactions.
According to the results reported by Nomikons et al. [51], Chen et al. [58], it is very possible that some methanol molecules have been adsorbed on the surface catalyst, forming the corresponding methoxy species (Equation (12)). These methoxy species may interact with photogenerated holes (h+) to form methoxy radicals (Equation (13)), which can further react with holes (h+) to release protons and form formaldehyde adsorbed on the catalytic surface (Equation (14)), subject to further oxidation (and further release of H+):
CH3OH → CH3O(ads)− + H+
CH3O−(ads) + h+ → CH3O• (ads)
CH3O• (ads) + h+ → CH2O(ads) + H+
CH2O (ads) + O(surface) → CH2OO-(ads)
CH2OO- (ads) + h+ → HCOO(ads) + H+
HCOO(ads) + h+ → H+ + CO2
Similar to the results reported by Nomikos et al. [51], Kecskés et al. [59], and Chen et al. [58], formaldehyde may adsorb on Nb photocatalysts through lone pair donation of the oxygen of carbonyl (C=O) to Lewis acid sites of Nb2O5.nH2O. The surface modification of Nb2, which led to sensitization, may have favored this process over Nb1, resulting in a better catalytic performance for hydrogen production. Furthermore, the carbonyl reacts with the surface oxygen ion (of photocatalyst) to form dioxymethylene species (Equation (15)), which further reacts with photogenerated holes (h+) to produce formate species (Equation (16)). The surface formate is transformed into carbonate or CO2 through reaction (17), (known as the photo-Kolbe reaction). All the released protons H+ in Equations (12)–(17) are reduced to H2 according to Equation (11). The net result of Equations (12)–(17) is Equation (9).
When water is the dominant surface species, the oxidation of methanol may also be mediated by the photogenerated hydroxyl radicals (produced in Equation (2)), according to the following reactions: [60]
CH3OH + OH• → •CH2OH + H2O
•CH2OH → HCHO + H+
In an unaired system, formaldehyde may be produced after •CH2OH transfers one electron into the conduction band of the photocatalyst (Equation (19)); this process is known as the “current double process” [59]. The oxidation process will continue to produce CO2; H2 is produced by Equation (11).
Hydroxyl Radical (•OH) Measuring Experiments
The generated hydroxyl radicals (•OH) of Nb1 and Nb2, in the heterogeneous photocatalysis process, were detected by using the •OH radical scavenger terephthalic acid (TA); this compound reacts directly with •OH radicals to produce 2-hydroxyterephthalic acid (2-HTA). According to Equation (20), the •OH radicals can be detected by measurement of 2-HTA. [30,31].
TA + •OH → 2-HTA
Figure 8a,b show the fluorescence emission spectra of 2-HTA obtained from Nb1 and Nb2 photocatalysts in the absence and the presence of a Pt° promoter. It can be seen that fluorescent emission spectra of 2-HTA have an intense peak at 425 nm. The figures reveal the formation of •OH radicals, which indeed participate in the photocatalytic processes.
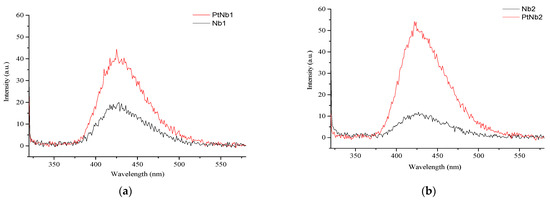
Figure 8.
Fluorescence spectra of TA, after UV irradiation experiment in the presence of photocatalysts. (a) Nb1, (b) Nb2.
In each spectrum, the fluorescence intensity of 2-HTA at 425 nm was greatly increased by the presence of the Pt° promoter. This is in agreement with the findings of the photocatalytic test (for both reactions studied), where the presence of Pt° increased the photocatalytic performance of the photocatalysts during the photocatalytic reactions studied in this research.
Additionally, when comparing the intensity at 425 nm of the spectra of 2-HTA of both photocatalysts in the presence of the Pt° promoter, it can be seen clearly that Pt°-promoted Nb2 produced more hydroxyl radicals than Pt°-promoted Nb1, which is in accordance with the findings of the photocatalytic degradation of phenol (in seawater and in distilled water, where the removal % of phenol = Pt°-promoted Nb2 > Pt°-promoted Nb1), and the photoreforming of methanol (where hydrogen evolution of Pt°-promoted Nb2 > Pt°-promoted Nb1).
According to Figure 8b, the addition of the Pt° promoter makes the intensity of the peak at 425 nm of the spectrum of 2-HTA of Nb1 grow twice; in the case of Nb2, the presence of the Pt° promoter makes the intensity of the peak at 425 nm grow four times.
According to these results, and according to Figure 8a,b, it can be concluded that the great contribution of the Pt° promoter to the photoreactions studied was helping in the increase in •OH radicals; additionally, it was clear from these results that Nb2 was more favored by the Pt° promoter (explained by its superior specific surface area, Table 1).
4. Conclusions
Hydrated Niobium Penthoxide (HNP) was synthesized from ammoniacal oxygen (NH4 [NbO(C2O4)2·H2O] XH2O) via an economical and simple way. These photocatalysts can effectively be used in the photodegradation of phenol in seawater and in the photoreforming of methanol to produce hydrogen and are comparable to others reported in the available literature.
HNP was treated with a H2O2 solution, leading to the following effects: light sensitization, an increase in specific surface area, a diminishing average particle size, modification of surface charge, and formations of peroxo superficial groups. Both photocatalysts were active for the photoreactions studied in this work: the photodegradation of phenol in seawater and the photoreforming of methanol.
Although both photocatalysts (Nb1 and Nb2) were active for both proposed reactions, the sensitization of the photocatalyst was beneficial in distinct situations. In the photocatalytic degradation of phenol in seawater, the sensitization of the photocatalyst did not enhance the photocatalytic activity.
In both photoreactions studied, the addition of the Pt° promoter readily increased the photocatalytic performance of both photocatalysts; in this case, the sensitized photocatalyst (Nb2) was more beneficial as it recorded the best performance.
The generated •OH radicals from Nb1and Nb2 and Pt°-promoted photocatalysts are the primary active radicals that have been detected by using the •OH radical scavenger TA. The great contribution of the presence of the Pt° promoter was its help in •OH radical production. The presence of the promoter was more favorable for the sensitized photocatalyst (Nb2).
Author Contributions
Conceptualization, Y.J.O.A.; methodology, Y.J.O.A., V.A.M.; formal analysis, Y.J.O.A.; investigation, Y.J.O.A., V.A.M.; writing—original draft preparation, Y.J.O.A.; writing—review and editing, Y.J.O.A.; supervision, Y.J.O.A.; funding acquisition, Y.J.O.A. All authors have read and agreed to the published version of the manuscript.
Funding
The São Paulo Research Foundation (FAPESP) for the financial support (Grant N°: 2014/24940-5), and the Brazilian National Council for Scientific Development (CNPq, Grant N° 407097/20).
Institutional Review Board Statement
Not applicable.
Informed Consent Statement
Not applicable.
Data Availability Statement
Not applicable.
Acknowledgments
The authors thank Ralf Dillert, Yamen AlSalka, Osama Al-Madanat, and Detlef W. Bahnemann from the Institut für Technische Chemie, Leibniz Universität Hannover, for the facilities for the hydrogen production test; we also thank the São Paulo Research Foundation (FAPESP) for the financial support (Grant N°: 2014/24940-5 and 2017/01462-9), the Brazilian National Council for Scientific Development (CNPq, Grant N° 407097/20), Multiuser Center of Federal University of ABC (CEM-UFABC), and Brazilian Metallurgy and Mining Company (CBMM) for providing the salt precursor of niobium.
Conflicts of Interest
The authors declare no conflict of interest.
References
- Nakagomi, F.; Cerruti, S.E.; Freitas, M.R.; Neto, E.S.F.; Andrade, F.V.; Siqueira, G.O. Niobium pentoxide produced by a novel method microwave assisted combustion synthesis. Chem. Phys. Lett. 2019, 729, 37–41. [Google Scholar] [CrossRef]
- Oliveira, H.S.; Resende, J.M.; Souza, P.P.; Patrício, P.S.O.; Oliveira, L.C.A. Synthetic Niobium Oxyhydroxide as a Bifunctional Catalyst for Production of Ethers and Allyl Alcohol from Waste Glycerol. J. Braz. Chem. Soc. 2017, 28, 2244–2253. [Google Scholar] [CrossRef]
- Padula, I.D.; Chagas, P.; Furst, C.G.; Oliveira, L.C.A. Mesoporous Niobium Oxyhydroxide Catalysts for Cyclohexene Epoxidation Reactions. Appl. Sci. 2018, 8, 881. [Google Scholar] [CrossRef]
- Ferraz, N.P.; Nogueira, A.E.; Marcos, F.C.F.; Machado, V.A.; Rocca, R.R.; Assaf, E.M.; Asencios, Y.J.O. CeO2–Nb2O5 photocatalysts for degradation of organic pollutants in water. Rare Met. 2020, 39, 230–240. [Google Scholar] [CrossRef]
- Ferraz, N.P.; Marcos, F.C.F.; Nogueira, A.E.; Martins, A.S.; Lanza, M.R.V.; Assaf, E.M.; Asencios, Y.J.O. Hexagonal-Nb2O5/Anatase-TiO2 mixtures and their applications in the removal of Methylene Blue dye under various conditions. Mater. Chem. Phys. 2017, 198, 331–340. [Google Scholar] [CrossRef]
- Asencios, Y.J.O.; Lourenço, V.S.; Carvalho, W.A. Removal of phenol in seawater by heterogeneous photocatalysis using activated carbon materials modified with TiO2. Catal. Today 2020, 388–389, 247–258. [Google Scholar] [CrossRef]
- Nowak, I.; Ziolek, M. Niobium Compounds: Preparation, Characterization, and Application in Heterogeneous Catalysis. Chem. Rev. 1999, 99, 3603–3624. [Google Scholar] [CrossRef]
- Ziolek, M.; Sobczak, I.; Decyk, P.; Sobanska, K.; Pietrzyk, P.; Sojka, Z. Search for reactive intermediates in catalytic oxidation with hydrogen peroxide over amorphous niobium(V) and tantalum(V) oxides. Appl. Catal. B 2015, 164, 288–296. [Google Scholar] [CrossRef]
- Iizuka, T.; Ogasawara, K.; Tanabe, K. Acidic and Catalytic Properties of Niobium Pentaoxide. Bull. Chem. Soc. Jpn. 1983, 56, 2927–2931. [Google Scholar] [CrossRef]
- Murayama, T.; Chen, J.; Hirata, J.; Matsumoto, K.; Ueda, W. Hydrothermal synthesis of octahedra-based layered niobium oxide and its catalytic activity as a solid acid. Catal. Sci. Technol. 2014, 4, 4250–4257. [Google Scholar] [CrossRef]
- Oliveira, L.C.A.; Costa, N.T.; Pliego, J.R.; Silva, A.C.; de Souza, P.P.; Patrícia, P.S. Amphiphilic niobium oxyhydroxide as a hybrid catalyst for sulfur removal from fuel in a biphasic system. Appl. Catal. B Environ. 2014, 147, 43–48. [Google Scholar] [CrossRef][Green Version]
- Ekhsan, J.M.; Lee, S.L.; Nur, H. Niobium oxide and phosphoric acid impregnated silica–titania as oxidative-acidic bifunctional catalyst. Appl. Catal. A Gen. 2014, 471, 142–148. [Google Scholar] [CrossRef]
- Da Silva, G.T.; Nogueira, A.E.; Oliveira, J.A.; Torres, J.A.; Lopes, O.F.; Ribeiro, C. Acidic surface niobium pentoxide is catalytic active for CO2 photoreduction. Appl. Catal. B Environ. 2019, 242, 349–357. [Google Scholar] [CrossRef]
- Moraes, N.P.; Pinto da Silva, M.L.C.; Rodrigues, L.A. Effect of metal doping in the photocatalytic properties of carbon xerogel-Nb2O5 composite towards visible light degradation of methylene blue. Mater. Lett. 2018, 228, 486–489. [Google Scholar] [CrossRef]
- Feldmann, C.; Jungk, H.O. Polyol-Mediated Preparation of Nanoscale Oxide Particles. Angew. Chem. Int. Ed. 2001, 40, 359–362. [Google Scholar] [CrossRef]
- Uekawa, N.; Kudo, T.; Mori, F.; Jun Wu, Y.; Kakegawa, K. Low-temperature synthesis of niobium oxide nanoparticles from peroxo niobic acid sol. J. Colloid Interface Sci. 2003, 264, 378–384. [Google Scholar] [CrossRef]
- Leite, E.R.; Vila, C.; Bettini, J.; Longo, E. Synthesis of Niobia Nanocrystals with Controlled Morphology. J. Phys. Chem. B 2006, 37, 18088–18090. [Google Scholar] [CrossRef]
- Mozetič, M.; Cvelbar, U.; Sunkara, M.K.; Vaddiraju, S. A Method for the Rapid Synthesis of Large Quantities of Metal Oxide Nanowires at Low Temperatures. Adv. Mater. 2005, 17, 2138–2142. [Google Scholar] [CrossRef]
- Hu, W.; Liu, Z.; Nie, G.; Mi, Y.; Zhao, Y.; Yao, K. Synthesis of Nb3.49N4.56O0.44 nanoplatelets and NbS2–Nb2O5 nanoflakes. Mater. Chem. Phys. 2009, 113, 511–514. [Google Scholar] [CrossRef]
- Pinna, N.; Antonietti, M.; Niederberger, M. A novel non-aqueous route to V2O3 and Nb2O5 nanocrystals. Colloids Surf. A 2004, 250, 211–213. [Google Scholar] [CrossRef]
- Carvalho, K.T.G.; Silva, A.C.; Oliveira, L.C.A.; Gonçalves, M.; Magriotis, Z.M. Nióbia sintética modificada como catalisador na oxidação de corante orgânico: Utilização de H2O2 e O2 atmosférico como oxidantes. Quím. Nova 2009, 32, 1373–1377. [Google Scholar] [CrossRef]
- Wood, D.L.; Tauc, J. Weak Absorption Tails in Amorphous Semiconductors. Phys. Rev. B 1972, 5, 3144. [Google Scholar] [CrossRef]
- Carpio, E.; Zúñiga, P.; Ponce, S.; Solis, J.; Rodriguez, J.; Estrada, W. Photocatalytic degradation of phenol using TiO2 nanocrystals supported on activated carbon. J. Mol. Catal. A Chem. 2005, 228, 293–298. [Google Scholar] [CrossRef]
- Silva, S.S. Integration of Flotation and Photo-Fenton Processes to Reduce Oils and Greases from Water Produced in Oil Fields. Ph.D. Thesis, Federal University of Rio Grande do Norte (UFRN), Natal, Brazil, 2013. Available online: https://repositorio.ufrn.br/jspui/handle/123456789/15924 (accessed on 9 April 2022).
- EPA (U.S. Environmental Protection Agency). Method 604, Methods for Organic Chemical Analysis of Municipal and Industrial Wastewater; Part VIII, 40 CFR Part 136. Appendix A; Environmental Protection Agency EPA: Washington, DC, USA, 1984.
- APHA Method D 5530. Standard Methods for the Examination of Water and Wastewater, 17th ed.; American Public Health Association (APHA): Washington, DC, USA, 1989. [Google Scholar]
- Sun, X.; Zhang, H.; Wei, J.; Yu, Q.; Yang, P.; Zhang, F. Preparation of point-line Bi2WO6@TiO2 nanowires composite photocatalysts with enhanced UV/visible-light-driven photocatalytic activity. Mater. Sci. Semicond. Process. 2016, 45, 51–56. [Google Scholar] [CrossRef]
- Zhu, C.; Zhang, L.; Jianga, B.; Zheng, J.; Hu, P.; Li, S.; Wu, M.; Wu, W. Fabrication of Z-scheme Ag3PO4/MoS2 composites with enhanced photocatalytic activity and stability for organic pollutant degradation. Appl. Surf. Sci. 2016, 377, 99–108. [Google Scholar] [CrossRef]
- Xu, D.; Cheng, B.; Cao, S.; Yu, J. Enhanced photocatalytic activity and stability of Z-scheme Ag2CrO4-GO composite photocatalysts for organic pollutant degradation. Appl. Catal. B 2015, 164, 380–388. [Google Scholar] [CrossRef]
- Tong, T.; Zhang, H.; Chen, J.; Jin, D.; Cheng, J. The photocatalysis of BiFeO3 disks under visible light irradiation. Catal. Commun. 2016, 87, 23–26. [Google Scholar] [CrossRef]
- Rosli, N.I.M.; Lam, S.-M.; Sin, J.C.; Satoshi, I.; Mohamed, A.R. Photocatalytic Performance of ZnO/g-C3N4 for Removal of Phenol under Simulated Sunlight Irradiation. J. Environ. Eng. 2018, 144, 04017091. [Google Scholar] [CrossRef]
- Luis Marin, M.; Hallett-Tapley, G.L.; Impellizzeri, S.; Fasciani, C.; Simoncelli, S.; Netto-Ferreira, J.C.; Scaiano, J.C. Synthesis, acid properties and catalysis by niobium oxide nanostructured materials. Catal. Sci. Technol. 2014, 4, 3044–3052. [Google Scholar] [CrossRef]
- Brandão, R.F.; Quirino, R.L.; Mello, V.M.; Tavares, A.P.; Peres, A.C.; Guinhos, F.; Rubim, J.C.; Suarez, P.A.Z. Synthesis, Characterization and use of Nb2O5 based Catalysts in Producing Biofuels by Transesterification, Esterification and Pyrolysis. J. Braz. Chem. Soc. 2009, 20, 954–966. [Google Scholar] [CrossRef]
- Oliveira, F.C.; Carvalho, W.M.; Oliveira, L.C.A.; Passos, A.R.; Silva, A.C. Utilization of Sn/Nb2O5 composite for removal of Methylene blue. Quim. Nova 2010, 33, 528–531. [Google Scholar]
- Saranya, K.; Raja, S.T.K.; Subhasree, R.S.; Gnanamani, A.; Das, S.K.; Rajendran, N. Fabrication of nanoporous sodium niobate coating on 316L SS for Orthopaedics. Ceram. Int. 2017, 43, 11569–11579. [Google Scholar] [CrossRef]
- Clechet, P.; Martin, J.R.; Olier, R.; Vallouy, C. Photoeletrochemical effect on several transition metal oxides. C. R. Acad. Sci. Ser. C 1976, 282, 887. [Google Scholar]
- Brayner, R.; Bozon-Verduraz, F. Niobium pentoxide prepared by soft chemical routes: Morphology, structure, defects and quantum size effect. Phys. Chem. Chem. Phys. 2003, 5, 1457–1466. [Google Scholar] [CrossRef]
- Nogueira, A.E.; Ramalho, T.C.; Oliveira, L.C.A. Photocatalytic Degradation of Organic Compound in Water Using Synthetic Niobia: Experimental and Theoretical Studies. Top. Catal. 2011, 54, 270–276. [Google Scholar] [CrossRef]
- Iguchi, S.; Teramura, K.; Hosokawa, S.; Tanaka, T. Effect of chloride ion as a hole scavenger on the photocatalytic conversion of CO2 in an aqueous solution over Ni−Al layered double hydroxides. Phys. Chem. Chem. Phys. 2015, 17, 17995–18003. [Google Scholar] [CrossRef]
- Hippargi, G.; Mangrulkar, P.; Chilkalwar, A.; Labhsetwar, N.; Rayalu, S. Chloride ion: A promising hole scavenger for photocatalytic hydrogen generation. Int. J. Hydrogen Energy 2018, 43, 6815–6823. [Google Scholar] [CrossRef]
- Demianov, P.; Concetta, D.E.; Giancuzza, A.S.; Ammartano, S. Equilibrium studies in natural waters: Speciation of phenolic compounds in synthetic seawater at different salinities. Environ. Toxicol. Chem. 1995, 5, 767–773. [Google Scholar] [CrossRef]
- Patnaik, P.; Khoury, J.N. Reaction of phenol with nitrite ion: Pathways of formation of nitrophenols in environmental waters. Water Res. 2004, 38, 206–210. [Google Scholar] [CrossRef]
- Moussavi, M. Effect of polar substituents on autoxidation of phenols. Water Res. 1979, 13, 1125–1128. [Google Scholar] [CrossRef]
- Kinney, L.C.; Ivanuski, V.R. Water Research Center. Advance Waste Treatment Research Laboratory-XIII., Photolysis Mechanisms for Pollution Abatement; U.S. Department of the Interior. Federal Water Pollution Control Administration: Cincinnati, OH, USA, 1969. Available online: https://www.epa.gov/nscep (accessed on 9 April 2022).
- Idrees, F.; Dillert, R.; Bahnemann, D.; Butt, F.K.; Tahir, M. In-Situ Synthesis of Nb2O5/g-C3N4 Heterostructures as Highly Efficient Photocatalysts for Molecular H2 Evolution under Solar Illumination. Catalysts 2019, 9, 169. [Google Scholar] [CrossRef]
- Linsebigler, A.L.; Lu, G.; Yates, J.T., Jr. Photocatalysis on TiO2 Surfaces: Principles, Mechanisms, and Selected Results. Chem. Rev. 1995, 95, 735–758. [Google Scholar] [CrossRef]
- Lin, H.-Y.; Yang, H.-C.; Wang, W.-L. Synthesis of mesoporous Nb2O5 photocatalysts with Pt, Au, Cu and NiO cocatalyst for water splitting. Catal. Today 2011, 174, 106–113. [Google Scholar] [CrossRef]
- Yao, S.; Li, J.; Shi, Z. Immobilization of TiO2 nanoparticles on activated carbon fiber and its photodegradation performance for organic pollutants. Particuology 2010, 8, 272–278. [Google Scholar] [CrossRef]
- Ziolli, R.L.; Jardim, W.F. Photocatalytic decomposition of seawater-soluble crude-oil fractions using high surface area colloid nanoparticles of TiO2. J. Photochem. Photobiol. A Chem. 2002, 147, 205–212. [Google Scholar] [CrossRef]
- Kudo, A.; Miseki, Y. Heterogeneous photocatalyst materials for water splitting. Chem. Soc. Rev. 2009, 38, 253–278. [Google Scholar] [CrossRef]
- Nomikos, G.N.; Panagiotopoulou, P.; Kondarides, D.I.; Verykios, X.E. Kinetic and mechanistic study of the photocatalytic reforming of methanol over Pt/TiO2 catalyst. Appl. Catal. B Environ. 2014, 146, 249–257. [Google Scholar] [CrossRef]
- Yu, Z.; Chuang, S.S.C. In situ IR study of adsorbed species and photogenerated electrons during photocatalytic oxidation of ethanol on TiO2. J. Catal. 2007, 246, 118–126. [Google Scholar] [CrossRef]
- Yu, J.; Wang, G.; Cheng, B.; Zhou, M. Effects of hydrothermal temperature and time on the photocatalytic activity and microstructures of bimodal mesoporous TiO2 powders. Appl. Catal. B Environ. 2007, 69, 171–180. [Google Scholar] [CrossRef]
- Puangpetch, T.; Sreethawong, T.; Yoshikawa, S.; Chavadej, S. Hydrogen production from photocatalytic water splitting over mesoporous-assembled SrTiO3 nanocrystal-based photocatalysts. J. Mol. Catal. A Chem. 2009, 312, 97–106. [Google Scholar] [CrossRef]
- Lin, H.Y.; Huang, H.C.; Wang, W.L. Preparation of mesoporous In–Nb mixed oxides and its application in photocatalytic water splitting for hydrogen production. Microporous Mesoporous Mater. 2008, 115, 568–575. [Google Scholar] [CrossRef]
- Won, D.; Hyun, H.; Jum, G.K.; Sang, S.J.; Sang, W.B.; Jae, M.J.; Lee, S. Photocatalytic decomposition of water–methanol solution over metal-doped layered perovskites under visible light irradiation. Catal. Today 2004, 93–95, 845–850. [Google Scholar]
- Xu, D.; Li, L.; Xia, T.; Fan, W.; Wang, F.; Bai, H.; Shi, W. Heterojunction composites of g-C3N4/KNbO3 enhanced photocatalytic properties for water splitting. Int. J. Hydrogen Energy 2018, 43, 16566–16572. [Google Scholar] [CrossRef]
- Chen, T.; Feng, Z.; Wu, G.; Shi, J.; Ma, G.; Ying, P.; Li, C.J. Mechanistic Studies of Photocatalytic Reaction of Methanol for Hydrogen Production on Pt/TiO2 by in situ Fourier Transform IR and Time-Resolved IR Spectroscopy. J. Phys. Chem. C 2007, 111, 8005–8014. [Google Scholar] [CrossRef]
- Kecskés, T.; Raskó, J.; Kiss, J. FTIR and mass spectrometric studies on the interaction of formaldehyde with TiO2 supported Pt and Au catalysts. Appl. Catal. A 2004, 273, 55–62. [Google Scholar] [CrossRef]
- Granone, L.I.; Sieland, F.; Zheng, N.; Dillert, R.; Bahnemann, D.W. Photocatalytic conversion of biomass into valuable products: A meaningful approach? Green Chem. 2018, 20, 1169–1192. [Google Scholar] [CrossRef]


Publisher’s Note: MDPI stays neutral with regard to jurisdictional claims in published maps and institutional affiliations. |
© 2022 by the authors. Licensee MDPI, Basel, Switzerland. This article is an open access article distributed under the terms and conditions of the Creative Commons Attribution (CC BY) license (https://creativecommons.org/licenses/by/4.0/).