Abstract
Tourism Micro, Small, and Medium Enterprises (MSMEs) in underdeveloped regions play a crucial role in driving local economic development and sustaining the tourism ecosystem. Yet they face limitations in innovation capacity and organizational performance. This study aims to develop and test a green innovation model to improve MSME organizational performance and strengthen the tourism ecosystem in East Sumba Regency, Indonesia. This study employed a quantitative approach, collecting data through questionnaires from tourism MSMEs, which were analyzed using Partial Least Squares–Structural Equation Modeling (PLS-SEM). The results indicate that green innovation, represented by product value, technology, networking, marketing, and market demand, is positively and significantly associated with organizational performance, which, in turn, is positively associated with perceived ecosystem performance, as reflected in productivity and resilience. These findings support the view that the relationship between green innovation and perceived tourism ecosystem performance operates indirectly and is dependent on strengthening the operational and financial performance of MSMEs. The novelty of this study lies in integrating the empirical PLS-SEM model with an implementation approach, including the development of training modules and the digitalization of learning, in the context of 3T regions (Frontier, Outermost, and Underdeveloped). The limitations of this study include the use of data from a single time period; further research is recommended to use multi-period data to capture the dynamics of change better.
1. Introduction
Tourism is one of the fastest-growing economic sectors worldwide, contributing significantly to national GDP, employment, and foreign exchange earnings. Beyond its economic role, tourism also serves as a strategic instrument for cultural preservation and environmental awareness, particularly in destinations that rely on local community participation and sustainable resource management [1,2]. According to a report [3], the tourism sector contributed US$10.9 trillion to global GDP, or approximately 10% of the worldwide economy, in 2024. This figure includes the direct, indirect, and induced impacts of tourism sector activities. In many countries, including Indonesia, tourism has become one of the main drivers of economic growth at both the local and national levels [4]. In Indonesia, tourism contributed up to 4% to GDP in 2024 [5]. As an archipelagic country endowed with rich natural landscapes and diverse cultural heritage, Indonesia possesses enormous tourism potential. The diversity of attractions across regions ranging from natural scenery to cultural heritage creates unique destination characteristics that appeal to both domestic and international tourists, with different regions attracting different tourist segments based on their preferences and motivations [6,7].
In Indonesia, the tourism sector plays a strategic role in driving economic growth, particularly in remote and underdeveloped regions. East Sumba Regency is one of the regions with enormous tourism potential thanks to its stunning natural beauty and unique cultural richness [8,9]. This region is known for its pristine natural panorama, authentic cultural diversity, and well-preserved traditions. The beauty of exotic beaches, vast expanses of savanna, and traditional villages with megalithic heritage make East Sumba a unique and attractive tourist destination for both domestic and international visitors. Furthermore, tourism development in East Sumba is strengthened by the commitment of the local government and local communities to preserve and promote the region’s cultural richness and natural environment, which define the region’s identity [10]. Furthermore, East Sumba Regency is one of the 3T (Frontier, Outermost, and Underdeveloped) regions, which face limited infrastructure and market access. This condition makes research in this area particularly important for identifying a development approach that is adaptive, sustainable, and aligned with the community’s local characteristics [11].
Furthermore, East Sumba Regency in East Nusa Tenggara Province has significant potential for developing the Micro, Small, and Medium Enterprises (MSMEs) sector, particularly as a supporter of the growing tourism industry. The diversity of local products, such as ikat-woven fabrics, handicrafts, and agricultural, livestock, and fisheries products, offers significant opportunities for MSMEs to create products with added value and a distinctive regional identity. The stunning natural beauty and unique cultural richness are also major attractions for tourists, offering ample opportunities for MSMEs to provide tourism services such as accommodation, culinary delights, and tour guide services [12].
However, to realize this potential, local MSMEs (Micro, Small, and Medium Enterprises) need to actively participate and deliver to the fullest in providing a range of products and services that support the tourism sector. MSMEs in East Sumba Regency hold a strategic position as providers of craft products, culinary delights, and tourism support services. Most of these MSMEs operate on a small scale with limited resources. Despite this, the potential is substantial; however, many have not been able to exploit tourism market opportunities optimally. Some of the main challenges faced include limited access to technology, capital, and market information, as well as a lack of innovation in both product development and business processes [13].
The fundamental problem faced by MSMEs in East Sumba is the low level of innovation, which has implications for their performance and competitiveness within the tourism ecosystem. Many MSMEs still rely on conventional, inefficient production methods that cannot meet the increasingly dynamic needs of tourists. Furthermore, collaboration among MSMEs, local governments, and tourism industry players has not been optimally established, thereby hampering the development of an ecosystem that supports sustainable tourism. This finding aligns with studies [14,15] which show that MSMEs in the tourism sector in developing countries generally still face obstacles to adopting innovation due to limited technological knowledge and limited access to cross-sector collaboration. This condition indicates a research gap in the context of 3T regions, such as East Sumba, which has not yet been widely studied empirically to improve and support MSMEs in tourism.
Although prior studies on green innovation and MSME sustainability have extensively examined the direct effects of innovation on firm performance or environmental outcomes, existing models remain conceptually limited in explaining how green innovation operates within tourism-based MSMEs as part of a wider ecosystem, particularly in 3T regions. Most previous research treats green innovation either as an isolated firm-level capability or as a direct driver of sustainability outcomes, without explicitly modelling the internal transformation process through which innovation is translated into organizational capabilities and subsequently scaled into ecosystem-level performance. As a result, the role of organizational performance is often under-theorized and implicitly assumed, rather than conceptually positioned as a central mechanism. This limitation becomes critical in tourism and 3T contexts, where structural constraints, limited resources, weak institutional support, and fragmented stakeholder coordination mean that green innovation alone is insufficient to generate systemic productivity and resilience. Consequently, what is conceptually missing in prior models is an integrated framework that explains green innovation as a staged capability-building process—one that first strengthens MSMEs’ operational and financial performance before producing measurable impacts at the tourism ecosystem level.
To address these issues, green innovation is necessary to improve performance and the MSME ecosystem. Green innovation encompasses various forms, including products, production processes, marketing strategies, and business models that are more efficient and better adapted to market needs [16,17]. The implementation of these innovations results in improved business-level performance through efficient use of materials, energy, and water; reduced defects and cycle times; and consistent service quality. The accumulation of improvements across many MSMEs strengthens the tourism ecosystem through three main aspects: more stable local supply productivity, and collaborative resilience between actors in the face of demand or supply shocks [18,19].
Building on this gap, this study conceptually develops a new green innovation model by explicitly positioning Organizational Performance as a central mediating mechanism between Green Innovation and Ecosystem Performance in the context of tourism MSMEs. Unlike prior models that treat ecosystem outcomes as a direct consequence of innovation, the proposed framework explains that, in 3T regions, green innovation must first be internalized into MSMEs’ operational and financial capabilities before it can generate productivity and resilience at the ecosystem level. This mediation-based structure represents a theoretical advancement over existing green innovation and MSME sustainability models, particularly for tourism systems operating under infrastructural, market, and capability constraints.
The success of green innovation implementation is influenced by several factors, including access to environmentally friendly technology and information, training programs and capacity-building for business actors, and government and relevant stakeholder support. In addition, partnerships between MSMEs and tourism industry players can create positive synergies in the production of high-quality, sustainability-oriented products and services. Based on the background described, the research problem is formulated as follows:
- How does the implementation of green innovation impact the performance and competitiveness of MSMEs in the tourism sector?
- What are effective green innovation development strategies to strengthen the performance of MSMEs in East Sumba Regency and support the creation of a sustainable tourism ecosystem?
In the context of community-based tourism development in East Sumba Regency, MSMEs play a strategic role as the primary drivers of economic value creation, local cultural preservation, and environmental sustainability. However, tourism MSMEs in this region still face various limitations, such as low product added value, limited technology adoption, weak business networks, and a lack of understanding of the dynamics of tourism market demand, which is increasingly oriented towards sustainability. These conditions contribute to the low performance and competitiveness of MSMEs, resulting in the underutilization of their tourism potential.
In line with these challenges, a green innovation approach is deemed relevant to improve the performance of tourism MSMEs while supporting the creation of a sustainable tourism ecosystem. However, empirical studies integrating the role of green innovation in improving MSME performance and its implications for the tourism ecosystem, particularly in 3T areas such as East Sumba, remain relatively limited. Therefore, this research aims to analyze the impact of green innovation implementation on the performance and competitiveness of tourism MSMEs, and to formulate effective, context-specific green innovation development strategies to strengthen MSMEs’ role in supporting the sustainability of the regional tourism ecosystem. Through this approach, MSMEs can take a greater role in improving the quality and attractiveness of local tourist destinations, thereby making a real contribution to regional economic growth [20]. Furthermore, this research supports the achievement of the Sustainable Development Goals (SDGs), which are targeted for 2030 and beyond, especially in poverty alleviation, increasing the community’s economic welfare, and environmental preservation.
2. Literature Review and Hypothesis Development
Improving the performance of organizations operating in the tourism sector is crucial to supporting a tourism ecosystem that focuses not only on achieving economic goals but also on socio-cultural and environmental aspects. This study developed a research model consisting of three main constructs: green innovation, organizational performance, and ecosystem performance. The definitions of each construct are presented in Table 1.

Table 1.
Definition of Research Construct.
The relationships between the constructs in this study are illustrated in Figure 1. To strengthen the theoretical foundation, this study adopts the Resource-Based View (RBV), which emphasizes that sustainable competitive advantage originates from internal resources and capabilities that are valuable, rare, difficult to imitate, and embedded within organizational processes. Within this framework, green innovation is conceptualized not merely as an environmental practice, but as a strategic internal capability encompassing product value development, technological adoption, networking, marketing, and responsiveness to market demand sustainably. Prior studies emphasize that green innovation functions as a strategic resource that enables firms to simultaneously enhance operational and financial performance, thereby directly contributing to organizational performance [20,31].
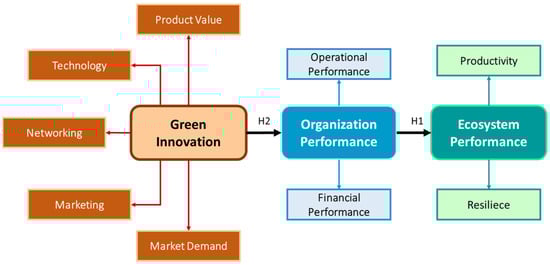
Figure 1.
Research Model Elaboration Scheme (source: self-produced).
In line with the RBV logic, organizational performance in this study is positioned as an explicit intervening transformation mechanism that explains the staged and sequential causal process through which green innovation is positively associated with ecosystem performance, rather than being assumed as a direct and automatic outcome. This specification related to the conceptual transparency of the model by clarifying that firm-level innovation must first be internalized into operational and financial capabilities before scaling into ecosystem-level outcomes. In the context of tourism MSMEs in East Sumba Regency, green innovation represented through the dimensions of product value, technology, networking, marketing, and market demand is treated as a strategic internal capability that enables improvements in operational and financial performance. This intervening role reflects empirical conditions in the field, where tourism MSMEs in 3T regions must first strengthen basic operational efficiency and financial viability before their innovation efforts can generate broader ecosystem-level outcomes.
However, particularly in the tourism sector, firms, especially MSMEs, do not operate in isolation. Innovation activities and organizational performance unfold within interconnected networks of actors, where learning processes, collaboration, and knowledge transfer occur across organizational boundaries. Tourism literature indicates that the innovation capabilities and performance of one firm can influence others through mechanisms of collaboration, networking, and functional interdependence within tourism destinations [14]. Accordingly, organizational performance serves as a conduit through which firm-level capabilities generate spillover effects across the destination ecosystem, making it a critical element in shaping the dynamics and overall quality of the tourism ecosystem.
Consistent with the extension of RBV through the dynamic capability perspective, the impact of internal green capabilities on broader outcomes is not always direct. Empirical studies on tourism MSMEs demonstrate that environmentally oriented internal capabilities must first be translated into improved organizational performance both operational and financial before generating wider ecosystem-level impacts. In this regard, organizational performance functions as a mediating mechanism that bridges firm-level green innovation and more macro-level outcomes [31].
Furthermore, ecosystem performance in this study refers to MSMEs’ perceptual evaluation of ecosystem productivity and resilience, rather than an objective aggregation of destination-level performance indicators. Productivity and resilience at the ecosystem level evolve through the collective contributions of firms involved, with MSMEs serving as dominant actors in many tourism destinations. Accordingly, improvements in organizational performance at the firm level are expected to cumulatively enhance ecosystem productivity and resilience [29].
Taken together, this study positions organizational performance as the conceptual link between RBV and the ecosystem perspective, thereby extending the traditional RBV logic from firm-level competitive advantage toward value creation at the ecosystem level. This approach is consistent with contemporary strategic management perspectives, which emphasize that firm capabilities and competitive advantage operate within broader institutional and ecosystem contexts, and are both shaped by and shaping interactions among multiple actors within the system [32]. Thus, RBV provides a coherent theoretical basis for explaining the staged mechanism through which green innovation contributes to organizational and ecosystem performance, and for formulating the hypotheses in this study.
2.1. Variable Elaboration
2.1.1. Ecosystem Performance
In this study, ecosystem performance refers to MSMEs’ perceived assessment of tourism ecosystem productivity and resilience as experienced through their business operations. Rather than representing an objective destination-level indicator, this construct captures how embedded MSMEs evaluate ecosystem conditions within which they operate [27,29,30]. Productivity reflects MSMEs’ perceived ability to generate competitive, efficient, and value-added outputs within the tourism ecosystem context. In the weaving industry, productivity is influenced by factors such as the efficiency of tools and the quality of raw materials. For example, yarn quality and preparation treatments affect durability during the weaving process, thereby influencing production performance. The adoption of green technologies and digital innovation may enhance MSMEs’ operational efficiency and is associated with improved perceptions of sustainable performance within the tourism ecosystem context [33]. Resilience refers to MSMEs’ perceived ability to withstand, adapt to, and recover from external disruptions such as economic instability, pandemics, or market fluctuations. MSMEs’ perceived resilience may also be enhanced through effective human resource management practices, including training and development, which enhance employee commitment and organizational adaptability [34]. In this study, resilience is understood as a firm-level perceptual evaluation of stability and adaptability within the broader tourism system [34].
2.1.2. Organizational Performance
Organizational performance in this study is defined as the level of organizational success related to operational effectiveness and sustainable goal achievement. This variable uses two dimensions: financial performance and operational performance. Financial performance reflects an organization’s ability to generate profits, increase revenue, and maintain economic stability. Meanwhile, operational performance describes an organization’s ability to improve process efficiency, productivity, and service quality [21,24,25].
2.1.3. Green Innovation
In this study, green innovation refers to the development and implementation of environmentally friendly services, products, processes, or business practices to increase economic value and operational efficiency and to reduce negative environmental impacts. Green innovation encompasses product value, technology, networking, marketing, and market demand. Product value emphasizes MSMEs’ ability to create or modify products to add value through environmentally friendly features. Technology refers to the use of technology to efficiently meet production needs, while reducing waste and pollution to support green innovation. The networking dimension describes the extent to which MSMEs build collaborative networks with various parties to implement green innovation. The marketing dimension reflects the implementation of company strategies in detecting market needs and desires that emphasize the value of sustainability. Meanwhile, market demand underscores MSMEs’ ability to understand and respond to market demand for environmentally friendly products and services [17,21,22,23].
In this study, green innovation is conceptualized as a multidimensional strategic capability rather than merely a single technological practice. Consistent with the Resource-Based View (RBV), green innovation is understood as a configuration of the internal and relational capabilities that enable tourism MSMEs to create sustainable value under conditions of limited resources, infrastructural constraints, and weak institutional support. Albort-Morant et al. (2018) demonstrate that in small firms, green innovation more commonly emerges through capability-based adaptations rather than radical, technology-intensive innovations [35]. Similarly, El-Kassar and Singh (2017) show that the organizational performance effects of green innovation in SMEs are driven more strongly by non-technological capabilities such as marketing, managerial commitment, and organizational learning than by the adoption of complex environmental technologies [36].
Accordingly, this study operationalizes green innovation through five complementary dimensions, namely Product Value, Technology, Networking, Marketing, and Market Demand. The Product Value dimension reflects MSMEs’ ability to embed environmental and cultural attributes into tourism products as a source of differentiation and sustainable value creation with relatively low capital requirements, as evidenced [37,38]. The Technology dimension represents the adoption of appropriate-scale, environmentally friendly technologies and processes to improve efficiency and reduce environmental impact, with an emphasis on contextual suitability rather than technological sophistication [35].
The Networking dimension is positioned as a particularly critical green innovation capability in resource-constrained contexts, as collaborative networks enable MSMEs to access knowledge, environmentally friendly practices, and innovation support that they cannot generate internally. Lopes et al. (2021) show that inter-organizational collaboration and knowledge transfer through networks are key drivers of innovation among tourism SMEs [14]. Furthermore, Marketing reflects MSMEs’ capability to communicate sustainability values and environmental narratives to tourists, which has been shown to play an important role in translating green practices into market performance [36]. Finally, Market Demand captures MSMEs’ capability to sense and respond to the growing preference for environmentally responsible tourism products, which empirically shapes the direction and intensity of green innovation [39].
Overall, these five dimensions form a conceptually distinct and comprehensive representation of green innovation for tourism MSMEs operating in resource-constrained destinations. Rather than treating green innovation as a purely technological construct, this configuration-based approach reflects the prevailing view in the innovation and sustainable tourism literature that green innovation in small firms emerges through the interaction of product differentiation, relational capabilities, market responsiveness, and context-appropriate technology adoption.
2.2. Hypothesis Development
2.2.1. Organizational Performance and Ecosystem Performance
From a theoretical perspective, organizational performance plays a central role in shaping ecosystem performance, particularly in systems dominated by small- and medium-sized enterprises. Drawing on the Resource-Based View (RBV), Organizations with strong operational and financial performance are generally better positioned to deploy internal capabilities, sustain collaboration, and adapt to environmental and market changes. In the context of this study, MSMEs that report higher levels of organizational performance also tend to report more favorable perceptions of ecosystem productivity and resilience as experienced through their business operations. While this study does not measure objective ecosystem-level indicators, the findings indicate a positive statistical association between organizational performance and MSMEs’ perceived ecosystem productivity and resilience within the tourism context.
In the context of tourism destinations in 3T regions, such as East Sumba Regency, ecosystem performance is highly dependent on the collective performance of local MSMEs. Organizations that demonstrate strong performance tend to be more adaptive, innovative, and effective in managing limited resources, which enables them to contribute positively to economic stability, social cohesion, and environmental sustainability at the ecosystem level. Prior studies support this theoretical reasoning. Li et al. (2023) [29] emphasize that ecosystem sustainability requires active collaboration among well-performing organizations. Arias-Pérez et al. (2024) [40] show that organizations with strong innovation performance enhance ecosystem collaboration and collective productivity, while De et al. (2024) [30] highlight the role of organizational strength in fostering ecosystem resilience and socio-economic stability. These findings reinforce the theoretical expectation that organizational performance is statistically associated with MSMEs’ perceived ecosystem performance. Based on the RBV perspective, organizational performance represents a firm-level capability that enables value creation beyond organizational boundaries, providing a theoretical basis for its statistical association with MSMEs’ perceived ecosystem performance.
Thus, the following hypothesis regarding cleaner production is formulated:
Hypothesis 1 (H1):
Organizational performance is positively associated with ecosystem performance.
2.2.2. Green Innovation and Organizational Performance
From the perspective of the Resource-Based View (RBV), organizational performance is driven by a firm’s ability to develop and deploy internal resources and capabilities that are valuable, rare, difficult to imitate, and non-substitutable. In this context, green innovation can be conceptualized as a strategic internal capability, as it encompasses environmentally efficient products, processes, and managerial practices that enhance resource utilization, cost efficiency, and market responsiveness. For MSMEs operating in the tourism sector, green innovation enables firms to reduce operational inefficiencies, improve process effectiveness, and strengthen financial performance through sustainable value creation.
In tourism MSMEs located in 3T regions, such as East Sumba Regency, external support systems, infrastructure, and market access are often limited. Under these conditions, organizational performance depends heavily on internally embedded innovation capabilities rather than external competitive advantages. Green innovation allows MSMEs to optimize the use of local resources, adapt products and services to sustainability-oriented tourist demand, and improve operational and financial stability. Through this mechanism, green innovation contributes directly to enhanced organizational performance by strengthening both operational effectiveness and financial outcomes.
Empirical evidence supports this theoretical argument. Achmad et al. (2025) [21] found that green innovation is positively associated with organizational performance among Batik SMEs in Indonesia. Ahmed et al. (2022) [22], in their study of the Pakistani textile industry, demonstrated that green product and process innovation significantly improve both organizational and environmental performance. Similarly, Rumanti et al. (2022) [41] showed that innovation initiatives undertaken by SMEs, particularly during the COVID-19 pandemic, contributed to improvements in financial and operational performance. These findings reinforce the theoretical expectation derived from RBV that green innovation functions as a critical internal capability for enhancing organizational performance [21,22,41]. From a theoretical standpoint, RBV explains that green innovation functions as a strategic internal capability that must first enhance organizational performance before firms can sustain competitiveness and stability, particularly in resource-constrained tourism contexts.
Thus, the following hypothesis regarding organizational performance is formulated:
Hypothesis 2 (H2):
Green innovation is positively associated with organizational performance.
3. Methodology
3.1. Instrument Development
In this study, a questionnaire was used as the survey instrument to collect empirical data for testing the proposed research model. The questionnaire was divided into two main parts. The first part contained questions related to respondents’ demographic and business characteristics, while the second part consisted of measurement items representing the constructs examined in this study. An in-depth review of the relevant literature served as the basis for selecting and adapting all questionnaire items. The complete list of indicators and measurement items used in this study is provided in Appendix A.
In this study, the ecosystem performance construct comprises a productivity dimension measured by five items, and a resilience dimension, measured by five items [26,27,42]. Ecosystem performance captures MSMEs’ perceived assessment of the tourism ecosystem’s productivity and resilience to external pressures, reflecting how MSMEs, as embedded actors within the destination, experience and evaluate ecosystem-level outcomes through their business activities. This study defines organizational performance as a multidimensional construct consisting of financial and operational performance dimensions. Five items measure economic performance, while five items measure operational performance. The items used to measure these two dimensions are adapted from Rumanti et al. (2022) [41] and Achmad and Wiratmadja (2025) [21]. Finally, the items used to measure green innovation are adapted from Rumanti et al. (2024) [17]. Green innovation is a multidimensional construct that assesses MSMEs’ ability to create, develop, and implement environmentally friendly services, products, processes, or business practices to increase economic value and operational efficiency, and to reduce negative environmental impacts. Product values, technology, networking, marketing, and market demand form this construct. All items in the questionnaire are measured using a 6-point Likert scale ranging from 1 for “strongly disagree” to 6 for “strongly agree”.
3.2. Sample and Data Collection
Sampling in this study was conducted using a non-probability sampling method through a purposive sampling technique. This technique was chosen to ensure that participating respondents met certain criteria relevant to the focus and objectives of the study. Data collection was conducted by distributing questionnaires directly to business actors in the tourism sector categorized as micro, small, and medium enterprises (MSMEs) in East Sumba Regency, East Nusa Tenggara (NTT) Province. This region was selected because it has significant potential in nature- and culture-based tourism and demonstrates a strong commitment to sustainable tourism development, thus being deemed appropriate for the context of this study. Figure 2 shows the locations of the regions used as sampling areas. The MSMEs involved in this study represent various subsectors within Indonesia’s creative tourism economy and play an active role in supporting the sector’s growth.
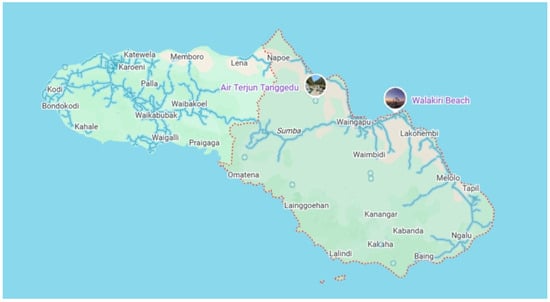
Figure 2.
Location of the selected sampling area (East Sumba Regency). Red dashed line: administrative boundary (source: self-produced).
The MSMEs participating in this study possess direct knowledge and experience of the tourism industry’s dynamics, including how to address various challenges and capitalize on existing opportunities. Each sector plays a strategic role in supporting sustainable tourism. The contributions of these different sectors provide a more comprehensive picture of the dynamics of the tourism industry and the implementation of sustainability practices in the field. Despite differences in the types of products and services offered, all sectors play a role in strengthening the principles of sustainable tourism. For example, MSMEs in the accommodation and transportation sectors can establish strategic partnerships with hospitality industry players, such as hotels and resorts. Such collaborations have the potential to create integrated tourism packages that not only enhance the quality of the tourist experience but also reduce the carbon footprint through more efficient transportation and the implementation of environmentally friendly practices in accommodation facilities. The research location was selected based on the region’s diverse potential for tourism, including natural, artificial, and cultural attractions. Data collection was conducted between June and July 2025. Of the 185 questionnaires distributed, 119 were returned and declared valid by MSME respondents in tourist villages. Thus, the valid response rate in this study was 64.32%, which served as the basis for analyzing the research data.
3.3. Data Analysis
This study consists of three constructs: green innovation, organizational performance, and ecosystem performance. To analyze the relationships between variables in the designed research model, the Partial Least Squares-Structural Equation Modeling (PLS-SEM) method was used as an analytical tool. This method is included in the variance-based Structural Equation Modeling (SEM) approach. Partial Least Squares Structural Equation Modeling (PLS-SEM) was employed in this study due to its strong suitability for prediction-oriented and exploratory research, particularly in contexts where theoretical development is still evolving. In this study, the primary objective is not only theory confirmation, but also to explain and maximize the variance (R2) of organizational performance and ecosystem performance among tourism MSMEs operating in an under-researched 3T region. Given the limited empirical evidence and contextual specificity of tourism MSMEs in peripheral regions, a prediction-focused analytical approach is considered more appropriate than a purely confirmatory modeling strategy. The proposed research model exhibits a high level of structural complexity, encompassing three primary latent constructs Green Innovation, Organizational Performance, and Ecosystem Performance each operationalized as second-order constructs with multiple dimensions, as well as a mediation structure (GI → OP → EP). While the overall research design is exploratory and prediction-oriented, the latent constructs are specified reflectively, as they are conceptualized as underlying theoretical phenomena that manifest through their observed indicators rather than being formed by them. PLS-SEM is well established as an appropriate analytical approach for estimating hierarchical component models and complex mediation relationships, allowing the simultaneous estimation of multiple relationships with a clear emphasis on variance explanation and predictive accuracy, even when the sample size is relatively limited. Furthermore, this study is conducted in a specific applied context characterized by MSMEs, limited resources, and heterogeneous operational conditions in East Sumba Regency. In such settings, PLS-SEM provides greater flexibility and practical robustness for model estimation and interpretation compared to covariance-based SEM, which is more suitable for confirmatory testing of well-established theories. Accordingly, the analysis prioritizes the model’s explanatory power and predictive capability, as reflected by explained variance (R2), rather than relying solely on global goodness-of-fit indices [43,44].
In general, SEM consists of two main components: the measurement model, which explains the relationships between latent constructs and their indicators, and the structural model, which describes the relationships among latent constructs. In SEM, three measurement models can be used to represent latent variables: the standard factor model (reflective measurement), the composite model, and the causal-indicator model (formative measurement) [45,46]. The standard factor model posits that each observed dimension is the result of an underlying latent construct. Thus, these dimensions can be replaced or even deleted without altering the construct’s basic meaning. In contrast, the composite model emphasizes that there is a definitional relationship between the construct and its dimensions, so that replacing or deleting dimensions must be done carefully, as it can affect the meaning of the construct as a whole [43]. Based on the similarity in the characteristics of the relationships between dimensions and constructs, this study categorizes the constructs as common factors or reflective measurement models. According to Hair et al. (2022) [44], reflective dimensions are seen as representations of underlying latent constructs, where each dimension reflects the same aspect of the construct’s domain. Therefore, reflective measurement assumes a consistent relationship between dimensions, as they all originate from the same conceptual domain. In this context, each dimension can be substituted or removed without altering the construct’s basic meaning, provided the construct’s reliability is maintained [44].
Although Yuan et al.’s (2020) [47] study suggested that constructs with common factor characteristics are more appropriately analyzed using covariance-based SEM (CB-SEM), there are several reasons supporting the selection of PLS-SEM in this study. First, although PLS-SEM, as part of variance-based SEM, is based on the logic of a composite model, it can still accommodate various measurement models, including composite, common factor, and causal-formative [48]. Furthermore, Yuan et al. (2024) [49] study showed that applying PLS-SEM to estimate the standard factor model yields only a trim level of bias, so the use of PLS-SEM remains acceptable when reflective and standard factor models are used to represent the construct [47]. Second, given this research model’s large number of dimensions and constructs, including several second-order constructs that add complexity, PLS-SEM is considered an efficient and appropriate method for analyzing high-complexity models [47].
Broadly speaking, the SEM-PLS method consists of two main stages: measurement model assessment and structural model assessment. The measurement model assessment stage ensures that the model used has adequate validity and reliability. Meanwhile, the structural model assessment is conducted to test the structural relationships formulated in the research model. In this study, the SEM-PLS analysis was performed using Mode A in SmartPLS, as the constructs are reflective [44]. The measurement model assessment process includes testing indicator loadings, average variance extracted (AVE), internal consistency, and discriminant validity. The loading value for each dimension must indicate that the construct can explain more than 50 percent of the dimension’s variance, or in other words, the AVE value must exceed 0.5. Internal consistency reliability can be evaluated using composite reliability or Cronbach’s alpha, with a recommended minimum of 0.7 [41]. The discriminant validity test was conducted using the Fornell–Larcker criteria to ensure clear distinctions among constructs. After the measurement model is declared to meet the validity and reliability criteria, the next stage is the structural model evaluation. This stage involves several statistical measures, including the coefficient of determination (R2), the blindfolding-based cross-validated redundancy measure (Q2), and the significance and relevance of path coefficients. Furthermore, the Variance Inflation Factor (VIF) is examined to detect potential collinearity between variables, which must be confirmed before conducting structural analysis to avoid bias in the regression results [44]. The unit of analysis in this study is the individual MSME. Accordingly, ecosystem performance is operationalized as a perceptual firm-level construct reflecting how embedded actors evaluate ecosystem productivity and resilience within their operational context. This study does not seek to measure objective destination-level ecosystem performance nor to aggregate firm-level data into system-level indicators. Therefore, all interpretations are confined to the perceptual level of MSME respondents.
4. Results
This study explicitly analyzes how Green Innovation (GI), measured through a series of dimensions representing product value, technology, networking, marketing, and market demand, contributes to increased Organizational Performance (OP), which is also measured through financial and operational performance. Furthermore, this study empirically examines how this increased OP impacts Ecosystem Performance (EP), as measured through the productivity and resilience dimensions of the MSME tourism ecosystem in East Sumba Regency. Therefore, the analysis of the results not only examines the relationships between latent variables but also evaluates how strongly each dimension reflects the constructs of GI, OP, and EP.
The Partial Least Squares–Structural Equation Modeling (PLS-SEM) method was used because the research model contains latent constructs measured across multiple dimensions and aims to produce a predictive model appropriate to the empirical context of MSMEs in the 3T regions. This method was chosen because it can handle data characteristics commonly encountered in the field, including limited sample sizes, non-normal distributions, and the complexity of constructs with multiple measurement dimensions. Therefore, the research results are presented in two main stages. The first stage is the evaluation of the measurement model, which aims to ensure that all dimensions used are truly valid and reliable in reflecting the latent constructs. In this stage, the GI, OP, and EP dimensions are tested using factor loadings, Cronbach’s alpha, Composite Reliability, and Average Variance Extracted (AVE). This evaluation ensures that the dimensions have adequate representation of their parent constructs and meet quality standards in SEM measurement.
The second stage is the evaluation of the structural model, which focuses on testing the hypothesized structural relationships between GI → OP and OP → EP. This stage analyzes the path coefficient, its significance level, the amount of variance explained by the model (R2), the effect size (f2), and the model’s predictive relevance (Q2). This stage also includes examining VIF values to ensure there is no multicollinearity between dimensions that could compromise the accuracy of structural relationship estimates.
Overall, the evaluation results of the two stages provide a strong empirical picture of how the implementation of GI dimensions, ranging from the use of environmentally friendly technologies, increasing product value, strengthening networks, sustainable marketing strategies, and responding to market needs, contribute to improving the financial and operational performance of MSMEs. Detailed results from the measurement model testing are presented in the next subsection, followed by an analysis of the structural model and an interpretation of the relationships among latent variables based on empirical data.
4.1. Measurement Model
The measurement model evaluation stage is conducted to ensure that each dimension used in the study adequately reflects the latent construct it measures. In the PLS-SEM approach, measurement model testing is performed using several key criteria: dimensional reliability, internal reliability, and convergent validity. Internal reliability is generally evaluated using Cronbach’s Alpha and Composite Reliability (CR). At the same time, convergent validity is assessed using the Average Variance Extracted (AVE), which indicates the proportion of variance in the indicators explained by the latent construct.
A good measurement model must meet three essential criteria: Cronbach’s Alpha and Composite Reliability values above 0.70, indicating strong internal consistency; an AVE value exceeding 0.50, indicating that more than half of the dimensional variance is explained by the latent construct; and the dimensions within each construct have adequate fit to reflect the construct accurately. To assess this, Table 2 below presents the Cronbach’s Alpha, Composite Reliability, and AVE values for all research constructs.
Table 2.
Composite Reliability Value and AVE.
The measurement model assessment results presented in Table 2 indicate that all constructs in this study demonstrate strong reliability and convergent validity, providing a robust foundation for subsequent structural model analysis. All constructs meet the recommended thresholds, with Cronbach’s Alpha values exceeding 0.70, Composite Reliability (CR) values above 0.85, and Average Variance Extracted (AVE) values greater than 0.50, confirming adequate internal consistency and construct convergence.
The Ecosystem Performance (EP) construct exhibits excellent measurement quality, with a Cronbach’s Alpha of 0.887, a Composite Reliability of 0.914, and an AVE of 0.722. EP is operationalized through two dimensions, namely productivity (PD) and resilience (RS), both of which show very strong measurement properties. The productivity dimension demonstrates a Cronbach’s Alpha of 0.906, a CR of 0.927, and an AVE of 0.718, indicating that this dimension reliably captures MSMEs’ ability to maintain efficient production processes, ensure supply continuity, and sustain output levels under fluctuating tourism demand. Meanwhile, ecosystem resilience shows similarly strong results, with a Cronbach’s Alpha of 0.908, a CR of 0.932, and an AVE of 0.732, reflecting the capacity of tourism MSMEs in East Sumba to adapt to environmental pressures, market uncertainty, and external disruptions. Together, these dimensions consistently represent the broader ecosystem performance construct.
The Organizational Performance (OP) construct also demonstrates outstanding measurement performance, as indicated by a Cronbach’s Alpha of 0.870, a Composite Reliability of 0.885, and a notably high AVE of 0.852, suggesting that the indicators explain a substantial proportion of construct variance. OP is reflected through financial performance (FP) and operational performance (OF). Financial performance shows very strong reliability and validity, with a Cronbach’s Alpha of 0.910, a CR of 0.933, and an AVE of 0.735, indicating consistent measurement of revenue growth, profitability, and financial stability among tourism MSMEs. Operational performance also exhibits robust results, with a Cronbach’s Alpha of 0.896, a CR of 0.923, and an AVE of 0.707, reflecting MSMEs’ ability to maintain efficient operations, improve service quality, and respond effectively to customer needs. These results confirm that organizational performance is measured comprehensively and reliably in this model.
The Green Innovation (GI) construct, which serves as the core explanatory variable in this study, demonstrates strong measurement quality, with a Cronbach’s Alpha of 0.818, a Composite Reliability of 0.856, and an AVE of 0.709. GI is represented by five dimensions, product value (PV), technology (TC), networking (NW), marketing (MK), and market demand (MD), all of which satisfy recommended reliability and validity thresholds. Product value exhibits a Cronbach’s Alpha of 0.915, a CR of 0.936, and an AVE of 0.747, indicating a strong reflection of environmentally friendly product development, cultural value enhancement, and sustainable material usage. The technology dimension shows similarly strong performance, with a Cronbach’s Alpha of 0.912, a CR of 0.934, and an AVE of 0.741, capturing the adoption of eco-friendly technologies and digital support for sustainable production. Networking demonstrates reliable measurement with a Cronbach’s Alpha of 0.897, a CR of 0.924, and an AVE of 0.708, highlighting the importance of collaboration among MSMEs, government actors, cultural communities, and tourism stakeholders. Marketing presents a Cronbach’s Alpha of 0.903, a CR of 0.929, and an AVE of 0.721, indicating that sustainability-oriented marketing strategies are consistently perceived by respondents. Finally, market demand shows a Cronbach’s Alpha of 0.889, a CR of 0.919, and an AVE of 0.694, reflecting MSMEs’ responsiveness to shifting tourist preferences toward ethical, sustainable, and culturally meaningful products.
Overall, the measurement model results confirm that all constructs and their associated dimensions possess high internal consistency and strong convergent validity. The consistently high CR and AVE values indicate that the indicators effectively capture the underlying theoretical concepts of ecosystem performance, green innovation, and organizational performance within the context of tourism MSMEs in East Sumba. Consequently, the measurement model is deemed statistically sound and substantively meaningful, allowing the structural model analysis to be conducted with confidence that measurement quality does not compromise the interpretation of causal relationships in the PLS-SEM framework.
4.2. Structural Model
After confirming that all constructs in the measurement model satisfy the criteria for reliability and convergent validity, the next step is to assess the potential risk of multicollinearity among latent constructs and their dimensions. This assessment is essential in PLS-SEM analysis because high multicollinearity can distort path coefficient estimates, inflate error variance, and reduce parameter stability, ultimately leading to inaccurate structural model results. To address this issue, the Variance Inflation Factor (VIF) was employed to evaluate whether excessive correlations exist among interrelated variables in the model. A VIF value below the recommended threshold of 3.0 indicates that each dimension contributes uniquely to its corresponding construct and does not suffer from measurement redundancy. In this study, VIF testing was conducted comprehensively, covering not only the relationships between Green Innovation (GI) and its dimensions, but also the relationships between Organizational Performance (OP) and Ecosystem Performance (EP) and their respective constituent dimensions. This approach was adopted to ensure that the overall model structure demonstrates adequate measurement stability prior to structural model evaluation. The results of the VIF analysis are presented in Table 3, which illustrates how each dimension contributes independently to the construct it is intended to measure.
Table 3.
VIF Value.
After confirming that all constructs in the measurement model satisfy the criteria for reliability and convergent validity, the next step is to assess the potential risk of multicollinearity and common method bias within the structural model. This step is essential in PLS-SEM analysis because excessive multicollinearity may distort path coefficient estimates, inflate error variance, and reduce parameter stability, while common method bias may artificially strengthen observed relationships due to single-source data collection. To address these issues, the Variance Inflation Factor (VIF) was employed as a collinearity diagnostic tool to evaluate whether excessive correlations exist among latent constructs and their respective dimensions before hypothesis testing.
As reported in Table 3, all VIF values for the relationships between constructs and their dimensions, as well as for the main structural paths (Green Innovation → Organizational Performance and Organizational Performance → Ecosystem Performance), range from 1.054 to 1.807, which are well below the recommended threshold of 3.0–3.3. These results indicate the absence of multicollinearity in the model, confirming that each dimension forming the Green Innovation (GI), Organizational Performance (OP), and Ecosystem Performance (EP) constructs contributes unique and non-redundant information. Consequently, the estimated path coefficients can be interpreted reliably, as they are not biased by inflated correlations among predictor variables.
In addition, following the collinearity-based diagnostic approach proposed by Kock (2015) [50], low VIF values at the structural level also provide an initial indication regarding common method bias (CMB). Since all VIF values associated with the predictor constructs are substantially below the conservative threshold of 3.3, common method bias is unlikely to substantially inflate the estimated structural relationships in the proposed model. Therefore, the observed effects among green innovation, organizational performance, and ecosystem performance are considered to reflect substantive structural relationships rather than artifacts arising from the data collection method.
With the structural model shown to be free from multicollinearity concerns and unlikely to be affected by common method bias, the analysis proceeds to the evaluation of the hypothesized structural relationships using the bootstrapping procedure. This step estimates path coefficients, T-statistics, and significance levels to determine whether Green Innovation is positively related to Organizational Performance and whether Organizational Performance is positively and significantly associated with Ecosystem Performance within the tourism MSME context of East Sumba Regency. The detailed results of these hypothesis tests are presented in Table 4.
Table 4.
Significance of Structure Relationship.
The results reported in Table 4 confirm that both hypothesized structural relationships in the proposed model are statistically significant at the 0.01 level. Following the hypothesized structural specification linking green innovation, organizational performance, and ecosystem performance, the findings indicate a clear staged mechanism in which green innovation is positively associated with organizational performance, which in turn is statistically associated with MSMEs’ perceived ecosystem performance.
Hypothesis 2 (H2), which tests the effect of Green Innovation (GI) on Organizational Performance (OP), is strongly supported with a path coefficient of 0.794, a T-statistic of 24.06, and a significance value of 0.000. This positive and substantial coefficient suggests that improvements in green innovation reflected through product value, environmentally friendly technology, networking, sustainable marketing, and responsiveness to market demand are consistently associated with enhanced organizational outcomes. In practical terms, tourism MSMEs that intensify green innovation tend to achieve better operational effectiveness and financial strength, indicating that green innovation functions as a strategic capability that improves organizational competitiveness and performance.
Hypothesis 1 (H1), which examines the relationship between Organizational Performance (OP) and Ecosystem Performance (EP), is supported, with a path coefficient of 0.892, a T-statistic of 26.22, and a significance value of 0.000. These results indicate a strong positive statistical association between organizational performance and MSMEs’ perceived ecosystem performance.
More specifically, MSMEs that report stronger operational and financial performance also tend to report more favorable perceptions of ecosystem productivity and resilience within the tourism ecosystem context. This finding suggests that MSMEs’ perceived ecosystem performance is statistically associated with firm-level organizational performance, rather than representing an objective or independently measured system-level outcome. Accordingly, the interpretation of H1 is confined to structural associations among perceptual firm-level constructs.
Overall, the significance of both pathways provides strong empirical support for the proposed structural relationships: green innovation is positively related to organizational performance, which in turn improves ecosystem performance. This pattern aligns with the Resource-Based View (RBV) logic adopted in this study, suggesting that innovation-related capabilities create value when they are first converted into superior Organizational performance is statistically associated with higher perceived ecosystem-level outcomes. Accordingly, the next step is to assess the model’s explanatory strength by evaluating the coefficient of determination (R2) for endogenous constructs, as presented in the subsequent table.
The results presented in Table 5 indicate that the proposed PLS-SEM model demonstrates very strong explanatory and predictive capabilities across all endogenous constructs. The consistently high R2 and adjusted R2 values confirm that the relationships specified in the model are not only statistically meaningful but also substantively capable of explaining the empirical dynamics of green innovation, organizational performance, and ecosystem performance among tourism MSMEs in East Sumba Regency. The use of adjusted R2 values further confirms that the explanatory power of the model is not inflated by model complexity.
Table 5.
R2 Value.
The Ecosystem Performance (EP) construct exhibits an R2 value of 0.821 and an adjusted R2 of 0.819, indicating that Organizational Performance (OP) explains more than 82% of the variance in ecosystem performance. This substantial explanatory power suggests that changes in ecosystem-level outcomes—specifically productivity and resilience—are largely driven by the internal performance of MSMEs operating within the tourism ecosystem. In practical terms, MSMEs that achieve higher levels of financial stability and operational efficiency contribute directly to strengthening the tourism ecosystem’s capacity to produce value, adapt to change, and maintain service quality. This finding suggests that MSMEs’ perceived ecosystem performance reflects how firm-level performance improvements are experienced within the tourism system context.
The Organizational Performance (OP) construct also demonstrates a high level of explanatory strength, with an R2 value of 0.792 and an adjusted R2 of 0.790, showing that Green Innovation (GI) accounts for nearly 80% of the variance in organizational performance. This result indicates that green innovation is a dominant explanatory factor shaping MSMEs’ internal performance. More importantly, it suggests that the effects of green innovation are not isolated to environmental outcomes alone but are translated into tangible organizational benefits, including improved operational processes and stronger financial results. This finding reinforces the role of green innovation as a strategic capability that enables MSMEs to compete and survive in increasingly sustainability-oriented tourism markets.
High explanatory power is also observed at the dimensional level, further strengthening the robustness of the model. Within the Ecosystem Performance construct, the Productivity (PD) dimension achieves an R2 value of 0.756, while the Resilience (RS) dimension records a notably higher R2 value of 0.884. These results indicate that ecosystem performance is more strongly reflected in MSMEs’ resilience than in productivity alone. This implies that the ability of MSMEs to adapt to market fluctuations, environmental pressures, and external shocks plays a particularly critical role in sustaining tourism ecosystems in peripheral and vulnerable regions such as East Sumba.
For the Organizational Performance construct, both dimensions also show substantial explanatory power. Financial Performance (FP) records an R2 value of 0.781, while Operational Performance (OF) achieves an even higher R2 value of 0.847. These findings indicate that organizational performance improvements driven by green innovation are slightly more pronounced in operational efficiency than in financial outcomes. This pattern suggests that green innovation initiatives may first manifest in process optimization, service quality improvement, and cost efficiency, which subsequently contribute to improved financial performance over time.
The Green Innovation (GI) construct itself demonstrates a strong overall explanatory level, with an R2 value of 0.773 and an adjusted R2 of 0.771, indicating that its dimensions collectively provide a comprehensive representation of green innovation practices. At the dimensional level, Networking (NW) shows the highest explanatory power with an R2 of 0.885, followed by Market Demand (MD) at 0.856, and Technology (TC) at 0.836. These results suggest that collaborative networks, responsiveness to sustainability-oriented market demand, and the adoption of environmentally friendly technologies are the most influential elements shaping green innovation among tourism MSMEs. Meanwhile, Product Value (PV) and Marketing (MK) also demonstrate strong explanatory power, with R2 values of 0.810 and 0.821, respectively, indicating that environmentally differentiated products and sustainability-based marketing strategies remain essential components of green innovation, even if their influence is slightly more balanced compared to other dimensions.
Taken together, the R2 results in Table 5 confirm that the proposed model possesses high predictive accuracy without overfitting, as reflected by the close alignment between R2 and adjusted R2 values across all constructs. The model effectively captures how green innovation is statistically associated with organizational performance gains and how these gains subsequently scale up to influence ecosystem performance. Consequently, the explanatory strength of the model supports the consistency of the proposed theoretical structure and provides strong empirical evidence that strengthening green innovation capabilities is positively associated with improvements in organizational and ecosystem performance in tourism MSMEs located in 3T regions.
Figure 3 illustrates the structural model’s predictive performance by consolidating the core structural results path coefficients, t-values, p-values, and R2 into a single, integrated visual representation, thereby addressing the need for a streamlined and non-redundant presentation. The model exhibits strong explanatory power, as indicated by substantial path coefficients and high R2 values across the principal constructs. Within the Green Innovation (GI) construct, all dimensions; Product Value (PV), Technology (TC), Networking (NW), Marketing (MK), and Market Demand (MD) display strong and statistically significant contributions (p < 0.001). Rather than reiterating each coefficient individually, their collective strength confirms that green innovation is inherently multidimensional, driven by complementary product-, technology-, network-, and market-based capabilities.
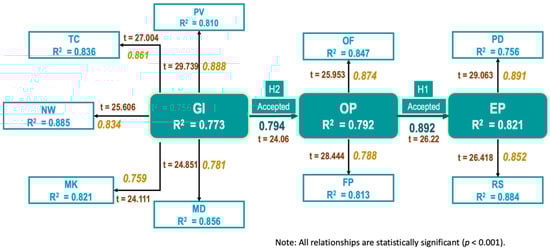
Figure 3.
Relationship significance in the structural model (source: self-produced).
At the inter-construct level, the GI → OP path (β = 0.794; p < 0.001) demonstrates a substantial and decisive effect, indicating that higher levels of green innovation translate directly into superior organizational performance. The corresponding R2 of 0.792 confirms that green innovation accounts for a dominant share of the variance in organizational performance, establishing GI as a primary strategic driver rather than a peripheral factor.
The OP → EP relationship exhibits the strongest effect in the model (β = 0.892; p < 0.001), showing that improvements in organizational performance are transmitted almost entirely to the ecosystem level. The R2 value of 0.821 indicates that organizational performance explains the majority of variance in ecosystem performance, particularly in terms of productivity and resilience. This result provides direct empirical evidence that firm-level efficiency and financial stability are transformed into ecosystem-level outcomes.
At the dimensional level of Ecosystem Performance (EP), Productivity (PD) emerges as the dominant reflective dimension, while Resilience (RS) also exhibits a strong and significant contribution. This configuration indicates that tourism ecosystem success is anchored in productive efficiency, yet remains critically supported by adaptive capacity an essential characteristic in structurally constrained 3T regions.
Overall, the relationships depicted in Figure 3 provide strong empirical support for the proposed sequential structural relationships, whereby green innovation is positively associated with organizational performance, which in turn is positively associated with ecosystem performance. By consolidating the essential statistical evidence within a single figure, the presentation eliminates redundant numerical repetition while preserving analytical rigor. These findings are fully consistent with the Resource-Based View (RBV), demonstrating how firm-level strategic capabilities are leveraged into sustained ecosystem-level performance. The subsequent analysis therefore focuses on direct and indirect effects to explicitly test the mediating role of Organizational Performance, with the corresponding results reported in Table 6.
Table 6.
Direct & Indirect Effect.
The results presented in Table 6 provide clear evidence regarding the direct and indirect effects among the core constructs in the proposed research model. Specifically, the analysis confirms the mediating role of Organizational Performance (OP) in the relationship between Green Innovation (GI) and Ecosystem Performance (EP), thereby clarifying the mechanism through which green innovation contributes to hypo.
The indirect effect of GI → OP → EP is substantial, with a coefficient of 0.855, indicating that green innovation exerts a strong influence on ecosystem performance through improvements in organizational performance. This result demonstrates that the benefits of green innovation are not realized instantaneously at the ecosystem level; rather, they are first translated into enhanced internal organizational capabilities, which subsequently generate broader ecosystem impacts. In this model, OP serves as a critical transmission mechanism that converts innovation-oriented practices into measurable ecosystem outcomes such as higher productivity and stronger resilience.
In addition to the indirect pathway, Table 6 also confirms the presence of strong direct effects within the structural model. The direct effect of Green Innovation on Organizational Performance (GI → OP) is 0.794, indicating that green innovation directly and substantially improves the financial and operational performance of tourism MSMEs. Likewise, the direct effect of Organizational Performance on Ecosystem Performance (OP → EP) is even stronger, with a coefficient of 0.892, highlighting OP as the most influential immediate driver of ecosystem performance in the model. These strong direct effects reinforce the central role of organizational performance as the key mechanism linking firm-level innovation to system-level sustainability.
Importantly, the absence of a direct GI → EP path in Table 6 further strengthens the interpretation of full mediation. This indicates that green innovation does not influence ecosystem performance independently but must first be internalized through organizational processes and outcomes. Such a structure suggests a structural association pattern, where green innovation is positively related to organizational performance, and only after this internal transformation do ecosystem-level benefits emerge. This finding adds theoretical clarity by demonstrating that higher levels of MSMEs’ perceived ecosystem performance, reflected in productivity and resilience are statistically associated not with innovation alone, but with the organizational capacity to operationalize and sustain those innovations.
Overall, the pattern of effects observed in Table 6 supports the proposed mediated structural relationships in the model, which operate in a sequential and process-based manner. The strong indirect effect highlights how green innovation amplifies its impact through organizational performance, while the strong direct OP → EP relationship emphasizes that ecosystem outcomes are ultimately shaped by the collective performance of individual MSMEs. These findings provide deeper insight into how sustainability-oriented transformation occurs in tourism MSMEs, particularly in 3T regions where ecosystem resilience depends heavily on the internal strength and adaptability of local actors.
Following the examination of relationships among the primary constructs, the next analytical step is to evaluate whether each endogenous construct is adequately represented by its corresponding dimensions. This assessment is essential to ensure that the dimensions forming each construct contribute significantly and consistently to their parent construct. Accordingly, Table 7 presents the significance of the relationships between Ecosystem Performance (EP) and its two dimensions, namely Productivity (PD) and Resilience (RS), to further validate the structural integrity of the measurement framework.
Table 7.
Relationship Significance for EP with its Dimension.
The results presented in Table 7 indicate that Ecosystem Performance (EP) is consistently and strongly reflected by its two underlying dimensions, namely Productivity (PD) and Resilience (RS). The relationship between EP and PD shows a high correlation value of 0.891, with a bootstrapped t-statistic of 29.063 (p < 0.001), indicating a strong and statistically significant association. Similarly, EP exhibits a strong relationship with RS, with a correlation value of 0.852 and a t-statistic of 26.418 (p < 0.001). These findings confirm that EP functions as a stable higher-order construct, in which both productivity and resilience contribute substantially to its measurement. The consistently high correlation values and large t-statistics suggest that ecosystem performance in tourism MSMEs is characterized not only by the ability to generate output efficiently but also by adaptive capacity and resilience in responding to environmental and market dynamics.
The subsequent evaluation assessed how OP is reflected by its two components: Financial Performance (FP) and Operational Performance (OF). These two aspects are important because they indicate how organizational performance is distributed between internal efficiency and financial achievement. Table 8 presents the significance of these relationships.
Table 8.
Relationship Significance for OP with its Dimension.
The results presented in Table 8 indicate that Organizational Performance (OP) is consistently and strongly reflected by its two underlying dimensions, namely Financial Performance (FP) and Operational Performance (OF). The relationship between OP and FP shows a high correlation value of 0.873, with a bootstrapped t-statistic of 28.444 (p < 0.001), indicating a strong and statistically significant association. Similarly, OP exhibits a strong relationship with OF, with a correlation value of 0.813 and a t-statistic of 25.953 (p < 0.001). These findings confirm that OP functions as a stable higher-order construct, with both financial and operational dimensions contributing substantially to its measurement.
To ensure that Green Innovation (GI) is fully represented by its constituent dimensions, the relationships between GI and each dimension were tested. This assessment is crucial because GI is a complex construct comprising five strategic aspects of innovation. Table 9 presents the results of the significance of these relationships.
Table 9.
Relationship Significance for GI with its Dimension.
The results presented in Table 9 show that all dimensions significantly contribute to the Green Innovation (GI) construct. Product Value (PV) demonstrates the strongest association with GI, with a correlation value of 0.888 (t = 29.739, p < 0.001), followed by Technology (TC) at 0.861 (t = 27.004, p < 0.001) and Networking (NW) at 0.834 (t = 25.606, p < 0.001). Marketing (MK) and Market Demand (MD) also exhibit strong and statistically significant relationships with GI, with correlation values of 0.759 (t = 24.111, p < 0.001) and 0.780 (t = 24.851, p < 0.001), respectively. Overall, these findings indicate that GI is a robust higher-order construct that is consistently reflected by its underlying dimensions. The results suggest that green innovation in MSMEs is not driven by a single aspect but rather by complementary contributions from product value, technological capability, networking, marketing strategies, and responsiveness to market demand.
To ensure a good fit of the PLS-SEM model, a model fit test was conducted using three dimensions: SRMR, NFI, and RMS Theta. These three dimensions indicate whether the model structure fits the empirical data. Table 10 displays the results of the model fit test.
Table 10.
Model of Fit Value.
Based on the results presented in Table 7, Table 8 and Table 9, the evaluation of second-order constructs confirms that all latent variables are adequately and consistently represented by their respective dimensions. All dimension–construct relationships are positive and statistically significant (p < 0.001), indicating strong convergent validity and supporting the hierarchical measurement structure used in this study. As shown in Table 7, Ecosystem Performance (EP) is robustly reflected by Productivity (PD) and Resilience (RS), confirming that ecosystem performance captures both the ability of tourism MSMEs to generate output efficiently and to adapt to environmental and market disruptions. Similarly, Table 8 demonstrates that Organizational Performance (OP) is strongly represented by Financial Performance (FP) and Operational Performance (OF), indicating that organizational success is jointly shaped by financial stability and operational effectiveness.
Furthermore, Table 9 shows that Green Innovation (GI) is comprehensively reflected by its five dimensions—Product Value, Technology, Networking, Marketing, and Market Demand—all of which load significantly on the higher-order construct. Taken together, Table 7, Table 8 and Table 9 confirm the validity of the second-order constructs without unnecessary repetition, indicating that green innovation, organizational performance, and ecosystem performance are multidimensional yet coherent constructs. To improve readability, the main text focuses on the substantive interpretation of these relationships, while detailed statistical values are provided in the corresponding tables.
Based on Table 10, the model fit assessment indicates an adequate overall model quality. The Standardized Root Mean Square Residual (SRMR) value of 0.0524 is well below the recommended threshold of 0.08, suggesting a satisfactory approximate model fit. The Normed Fit Index (NFI) value of 0.972 exceeds the recommended cutoff of 0.90, indicating a good comparative fit. Furthermore, the RMS Theta value of 0.004 is substantially lower than the suggested threshold of 0.12, reflecting a very low level of residual error in the measurement model. Consistent with PLS-SEM guidelines, these fit indices are interpreted as complementary diagnostics rather than strict model acceptance criteria. Taken together, the SRMR, NFI, and RMS Theta values suggest that the model exhibits acceptable measurement quality and is suitable for subsequent structural model evaluation and hypothesis testing.
The results presented in Table 11 indicate that Green Innovation (GI) exerts a large effect on Organizational Performance (OP), with an f2 value of 0.433, exceeding the threshold for a substantial effect. Furthermore, Organizational Performance (OP) shows a substantial effect on Ecosystem Performance (EP), with an f2 value of 0.387. These findings demonstrate that the main structural relationships in the model are not only statistically significant but also exhibit strong explanatory power in accounting for the variance of the endogenous constructs. To further assess the predictive capability of the model, a Q2 test was conducted using the blindfolding procedure. A Q2 value greater than zero indicates that the model has predictive relevance. The Q2 values for the endogenous constructs are reported in Table 12.
Table 11.
f2 Value.
Table 12.
Q2 Value.
The results in Table 12 show that Ecosystem Performance (EP) has a Q2 value of 0.347, indicating strong predictive ability for this variable. Meanwhile, OP and GI do not have Q2 values because they are non-predictor variables in the model. This Q2 value confirms that the model not only has good structural fit but also adequately predicts variance in the ecosystem construct.
5. Discussion
The results of this study indicate that green innovation plays a significant role in improving the organizational performance of MSMEs in tourism villages, and that this improvement in organizational performance is a key mediator in strengthening ecosystem performance. This finding suggests that green innovation is not automatically associated with systemic impacts, but instead requires a process of knowledge internalization, capability strengthening, and adequate organizational governance to translate innovation into operational performance and sustainable ecosystem impacts. Recent studies in the context of tourism and MSMEs also emphasize that the success of green innovation depends heavily on an organization’s ability to develop dynamic capabilities and integrate innovation into daily business practices [31,51].
More importantly, this study suggests that green innovation holds a particularly strategic role for tourism MSMEs in developing and underdeveloped regions, albeit with characteristics and underlying logic that differ fundamentally from those of large firms. In the context of MSMEs operating in 3T regions such as East Sumba Regency, green innovation cannot be understood merely as environmental compliance or the adoption of capital-intensive green technologies. Instead, green innovation functions as a strategic mechanism for coping with internal resource constraints. Tourism MSMEs in such regions typically face limitations in capital availability, technological infrastructure, and market access, leaving them with limited capacity to compete through economies of scale or cost leadership strategies. Consequently, green innovation becomes a viable pathway for creating non-price competitive advantages, particularly through culture-based product differentiation, efficient resource utilization, and sustainability narratives that resonate with environmentally conscious tourists. This explains why green innovation shows a strong positive association with organizational performance, as it enables MSMEs to enhance both operational efficiency and financial outcomes without requiring investments that exceed their absorptive capacity.
However, the findings also reveal that not all dimensions of green innovation contribute equally to performance improvement. Product value and market demand emerge as the most dominant dimensions, whereas technology and marketing exhibit relatively weaker effects. This variation reflects the structural realities faced by MSMEs in developing regions rather than weaknesses in green innovation itself. Innovation in product value is more accessible because it relies heavily on local knowledge, natural materials, and cultural assets, which do not require substantial technological investment. Similarly, increasing market demand for sustainable tourism products directly pressures MSMEs to adjust their offerings in line with tourists’ environmental and ethical preferences. In contrast, technology-based green innovation entails higher upfront costs, such as investments in environmentally friendly equipment, waste management systems, or digitalized production processes, which remain challenging for small-scale enterprises. As a result, the adoption of green innovation among MSMEs tends to be selective and incremental, shaped by trade-offs between cost, internal capability, and the immediacy of perceived benefits.
The prioritization and sequencing of training modules were directly derived from the PLS-SEM results, particularly the standardized path loadings (β) of each Green Innovation dimension. As shown in the structural model, Product Value (PV) exhibits the strongest contribution to Green Innovation (β = 0.888), followed by Market Demand Insight (MD) (β = 0.781). Accordingly, Module 1 (Product Value) and Module 4 (Market Demand Insight) were positioned as foundational interventions, as sustainability-based value creation and responsiveness to tourist preferences represent the most influential innovation pathways for tourism MSMEs. Although Technology (TC) also demonstrates a strong loading (β = 0.861), its implementation in Module 2 was deliberately focused on accessible and low-cost practices—such as waste management knowledge, shared facilities, and energy efficiency—rather than capital-intensive automation. Networking (NW) (β = 0.834) and Sustainable Marketing (MK) (β = 0.759) were incorporated as complementary modules, sequenced after the foundational dimensions to support collaboration and market communication once core innovation capabilities had been strengthened. This β-based prioritization ensures that the module design reflects the relative empirical importance of each dimension within the Green Innovation construct.
Another key contribution of this study lies in demonstrating that green innovation is not directly associated with ecosystem performance as perceived by MSMEs, but instead operates through organizational performance as a mediating mechanism. This finding highlights that innovation alone is insufficient to improve perceived ecosystem productivity and resilience when MSMEs lack efficient operational management and financial stability. In this sense, green innovation represents a source of potential value, while organizational performance functions as a mediating mechanism through which this potential is reflected in ecosystem-level outcomes as perceived by embedded MSMEs. MSMEs with weak operational efficiency and unstable financial structures may struggle to absorb and routinize innovation, thereby limiting its broader contribution to the tourism ecosystem. Accordingly, strengthening organizational performance becomes a critical prerequisite for enabling green innovation to generate meaningful and sustainable ecosystem outcomes.
From a strategic perspective, these findings imply that green innovation development for MSMEs in developing regions should be designed in a gradual and realistic manner. Effective innovation strategies should not begin with costly green technology adoption, but rather with strengthening product value, market understanding, and operational efficiency that align with MSMEs’ existing capacities. Only after organizational performance has been sufficiently strengthened can more technology-intensive and marketing-driven green innovations be implemented effectively. This perspective reinforces the argument that green innovation for MSMEs should be viewed not merely as an environmental objective, but as a contextual, adaptive performance-enhancement strategy that supports long-term competitiveness and ecosystem sustainability.
Based on these findings, the results of the PLS-SEM analysis in this study are used not only to confirm the relationships among variables, but also to inform the design of evidence-based capacity development interventions for MSMEs. This approach aligns with the international literature emphasizing that module-based interventions are an effective mechanism for transforming quantitative research findings into practices that can be internalized by MSMEs, particularly in the context of sustainable innovation and digital transformation [52]. Training modules enable a structured, gradual, and contextual learning process, allowing MSMEs to build specific capabilities systematically. This aligns with the finding that capability development in small businesses relies on practice-based learning mechanisms that are directed, iterative, and embedded in organizational routines [53,54], as well as on organizational learning processes that support the formation of dynamic capabilities [14]. To clarify how empirical PLS-SEM results are translated into practical interventions, this study developed a series of thematic learning modules that directly represent each dimension of green innovation and the mediating pathways of organizational performance toward ecosystem performance. The modules were systematically developed to ensure that each latent construct proven significant in the empirical model could be translated into operational capabilities that could be learned, practiced, and replicated by tourism village MSMEs. All training modules are in digital format and accessible via an online platform (https://bit.ly/GreenInnovationModule, accessed on 30 November 2025). This series of modules is designed as a unified, step-by-step learning process, starting with strengthening the value of green innovation products and processes and continuing to improve the overall performance of the organization and the tourism ecosystem.
The implementation component in this study is not presented as an ad hoc assertion, but as a structured translation of the PLS-SEM empirical results into an actionable capacity development framework. The design of the training modules was explicitly derived from the estimated path coefficients and measurement loadings of the research model. All dimensions and indicators that formed the Green Innovation (GI), Organizational Performance (OP), and Ecosystem Performance (EP) constructs were systematically translated into learning themes and practical activities. However, consistent with the logic of evidence-based intervention design, greater emphasis was placed on the two strongest structural relationships identified in the model, namely GI → OP (β = 0.794) and OP → EP (β = 0.892).
This prioritization reflects the empirical finding that improvements in ecosystem performance in tourism MSMEs are primarily realized through the strengthening of organizational performance as a mediating mechanism, rather than through direct innovation effects. Consequently, while all green innovation dimensions (Product Value, Technology, Networking, Market Demand Insight, and Sustainable Marketing) are included in the modules, the content depth, sequencing, and practical exercises were calibrated according to their relative contribution to organizational performance. For example, Product Value and Market Demand Insight identified as the strongest contributors to the GI construct were positioned as foundational modules, while technology- and marketing-related modules were designed as incremental capability enhancements aligned with MSMEs’ absorptive capacity in 3T regions.
Content validity of the modules was ensured through an iterative expert review and contextual alignment process. The module structure, learning objectives, and practical tools were reviewed by domain experts in tourism development, MSME management, and sustainability to ensure consistency between the empirical constructs, local context, and operational feasibility. In addition, informal pilot discussions with local MSME facilitators and tourism village stakeholders were used to assess clarity, relevance, and practical applicability of the module content, leading to refinements in terminology, examples, and activity design.
At this stage, the modules were positioned as an evidence-based implementation proposal directly grounded in the empirical findings, rather than as a fully evaluated intervention. The current study establishes the conceptual and empirical linkage between the PLS-SEM results and the proposed training design, while formal impact evaluation of the modules (e.g., pre–post-performance assessment) is identified as a logical next research step. To enhance transparency and replicability, the complete set of training modules and learning materials has been made available through a stable digital platform (visitdesasumba.com, accessed on 30 November 2025). Ethical considerations related to data protection were addressed by excluding personal identifiers, limiting data use to research and training purposes, and ensuring voluntary participation in all learning activities. A visualization of the structure and sequence of these training modules is presented in Figure 4.
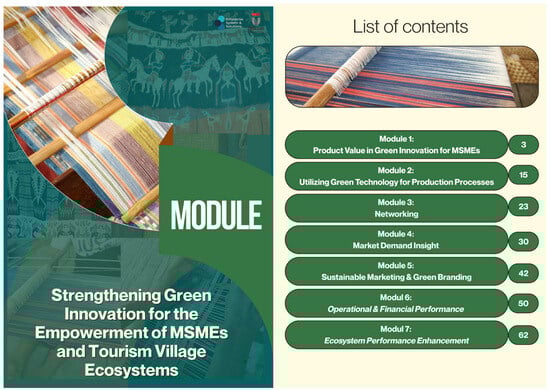
Figure 4.
Structure and Sequence of PLS-SEM Results-Based Training Modules for Strengthening Green Innovation, Organizational Performance, and Ecosystem Performance of Tourism Village MSMEs.
The five dimensions of green innovation—Product Value (PV), Technology (TC), Networking (NW), Market Demand Insight (MD), and Sustainable Marketing (MK)—which proved to be significantly influential in the PLS-SEM model, were then translated into thematic learning modules. The Product Value module focuses on strengthening product value based on culture and sustainability, in line with the finding that PV is the strongest component of green innovation. The Technology module emphasizes production process efficiency and the adoption of environmentally friendly technologies, while the Networking module focuses on strengthening pentahelix collaboration and knowledge diffusion. The Market Demand Insight module aims to improve MSMEs’ ability to understand the changing preferences of increasingly sustainability-oriented global tourists. In contrast, the Sustainable Marketing module focuses on communicating green values and cultural identity through responsible marketing strategies. This modular approach aligns with the finding that green innovation in tourism MSMEs works most effectively when developed through the strengthening of specific and targeted capabilities [31].
As a concrete example of translating empirical PLS-SEM results into learning interventions, this study presents Module 1: Product Value in Green Innovation for MSMEs. This module was developed based on the finding that Product Value (PV) is the strongest dimension of the green innovation construct, indicating that increasing product value through culture and sustainability is the primary foundation for MSMEs in tourism villages in building competitiveness. Therefore, this module is positioned as the initial stage in the learning series to ensure that MSMEs first understand and can articulate the core value of their products before moving on to technology adoption, network strengthening, and marketing strategies. The Product Value module is designed to facilitate a structured, context-based learning process by integrating local cultural aspects, environmentally friendly production practices, and the needs of the sustainable tourism market. By presenting clear learning objectives and benefits, this module helps MSMEs identify product uniqueness, formulate a green value narrative, and link it to tourist preferences. This approach aligns with the finding that strengthening product value not only improves perceived quality and market differentiation but also serves as a gateway to further developing innovation capabilities. The visualization of Module 1 in Figure 5 shows how the Product Value concept is translated into an operational module structure, from the definition of product value and learning objectives to economic, social, and environmental benefits. Thus, Module 1 serves as a foundation for learning that prepares MSMEs to develop other dimensions of green innovation in a gradual, integrated manner in subsequent modules.
Figure 5.
Example of Implementation of Module 1: Product Value in Green Innovation for MSMEs [55,56,57,58,59,60,61,62].
To ensure that Product Value strengthening is not only conceptually understood, Module 1 is also designed with practice-based learning activities that allow for MSMEs to directly reflect on the condition of their products before the training intervention is carried out. One example of implementing this activity is the Existing Product Analysis (Baseline PV Assessment), which aims to identify the initial condition of MSME product value as a starting point for the learning process and continuous improvement. At this stage, participants are asked to conduct a self-assessment of the main product, using the Product Value Assessment Sheet (Pre-Test). This worksheet is structured around the Product Value dimensions used in the PLS-SEM model, including environmentally friendly materials, environmental appeal to consumers, contribution to environmental conservation, unique cultural values, and compliance with environmentally friendly production principles. With this approach, the learning instruments used in the module directly reflect the empirical constructs tested in the research. Figure 6 shows the activity structure of Module 1, including learning objectives, implementation steps, and expected outcomes, along with an example participant worksheet as an initial measurement tool (baseline). Through this activity, MSMEs not only gain an initial understanding of their product’s value proposition but also systematically identify weaknesses and opportunities for improvement. This reflection-based and practice-based learning approach strengthens the internalization of sustainability-based product values. It serves as a foundation for developing other dimensions of green innovation in subsequent modules.
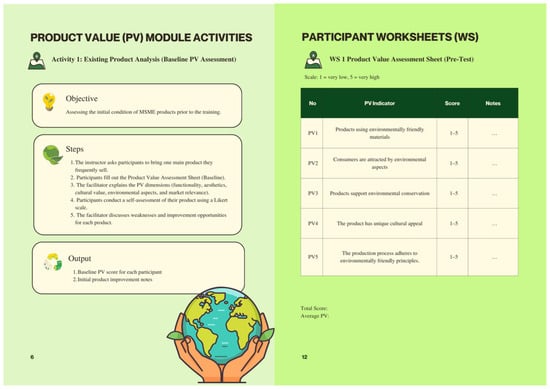
Figure 6.
Example of Learning Activities and Participant Worksheets in Module 1: Product Value in Green Innovation for MSMEs.
Another key finding in this study is the role of organizational performance as a key mediator between green innovation and ecosystem performance. This indicates that green innovation will only impact ecosystem productivity and resilience if accompanied by improvements in the operational and financial governance of MSMEs. International literature confirms that operational and financial performance are key enablers of MSME sustainability, enabling small businesses to absorb innovation, manage risk, and survive in the dynamic tourism market [51,52]. Therefore, an Organizational Performance module was developed to strengthen MSMEs’ capabilities in managing production processes, reducing defects, calculating COGS and BEP, and managing cash flow more systematically.
In the final stage, the Ecosystem Performance dimension, reflected through productivity and resilience, was developed into an integrative module emphasizing a systems thinking approach. This module helps MSMEs understand their role as core actors in the village tourism ecosystem and build adaptive capacity to withstand fluctuations in demand, external pressures, and environmental changes. This approach aligns with the sustainable tourism literature, which emphasizes that destination resilience depends heavily on local actors’ capacity to sustain collective productivity and resilience through innovation and collaboration [63].
To ensure the sustainability, scalability, and accessibility of the research results, all modules, compiled in PDF format, were then integrated into the visitdesasumba.com digital platform. The use of this digital platform is supported by international literature, which confirms that digital tourism platforms function not only as promotional media but also as knowledge dissemination platforms that accelerate knowledge transfer, expand access to learning, and strengthen sustainable practices in MSMEs [63,64]. In the context of 3T regions, digitizing modules is a strategic solution to overcome geographic limitations and limited access to face-to-face training.
On visitdesasumba.com, training modules can be accessed independently by MSMEs, facilitators, and other stakeholders, enabling a sustainable learning process independent of short-term interventions. This platform also serves as an integrated space for learning, innovation, and MSME product promotion, thereby supporting the simultaneous creation of economic and social value. Recent studies have shown that the digitalization of tourism MSMEs positively contributes to increased innovation, performance, and ecosystem sustainability when supported by relevant and contextual learning content [51,52]. Figure 7 shows the main page (dashboard) of visitdesasumba.com, which serves as an integrative medium for destination promotion, cultural narratives, and green innovation-based learning contexts. This platform is designed to support sustainable access to knowledge and innovation by MSMEs in tourist villages, particularly in the 3T regions, through a contextual and inclusive digital approach.

Figure 7.
The Dashboard Display of the visitdesasumba.com Digital Platform as a Media for Integrating Destinations, Knowledge, and Innovation for Tourism Village MSMEs.
As part of the digital platform architecture, visitdesasumba.com offers a special Modules & Catalog feature that serves as a knowledge dissemination platform and a self-learning resource for MSMEs. This feature serves as a meeting point between the empirical results of PLS-SEM and field practice, enabling each training module, developed along the dimensions of green innovation, organizational performance, and ecosystem performance, to be accessed in a structured, gradual manner. With this approach, the learning process does not depend on short-term, face-to-face training but can be ongoing, flexible, and repeatable to meet the needs of MSMEs. Figure 8 shows the Modules & Catalog feature on the visitdesasumba.com platform, which contains training modules in PDF format, including Product Value, Technology, Networking, Market Demand Insight, Sustainable Marketing, Organizational Performance, and Ecosystem Performance. This feature is designed to facilitate structured, gradual, and context-specific self-learning, translating PLS-SEM analysis results into digital interventions that support the sustainability of MSMEs and the tourism village ecosystem.

Figure 8.
The Modules & Catalog feature on visitdesasumba.com as a dissemination medium for PLS-SEM results-based training modules.
Theoretically, this study extends the contribution of PLS-SEM research by demonstrating how empirical model results can be systematically translated into implementable instruments in the form of training modules and a supporting digital platform. In practice, the integration of these training modules into visitdesasumba.com provides an evidence-based mechanism to strengthen tourism village MSMEs’ readiness to adopt green innovation, enhance organizational performance, and support the sustainable improvement of ecosystem performance. It is important to note, however, that the visitdesasumba.com platform is currently positioned as a pilot and evidence-based implementation output rather than a fully evaluated intervention. At this stage, the platform primarily functions as a digital repository for training modules and learning materials intended to support self-directed learning among MSMEs and local facilitators, with initial rollout planned through facilitated access during tourism village capacity-building activities. Formal evaluation of the platform’s effectiveness—such as changes in organizational performance, learning completion rates, or ecosystem-level outcomes—falls beyond the scope of the present cross-sectional study and is therefore identified as a priority for future longitudinal research.
6. Conclusions
This study examines the role of green innovation in improving the performance of tourism MSMEs and its implications for strengthening the sustainable tourism ecosystem in East Sumba Regency. This region has high potential for cultural and nature-based tourism, but still faces limitations in innovation capacity and business performance. Focusing on the 3T (Frontier, Outermost, and Underdeveloped) regions makes this study relevant for understanding how an environmentally oriented innovation approach can strengthen MSMEs while supporting the sustainability of the tourism destination ecosystem.
Based on the results of the PLS-SEM analysis, this study shows that green innovation, represented by product value, technology, networking, marketing, and market demand insight, is positively and significantly associated with the organizational performance of tourism MSMEs. Improved organizational performance, reflected in operational and financial aspects, further higher organizational performance is significantly associated with stronger ecosystem performance, as demonstrated by increased productivity and resilience. These findings suggest that green innovation does not directly affect the ecosystem but rather strengthens the internal performance of MSMEs, key actors in the village tourism system.
The research results also show that product value is the most dominant dimension in shaping green innovation. This finding indicates that strengthening product value grounded in local culture and sustainability principles is the primary foundation for increasing the competitiveness of tourism MSMEs in the 3T regions. Furthermore, insights into technology, networking, and market demand help enhance MSMEs’ adaptability to changing tourist preferences and market dynamics. At the same time, sustainable marketing supports more effective communication of green values and local identity to tourists. Overall, the combination of these five dimensions indicates that green innovation in tourism MSMEs is multidimensional and requires integrated capability development.
In addition to producing empirical findings, this research also produced implementable outputs, including the development of thematic training modules directly derived from the PLS-SEM analysis, specifically the significant relationships between green innovation constructs and dimensions and organizational performance. These modules are structured around empirically proven dimensions and subsequently integrated into the visitdesasumba.com digital platform. This integration provides a sustainable, context-based learning approach for tourism MSMEs. It demonstrates how SEM-based quantitative research findings can be systematically translated into practical interventions to support business capacity building and destination ecosystems. This approach offers practical benefits for MSMEs, business facilitators, and local governments in designing more targeted and sustainable green innovation-based tourism development programs.
However, this study has several limitations. The cross-sectional nature of the data used prevents it from capturing the dynamics of change in green innovation, MSME performance, and the tourism ecosystem over the long term. The study’s geographic context, limited to East Sumba Regency, also limits the generalizability of its findings to other regions with different social and cultural characteristics and levels of digital readiness.
Given these limitations, future research is recommended to employ a longitudinal design to observe the transformation of tourism MSMEs over time. Further research could also expand the study context to other tourism villages or non-3T areas to test the model’s consistency and to explore the role of advanced digital technologies, such as data-driven tourism platforms and artificial intelligence, in systematically strengthening the adoption of green innovation. With this development, studies on green innovation and sustainable tourism are expected to provide a broader contribution to strengthening MSMEs and the tourism ecosystem in various contexts.
6.1. Theoretical Implications
Theoretically, this study makes an essential contribution to the literature on green innovation, SME performance, and tourism ecosystems in several key ways. First, it strengthens the Resource-Based View (RBV) framework by demonstrating that green innovation can be positioned as a valuable, difficult-to-imitate, and contextually relevant strategic internal capability for tourism MSMEs. The empirical finding that green innovation is positively associated with organizational performance supports the argument that green innovation is not simply a response to regulatory or market pressures, but rather a source of sustainable competitive advantage.
Second, this study broadens our understanding of the mediating mechanisms in the relationship between innovation and ecosystem performance. By positioning organizational performance as the primary mediator between green innovation and ecosystem performance, this study demonstrates that green innovation’s impact is indirect and depends on the organization’s ability to internalize it into operational and financial practices. These findings enrich the PLS-SEM literature in tourism by providing strong empirical support for a multi-stage structural relationship in the context of MSMEs.
Third, this study contributes to the methodological literature by demonstrating that PLS-SEM model results not only serve as a theoretical confirmation tool, but also provide a basis for designing evidence-based interventions. The transformation of latent constructs into thematic learning modules demonstrates how quantitative research can be operationalized into concrete capability-building instruments, bridging the gap between academic research and field practice.
6.2. Practical Implications
The practical implications of this study are derived directly from the statistically significant relationships identified in the PLS-SEM analysis. Given the strong positive association between green innovation and organizational performance (β = 0.794; t = 24.06; R2 = 0.792), tourism MSMEs in 3T regions should treat green innovation as a practical tool to improve operational and financial performance rather than as a stand-alone environmental initiative. In practice, MSMEs are advised to prioritize green innovation activities that are low-cost and immediately applicable, particularly those related to strengthening product value and responding to sustainability-oriented market demand.
The results further show that organizational performance is strongly associated with ecosystem performance (β = 0.892; t = 26.22; R2 = 0.821). This implies that improvements at the MSME level collectively determine the productivity and resilience of the tourism ecosystem. Accordingly, MSMEs should focus on embedding green innovation into daily operations to enhance service reliability, cost efficiency, and adaptability to demand fluctuations. From an ecosystem perspective, resilience is achieved not through isolated green actions, but through the cumulative performance improvements of MSMEs operating within the destination.
In terms of implementation, modular capacity-building programs offer an effective approach for translating these findings into practice. Training modules structured around empirically validated green innovation dimensions allow MSMEs to build capabilities gradually and according to their level of readiness. The use of digital learning platforms further strengthens this process by enabling continuous access, self-directed learning, and broader diffusion of green innovation practices, particularly in geographically constrained 3T regions.
For policymakers and tourism authorities, the findings suggest that MSME development programs should be aligned with the causal sequence supported by the empirical results: green innovation → organizational performance → ecosystem performance. Policy efforts may therefore focus on strengthening MSME capabilities before promoting large-scale green technology adoption. Practical measures include supporting culturally embedded product innovation, facilitating access to appropriate-scale green technologies, and using digital platforms as integrated infrastructures for learning and destination promotion. By aligning interventions with statistically supported mechanisms, policymakers can more effectively enhance ecosystem resilience and long-term tourism sustainability.
6.3. Limitations and Future Research
Although this study provides strong empirical support for the proposed structural relationships, several limitations require careful consideration in interpretations and future research. First, the use of a cross-sectional research design, with data collected at a single point in time, limits the ability to capture temporal dynamics and constrains the strength of causal inference among green innovation, organizational performance, and perceived ecosystem performance. Although Structural Equation Modeling (SEM) is often described as causal modeling, the cross-sectional and perceptual nature of the data does not permit definitive causal conclusions. Therefore, the findings should be interpreted as statistically significant structural associations consistent with the proposed theoretical framework rather than as conclusive evidence of causality.
Second, this study was conducted in a specific geographic context, namely East Sumba Regency, which may limit the generalizability of the findings to other regions with different social, cultural, and levels of digital readiness. Third, the variables used in this study, including ecosystem performance, were largely perceptual in nature and measured through MSMEs’ self-reported assessments. While this approach is appropriate for capturing how embedded actors perceive ecosystem productivity and resilience, it may introduce respondent bias and does not fully reflect objective destination-level conditions.
In addition, ecosystem performance in this study is operationalized as a perceptual firm-level construct rather than an objective or aggregated destination-level indicator. This study does not attempt to infer system-level ecosystem performance from firm-level responses, nor does it aggregate MSME data to construct macro-level measures. Accordingly, the results should be interpreted strictly as structural associations among perceptual firm-level constructs. Future research employing multi-level designs or incorporating independently measured destination-level indicators would provide a more comprehensive understanding of ecosystem performance from a system-wide perspective.
Future research is encouraged to employ longitudinal or multi-period research designs, particularly when longer observation periods are available and respondents have greater familiarity with the research instruments. Such approaches would enable a more comprehensive examination of dynamic changes over time, strengthen causal inference, and allow the integration of objective ecosystem-level indicators, such as tourist flows, environmental performance metrics, or destination-wide sustainability measures. Furthermore, future studies could expand the research context to other tourism villages and explore the role of digital technologies, including green marketplaces, supply chain management systems, or AI-based tourism platforms, in systematically strengthening the adoption of green innovation and enhancing ecosystem performance.
Author Contributions
Conceptualization, A.A.R.; methodology, A.A.R., M.A.P., M.D.A. and I.D.N.; software, A.A.R. and I.Z.; validation, A.S.R. and M.A.; formal analysis, A.S.R., M.A. and I.D.N.; investigation, A.A.R., A.S.R. and M.A.; resources, A.A.R., M.A.P. and M.D.A.; data curation, A.A.R., A.S.R. and M.A.; writing—original draft preparation, A.S.R., M.A. and I.D.N.; writing—review and editing, A.A.R., M.A.P. and M.D.A.; visualization, A.S.R., M.A., I.Z. and I.D.N.; supervision, A.A.R., M.A.P. and M.D.A.; project administration, A.A.R., A.S.R. and M.A.; funding acquisition, A.A.R. All authors have read and agreed to the published version of the manuscript.
Funding
This research was funded by Telkom University, Indonesia, under the institutional research grant scheme, Decree No. 331/LIT06/PPM-LIT/2025.
Institutional Review Board Statement
Ethical review and approval were waived for this study by Research and Community Service, Telkom University because participation was voluntary, with no pressure or coercion from any party. All participant information was kept confidential and anonymous, and was used solely for scientific and academic purposes.
Informed Consent Statement
Verbal informed consent was obtained from all respondents prior to data collection. Written consent was not feasible due to contextual limitations, including varying levels of literacy and limited ability of some respondents to communicate effectively in the Indonesian language. To ensure that participants fully understood the purpose of the study, the voluntary nature of participation, and their right to withdraw at any time, an initial explanation was provided verbally. This process was supported by local community members who are fluent in Indonesian and the local language, and who assisted in bridging communication between the researchers and the respondents. These local facilitators helped convey the study information accurately and ensured that consent was given knowingly and voluntarily. All respondents were adults, participation was entirely voluntary, and no sensitive personal data were collected.
Data Availability Statement
The data presented in this study are available on request from the corresponding author due to confidentiality agreements with the participating MSMEs and ethical considerations.
Acknowledgments
The authors would like to acknowledge the support and cooperation of the MSME actors, village tourism managers, and local stakeholders in East Sumba Regency who participated in this study. The authors also thank all facilitators and field assistants for their support during data collection and training activities. The authors gratefully acknowledge Telkom University, Indonesia, for its institutional support and contribution to the research implementation. During the preparation of this manuscript, the authors used ChatGPT (OpenAI, GPT-5) for language editing and improving the clarity and structure of the text. The authors have reviewed and revised the content, and accept full responsibility for its accuracy and integrity.
Conflicts of Interest
The authors declare no conflicts of interest.
Appendix A
Table A1.
Ecosystem Performance Construct Specification.
Table A1.
Ecosystem Performance Construct Specification.
| Variable | Dimension | Definition | Code | Item |
|---|---|---|---|---|
| Ecosystem Performance | Productivity | MSMEs’ perceived ability to generate competitive, efficient, and value-added tourism outputs (products and services) within the tourism ecosystem context. | PD1 | Our business is able to increase production output or sales each year. |
| PD2 | We use raw materials, labor, and capital efficiently. | |||
| PD3 | Our products or services have advantages compared to competitors. | |||
| PD4 | We frequently innovate in the products or services we offer. | |||
| PD5 | The number of customers or tourists using our products or services continues to increase. | |||
| Resilience | MSMEs’ perceived ability to survive, recover, and adapt to external disruptions (economic crises, pandemics, market changes, or environmental pressures) within the tourism ecosystem environment. | RS1 | Our business is able to survive despite difficult situations (e.g., pandemics or economic crises). | |
| RS2 | We can recover quickly after facing major business problems. | |||
| RS3 | We offer more than one type of product or service to reduce the risk of losses. | |||
| RS4 | We receive support from the community, government, or other institutions during difficult times. | |||
| RS5 | We can easily adjust our operations and strategies when market conditions change. |
Table A2.
Organizational Performance Construct Specification.
Table A2.
Organizational Performance Construct Specification.
| Construct | Dimension | Definition | Code | Item |
|---|---|---|---|---|
| Organizational Performance | Financial Performance | The organization’s ability to manage profits, revenues, and investments consistently to support business growth and sustainability. | FP1 | My business’s net profit has increased over the past year. |
| FP2 | Sales of my products/services grow from year to year. | |||
| FP3 | My business is able to maintain a balance between costs and revenues. | |||
| FP4 | My business income has increased steadily. | |||
| FP5 | I evaluate investment costs against the value generated. | |||
| Operational Performance | The organization’s ability to conduct business activities efficiently, productively, and on time to meet customer satisfaction and maintain competitiveness. | OF1 | Customer reviews/ratings of my business have improved year by year. | |
| OF2 | Production/service targets set by the organization were consistently achieved during the past year. | |||
| OF3 | Our company delivers products/services on time. | |||
| OF4 | The quality of our products/services is better than that of local competitors. | |||
| OF5 | Sales have increased over the past 12 months. |
Table A3.
Green Innovation Construct Specification.
Table A3.
Green Innovation Construct Specification.
| Construct | Dimension | Definition | Code | Item |
|---|---|---|---|---|
| Green Innovation | Product Value | Value added to products through green innovation practices | PV1 | The products I produce use more environmentally friendly materials compared to conventional materials. |
| PV2 | Consumers are more interested in purchasing my products because they consider environmental aspects. | |||
| PV3 | Environmental considerations increase consumers’ interest in my products. | |||
| PV4 | My products have distinctive appeal because they support environmental conservation. | |||
| PV5 | Most of my products incorporate environmentally friendly aspects in materials or production processes. | |||
| Technology | Technologies used to improve production efficiency, reduce waste and pollution, and support green innovation implementation | TC1 | My business has its own facilities or methods to manage waste without polluting the environment. | |
| TC2 | My business utilizes shared facilities (e.g., government or community facilities) for managing production waste. | |||
| TC3 | I have access to training or information on environmentally friendly technologies. | |||
| TC4 | My business conducts recycling of production waste so it can be reused. | |||
| TC5 | I use energy-efficient tools or machines that generate minimal pollution. | |||
| Networking | Collaboration networks among MSMEs and external stakeholders (government, academia, communities, and customers) established to support green innovation | NW1 | I have access to training or information on environmentally friendly technologies through networks. | |
| NW2 | There are organizations, communities, or associations that help MSMEs like mine share experiences on environmentally friendly business practices. | |||
| NW3 | I collaborate with external parties (government, training institutions, universities, or NGOs) to develop sustainable businesses. | |||
| NW4 | I actively participate in activities, training, or forums related to environmentally friendly innovation for businesses. | |||
| NW5 | Through collaboration networks, I gain new knowledge or ideas to improve business processes toward greater environmental sustainability. | |||
| Marketing | MSMEs’ efforts to identify market needs and preferences and implement promotional strategies to support green innovation. | MK1 | I obtain information on market needs and preferences from within the business (employees, production team, or sales staff). | |
| MK2 | I obtain information on market needs and preferences from external sources (customers, suppliers, or business partners). | |||
| MK3 | My customers often provide ideas or feedback for developing environmentally friendly products. | |||
| MK4 | Most ideas for new products come from observing market trends and customer information. | |||
| MK5 | I promote products by highlighting environmental benefits, such as natural materials or eco-friendly processes. | |||
| Market Demand | Market needs and preferences for environmentally friendly products and services | MD1 | An increasing number of consumers are interested in purchasing the environmentally friendly products I produce. | |
| MD2 | My customers have increasing knowledge about the quality of environmentally friendly products. | |||
| MD3 | Demand for environmentally friendly products or services increases over time. | |||
| MD4 | I adjust my products or services based on market feedback and sustainability-related needs. | |||
| MD5 | I monitor market trends and changes in consumer preferences to ensure my products remain aligned with green market demand. |
References
- Zhang, D.D.; Liao, B.; Wu, D.; Usmani, M.S. Systematically Prioritizing Key Barriers for the Implementation of Sustainable Rural Tourism Development in China: An ISM-MICMAC Approach. Environ. Dev. Sustain. 2025. [Google Scholar] [CrossRef]
- Li, X.; Abbas, J.; Dongling, W.; Baig, N.U.A.; Zhang, R. From Cultural Tourism to Social Entrepreneurship: Role of Social Value Creation for Environmental Sustainability. Front. Psychol. 2022, 13, 925768. [Google Scholar] [CrossRef]
- World Travel & Tourism Economic Council. World Travel & Tourism Economic Impact 2025; World Travel & Tourism Economic Council: London, UK, 2025. [Google Scholar]
- Primayesa, E.; Widodo, W.; Sugiyanto, F.X. Tourism and Economic Growth Nexus in Indonesia: The Dynamic Panel Data Approach. Reg. Sci. Inq. 2019, XI, 83–91. [Google Scholar]
- Minister of Tourism Indonesia. Tourism Snapshot. Beyond Recovery: Toward Transformation in Indonesia’s Tourism Resiliency; Minister of Tourism Indonesia: Jakarta, Indonesia, 2025; Volume 1. [Google Scholar]
- Indrajaya, T.; Setiyo Wibowo, F.; Wiweka, K. Rising the Competitiveness of a Cultural Tourist Destination in Banten, Indonesia through Stakeholder Orientation, Strategic Capability, and Shared Value Creation. Bp. Int. Res. Crit. Inst. (BIRCI-J.) Humanit. Soc. Sci. 2022, 5, 13377–13389. [Google Scholar] [CrossRef]
- Wang, T.-L.; Azizurrohman, M. Segmenting International Tourists in Indonesia: A Cluster Analysis of Preferences, Motivations, and Behaviors. J. Econ. Res. Soc. Sci. 2025, 9, 93–107. [Google Scholar] [CrossRef]
- Fowler, C.T. Customary Rights and Freshwater Ecology in Pluralistic Societies on the Monsoonal Island of Sumba (Eastern Indonesia). Front. Environ. Sci. 2022, 10, 842647. [Google Scholar] [CrossRef]
- Husnaini, A. Marketing Strategy for Ecotourism Products in Labuan Bajo, East Nusa Tenggara. Int. J. Sustain. Compet. Tour. 2023, 2, 65–76. [Google Scholar] [CrossRef]
- Sari, W.P.; Pandrianto, N.; Sukendro, G.G.; Azeharie, S.; Irena, L. Development Model of Tourism Communication and Creative Economy Based on Local Culture in East Sumba. J. Komun. 2023, 15, 418–432. [Google Scholar] [CrossRef]
- Randjawali, E.; Lalupanda, E.M.; Enda, R.R.H.; Bano, V.O.; Nggaba, M.E.; Pakereng, Y.M.; Kaka, A.; Lulu, V.S.L. Evaluation of the Implementation of the Ideal Online Learning System in Frontier, Outermost, and Disadvantaged Regions (3T). J. Kependidikan J. Has. Penelit. Kaji. Kepustakaan Bid. Pendidik. Pengajaran Pembelajaran 2022, 8, 592. [Google Scholar] [CrossRef]
- Rachmawati, A.; Sari, S.P.; Buditomo, A.S. Community Based Tourism Approach Implements One Stop Services Tourism in the Development of Watuhadang Tourism Village, Umalulu District, East Sumba Regency. In Proceedings of the International Conference on Business, Accounting, Banking, and Economics (ICBABE 2022); Springer Nature: Berlin/Heidelberg, Germany, 2023; pp. 56–66. [Google Scholar]
- Cooper, R.G. SMEs’ Use of AI for New Product Development: Adoption Rates by Application and Readiness-to-Adopt. Ind. Mark. Manag. 2025, 126, 159–167. [Google Scholar] [CrossRef]
- Lopes, J.M.; Oliveira, M.; Lopes, J.; Zaman, U. Networks, Innovation and Knowledge Transfer in Tourism Industry: An Empirical Study of Smes in Portugal. Soc. Sci. 2021, 10, 159. [Google Scholar] [CrossRef]
- Achmad, F.; Prambudia, Y.; Rumanti, A.A. Sustainable Tourism Industry Development: A Collaborative Model of Open Innovation, Stakeholders, and Support System Facilities. IEEE Access 2023, 11, 83343–83363. [Google Scholar] [CrossRef]
- Bataineh, M.J.; Sánchez-Sellero, P.; Ayad, F. Green Is the New Black: How Research and Development and Green Innovation Provide Businesses a Competitive Edge. Bus. Strategy Environ. 2024, 33, 1004–1023. [Google Scholar] [CrossRef]
- Rumanti, A.A.; Rizaldi, A.S.; Amelia, M. Green Innovation toward Knowledge Sharing and Open Innovation in Indonesian SMIs. In Proceedings of the 2024 IEEE International Conference on Industrial Engineering and Engineering Management (IEEM); IEEE: Piscataway, NJ, USA, 2024; Volume 2, pp. 147–151. [Google Scholar]
- Shahbaz, M.H.; Ahmad, S.; Malik, S.A. Green Intellectual Capital Heading towards Green Innovation and Environmental Performance: Assessing the Moderating Effect of Green Creativity in SMEs of Pakistan. Int. J. Innov. Sci. 2025, 17, 683–704. [Google Scholar] [CrossRef]
- Sobaih, A.E.E.; Hasanein, A.; Elshaer, I. Influences of Green Human Resources Management on Environmental Performance in Small Lodging Enterprises: The Role of Green Innovation. Sustainability 2020, 12, 371. [Google Scholar] [CrossRef]
- Mugellini, G.; Villeneuve, J.P.; Heide, M. Monitoring Sustainable Development Goals and the Quest for High-Quality Indicators: Learning from a Practical Evaluation of Data on Corruption. Sustain. Dev. 2021, 29, 1257–1275. [Google Scholar] [CrossRef]
- Achmad, F.; Wiratmadja, I.I. Organizational Performance and Competitive Advantage in SMEs: The Role of Green Innovation and Knowledge Management. J. Open Innov. Technol. Mark. Complex. 2025, 11, 100532. [Google Scholar] [CrossRef]
- Ahmed, R.R.; Akbar, W.; Aijaz, M.; Channar, Z.A.; Ahmed, F.; Parmar, V. The Role of Green Innovation on Environmental and Organizational Performance: Moderation of Human Resource Practices and Management Commitment. Heliyon 2022, 9, e12679. [Google Scholar] [CrossRef]
- Rumanti, A.A.; Samadhi, T.M.A.A.; Wiratmadja, I.I.; Reynaldo, R. Conceptual Model of Green Innovation toward Knowledge Sharing and Open Innovation in Indonesian SME. In Proceedings of the 2017 4th International Conference on Industrial Engineering and Applications (ICIEA); IEEE: Piscataway, NJ, USA, 2017; pp. 182–186. [Google Scholar]
- Rumanti, A.A.; Rizana, A.F.; Achmad, F. Exploring the Role of Organizational Creativity and Open Innovation in Enhancing SMEs Performance. J. Open Innov. Technol. Mark. Complex. 2023, 9, 100045. [Google Scholar] [CrossRef]
- Rumanti, A.A.; Daryanto, Y.; Amelia, M.; Rizaldi, A.S.; Zulkarnain, I.; Andrawina, L. The Role of Organizational and Stakeholder Factors in Strengthening Digital Literacy and Communication for Edu-Tourism. J. Open Innov. Technol. Mark. Complex. 2025, 11, 100618. [Google Scholar] [CrossRef]
- Nguyen, V.K.; Natoli, R.; Divisekera, S. Innovation and Productivity in Tourism Small and Medium Enterprises: A Longitudinal Study. Tour. Manag. Perspect. 2021, 38, 100804. [Google Scholar] [CrossRef]
- Fa’rifah, R.Y.; Achmad, F.; Septiningrum, L.; Wiratmadja, I.I. Segmentation of Potential Sustainable Tourism Based on Support System Facility Perspective. In Proceedings of the 6th Asia Pacific Conference on Manufacturing Systems and 4th International Manufacturing Engineering Conference; Lecture Notes in Mechanical Engineering; Springer Science and Business Media Deutschland GmbH: Berlin/Heidelberg, Germany, 2023; pp. 285–291. [Google Scholar]
- Wang, Z.; Huang, W.; Guan, X. Ecosystem Resilience Trends and Its Influencing Factors in China’s Three-River Headwater Region: A Comprehensive Analysis Using CSD Indicators (1982–2023). Land 2024, 13, 1224. [Google Scholar] [CrossRef]
- Li, Z.; Zhai, Y.; Zhang, T.; Zhou, X.; Cheng, Z.; Xu, T.; Li, C.; Hong, J. How Can Ecosystem Status Be More Comprehensively Reflected? A Case Study of Jinan City, China. Sci. Total Environ. 2023, 863, 160970. [Google Scholar] [CrossRef] [PubMed]
- De, I.; Biswas, S.N.; Dey, D. Micro-Entrepreneurship, Institutional Environment and the COVID-19 Pandemic: A Comparison of Weaving Clusters in West Bengal, India. J. Entrep. 2024, 33, 59–87. [Google Scholar] [CrossRef]
- Elizabeth, E.; Prabowo, H.; Bandur, A.; Setiowati, R. Harnessing Green Dynamic Capabilities for Sustainable Tourism Performance: The Mediating Role of Green Service Innovation in Bali’s Tour and Travel SMEs. Tour. Hosp. 2025, 6, 156. [Google Scholar] [CrossRef]
- Teece, D.J. Fundamental Issues in Strategy: Time to Reassess? Strateg. Manag. Rev. 2020, 1, 103–144. [Google Scholar] [CrossRef]
- Antara, M.E.Y.; Sugianingrat, I.A.P.W.; Martini, I.A.O. Leadership Strategy as the Driver of Achieving Sustainable Business: A Case of Endek Weaving SMEs in Indonesia. Probl. Perspect. Manag. 2024, 22, 288–298. [Google Scholar] [CrossRef]
- Babu, R.J.K.; Rajeswari, P.S.; Babu, S. Threads of Unity: Elevating Performance and Commitment in Weaving Cooperatives. Qubahan Acad. J. 2025, 5, 16–43. [Google Scholar] [CrossRef]
- Albort-Morant, G.; Henseler, J.; Cepeda-Carrión, G.; Leal-Rodríguez, A.L. Potential and Realized Absorptive Capacity as Complementary Drivers of Green Product and Process Innovation Performance. Sustainability 2018, 10, 381. [Google Scholar] [CrossRef]
- El-Kassar, A.N.; Singh, S.K. Green Innovation and Organizational Performance: The Influence of Big Data and the Moderating Role of Management Commitment and HR Practices. Technol. Forecast. Soc. Change 2017, 144, 483–498. [Google Scholar] [CrossRef]
- Dangelico, R.M.; Pujari, D. Mainstreaming Green Product Innovation: Why and How Companies Integrate Environmental Sustainability. J. Bus. Ethics 2010, 95, 471–486. [Google Scholar] [CrossRef]
- Triguero, A.; Moreno-Mondéjar, L.; Davia, M.A. Drivers of Different Types of Eco-Innovation in European SMEs. Ecol. Econ. 2013, 92, 25–33. [Google Scholar] [CrossRef]
- Horbach, J.; Rammer, C.; Rennings, K. Determinants of Eco-Innovations by Type of Environmental Impact—The Role of Regulatory Push/Pull, Technology Push and Market Pull. Ecol. Econ. 2012, 78, 112–122. [Google Scholar] [CrossRef]
- Arias-Pérez, J.; dos Santos, C.A.F.; Velez-Ocampo, J.; Zen, A.C. Beating around the Bush over Knowledge Sabotage: The Fatal Flaw in Increasing Digital Innovation Ecosystem Performance through Innovation Capability under Technological Turbulence. J. Strategy Manag. 2024. [Google Scholar] [CrossRef]
- Rumanti, A.A.; Rizana, A.F.; Septiningrum, L.; Reynaldo, R.; Isnaini, M.M. Innovation Capability and Open Innovation for Small and Medium Enterprises (SMEs) Performance: Response in Dealing with the COVID-19 Pandemic. Sustainability 2022, 14, 5874. [Google Scholar] [CrossRef]
- Mai, N.T.T.; Tuan, H.T.; Tien, N.H.; Van Tho, D.; Trang, N.T.T.; Mai, N.P. Cultural Tourism Resources: State Policy and Solutions for SMEs in Tourism Industry. Int. J. Entrep. Small Bus. 2023, 1, 1–17. [Google Scholar]
- Schuberth, F. Confirmatory Composite Analysis Using Partial Least Squares: Setting the Record Straight. Rev. Manag. Sci. 2021, 15, 1311–1345. [Google Scholar] [CrossRef]
- Hair, J.F.; Hult, G.T.M.; Ringle, C.M.; Sarstedt, M. A Primer on Partial Least Squares Structural Equation Modeling (PLS-SEM), 3rd ed.; SAGE: Thousand Oaks, CA, USA, 2022. [Google Scholar]
- Kono, S.; Sato, M. The Potentials of Partial Least Squares Structural Equation Modeling (PLS-SEM) in Leisure Research. J. Leis. Res. 2023, 54, 309–329. [Google Scholar] [CrossRef]
- Yuan, K.-H.; Deng, L. Equivalence of Partial-Least-Squares SEM and the Methods of Factor-Score Regression. Struct. Equ. Model. A Multidiscip. J. 2021, 28, 557–571. [Google Scholar] [CrossRef]
- Yuan, K.-H.; Wen, Y.; Tang, J. Regression Analysis with Latent Variables by Partial Least Squares and Four Other Composite Scores: Consistency, Bias and Correction. Struct. Equ. Model. A Multidiscip. J. 2020, 27, 333–350. [Google Scholar] [CrossRef]
- Cheah, J.-H.; Amaro, S.; Roldán, J.L. Multigroup Analysis of More than Two Groups in PLS-SEM: A Review, Illustration, and Recommendations. J. Bus. Res. 2023, 156, 113539. [Google Scholar] [CrossRef]
- Yuan, K.-H.; Zhang, Z.; Wang, L. Signal-to-Noise Ratio in Estimating and Testing the Mediation Effect: Structural Equation Modeling versus Path Analysis with Weighted Composites. Psychometrika 2024, 89, 974–1006. [Google Scholar] [CrossRef]
- Kock, N. Common Method Bias in PLS-SEM: A Full Collinearity Assessment Approach. Int. J. E-Collab. 2015, 11, 1–10. [Google Scholar] [CrossRef]
- Soomro, R.B.; Memon, S.G.; Dahri, N.A.; Al-Rahmi, W.M.; Aldriwish, K.; Salameh, A.A.; Al-Adwan, A.S.; Saleem, A. The Adoption of Digital Technologies by Small and Medium-Sized Enterprises for Sustainability and Value Creation in Pakistan: The Application of a Two-Staged Hybrid SEM-ANN Approach. Sustainability 2024, 16, 7351. [Google Scholar] [CrossRef]
- Zuñiga-Collazos, A.; Galvez-Albarracin, E.J.; Vera-Jaramillo, F.; Patiño-Giraldo, L.V. Digitalization, Innovation, Sustainability and Performance: A Causal Analysis Applied to Tourism MSMEs. Int. J. Innov. Stud. 2025, 9, 46–59. [Google Scholar] [CrossRef]
- Bourke, J.; Roper, S. Innovation, Quality Management and Learning: Short-Term and Longer-Term Effects. Res. Policy 2017, 46, 1505–1518. [Google Scholar] [CrossRef]
- Papa, A.; Chierici, R.; Ballestra, L.V.; Meissner, D.; Orhan, M.A. Harvesting Reflective Knowledge Exchange for Inbound Open Innovation in Complex Collaborative Networks: An Empirical Verification in Europe. J. Knowl. Manag. 2021, 25, 669–692. [Google Scholar] [CrossRef]
- Chen, Y.S. Green Organizational Identity: Sources and Consequence. Manag. Decis. 2011, 49, 384–404. [Google Scholar] [CrossRef]
- Testa, F.; Iraldo, F.; Vaccari, A.; Ferrari, E. Why Eco-Labels Can Be Effective Marketing Tools: Evidence from a Study on Italian Consumers. Bus. Strateg. Environ. 2015, 24, 252–265. [Google Scholar] [CrossRef]
- Grunert, K.G.; Hieke, S.; Wills, J. Sustainability Labels on Food Products: Consumer Motivation, Understanding and Use. Food Policy 2014, 44, 177–189. [Google Scholar] [CrossRef]
- Pine, B.J.; Gilmore, J.H. The Experience Economy: Past, Present and Future; Harvard Business Press: Boston, MA, USA, 2011. [Google Scholar]
- Chen, Y.S.; Chang, T.W.; Li, H.X.; Chen, Y.R. The Influence of Green Brand Affect on Green Purchase Intentions: The Mediation Effects of Green Brand Associations and Green Brand Attitude. Int. J. Environ. Res. Public Health 2020, 17, 4089. [Google Scholar] [CrossRef]
- Magnier, L.; Schoormans, J. Consumer Reactions to Sustainable Packaging: The Interplay of Visual Appearance, Verbal Claim and Environmental Concern. J. Environ. Psychol. 2015, 44, 53–62. [Google Scholar] [CrossRef]
- Dangelico, R.M.; Vocalelli, D. Green Marketing: An Analysis of Definitions, Strategy Steps, and Tools through a Systematic Review of the Literature. J. Clean. Prod. 2017, 165, 1263–1279. [Google Scholar] [CrossRef]
- Li, W.; Bhutto, T.A.; Xuhui, W.; Maitlo, Q.; Zafar, A.U.; Ahmed Bhutto, N. Unlocking Employees’ Green Creativity: The Effects of Green Transformational Leadership, Green Intrinsic, and Extrinsic Motivation. J. Clean. Prod. 2020, 255, 120229. [Google Scholar] [CrossRef]
- Zeqiri, A.; Ben Youssef, A.; Maherzi Zahar, T. The Role of Digital Tourism Platforms in Advancing Sustainable Development Goals in the Industry 4.0 Era. Sustainability 2025, 17, 3482. [Google Scholar] [CrossRef]
- Succurro, M. Digital Transformation in Tourism SMEs: A Strategic Imperative in the Evolving Business Landscape. Res. Sq. 2025, under review. [Google Scholar] [CrossRef]


Disclaimer/Publisher’s Note: The statements, opinions and data contained in all publications are solely those of the individual author(s) and contributor(s) and not of MDPI and/or the editor(s). MDPI and/or the editor(s) disclaim responsibility for any injury to people or property resulting from any ideas, methods, instructions or products referred to in the content. |
© 2026 by the authors. Licensee MDPI, Basel, Switzerland. This article is an open access article distributed under the terms and conditions of the Creative Commons Attribution (CC BY) license.