Abstract
The global concern regarding the reduction of carbon emissions has led to the development of hydrogen as a clean, carbon-free fuel for combustion systems. The present work combines Particle Image Velocimetry flow field measurements and Reynolds-Averaged Navier–Stokes numerical simulations to investigate the reactive flow downstream of a newly developed flame holder as part of a hydrogen-fueled afterburner system. The obtained numerical results are in reasonable agreement, for a RANS simulation, with the PIV measured data. According to the results presented in this article, it can be seen that ignition occurs, the flame is attached to the flame holder, and vortices develop downstream of the flame holder. These vortices facilitate the mixing of hydrogen with the flue gas coming from the gas generator. The recirculation zone generated by the flame holder in the flow measures approximately 100 mm, with the peak negative velocity reaching around 10 m/s. Downstream of the recirculation zone, the far-field free stream velocity on the centerline reaches 20 m/s. Outside the recirculation region, in the radial direction, the free stream is accelerated to an experimentally measured value of approximately 40 m/s, at 20 mm downstream from the flame holder, and 35 m/s at 100 mm downstream of the flame holder. The information gathered thus far will aid further investigation of the presented hydrogen-fueled afterburner system.
1. Introduction
Within the global initiatives to lower carbon emissions, hydrogen emerges as a clean, affordable, carbon-free, and renewable source of energy. As the universe’s most common and least heavy element, hydrogen possesses the highest known energy content. Thus, it is regarded as an essential part of future energy infrastructure and a promising solution to global energy challenges. Despite this, the insufficient development of hydrogen storage and transportation networks constrains its large-scale implementation. Blending hydrogen with natural gas provides a practical approach by allowing economical and large-scale hydrogen transportation via the current, well-established natural gas pipeline network. Through this approach, hydrogen can be directly used in various applications such as residential burners, industrial boilers, and gas turbines. Although hydrogen offers these advantages, its flammability limits, laminar burning velocity, and adiabatic flame temperature differ significantly from methane, the primary component of natural gas. Thus, developing an afterburner system 100% fueled by hydrogen is challenging. The use in parallel of numerical simulations and experimental data obtained using Particle Image Velocimetry (PIV) is very valuable in providing information regarding the flow downstream of the flame holder part of the afterburner system.
Turbulent flows around bluff bodies are part of numerous engineering applications. The flame holder’s purpose is to maintain flame stability and improve the mixing efficiency of combustion products with fresh reactants by generating recirculation zones. The unsteady nature of bluff body flows leads to unique turbulence phenomena, posing considerable challenges for numerical modeling.
Franco et al. [1] analyzed the suitability of using RANS turbulence models for investigating flows around circular bluff bodies. The performance of four different RANS turbulence models was evaluated against experiment. In a later study [2], Franco et al. examined three turbulence modeling approaches: Reynolds-Averaged Navier–Stokes (RANS), Large Eddy Simulation (LES), and a hybrid RANS/LES method. The turbulent flow was characterized in terms of average velocity field, Reynolds stress tensor, and flow anisotropy.
A numerical investigation by Meraner et al. [3] examined how nitric oxide (NOx) emissions from a partial premixed bluff body (PPBB) hydrogen burner vary across different operational conditions. A conical bluff body, used to stabilize the flame, is equipped on the PPBB burner. The bluff body was designed to encourage the internal recirculation of the flue gases, thereby diluting the fuel-air mixture. Steady-state CFD simulations were conducted to analyze the complex flow patterns in the burner and identify the sources of NOx formation for 12 different combinations of secondary fuel fractions and thermal loads. Experimental data validation indicated an average underprediction of NOx emissions by 7% [3]. The PPBB hydrogen burner cold flow characteristics have also been investigated numerically by Meraner et al. [4]. Particle Image Velocimetry (PIV) data of a confined non-reacting flow was used to validate steady-state and transient non-reacting simulations. Five different turbulence models have been used. All turbulent models successfully predicted the recirculation zone length in close agreement with the experimental data [4].
Guo et al. [5] have conducted an investigation regarding flame and flow structures of bluff body and swirl-stabilized flames at stable and near lean blowoff conditions. Particle Image Velocimetry (PIV) was employed to capture the planar velocity fields and flame structures. Large Eddy Simulation (LES) coupled with finite rate chemistry was used to model the intricate flame and flow interactions. The LES results served to investigate the flow and flame dynamics. Findings from experiments suggested that near lean blowoff conditions, the flame tended to be weak and unstable, with a tendency to lift off. Also, validation of the results showed that the non-dynamic power-law flame wrinkling model paired with a global reaction mechanism failed to accurately replicate the flame brush.
A lean turbulent premixed bluff body stabilized flame, far from blowoff conditions, was numerically investigated using Large Eddy Simulations (LES) and compared against experimental data by Massey et al. [6]. The LES results were validated against measurements, showing that the recirculation zone and inner shear layers were accurately represented. Furthermore, the overall shape of the flame in the LES was found to be slightly longer and broader compared to the experimental observations.
Abikan et al. [7] conducted a numerical investigation of the flow around a bluff body equipped with drag reduction devices using the Reynolds-Averaged Navier–Stokes (RANS) approach with three turbulence models. Their work involved validating the results with experimental data and conducting a thorough analysis of flow fields to understand how these devices achieve drag reduction. The study concluded with several key findings. The RST (Reynolds Stress Transport) turbulence model exhibited the best performance among the three models tested. Numerical findings showed good agreement with experimental data for both global parameters such as drag coefficient, as well as local parameters like velocity and Reynolds stress profiles. When combined with the RST model, the RANS approach was shown to be an effective and sufficiently accurate numerical tool for investigating this type of flow. This approach is particularly advantageous for optimization studies requiring analysis of a large number of cases, as it offers significant computational efficiency compared to other more computationally intensive approaches.
Sharma et al. [8] carried out a numerical study to investigate the flow structures behind bluff bodies of various shapes using Reynolds-Averaged Navier–Stokes (RANS) simulations. The focus was on understanding the effects of blockage and the aspect ratio of the bluff bodies. The study followed a systematic approach ensuring grid independence and validation of the simulation results. They showed strong correlation with the experimental findings.
Wawrzak et al. [9] conducted a numerical study of non-premixed hydrogen flames stabilized by specially designed bluff bodies. Large Eddy Simulations (LES) have been conducted to study the influence of different wall topologies (flat or wavy) upon flame development and stabilization.
The effect of bluff body shape on flame stability and NOx emissions in non-premixed hydrogen/air combustion has been studied by Kummitha et al. [10]. Numerical simulations have been carried out on three bluff body shapes. According to the results, the flat burner configuration showed greater NOx emission levels. With improved air-fuel mixing, leading to stable combustion and lower NOx emission levels, the concave sharp burner configuration proved to be the best of the investigated layouts.
Zhang et al. [11] have proposed a hydrogen-fueled micro-combustor equipped with several rectangular bluff bodies arranged in a single row. The numerical simulation results indicated that the hydrogen/air blow-out limit expanded due to the combined effect of the usage of multiple bluff bodies. The investigation concluded that the proposed micro-combustor was better suited for high flow velocity functioning regimes.
Mo et al. [12] have proposed a micromix diffusive combustion structure, fueled with hydrogen, based on a honeycomb bluff body configuration. The bluff body’s height and angle have been set as design variables, aiming to achieve the lowest possible NOx emission level. The results of the conducted numerical simulations have indicated the formation of vortices when hydrogen was injected into the high-speed air flow, leading to turbulence growth and hydrogen/air mixing improvement. Also, it was observed that the sensitive factor influencing the production of NOx was the bluff body height.
The impact of the flame holder shape on the flame structure has also been numerically investigated by Hashemi et al. [13]. The fuels used in this study were 100% H2, 50% H2/50% CH4, and 100% CH4. The increase in both the hydrogen percentage in the fuel and the flame holder’s length led to the flame’s length decreasing. Also, as the flame holder’s length was reduced, the flame temperature dropped. As the percentage of hydrogen in the fuel mixture increased, the maximum flame temperature rose, and its location shifted closer to the burner inlet.
Kim et al. [14] have explored the dynamics of lean premixed hydrogen/air flames anchored on a meso-scale bluff body flame holder by conducting direct numerical simulations. Understanding the blowoff mechanism and examining the hydrodynamic impacts on flame dynamics have been the goals of the investigation.
Gounder et al. [15] presented a novel idea for injecting gaseous hydrogen (fuel) into a stream of air (oxidant) which they have tested on a laboratory bluff body (BB) burner. The proposed injection idea used porous steel components in place of traditional injection nozzles in order to obtain a more diluted and spatially distributed hydrogen injection. The testing campaign has demonstrated the stable functioning of the bluff body burner equipped with the distributed fuel injection concept in the equivalence ratio range of 0.3–0.5.
Bagheri et al. [16] have examined flame stability and combustion characteristics of lean premixed hydrogen/air mixture in a micro-combustor with different shapes of bluff body under various functioning conditions. The following parameters have been monitored: the blow-off limit, combustion efficiency, wall temperature, and exhaust gas temperature of the micro-combustor. The obtained results have shown that the micro-combustor equipped with a wall-blade bluff body has proven the most stable.
PIV measurements have long been used by researchers to investigate the velocity field around bluff body flame holders. Du [17] and Budovsky [18] have conducted comparison studies of experimental findings, via the PIV technique, with computational results regarding the flow over flame holders.
PIV determinations in a non-premixed gas turbine burner prototype have been performed by Sadanandan et al. [19]. The goal was to investigate how flame stabilization is influenced by an increase in thermal power. The burner had a large bluff body base with an annular swirl region, leading to a convergent-divergent flow field at the burner exit. Due to the swirl flow, a recirculation zone developed in the burner’s diverging section, which facilitated flame stabilization.
Starting from an older CH4 functioning afterburner configuration designed by the research team [20], a new flame holder geometry capable of functioning with pure hydrogen (100% H2) has been developed. The velocity field downstream of the flame holder has been assessed using Particle Image Velocimetry (PIV). After the experimental campaign, the initial numerical simulations that have been carried out in order to develop the new flame holder have been resumed. The computational domain has been modified to match the testing rig. The imposed boundary conditions have been changed in order to match, as closely as possible, the testing conditions and functioning regimes. The numerical simulation results have been compared with the PIV measured data, thus validating the obtained results. Thus, the use of numerical simulations in future research work to further optimize the afterburner system geometry is ensured.
The development of the presented hydrogen-fueled afterburner system allows researchers to begin to consider its future possible integration into an industrial application, such as combined cycle gas turbine (CCGT) power plants or cogeneration plants. This is in accordance with the objectives defined in the current Romanian National Hydrogen Strategy and Action Plan 2023–2030 [21]: New CCGT capacities, where CCGT capacities are planned to be developed using hydrogen to meet the maximum allowable CO2 emission limits established by the European Union. The energy efficiency of Combined Heat and Power (CHP) systems, designed to generate electricity and heat simultaneously, has been well established over the years. Despite advancements, a significant number of CHP systems still rely on fossil fuels such as oil and natural gas, thereby raising greenhouse gases emission levels. Thanks to hydrogen’s broader flammability limits, using it as a fuel allows for a wider stable combustion range, extending it towards leaner mixtures [20]. Stable functioning at lower temperatures in the combustion zone is achieved, which in turn minimizes the formation of thermal nitrogen oxides (NOx). A comparative flue gas analysis, in which the newly developed flame holder has been flued with different H2/CH4 mixtures up to 100% H2, has been presented by the research team [20].
2. Experimental Setup
The investigated afterburner system, developed and manufactured in COMOTI, has been positioned downstream of a Garrett 30–67 gas turbine engine, which was used as a gas generator. The experimental setup and testing rig are described in detail [22]. A Particle Image Velocimetry (PIV) system was employed to assess the velocity downstream of the afterburner’s flame holder.
2.1. The Afterburner System and the Gas Generator
The geometry of the model studied in this article is based on the CH4 functioning afterburner configuration presented previously [20] (Figure 1). A new flame holder was developed capable of using pure hydrogen as fuel. The afterburner system consists of a casing and the flame holder assembly. The flame is stabilized by means of a V-shaped flame holder, positioned in the gas generator exhaust flow. An enclosure through which the fuel is delivered has been created by adding a concave wall to the original V-shaped flame holder. The flame holder has 40 holes of Ø3 mm that allow the fuel to exit the enclosure and be injected in the flue gas stream. To further encourage the flue gas coming from the gas generator to flow around the flame holder, additional walls have been placed on the sides of the V-shaped enclosure. The proposed flame holder geometry will facilitate the proper mixing of the fuel with the flue gas, thus leading to its ignition. Figure 2a–c [22] provide the overall dimensions of the studied flame holder.
Figure 1.
CH4 functioning afterburner system [20].
Figure 2.
(a) H2 flame holder transversal section; (b) H2 flame holder global dimensions; (c) global dimensions of the H2 afterburner system [22].
The afterburner assembly has been positioned downstream of a Garrett GTP 30–67 turbo-shaft micro gas turbine engine. The used gas generator, being a turbo-shaft type, needs a load to be connected to its shaft in order to reach higher functioning regimes. This was not available. Thus, the experiments have been conducted only in an idle functioning regime (52,800 ± 200 rpm); exhaust gas temperature at the afterburner inlet: 550 K; exhaust gas pressure at the afterburner inlet: 1.05 bar absolute.
2.2. The PIV Measurement System
The technique relies on the concept of seeding the working fluid. Solid particles, in this case Titanium Oxide, are inserted into the working fluid flow. The seeded flow is illuminated by a medium intensity LASER beam emitted by a Nd:YAG double pulsed LASER. Two high-speed cameras, which capture the image created, are triggered at the same moment. Through the processing of these images, the movement of the solid particles in the flow is tracked, and the velocity vector components are computed based on the time elapsed between two snapshots. Stereo PIV measurements have been conducted under steady inlet conditions, featuring a 0.3689 ms delay from the laser pulse to the first camera trigger, a 15 μs gap between the two camera triggers, and a 100 μs exposure time for each camera. The recording frequency was set at 7.26 Hz. A total of 100 double images were captured for post-processing, providing instantaneous velocity fields. The PIV system, data acquisition, and processing are presented in detail in [23]. Figure 3 presents the PIV testing rig setup. Figure 4 presents the measurement plane (200 mm × 200 mm) position. The velocity measurements have been conducted in the exhaust of the operating afterburner system fueled with 100% hydrogen.
Figure 3.
PIV testing rig setup.
Figure 4.
PIV measurement plane position.
3. Numerical Simulation Setup
3.1. The Calculation Domain and the Computational Grid
The commercial software ANSYS CFX 2024 has been used to carry out a 3D steady RANS numerical simulation in order to investigate the new afterburner system. Following the experimental campaign, the preliminary numerical simulations that have been performed in order to develop the new flame holder have been resumed.
The computational domain’s geometry has been constructed to match the experimental model, facilitating the comparison between the numerical results and the experimental findings. The computational domain (Figure 5) starts from the gas generator outlet, includes the afterburner system presented in Section 2.1, and extends 500 mm downstream of the flame holder. In the transversal direction, the extension measures 350 mm, centered on the afterburner symmetry axis. The discretization of the computational domain has been performed using ICEM CFD. Three unstructured type computational grids have been generated (Figure 6a–c).
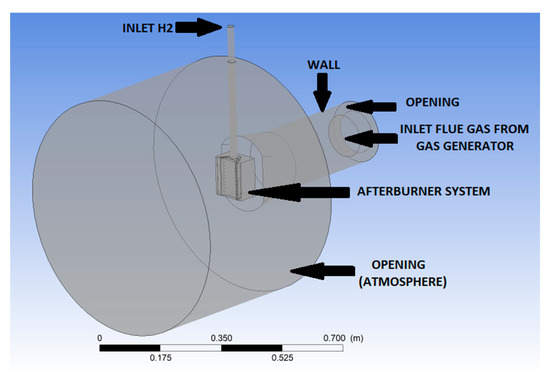
Figure 5.
Calculation domain.
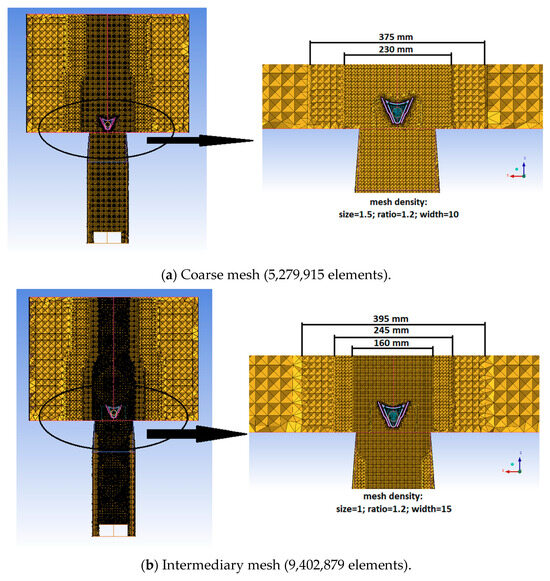
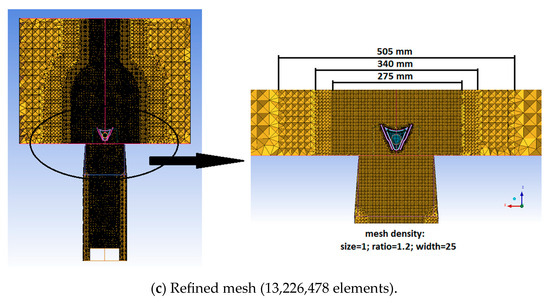
Figure 6.
Computational grids.
3.2. Boundary Conditions and Used Models
For the inlet of the flue gas coming from the gas generator, the results from a previous CFD simulation [24] conducted on the chosen gas generator geometry, in the idle speed functioning regime, have been used as boundary conditions. Table 1 summarizes all the boundary conditions used. The k-epsilon RANS turbulence model has been used; the reason for choosing this model is its reputation for robustness and numerical stability, qualities that have led to its widespread use among researchers over the years. This turbulence model has been used alongside the scalable wall function formulation developed by ANSYS CFX 2024. The reference pressure has been set at 1 bar, as the tests have been performed at atmospheric pressure. For H2/air combustion modeling, the Eddy Dissipation Model (EDM) has been used, coupled with a more complex reaction mechanism than the ones available in the ANSYS library. The reaction mechanism is presented in detail in another study [25]. The solver employs a high-resolution advection scheme, high resolution turbulence numerics, and convergence thresholds with residuals of 10−4.

Table 1.
Boundary conditions.
4. Numerical and Experimental Results Comparison
Figure 7 presents the tested prototype during the combustion experiments. Figure 8 presents the averaged velocity field, downstream of the tested prototype, obtained using the PIV measurement system.
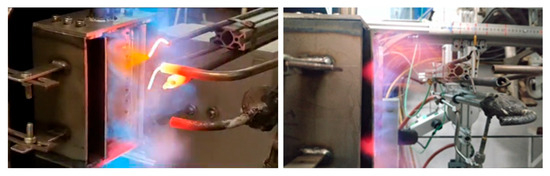
Figure 7.
Flame image during experiments [22].
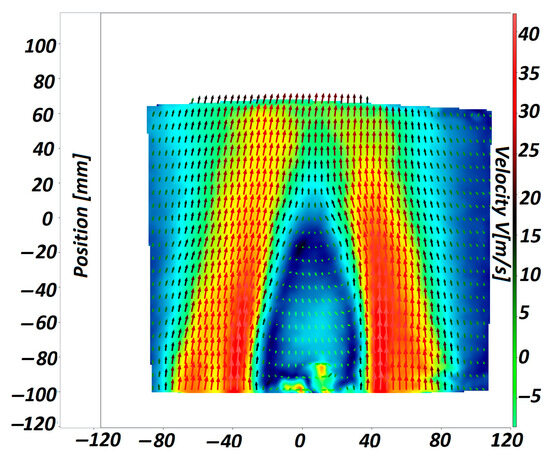
Figure 8.
PIV measured averaged velocity field [22].
Figure 9a,b present the Total Temperature field on two perpendicular longitudinal planes through the computational domain. The yellow lines in Figure 9a, downstream of the flame holder, represent the monitoring lines along which the velocity obtained through CFD simulations is compared with the PIV measured values. The red square represents the limits of the PIV measuring domain. Figure 10a,b present the streamlines on the same two perpendicular longitudinal planes through the computational domain. From Figure 9 and Figure 10, it can be observed that the flame holder fulfills its role. Ignition occurs and the flame is attached to the flame holder. Also, downstream of the flame holder, vortices and high turbulence levels develop. These vortices facilitate the mixing of hydrogen with the flue gas produced by the gas generator. The asymmetry of the flame can be explained by the fact that the flue gas coming from the gas generator does not exit axially.
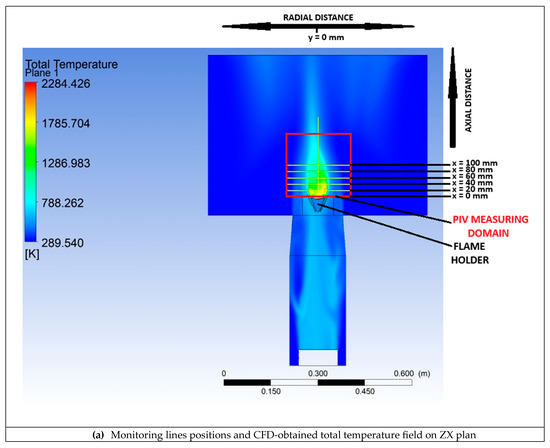
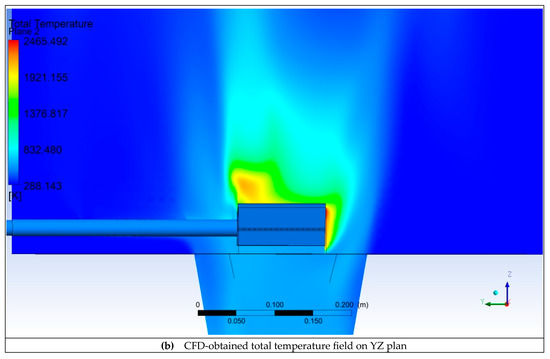
Figure 9.
Monitoring line positions and CFD-obtained total temperature fields.
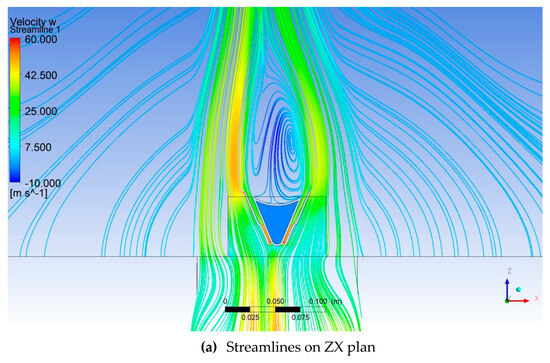
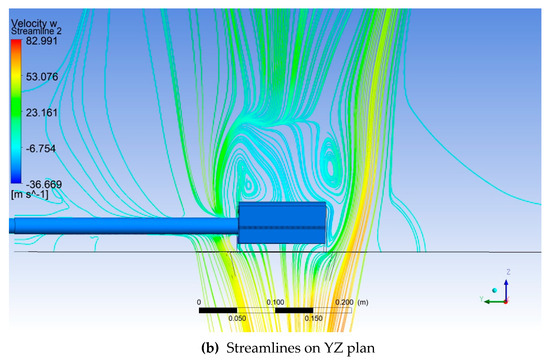
Figure 10.
Streamlines on two perpendicular longitudinal planes through the computational domain.
The outcomes from the 3 proposed computational grids, under same boundary conditions, have been evaluated at several points along the central axis of the afterburner. Based on the values presented in Table 2, it has been concluded that the intermediary mesh is good enough to be further used in order to have a good balance between numerical result quality and the needed computational power and time.
Table 2.
Mesh independence analysis.
4.1. Axial Results
Figure 11, Figure 12, Figure 13 and Figure 14 present the temperature respective to the velocity components along the central axis of the afterburner.
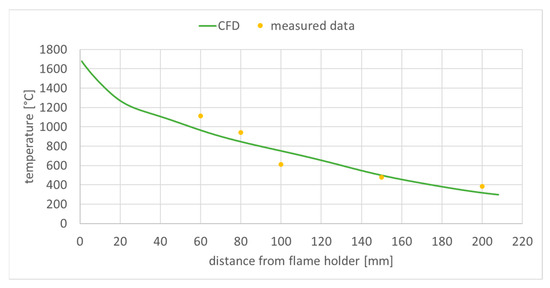
Figure 11.
Exhaust gas temperature along the central longitudinal domain axis.
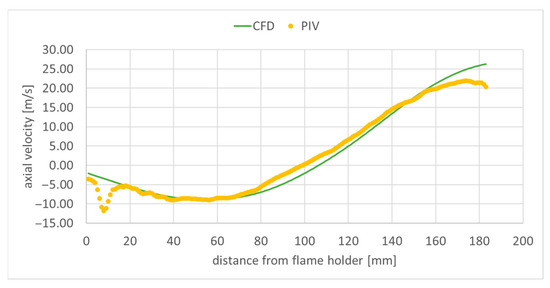
Figure 12.
Axial component of velocity along the central longitudinal domain axis.
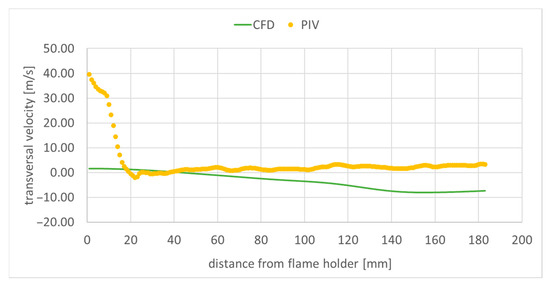
Figure 13.
Transversal component of velocity along the central longitudinal domain axis.
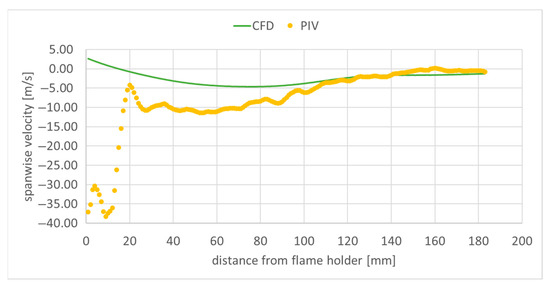
Figure 14.
Spanwise component of velocity along the central longitudinal domain axis.
Regarding the flue gas temperature, the differences observed in Figure 11 are most likely due to CFD estimation of the chemical heat release in the employed combustion model and chemical reaction mechanism.
The recirculation zone generated by the flame holder in the flow measures approximately 100 mm, with the peak negative velocity reaching around 10 m/s (Figure 12). The far-field free stream velocity is about 20 m/s. The remaining two velocity profiles are much smaller on the central domain axis both in the experimental measurements, and in the numerical simulation (Figure 13 and Figure 14), as the main flow at the centerline is primarily axial. The differences between the PIV measured velocities, and the numerical results observed in Figure 12, Figure 13 and Figure 14 for distances from the flame holder smaller than 20 mm, can be explained by the diminished measurement accuracy in that region, as it is close to the edge of the experimental field. In the case of the axial velocity component (Figure 12), the obtained numerical results are in reasonable agreement, for a RANS simulation, with the experimental data. The transversal velocity component (Figure 13) is underestimated by the numerical simulation. In the case of the spanwise velocity component (Figure 14), the results obtained are very similar to the measured data for distances downstream from the flame holder greater than 100 mm.
4.2. Transversal Results
Figure 15, Figure 16, Figure 17, Figure 18 and Figure 19 present the velocity profile components along transversal lines situated at 20 mm, 40 mm, 60 mm, 80 mm, and 100 mm downstream of the flame holder. The PIV measured axial velocity component profiles capture the recirculation region well, where the velocity values become negative. Beyond the recirculation region, the free stream reaches an experimentally measured value of approximatively 40 m/s at 20 mm downstream from the flame holder (Figure 15a), and 35 m/s at 100 mm downstream of the flame holder (Figure 19a). As the exhaust jet interacts with the surrounding air and moves away from the centerline, its axial velocity decreases and the jet spreads out more. As the monitoring line moves further downstream from the flame holder, both the intensity and the width of the recirculation region diminish owing to the decreasing difference between the axial velocities behind the flame holder and the flow around it. The RANS numerical simulation also captures the recirculation region and velocity well, but slightly overpredicts the free stream velocity: 50 m/s at 20 mm downstream from the flame holder (Figure 15a), and 45 m/s at 100 mm downstream of the flame holder (Figure 19a). Also, the width of the recirculation zone is slightly underestimated. A slight asymmetry can be observed both at the experimental and numerical axial velocity component profiles. This is due to the imperfections of the flue gas flow coming from the gas generator. The flue gas flow is not axial; it leaves the gas generator rotated. The remaining two velocity component profiles are much smaller; as mentioned before, the flow is mainly axial. The transversal velocity component profiles indicate a pair of counter-rotating vortices, for distances from the flame holder greater than 60 mm, both in the numerical and experimental data. The velocity variations captured by the PIV measurements in the area right behind the flame holder (−20 < radial distance < 20) in Figure 15a–c are not found in the numerical simulation results. This could mean that the computational grid is not sufficiently refined in that area, and/or the used RANS turbulence model is not suitable for characterizing the flow in this region.
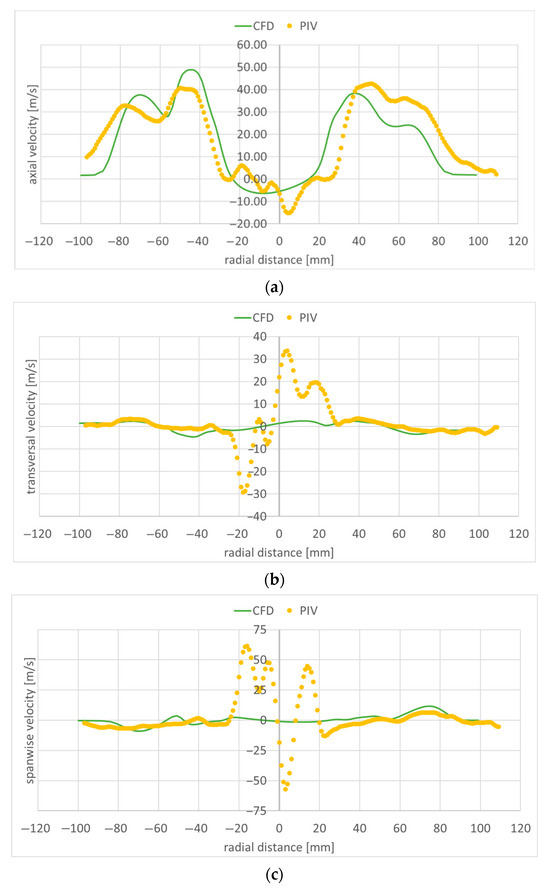
Figure 15.
Velocity along a transversal line at 20 mm downstream of the flame holder: (a) axial component; (b) transversal component; (c) spanwise component.
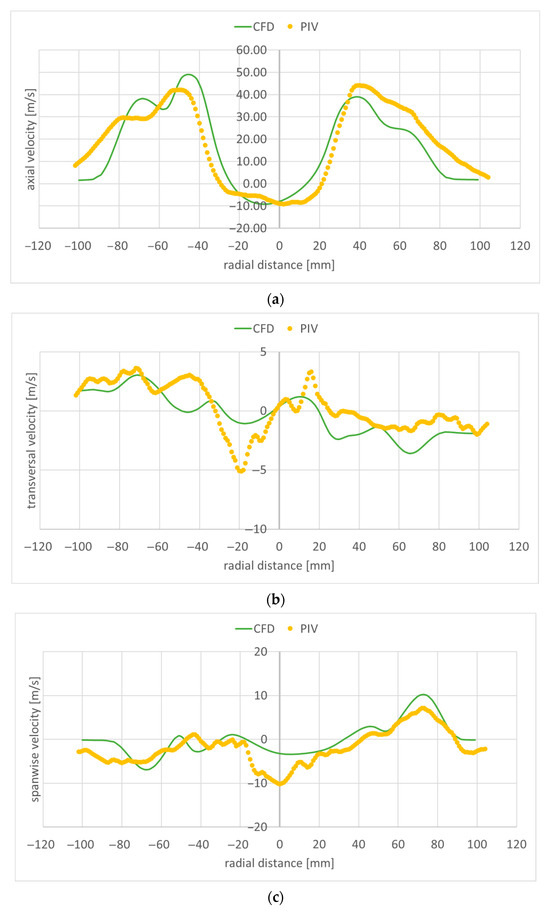
Figure 16.
Velocity along a transversal line at 40 mm downstream of the flame holder: (a) axial component; (b) transversal component; (c) spanwise component.
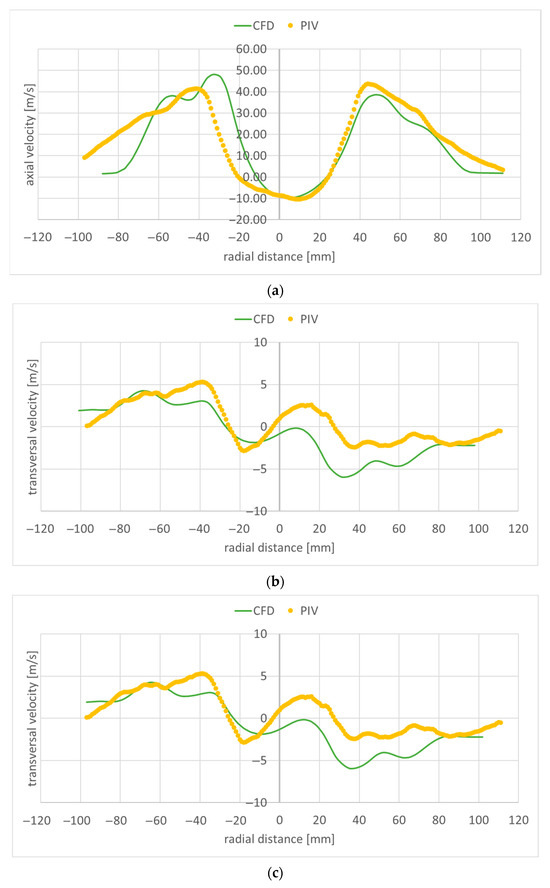
Figure 17.
Velocity along a transversal line at 60 mm downstream of the flame holder: (a) axial component; (b) transversal component; (c) spanwise component.
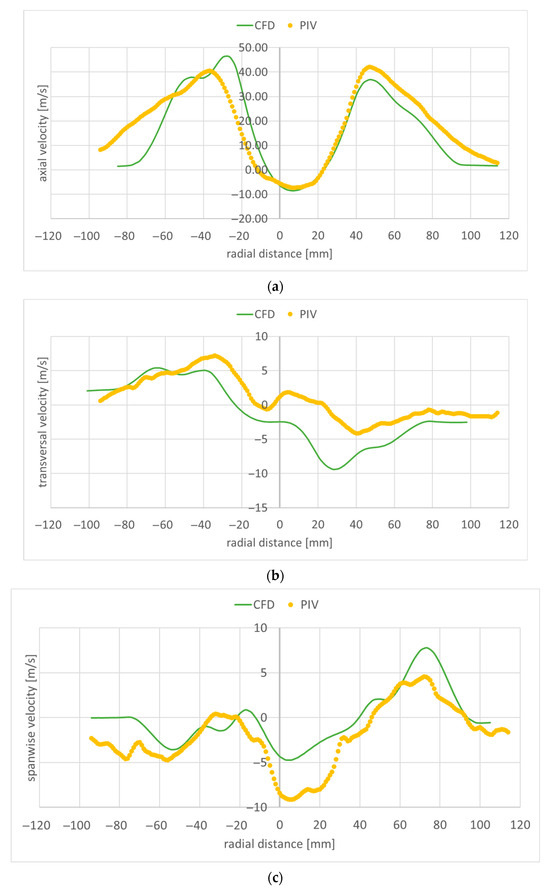
Figure 18.
Velocity along a transversal line at 80 mm downstream of the flame holder: (a) axial component; (b) transversal component; (c) spanwise component.
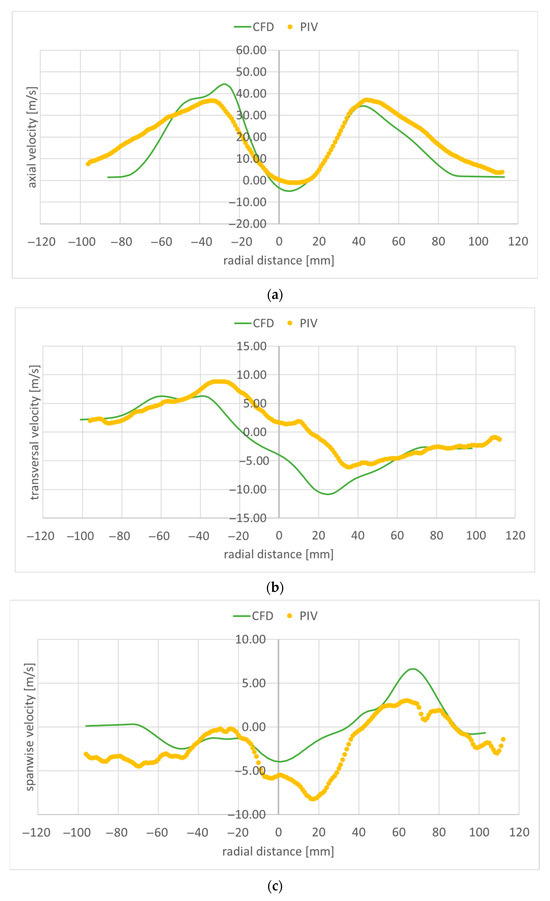
Figure 19.
Velocity along a transversal line at 100 mm downstream of the flame holder: (a) axial component; (b) transversal component; (c) spanwise component.
5. Conclusions
The paper presents a comparison between experimental measurements of velocity field, carried out through Particle Image Velocimetry, and numerical results obtained through numerical simulations carried out with ANSYS CFX 2024, conducted in order to develop a new hydrogen-fueled afterburner system. The experimental measurements have been conducted downstream of the flame holder of the newly designed afterburner system, fueled with 100% hydrogen. This formed a basis for validating the RANS numerical simulation’s ability to provide more information about the reactive flow downstream of the afterburner, in order to allow its further optimization.
The role of the flame holder is to provide a heat source needed for the ignition to occur, to stabilize the flame in order to maintain combustion, and to favorize a long enough residence time of the unburned mixture in the high temperature region in order to allow complete combustion. From the results presented in this article, it can be concluded that the flame holder fulfills its role. The ignition occurs and the flame is attached to the flame holder. Also, downstream of the flame holder, vortices and high turbulence levels develop. This is both beneficial and challenging. They enhance the mixing of the hot gases with the incoming fresh mixture, boosting the combustion process efficiency, but also introduce potential instabilities.
The numerical simulation results are found in reasonable agreement with the PIV measured data. The observed discrepancies are most likely related to the known limitations of the RANS approach and of the Eddy Dissipation combustion model together with the used reaction mechanism. Also, these differences can be due to the values of the velocity components used as boundary conditions for the flue gas inlet. These values have been obtained through a numerical simulation carried out on the gas generator used in the tests, with the same functioning regime in which the present experiments have been conducted. Nevertheless, they are subject to numerical errors, and thus influence the accuracy of the present simulation results.
Future work will consist of resuming the numerical simulations using other turbulence models available in ANSYS. Also, the possibility of performing a LES numerical simulation, which is expected to provide more accurate results, is under consideration. RANS only resolves the energy-containing integral scales. LES is able to resolve turbulent kinetic energy in the inertial sub-range. Thus, it is expected that the discrepances between the numerical results and the PIV measured data will be diminished by conducting a LES. The disadvantage of LES is that it still remains computationally expensive in comparison with RANS.
Accurate and reliable PIV measurements and numerical simulation outcomes are essential for further understanding flame holders’ dynamics. The provided experimental data can be employed as a validation database for the development of novel CFD models.
The information gathered thus far will aid further investigation of the presented hydrogen-fueled afterburner system.
Author Contributions
Conceptualization, A.C.M., F.G.F. and C.C.; methodology, F.G.F. and C.C.; software, A.C.M.; investigation, F.G.F.; writing—original draft preparation, A.C.M.; writing—review and editing, A.C.M. and F.G.F.; supervision, C.C.; All authors have read and agreed to the published version of the manuscript.
Funding
This work was carried out with the support of the Romanian Ministry of Research, Innovation and Digitalization, through two research projects: project no. 722PED/21.06.2022 and project no. PN 23.12.02.02.
Data Availability Statement
The raw data supporting the conclusions of this article will be made available by the authors on request.
Acknowledgments
The authors would like to acknowledge INCDT COMOTI for administrative and technical support. The IOSIN TURBOEXP testing facility was used.
Conflicts of Interest
The authors declare no conflicts of interest.
References
- Franco, R.; Celis, C.; da Silva, F. On the suitably of RANS turbulence models for modeling circular bluff-body con-figurations. In Proceedings of the 25th ABCM International Congress of Mechanical Engineering, Uberlandia, Brazil, 20–25 October 2019. [Google Scholar]
- Franco, R.; Celis, C.; da Silva, F. Numerical simulation of bluff body turbulent flows using hybrid RANS/LES turbulence models. J. Braz. Soc. Mech. Sci. Eng. 2023, 45, 1–17. [Google Scholar] [CrossRef]
- Meraner, C.; Li, T.; Ditaranto, M.; Løvås, T. Combustion and NOx Emission Characteristics of a Bluff Body Hydrogen Burner. Energy Fuels 2019, 33, 4598–4610. [Google Scholar] [CrossRef]
- Meraner, C.; Li, T.; Ditaranto, M.; Løvås, T. Cold flow characteristics of a novel bluff body hydrogen burner. Int. J. Hydrogen Energy 2018, 43, 7155–7168. [Google Scholar] [CrossRef]
- Guo, S.; Wang, J.; Zhang, W.; Lin, B.; Wu, Y.; Yu, S.; Li, G.; Hu, Z.; Huang, Z. Investigation on bluff-body and swirl stabilized flames near lean blowoff with PIV/PLIF measurements and LES modelling. Appl. Therm. Eng. 2019, 160, 114021. [Google Scholar] [CrossRef]
- Massey, J.C.; Langella, I.; Swaminathan, N. Large Eddy Simulation of a Bluff Body Stabilised Premixed Flame Using Flamelets. Flow Turbul. Combust 2018, 101, 973–992. [Google Scholar] [CrossRef] [PubMed]
- Abikan, A.; Yang, Z.; Lu, Y. Computational Analysis of Turbulent Flow over a Bluff Body with Drag Reduction Devices. J. Appl. Comput. Mech. 2020, 6, 1210–1219. [Google Scholar]
- Sharma, A.; Kumar, P.; Singh, S.K. Numerical analysis of flow structures behind the bluff body at different aspect ratio. In IOP Conference Series Materials Science and Engineering; IOP Publishing: Bristol, UK, 2018; Volume 402. [Google Scholar]
- Wawrzak, A.; Kantoch, R.; Tyliszczak, A. LES of a non-premixed hydrogen flame stabilized by wavy-wall bluff body. In Proceedings of the 18th International Conference on Fluid Flow Technologies, Budapest, Hungary, 30 August–2 September 2022. [Google Scholar]
- Kummitha, O.R.; Polu, A.R.; Manohar, G.; Sadeq, A.M. Design and performance evaluation of bluff bodies for NOx mitigation in non-premixed hydrogen flames. Proc. Inst. Mech. Eng. Part C J. Mech. Eng. Sci. 2025, 09544062251388324. [Google Scholar] [CrossRef]
- Zhang, Y.; Lu, Q.; Fan, B.; Long, L.; Quaye, E.K.; Pan, J. Effect of multiple bluff bodies on hydrogen/air combustion characteristics and thermal properties in micro combustor. Int. J. Hydrogen Energy 2023, 48, 4064–4072. [Google Scholar] [CrossRef]
- Mo, D.; Lin, Y.; Ma, H.; Han, X.; Liu, Y. Investigation on hydrogen micromix diffusive combustion organization based on bluff body disturbance. Acta Aeronaut. Astronaut. Sin. 2024, 45, 128928. [Google Scholar]
- Hashemi, S.A.; Hajialigol, N.; Mazaheri, K.; Fattahi, A. Investigation of the effect of the flame holder geometry on the flame structure in non-premixed hydrogen—Hydrocarbon composite fuel combustion. Combust. Explos. Shock Waves 2014, 50, 32–41. [Google Scholar] [CrossRef]
- Kim, Y.J.; Lee, B.J.; Im, H.G. Blowoff dynamics of lean premixed flames stabilized on a meso-scale bluff body. In Proceedings of the 11th Asia-Pacific Conference on Combustion, Sydney, Australia, 10–14 December 2017. [Google Scholar]
- Gounder, J.D.; Kutne, P.; Gruber, A. Experimental Investigation of a Bluff Body Burner for Distributed Hydrogen Injection. In Proceedings of the ASME Turbo Expo 2017: Turbomachinery Technical Conference and Exposition, Charlotte, NC, USA, 26–30 June 2017. [Google Scholar]
- Bagheri, G.; Hosseini, S.E.; Wahid, M.A. Effects of bluff body shape on the flame stability in premixed micro-combustion of hydrogen-air mixture. App. Therm. Eng. 2014, 67, 266–272. [Google Scholar] [CrossRef]
- Du, Y. Cold-State Investigation on a Flame Holder. J. Power Energy Eng. 2013, 1, 45–50. [Google Scholar] [CrossRef]
- Budovsky, A.D.; Vishnyakov, O.I.; Starov, A.V.; Sidorenko, A.A. Experimental and numerical investigation of the flow over v-shaped flame holder. AIP Conf. Proc. 2019, 2125, 030096. [Google Scholar]
- Sadanandan, R.; Chakraborty, A.; Arumugam, V.; Chakravarthy, S. Partially Premixed Flame Stabilization in the Presence of a Combined Swirl and Bluff Body Influenced Flowfield: An Experimental Investigation. ASME J. Eng. Gas Turbines Power 2020, 142, 071010. [Google Scholar] [CrossRef]
- Florean, F.; Petcu, A.; Porumbel, I.; Sandu, C.; Carlanescu, C.; Dumitrascu, G. Experimental Measurements in Reactive and Non-Reactive Turbulent Flow. In Proceedings of the 48th AIAA/ASME/SAE/ASEE Joint Propulsion Conference & Exhibit, Atlanta, GA, USA, 30 July–1 August 2012. [Google Scholar]
- Available online: https://mfe.gov.ro/wp-content/uploads/2021/06/0c2887df42dd06420c54c1b4304c5edf.pdf (accessed on 11 October 2025).
- Florean, F.G.; Mangra, A.; Enache, M.; Deaconu, M.; Ciobanu, R.; Carlanescu, R. Experimental research on an afterburner system fueled with hydrogen-methane mixtures. Inventions 2024, 9, 46. [Google Scholar] [CrossRef]
- Florean, F.G.; Mangra, A.; Enache, M.; Carlanescu, R.; Carlanescu, C. Flow field analysis of a hydrogen-fueled flame holder using Particle Image Velocimetry (PIV). Fuels 2025, 6, 20. [Google Scholar] [CrossRef]
- Petcu, A.C. Research Regarding the Use of Camelina Vegetable Oil as Fuel. Ph.D. Thesis, Politehnica University of Bucharest, Bucharest, Romania, 2016. [Google Scholar]
- Fukutani, S.; Kunioshi, N.; Jinno, H. Mechanism of combustion reactions in Hydrogen-Air premixed flames. Bull. Chem. Soc. Jpn. 1990, 63, 2191–2198. [Google Scholar] [CrossRef]
Disclaimer/Publisher’s Note: The statements, opinions and data contained in all publications are solely those of the individual author(s) and contributor(s) and not of MDPI and/or the editor(s). MDPI and/or the editor(s) disclaim responsibility for any injury to people or property resulting from any ideas, methods, instructions or products referred to in the content. |
© 2025 by the authors. Licensee MDPI, Basel, Switzerland. This article is an open access article distributed under the terms and conditions of the Creative Commons Attribution (CC BY) license (https://creativecommons.org/licenses/by/4.0/).