Abstract
This study aims to address a major challenge and find solutions for developing less expensive, lighter, and more efficient energy storage materials while remaining environmentally friendly. This work combines the study of the structural, morphological, and optical properties of epoxy nanocomposites containing ZnO and SnO2 and highlights the influence of oxide filler content on their energy storage performance. To this end, epoxy nanocomposites filled with metal oxides (ZnO and SnO2) prepared by extrusion, a simple, economical, and reliable industrial method, were studied and compared. The materials obtained are inexpensive, lightweight, and highly efficient, and can replace traditional glass-based systems in the energy sector. The results of XRD, SEM, and FTIR analyses show the absence of impurities, the stability of the structures in humid environments, and the homogeneity of the prepared films. They also indicate that the nature and charge content of the oxide integrated into the polymer matrix play a significant role in the properties of the nanocomposites. Optical measurements were used to determine the film thickness, the type of electronic transition, the band gap energy, and the Urbach energy. Based on the results obtained, the prepared nanocomposite films appear to be promising materials for energy-based optical applications.
1. Introduction
In recent years, researchers have focused on polymer-based nanocomposites (PNCs) because of their exceptional properties in advanced industrial fields, due to their flexibility, ductility, and reasonable price [1,2,3].
Epoxy resins occupy an important place in the energy sector due to their good optical transparency and semiconducting properties, as well as their chemical, mechanical, electrical, optical, and dielectric characteristics [4,5,6]. They are used as a matrix in conductive polymer composites.
Polymer composites are primarily manufactured on an industrial scale by mechanical mixing or molding, which allows for uniform and homogeneous dispersion of particles within the polymer matrix. For larger materials, continuous processes such as extrusion are used [7,8]. In some processes, fillers can be directly incorporated into the polymer matrix by in situ polymerization or deposited via coating techniques to create functional films [9]. The choice of method depends on the desired functional properties, the nature of the polymer, and the concentration and type of filler used.
The integration of metallic fillers such as tin dioxide (SnO2) and zinc oxide (ZnO) improves the electrical, optical, mechanical, thermal, and dielectric performance of polymers [10,11,12]. These characteristics make PNCs loaded with oxides of particular interest and open the way to numerous applications in the fields of electronics, hydrothermal, energy, optics, anticorrosion protection of photocatalysis and aerospace [6,13,14,15,16,17,18].
Several studies have studied the properties of oxides such as ZnO and SnO2 in various polymer matrices, highlighting their impact on the structure, morphology as well as optical characteristics [19,20,21].
The industrial uses of zinc oxide (ZnO) are very diverse: it is valued for its antibacterial, photocatalytic and piezoelectric properties, and used as highly effective UV blockers in protective varnishes, transparent coatings for the automotive and aerospace industries, as well as transparent protective encapsulants for organic photovoltaic panels [22,23,24,25,26,27,28,29,30].
For its part, tin dioxide (SnO2) occupies a strategic position. It is among the most widely used semiconductor oxides in industry thanks to its high electron mobility, low cost, and excellent chemical stability [31]. Considered the best successor to ITO in many devices, it is used as a next-generation transparent conductive oxide in OLED displays, electrochromic smart windows, and perovskite solar cells [32]. It is also integrated as a dielectric additive in epoxy composites for supercapacitors and high-voltage lithium-ion batteries. Furthermore, when doped or coupled with other oxides, it serves as an active photocatalyst under visible light, paving the way for self-cleaning coatings for solar energy applications. Finally, it is extremely sensitive sensing properties make it the material of choice for ultra-low-power gas sensors (H2, CO2, NO2) powered by energy harvesting [33,34,35,36].
These oxides are selected for incorporation into polymers due to their electrical properties, reduced environmental impact, cost-effectiveness, ease of integration into polymer materials, as well as their biosafety and biocompatibility.
Studies have examined ZnO and SnO2 nanocomposites in epoxy matrices for optoelectronic applications, but comparative analyses remain limited, particularly regarding their combined structural and optical behavior within the same epoxy system [37,38,39,40,41,42].
This work presents the first comparative study of the structural (XRD, SEM, IR, water absorption) and optical (UV-Vis, Eg and Urbach energy determination) properties of epoxy films filled with ZnO and SnO2, produced by extrusion. This choice is motivated by the attractive properties of epoxy resin and metal oxides for industrial applications. This study makes it possible to identify the specific effects of each oxide on epoxy films and to guide the choice of the most appropriate material for applications in the energy fields.
2. Materials and Methods
2.1. Experimental Details
A specific epoxy resin, bisphenol A diglycidyl ether from the company Feroca (Madrid, Spain), was used in combination with a hardener (HY956 from Ciba Geigy, Basel, Switzerland) and commercial nanopowder fillers of zinc oxide (<100 nm) and tin (II) oxide (<100 nm) supplied by Sigma-Aldrich (St. Louis, MA, USA). Three volume fractions were investigated: 0.05 vol.fr, 0.10 vol.fr and 0.15 vol.fr. A mixture composed of 75% epoxy resin and 25% hardener was first prepared, after which the appropriate amount of ZnO or SnO2 was incorporated. The fillers were dispersed in the resin–hardener mixture under continuous stirring to ensure homogeneous distribution. The resulting mixture was deposited onto a clean glass substrate (1.42 cm2 square) at room temperature and cured at 100 °C for one hour using the extrusion method to produce homogeneous epoxy/ZnO and epoxy/SnO2 composite films [7,8].
2.2. Technical Characteristics
Using various advanced characterization techniques, a comprehensive analysis of the structural, morphological and optical properties of epoxy/oxide thin films was performed.
2.2.1. Morphology Studies
Scanning electron microscopy (SEM) examination was performed using a Thermofisher Scientific QUATTRO S-FEG microscope (Thermo Fisher Scientific, Waltham, MA, USA.) to thoroughly study the surface morphology and homogeneity of the prepared films.
2.2.2. Structural Characterizations
Following the morphological study of the films, their structure was analyzed by X-ray diffraction.
This analysis was performed using an EMPYREAN Spinner Reflection-Transmission Configuration diffractometer—Malvern Panalytical (Almelo, Netherlands) equipped with a copper anode (λ = 1.5406 Å), scanning the 2θ range from 5° to 90° and providing information on the crystallinity of the samples. It allowed us to characterize the solid structure, layer spacing, and crystallite size. It allows us to determine the intensity of the rays diffracted by the sample as a function of the Bragg angle θ (Bragg’s law) [43].
where d is the inter-reticular distance, θ is the angle of incidence of the X-rays, while n represents the order of reflection, and λ is the wavelength of the X-rays.
- a.
- Determination of the size of the crystallites
Crystallite size was estimated using the Scherrer equation. This equation allowed the estimation of the average crystallite size based on the broadening of the XRD peaks. It provides information on the degree of crystallinity and microstructure of the material.
It is expressed as [44]:
where
Dc: mean crystallite size (nm);
K: Scherrer factor (0.9);
λ: X-ray wavelength (nm);
β: Full Width at Half Maximum intensity (FWHM) in radians (rad);
θ: Bragg angle at maximum peak in degrees (°) or radians (rad).
- b.
- Dislocation Density
The crystallite size and dislocation Dc are used to determine the dislocation density δ of epoxy/oxide nanocomposites. It is expressed by [45]:
2.2.3. ATR-FTIR Analysis
The functional groups and molecular vibrations of the epoxy/oxide films were analyzed by Fourier transform infrared spectroscopy using a Bruker Optics FTIR-Vertex 70 model (Bruker, Karlsruhe, Germany). This study provided information about the chemical composition of the epoxy/oxide films.
2.2.4. Optical Characteristics
Optical measurements were performed using a Perkin Elmer Lambda 900 UV/VIS/NIR spectrometer (PerkinElmer, Shelton, CT, USA), with a wavelength range of 300–800 nm. Optical measurements were used to investigate the semiconductor properties, energy capacity, and transparency of the prepared films.
Light scattering is controlled by the complex optical refractive index, which is related to the wavelength λ, as demonstrated by the following equation [46]:
n*(λ) = n(λ) − iK(λ).
These characteristics are, respectively, related to the real component of the refractive index n(λ) and to the imaginary part K, which indicate the material’s light absorption. Using the transmittance spectra and the method suggested by Manifacier and Swanepoel, the film thickness can be estimated using the formulae below [47,48,49]:
The index S represents the refractive index of the glass, while TS corresponds to its transmittance. TM(λ) and Tm(λ) correspond to the maximum and minimum points of the transmission curve for a specific value of λ. The values of refractive index, n1 and n2, are established, respectively, for the wavelengths λ1 and λ2, from two consecutive peaks of the transmittance spectrum, as Figure 1 shows:
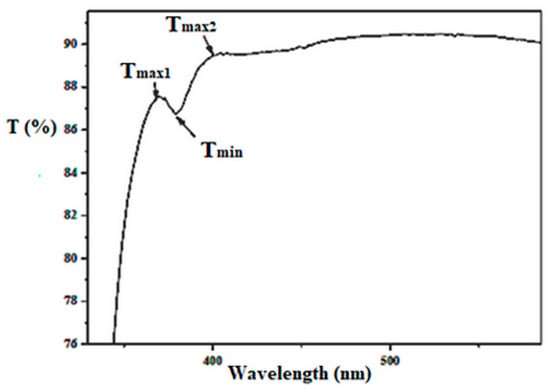
Figure 1.
The optical transmission spectrum of a thin film highlights the elements to consider when determining thickness [47].
(n ≫ ) is the imaginary part of the refractive index, determined from UV-Vis measurements according to the equation [47]:
λ represent wavelength and α denotes the absorption coefficient, determined by experimental measurements based on Beer’s law [50]:
where T corresponds to the transmittance in (%)
2.2.5. Optical Gap and Urbach Energy
The gap energy Eg is an important parameter. It provides information on the material’s performance. Tauc’s equation provides the expression for this energy [51]:
The Urbach energy Eu is associated with the difference in transition between states. This phenomenon is evidenced by the exponential variation, at the end of the distribution, of the absorption coefficient α as a function of the photon energy. This relationship is expressed empirically by the following formula [52]:
where α represents the absorption coefficient, α0 is a constant, h corresponds to Planck’s constant, ν indicate the absorption frequency, and Eu is the bandwidth or Urbach energy. It is easier to identify Urbach energy (Eu) by reformulating Equation (12):
3. Results and Discussion
3.1. Structural Characterization
3.1.1. XRD Patterns
Figure 2 presents the X-ray diffraction patterns captured at room temperature of nanocomposites films of Ep/SnO2 and Ep/ZnO.
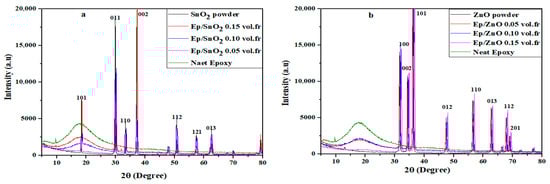
Figure 2.
XRD patterns of (a) Ep/SnO2 and (b) Ep/ZnO nanocomposite films. “a.u.” stands for arbitrary units of intensity, and the numbers above the peaks correspond to Miller indices (hkl) of the crystal planes.
The XRD data was used to determine the crystalline phase of the synthesized samples.
The nanocomposite of Ep/SnO2 (Figure 2a) with the corresponding 2θ peak values at 18.06, 29.80, 33.07, 36.90, 50.55, 57.23 and 62.44 with (hkl) planes of (1 0 1), (0 1 1), (1 1 0), (0 0 2), (1 1 2), (1 2 1) and (0 1 3), respectively, characteristic peaks of tetragonal structure with P4/nmm space group, which are well matched with JCPDS: 96-412-4668 [53,54,55,56,57].
For the XRD spectrum of Ep/ZnO (Figure 2b), it contains the diffraction peaks of (1 0 0), (0 0 2), (1 0 1), (0 1 2), (1 1 0), (0 1 3), (1 1 2) and (2 0 1) with the corresponding 2θ peak values at 32.14, 34.77, 36.88, 48.02, 56.84, 63.13, 68.19 and 69.43, respectively. These peaks show a hexagonal structure with P63 mc space group, corresponding to the JCPDS card number 96-901-1663 [58,59,60].
The XRD spectra show that no additional diffractions peak was observed in the samples, indicating the absence of impurities.
In the case of pure epoxy, two weak, broad peaks are observed around 2θ ≈ 10° and 30°. These peaks indicate the presence of a structural organization characteristic of epoxy networks, confirming that the matrix is amorphous.
The bands allow for the calculation of the average size of the ZnO and SnO2 crystallites embedded in the epoxy polymer matrix. This evaluation was performed by determining the full width at half maximum (FWHM) (β) of the main X-ray diffraction peaks, according to Scherrer’s formula (Equation (2)).
Table 1 presents the results relating to the crystallite size and dislocation density values for the Ep/SnO2 and Ep/ZnO films at a concentration of 0.15 vol.fr exposed at 100 °C.

Table 1.
Crystallite dimensions and dislocation densities for Ep/SnO2 and Ep/ZnO Films.
The calculation of the dislocation density indicates that Ep/SnO2 clearly exhibits a higher density than Ep/ZnO. This trend is directly associated with the inverse relationship between crystallite size and defect density: small crystallites lead to an increase in grain and dislocation density. These values indicate that the integration of SnO2 leads to more structural defects in the epoxy matrix, which could significantly influence the optical characteristics of the films.
3.1.2. Fourier Transforms Infrared Spectroscopy Analysis
The infrared spectra of pure epoxy and epoxy/SnO2 and epoxy/ZnO composites obtained by FTIR spectroscopy in the range of 500–2600 cm−1 are shown in Figure 3.
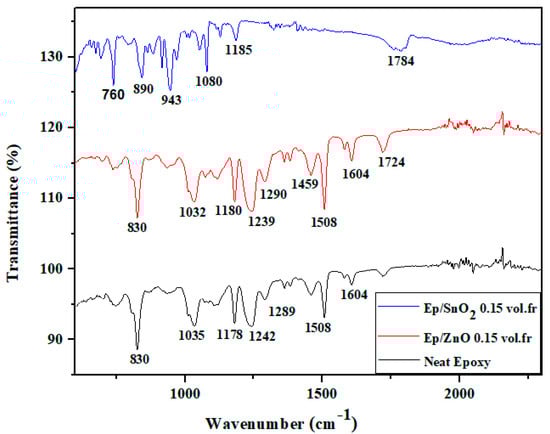
Figure 3.
Fourier transformed infrared (FTIR) spectra of neat epoxy, Ep/SnO2 and Ep/ZnO composite films.
The possible attributions of the main vibration bands were determined and given in Table 2.
Table 2.
The IR absorption bands of the epoxy resin, Ep/SnO2 0.15 vol.fr and Ep/ZnO 0.15 vol.fr nanocomposite films.
The peaks at 760 cm−1 and 1472 cm−1 confirm the presence of the SnO2 band (Sn–O stretching), while the peak at 830 cm−1 is attributed to the epoxy resin (C–O–C bond stretching) [61,62].
Other peaks at 1040 cm−1, 1180 cm−1, and 1260 cm−1 are associated with the C–O–C stretching vibrations of the epoxy ring and ether bonds. The peak at 1514 cm−1 reveals the presence of an aromatic C=C stretch originating from aromatic groups such as bisphenol A, and the peak at 1740 cm−1 corresponds to a C=O stretch (carbonyl group), probably due to esters or carboxylic acids. The appearance of the peaks at 2030 cm−1 and 2160 cm−1 reveals the presence of the C≡C (alkyne groups) or C≡N (nitrile groups) stretch. The appearance of the peak at 1514 cm−1 reveals the presence of the Aromatic C=C stretching (from aromatic groups, e.g., bisphenol A) [62,63].
The infrared spectrum of the epoxy resin containing ZnO reveals characteristic peaks corresponding to various functional groups. While the 1899 cm−1 peak is likely C=O stretching from ester or carbonyl groups. The 1770 cm−1 peak confirms the presence of aryl alkyl esters with C=O stretching, and the 1635 cm−1 peak likely associated with C=C stretching (aromatic) possibly from the phenolic group of bisphenol A or other aromatic components in the resin. The 1466 cm−1 peak indicates C=C stretching in aromatic groups, commonly found in bisphenol A. The appearance of the peaks at 1292 cm−1, 1236 cm−1, and 890 cm−1 are associated with C–O stretching and distortion vibrations in the epoxy resin, specifically in the ether and epoxy groups [64,65,66,67,68].
The peak at around 1033 cm−1 were characteristic peaks of the Zn-O bonding [65,66,67,68].
Hence, the IR bands confirmed the formation of Epoxy/SnO2 and ZnO nanoparticles, which can be correlated with the XRD results.
3.2. Morphological Characterization
Three types of films were analyzed: neat epoxy, epoxy/ZnO (0.15 vol.fr), and epoxy/SnO2 (0.15 vol.fr). All SEM images were captured at the same magnification and are presented in Figure 4.
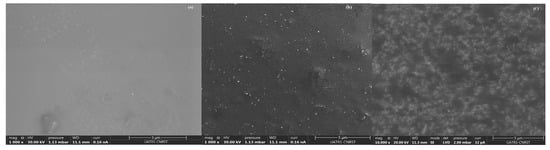
Figure 4.
SEM images of nanocomposite films: (a) Neat epoxy, (b) Ep/SnO2 (0.15 vol.fr) and (c) Ep/ZnO (0.15 vol.fr).
Figure 4 Scanning electron microscopy (SEM) images of the fracture surfaces of (a) pure epoxy, (b) Ep/0.15 vol. SnO2, and (c) Ep/0.15 vol. ZnO. All images have been optimized for brightness and contrast.
The fracture surface of pure epoxy (Figure 4a) is smooth and uniform, characteristic of a brittle thermosetting resin with homogeneous crosslinking.
In contrast, the two nanocomposites (Figure 4b,c) exhibit numerous bright spots evenly distributed throughout the epoxy matrix. The absence of large agglomerates indicates efficient dispersion at the low filler concentration studied (0.15 vol.fr).
Figure 5 shows the EDX spectra of the nanocomposites (a) epoxy/ZnO 0.15 vol.fr and (b) epoxy/SnO2 0.15 vol.fr. The EDX spectrum of the ZnO-filled composite (Figure 5a) shows the characteristic zinc peaks, as well as intense carbon and oxygen peaks from the epoxy matrix, confirming the incorporation of the ZnO nanoparticles. The spectrum of the SnO2-filled composite (Figure 5b) shows the expected tin peaks, as well as carbon and oxygen peaks from the polymer matrix, confirming the presence of SnO2 in the latter. The combined SEM and EDX analyses demonstrate the successful integration and dispersion of the ZnO and SnO2 nanoparticles within the epoxy matrix.
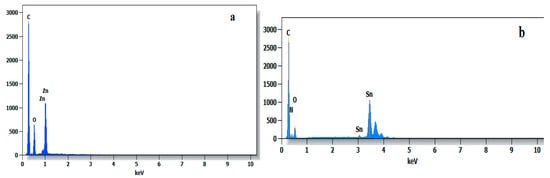
Figure 5.
EDX spectrum of (a) Ep/ZnO 0.15 and (b) Ep/SnO2 0.15 vol.fr composite.
3.3. Water Absorption Tests
We performed water absorption tests by immersing the prepared samples in water at 60 °C for one month. We then dried the membranes at room temperature and weighed the samples immediately after that. Using the following equation, the weight gain for different loads was calculated [69]:
where represents the water absorption percentage, is the weight of the samples before immersion, and is the weight after the water absorption test.
Negligible water absorption was detected for the films prepared as shown in Table 3. These results suggest excellent moisture resistance, making these materials well suited for various applications, especially in high humidity environments.
Table 3.
Water absorption tests for Ep/ZnO and Ep/SnO2 nanocomposite films.
3.4. Optical Properties
The observed spectra (Figure 6) clearly show a decrease in transmittance as the oxide content increases (0.05, 0.10 and 0.15 in volume fraction). This is explained by a more intense absorption to be measured as the oxide charge content increases [70,71,72,73].
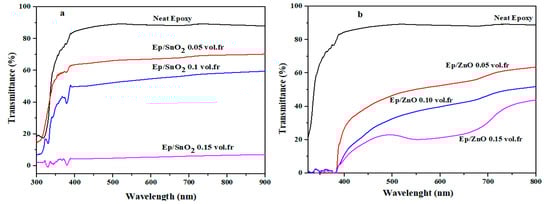
Figure 6.
Transmittance UV–Vis spectra of (a) Ep/SnO2 and (b) Ep/ZnO nanocomposite films.
This behavior is essential for device fabrication and for controlling luminous efficiency through tailored transmittance or absorbance.
From the results obtained, the optical characteristics (thickness and refractive index), the gap energy, the absorption coefficient, and the Urbach parameter can be calculated.
For all films studied, it is observed that increasing the filler loading leads to a decrease in transmittance in the visible range. This effect is particularly marked at the highest loading (0.15 vol.fr), where the transmittance of both SnO2 and ZnO filled films decreases more significantly. This behavior is attributed to increased light absorption and scattering by the higher concentration of metal oxide nanoparticles. Such controlled reduction in transmittance is highly valuable for applications requiring tunable optical properties or UV-shielding while retaining partial visible transparency.
Using the mean square method, the experimental curves (αhν) obtained for photon energy hν (Figure 7) were fitted with Equation 11 in the quasi-rectilinear region. The results are obtained with good correlation factors.
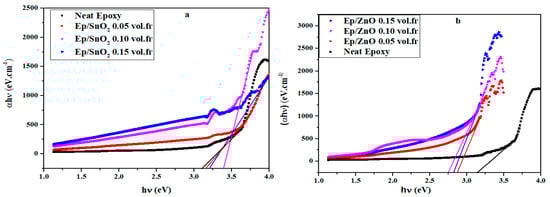
Figure 7.
Optical transition type determined by plotting (αhν) versus (hν) using mean square fit of Equation (11) of (a) Ep/SnO2 and (b) Ep/ZnO nanocomposite films.
The obtained parameters (n and Eg) are presented in Table 4, and the results are represented by solid lines in Figure 7.
Table 4.
The optical parameters of Ep/oxides nanocomposite films.
This study allows us to determine whether the transition type of the prepared films is direct (n = 1/2) or indirect (n = 2). The plot of (αhν)2 and (αhν)1/2 as a function of hν (Figure 8), using n as the obtained power factor, gives good agreement between the band gaps and Tauc slopes (Table 4).
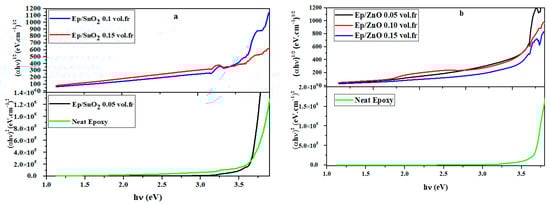
Figure 8.
Determination of type of transition of (a) Ep/SnO2 and (b) Ep/ZnO nanocomposite films.
The band gap value obtained for pure epoxy (Eg = 3.14 eV) remains relatively high, confirming the essentially insulating nature of the matrix and its excellent optical transparency in the visible range. For the lowest oxide fraction (Ep/SnO2 0.05 vol.fr), the electronic transitions remain predominantly direct (n = 0.5), whereas for higher oxide concentrations, the transition becomes indirect (n = 2), as shown by the linear fit obtained from the Tauc diagrams of (αhν)1/2 versus hν (Figure 7) [74].
A decrease in the band gap Eg is observed with increasing oxide volume fraction, from 3.14 eV for pure epoxy to 3.10 eV for Ep/SnO2 0.15 vol. and 2.82 eV for Ep/ZnO 0.15 vol. However, for Ep/SnO2 at 0.05 and 0.10 vol.fr, a slight increase in Eg is observed (3.17 and 3.38 eV, respectively), which is attributed to improved local ordering and surface polarization effects induced by well-dispersed SnO2 nanoparticles at low loading [75]. This reduction, accompanied by an increase in Urbach energy, is due to the creation of localized states within the band gap and a higher degree of structural disorder induced by strong interfacial interactions between the epoxy matrix and the fillers [76]. The addition of these fillers promotes the formation of additional defect states and reinforces phonon vibrations at the matrix/filler interface. These phonons contribute to the conservation of momentum, which characterizes indirect transitions. This effect becomes dominant only at higher filler concentrations, coherently with the observed change from n = 0.5 to n = 2.
The Urbach energy is defined using the relationship between (α) and (hν) by Equation (12). It is associated with the band gap energy. It characterizes the disorder or structural anomalies of the solid, which produce extended localized states in the band gap. It is calculated as the exponential bandwidth of the band gap energy of the localized states, near the band edges [69].
The evolution of the absorption coefficient (α) as a function of photon energy (hν) shows that the incorporation of metal oxide nanoparticles (SnO2 and ZnO) into the epoxy matrix induces only a moderate and non-monotonic increase in optical absorption in the UV region (Figure 9). For the Ep/SnO2 series, the absorption coefficient even slightly decreases when passing from 0.10 to 0.15 vol.fr, whereas the ZnO-filled films exhibit a small enhancement at the highest loading. The absorption edge of all nanocomposites remains very close to that of neat epoxy, with only a very subtle shift towards lower energies observed at the highest ZnO concentration (0.15 vol.fr). This minor change is consistent with the slight decrease measured in the optical band gap Eg and reflects the formation of hybrid electronic states at the polymer/oxide interface. Furthermore, increasing the oxide concentration promotes interfacial interactions that facilitate indirect electronic transitions involving electron–phonon interactions. This controlled UV absorption combined with the retention of good visible-range transparency makes these nanocomposites particularly suitable for transparent UV-shielding coatings and protective layers in optoelectronic devices [77,78,79].
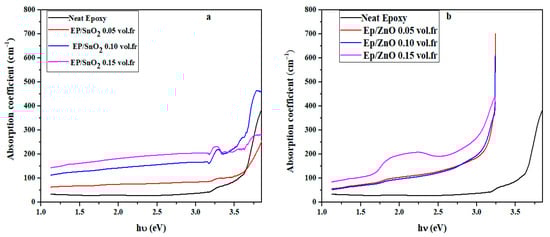
Figure 9.
The absorption coefficient (α) varies as a function of photon energy (hν) of (a) Ep/SnO2 and (b) Ep/ZnO nanocomposite films.
The ln(α) vs. (hν) plot is close to the absorption edge. The Urbach energy Eu is determined by the inverse slope of the rectilinear behavior. The results obtained are presented in Table 4.
Figure 10 show that the addition of SnO2 and ZnO nanoparticles broadens the Urbach tail: ln(α) increases and the slope of the quasi-linear region decreases, which leads to an increase in the Urbach energy Eu [80]. This result indicates a densification of localized states and an increase in interface structural disorder with the moderate and non-monotonic variation observed in the optical band gap Eg [81].
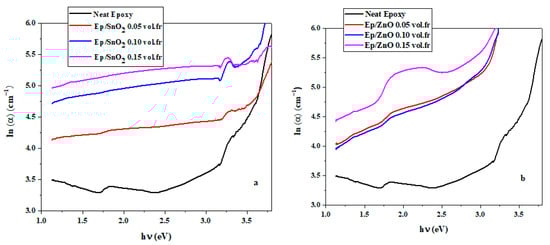
Figure 10.
Establishment of the Urbach energy using ln(α) as a function of photon energy (hν) for (a) Ep/SnO2 and (b) Ep/ZnO nanocomposite films.
Figure 11 illustrates the simultaneous evolution of the optical band gap energy Eg and the Urbach energy Eu of filled epoxy composites as a function of the oxide volume fraction.
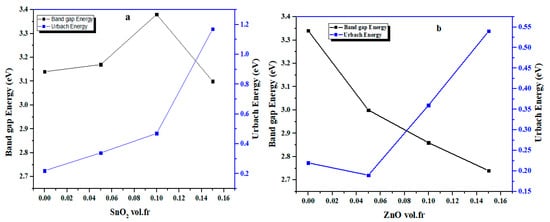
Figure 11.
Variation in band gap (Eg) and Urbach energy (Eu) of (a) Ep/SnO2 and (b) Ep/ZnO nanocomposite films vs. volume fraction.
For ZnO-filled epoxy, an increase in the Urbach energy and a progressive decrease in Eg are observed with increasing filler content.
In contrast, SnO2 filled epoxy exhibits a slight initial increase in the band gap energy Eg up to 0.10 vol.fr, followed by a moderate decrease at 0.15 vol.fr, while the Urbach energy Eu increases with the SnO2 concentration.
In both cases, the increase in the Urbach energy reflects greater structural disorder and a higher density of localized states at the polymer/nanoparticle interface. These interfacial interactions modify the electronic structure of the epoxy matrix, inducing the observed variations in the optical band gap and facilitating indirect electronic transitions.
The decrease in the band gap and the increase in the Urbach energy for Ep/ZnO, due to the creation of localized states at the interface, prevent a slight improvement in optical absorption while maintaining good transparency in the visible range. This behavior makes these Ep/ZnO nanocomposites particularly interesting for potential applications in UV protection and transparent coatings with controlled absorption.
For Ep/SnO2 nanocomposites, the variation in the optical band gap combined with the sharp increase in the Urbach energy to 0.15 vol.fr indicates a significant increase in structural disorder at the interface without a substantial change in visible absorption. This behavior suggests that Ep/SnO2 could be advantageous for applications requiring very high optical transparency combined with improved structural stability or enhanced dielectric properties.
4. Conclusions
In this study, we developed epoxy/Oxides nanocomposite films using a simple and less expensive synthetic method, and then performed a detailed study of the structural, morphological and optical properties of the prepared materials.
The studies show good homogeneity and chemical stability of the films. Optical studies show that increasing the oxide content (SnO2 and ZnO) leads to a decrease in the band gap energy Eg and an increase in the Urbach energy Eu, which means that there is a structural disorder effect, especially for Ep/SnO2 films, revealing a very strong interaction between the matrix and the filler, and Ep/ZnO composites, presenting a weaker optical disorder.
Comparing these two systems, Ep/SnO2 composites appear to be the most promising material for energy storage applications, while Ep/ZnO material is better suited to applications requiring low and good dielectric stability.
Their chemical stability and recyclability enhance their durability, offering an environmentally friendly solution. Furthermore, the simplicity and low cost of synthesis make these nanocomposites competitive for industrial-scale production. Future work should explore in more detail the applicability of these materials in concrete devices, such as energy storage modules and dielectric components.
Author Contributions
Conceptualization, N.E.G.; methodology, N.E.G.; formal analysis, A.E.H. (Amine El Haimeur), K.N., A.M. and A.E.H. (Adnane El Hamidi); investigation, (Amine El Haimeur) and K.N. for morphological and structural characterization, and A.M. and A.E.H. (Adnane El Hamidi) for optical characterization; data curation, N.E.G.; writing—original draft preparation, N.E.G.; writing—review and editing, A.E.H. (Amine El Haimeur), K.N., A.M. and A.E.H. (Adnane El Hamidi); visualization, N.E.G.; supervision, N.E.G.; project administration, N.E.G.; funding acquisition, N.E.G. All authors have read and agreed to the published version of the manuscript.
Funding
This research received no external funding. The article processing charge (APC) will be covered by the corresponding author. This research article has not received any financial support or external funding. The lack of funding is due to limited budget resources, as the lab currently operates under financial constraints. As a result, the research was conducted without any external financial backing, and all work was completed using available internal resources.
Data Availability Statement
The data presented in this study are available on reasonable request from the corresponding author. The data are not publicly available due to laboratory confidentiality restrictions and large file size constraints.
Conflicts of Interest
The authors declare n conflict of interest
References
- Sharma, S.; Mishra, M.; Sharma, H.; Chauhan, A.S.; Das, B.; Rajput, D.; Pandey, V.; Tripathi, R.B.; Sharma, R. Polymeric nanocomposites: Recent advances, challenges, techniques, and biomedical applications. Arch. Biochem. Biophys. 2025, 83, 1019–1039. [Google Scholar] [CrossRef]
- Shameem, M.M.; Sm, S.; Raja, A.; Rajendra, G.R. A brief review on polymer nanocomposites and its applications. Mater. Today Proc. 2021, 45, 2536–2539. [Google Scholar] [CrossRef]
- Li, L.; Han, L.; Hu, H.; Zhang, R. A review on polymers and their composites for flexible electronics. Mater. Adv. 2023, 4, 726–746. [Google Scholar] [CrossRef]
- Fu, S.; Sun, Z.; Huang, P.; Li, Y.; Hu, N. Some basic aspects of polymer nanocomposites: A critical review. Nano Mater. Sci. 2019, 1, 2–30. [Google Scholar] [CrossRef]
- Deng, Y.; Wong, Y.W.; Teh, L.K.Y.; Wang, Q.; Sun, W.; Chern, W.K.; Oh, J.T.; Chen, Z. Optimizing dielectric, mechanical, and thermal properties of epoxy resin through molecular design for multifunctional performance. Mater. Horiz. 2025, 12, 1323–1333. [Google Scholar] [CrossRef]
- Fekiač, J.J.; Krbata, M.; Kohutiar, M.; Janík, R.; Kakošová, L.; Breznická, A.; Eckert, M.; Mikuš, P. Comprehensive review: Optimization of epoxy composites, mechanical properties, and technological trends. Polymers 2025, 17, 271. [Google Scholar] [CrossRef] [PubMed]
- Gupta, V.; Bankapalli, N.K.; Saxena, P.; Bajpai, A.; Ruan, D. Additive Manufacturing of Fiber-Reinforced Polymer Matrix Composites through Material Extrusion: A Comprehensive Review on Filament Fabrication, Printing, Testing Methods, Applications, and Challenges. Adv. Eng. Mater. 2025, 27, 2500676. [Google Scholar] [CrossRef]
- Belyamani, I.; Prochazka, F.; Assezat, G. Production and characterization of sodium caseinate edible films made by blown-film extrusion. J. Food Eng. 2014, 121, 39–47. [Google Scholar] [CrossRef]
- Mehwish, N.; Kausar, A.; Siddiq, M. High-performance polyvinylidene fluoride/poly(styrene–butadiene–styrene)/functionalized MWCNTs-SCN-Ag nanocomposite membranes. Iran. Polym. J. 2015, 24, 549–559. [Google Scholar] [CrossRef]
- Vu, P.G.; Truc, T.A.; Chinh, N.T.; Tham, D.Q.; Trung, T.H.; Oanh, V.K.; Hang, T.T.X.; Olivier, M.; Hoang, T. Improvement of mechanical and dielectric properties of epoxy resin using CNTs/ZnO nanocomposite. J. Nanosci. Nanotechnol. 2018, 18, 2830–2837. [Google Scholar] [CrossRef] [PubMed]
- Krieg, A.S.; King, J.A.; Odegard, G.M.; Leftwich, T.R.; Odegard, L.K.; Fraley, P.D.; Miskioglu, I.; Jolowsky, C.; Lundblad, M.; Park, J.G.; et al. Mechanical properties and characterization of epoxy composites containing highly entangled as-received and acid treated carbon nanotubes. Nanomaterials 2021, 11, 2445. [Google Scholar] [CrossRef] [PubMed]
- Hu, H.; Zhang, X.; Zhang, D.; Gao, J.; Hu, C.; Wang, Y. Study on the Nonlinear Conductivity of SiC/ZnO/Epoxy Resin Micro- and Nanocomposite Materials. Materials 2019, 12, 761. [Google Scholar] [CrossRef]
- Wazalwar, R.; Sahu, M.; Raichur, A.M. Mechanical properties of aerospace epoxy composites reinforced with 2D nano-fillers: Current status and road to industrialization. Nanoscale Adv. 2021, 3, 2741–2776. [Google Scholar] [CrossRef]
- Şomoghi, R.; Semenescu, A.; Pasăre, V.; Chivu, O.R.; Nițoi, D.F.; Marcu, D.F.; Florea, B. The impact of ZnO nanofillers on the mechanical and anti-corrosion performances of epoxy composites. Polymers 2024, 16, 2054. [Google Scholar] [CrossRef]
- Dallaev, R.; Pisarenko, T.; Papež, N.; Sadovský, P.; Holcman, V. A Brief Overview on Epoxies in Electronics: Properties, Applications, and Modifications. Polymers 2023, 15, 3964. [Google Scholar] [CrossRef]
- Tachikawa, S.; Noguchi, A.; Tsuge, T.; Hara, M.; Odawara, O.; Wada, H. Optical Properties of ZnO Nanoparticles Capped with Polymers. Materials 2011, 4, 1132–1144. [Google Scholar] [CrossRef]
- Abd-Elnaiem, A.M.; Rashad, M.; Hanafy, T.A.; Shaalan, N.M. Improvement of Optical Properties of Functionalized Polyvinyl Alcohol-Zinc Oxide Hybrid Nanocomposites for Wide UV Optoelectronic Applications. J. Inorg. Organomet. Polym. Mater. 2023, 33, 2429–2444. [Google Scholar] [CrossRef]
- Goswami, Y.C.; Bisauriya, R.; Goswami, R.; Hlaing, A.A.; Moe, T.T. Hydrothermal synthesis of SnO2/cellulose nanocomposites: Optical, structural, and morphological characterization. Sci. Rep. 2025, 15, 9752. [Google Scholar] [CrossRef] [PubMed]
- Ambrosio, R.; Carrillo, A.; Mota, M.L.; De la Torre, K.; Torrealba, R.; Moreno, M.; Vazquez, H.; Flores, J.; Vivaldo, I. Polymeric nanocomposites membranes with high permittivity based on PVA-ZnO nanoparticles for potential applications in flexible electronics. Polymers 2018, 10, 1370. [Google Scholar] [CrossRef]
- Tababouchet, M.Y.; Sakri, A.; Bouremel, C.; Boutarfaia, A. Synthesis of Polyaniline-Zinc Oxide Composites: Assessment of Structural, Morphological, and Electrical Properties. Ann. Chim. Sci. Matériaux 2023, 47, 399–404. [Google Scholar] [CrossRef]
- Abdullah, O.G.; Salman, Y.A.K.; Tahir, D.A.; Jamal, G.M.; Ahmed, H.T.; Mohamad, A.H.; Azawy, A.K. Effect of ZnO nanoparticle content on the structural and ionic transport parameters of polyvinyl alcohol based proton-conducting polymer electrolyte membranes. Membranes 2021, 11, 163. [Google Scholar] [CrossRef]
- Sirelkhatim, A.; Mahmud, S.; Seeni, A.; Kaus, N.H.M.; Ann, L.C.; Bakhori, S.K.M.; Hasan, H.; Mohamad, D. Review on Zinc Oxide Nanoparticles: Antibacterial Activity and Toxicity Mechanism. Nano Micro Lett. 2015, 7, 219–242. [Google Scholar] [CrossRef]
- Długosz, O.; Szostak, K.; Banach, M. Photocatalytic properties of zirconium oxide–zinc oxide nanoparticles synthesised using microwave irradiation. Nano Micro Lett. 2020, 10, 941–954. [Google Scholar] [CrossRef]
- AlAhzm, A.M.; Alejli, M.O.; Ponnamma, D.; Elgawady, Y.; Al-Maadeed, M.A.A. Piezoelectric properties of zinc oxide/iron oxide-filled polyvinylidene fluoride nanocomposite fibers. J. Mater. Sci. Mater. Electron. 2021, 32, 14610–14622. [Google Scholar] [CrossRef]
- Becheri, A.; Dürr, M.; Lo Nostro, P.; Baglioni, P. Synthesis and characterization of zinc oxide nanoparticles: Application to textiles as UV-absorbers. J. Nanopart. Res. 2008, 10, 679–689. [Google Scholar] [CrossRef]
- Chouhan, S.; Bajpai, A.K.; Bajpai, J.; Katare, R.; Dhoble, S.J. Mechanical and UV absorption behavior of zinc oxide nanoparticles: Reinforced poly(vinyl alcohol-g-acrylonitrile) nanocomposite films. Polym. Bull. 2017, 74, 4119–4141. [Google Scholar] [CrossRef]
- Wu, Y.; Cai, L.; Mei, C.; Lam, S.S.; Sonne, C.; Shi, S.Q.; Xia, C. Development and evaluation of zinc oxide-blended kenaf fiber biocomposite for automotive applications. Mater. Today Commun. 2020, 24, 101008. [Google Scholar] [CrossRef]
- Akande, I.G.; Kazeem, R.A.; Oluwole, O.O.; Jen, T.C.; Akinlabi, E.T. Production and characterization of low-density silicon nitride reinforced zinc nanocomposite coatings on mild steel for applications in marine and automotive industries. Heliyon 2024, 10, e36000. [Google Scholar] [CrossRef] [PubMed]
- Ezzat, H.A.; Sebak, M.A.; Aladim, A.K.; Shahat, M.A. Experimental and theoretical strategies for multidisciplinary PTFE@TiO2-based microfibres loaded with multiple metal oxides for anti-corrosion and self-cleaning aerospace applications. J. Inorg. Organomet. Polym. Mater. 2025, 35, 7820–7841. [Google Scholar] [CrossRef]
- Lee, B.R.; Goo, J.S.; Kim, Y.W.; You, Y.-J.; Kim, H.; Lee, S.-K.; Shim, J.W.; Kim, T.G. Highly efficient flexible organic photovoltaics using quasi-amorphous ZnO/Ag/ZnO transparent electrodes for indoor applications. J. Power Sources 2019, 417, 61–69. [Google Scholar] [CrossRef]
- Nkele, A.C.; Nwankwo, U.; Alshoaibi, A.; Ezema, F.I. One-step spin-coating of methylammonium lead iodide on SILAR-deposited tin oxide, SnO2 films for effective electron transport. Results Opt. 2023, 13, 100521. [Google Scholar] [CrossRef]
- Yadav, A.; Sayyed, M.I.; Ahmad, N.; Vargas-Portugal, S.K.; Alshehri, A.M.; Taki, A.G.; Thabit, R.; Adhab, A.H. Synergizing tin dioxide/perovskite interface with fluorine-doped zinc oxide for stabilized and efficient carbon-based perovskite solar cells. Opt. Mater. 2023, 144, 114325. [Google Scholar] [CrossRef]
- Ganesan, M.; Farooq, M.U.; Li, J.; Mohan, M.K.; Wang, F. Ultrasensitive gas sensor based on Gd modified SnO2 for nitrogen dioxide detection at low temperature. Sens. Actuators B Chem. 2025, 443, 138190. [Google Scholar] [CrossRef]
- Jayapandi, S.; Premkumar, S.; Ramakrishnan, V.; Lakshmi, D.; Shanavas, S.; Acevedo, R.; Anitha, K. Enhanced visible light photocatalytic performance of SnO2 nanoparticle co-doped with (Co, Nb) for organic dye degradation. J. Mater. Sci. Mater. Electron. 2020, 31, 10689–10701. [Google Scholar] [CrossRef]
- Kumari, K.; Mishra, S.R.; Gadore, V.; Moyon, N.S.; Ahmaruzzaman, M. Efficient visible-light photocatalysis using Fe-doped SnO2/chitosan composite for organic pollutant degradation: Mechanisms, reusability, and sustainability. J. Mater. Sci. Mater. Electron. 2025, 35, 6853–6876. [Google Scholar] [CrossRef]
- Bouras, D.; Fellah, M.; Mohammed, D.Z.; Barille, R.; Obrosov, A.; El-Hiti, G.A.; Guesmi, A.; Khezami, L. Enhanced CO2 sensing properties of Fe/Al-doped SnO2 thin films: A comprehensive study of structural, optical, and electrical characteristics. J. Alloys Compd. 2025, 1034, 181387. [Google Scholar] [CrossRef]
- Bekhoukh, A.; Moulefera, I.; Sabantina, L.; Benyoucef, A. Development, Investigation, and Comparative Study of the Effects of Various Metal Oxides on Optical Electrochemical Properties Using a Doped PANI Matrix. Polymers 2021, 13, 3344. [Google Scholar] [CrossRef] [PubMed]
- Christopoulos, S.; Angastiniotis, N.C.; Laux-Le Guyon, V.; Bsaibess, E.; Koutsokeras, L.; Duponchel, B.; El-Rifai, J.; Li, L.; Slimani, A. Comparative Study of Polyethylene Films Embedded with Oxide Nanoparticles of Granulated and Free-Standing Nature. Polymers 2022, 14, 2629. [Google Scholar] [CrossRef] [PubMed]
- Baziak, A.; Kusior, A. Comparative Study of Polymer-Modified Copper Oxide Electrochemical Sensors: Stability and Performance Analysis. Sensors 2024, 24, 5290. [Google Scholar] [CrossRef]
- Sengwa, R.J.; Dhatarwal, P.; Choudhary, S. A comparative study of different metal oxide nanoparticles dispersed PVDF/PEO blend matrix-based advanced multifunctional nanodielectrics for flexible electronic devices. Mater. Today Commun. 2020, 25, 101380. [Google Scholar] [CrossRef]
- Sengwa, R.J.; Dhatarwal, P.; Choudhary, S. Polymer nanocomposites comprising PMMA matrix and ZnO, SnO2, and TiO2 nanofillers: A comparative study of structural, optical, and dielectric properties for multifunctional technological applications. Opt. Mater. 2021, 113, 110837. [Google Scholar] [CrossRef]
- Arzac, A.; Leal, G.P.; Fajgar, R.; Tomovska, R. Comparison of the Emulsion Mixing and In Situ Polymerization Techniques for Synthesis of Water-Borne Reduced Graphene Oxide/Polymer Composites: Advantages and Drawbacks. Part. Part. Syst. Charact. 2014, 31, 200–208. [Google Scholar] [CrossRef]
- Bragg, W.L. The reflection of X-rays by crystals. Proc. R. Soc. A 1913, 88, 428–438. [Google Scholar] [CrossRef]
- Monshi, A.; Foroughi, M.R.; Monshi, M.R. Modified Scherrer Equation to Estimate More Accurately Nano-Crystallite Size Using XRD. World J. Nano Sci. Eng. 2012, 2, 154–160. [Google Scholar] [CrossRef]
- Sutapa, I.W.; Wahab, A.W.; Taba, P.; Nafie, N.L. Dislocation, crystallite size distribution and lattice strain of magnesium oxide nanoparticles. J. Phys. Conf. Ser. 2018, 979, 012021. [Google Scholar] [CrossRef]
- Manifacier, J.C.; Gasiot, J.; Fillard, J.P. A simple method for the determination of the optical constants n, k and the thickness of a weakly absorbing thin film. J. Phys. E Sci. Instrum. 1976, 9, 1002–1004. [Google Scholar] [CrossRef]
- Swanepoel, R. Determination of the thickness and optical constants of amorphous silicon. J. Phys. E Sci. Instrum. 1983, 16, 1214–1222. [Google Scholar] [CrossRef]
- Ghoubali, N.E.; Maaroufi, A.; Hamidi, A.E.; Amarani, A.E. Unlocking the energy potential of Moroccan bentonite clay: Structural, optical, and thermal insights for advanced applications. Discov. Appl. Sci. 2025, 7, 887. [Google Scholar] [CrossRef]
- Manifacier, J.C.; De Murcia, M.; Fillard, J.P.; Vicario, E. Optical and electrical properties of SnO2 thin films in relation to their stoichiometric deviation and their crystalline structure. Thin Solid Film. 1977, 41, 127–135. [Google Scholar] [CrossRef]
- Aly, S.A. Influence of film thickness on optical absorption and energy gap of thermally evaporated CdS0.1Se0.9 thin films. Chalcogenide Lett. 2015, 12, 489–496. [Google Scholar]
- Tauc, J.; Menth, A. States in the gap. J. Non-Cryst. Solids 1972, 8–10, 569–585. [Google Scholar] [CrossRef]
- Urbach, F. The long-wavelength edge of photographic sensitivity and of the electronic absorption of solids. Phys. Rev. 1953, 92, 1324. [Google Scholar] [CrossRef]
- Shao, J.; Liu, W.; Ding, J.; Wang, F.; Dong, J.; Zhang, J. Oxygen vacancy engineering of self-doped SnO2−x nanocrystals for ultrasensitive NO2 detection. J. Mater. Chem. C 2020, 8, 487–494. [Google Scholar] [CrossRef]
- Poloju, M.; Jayababu, N.; Manikandan, E.; Ramana Reddy, M.V. Enhancement of the isopropanol gas sensing performance of SnO2/ZnO core/shell nanocomposites. J. Mater. Chem. C 2017, 5, 1234–1240. [Google Scholar] [CrossRef]
- Liu, J.; Wang, W.; Yuen, R.K.K.; Gui, Z.; Hu, Y. 1/2D SnO2 nanowires on MnO2 nanosheets hybrid architecture for reducing fire hazards of epoxy nanocomposites. Compos. Part A Appl. Sci. Manuf. 2018, 107, 461–470. [Google Scholar] [CrossRef]
- Costa, I.M.; Colmenares, Y.N.; Pizani, P.S.; Leite, E.R.; Chiquito, A.J. Sb doping of VLS synthesized SnO2 nanowires probed by Raman and XPS spectroscopy. Chem. Phys. Lett. 2018, 695, 125–130. [Google Scholar] [CrossRef]
- Anu, M.A.; Pillai, S.S. Structure, thermal, optical and dielectric properties of SnO2 nanoparticles-filled HDPE polymer. Solid State Commun. 2022, 341, 114577. [Google Scholar] [CrossRef]
- Geetha Devi, P.; Sakthi Velu, A. Synthesis, structural and optical properties of pure ZnO and Co doped ZnO nanoparticles prepared by the co-precipitation method. J. Theor. Appl. Phys. 2016, 10, 233–240. [Google Scholar] [CrossRef]
- Salahuddin, N.; El-Kemary, M.; Ibrahim, E.M. High-performance flexible epoxy/ZnO nanocomposites with enhanced mechanical and thermal properties. Polym. Eng. Sci. 2017, 57, 2175–2184. [Google Scholar]
- Talam, S.; Karumuri, S.R.; Gunnam, N. Synthesis, characterization, and spectroscopic properties of ZnO nanoparticles. Int. Sch. Res. Not. 2012, 2012, 372505. [Google Scholar]
- Smith, B.C. The infrared spectra of polymers V: Epoxies. Spectroscopy 2022, 37, 17–19. [Google Scholar] [CrossRef]
- Mohanta, D.; Ahmaruzzaman, M. Biogenic synthesis of SnO2 quantum dots encapsulated carbon nanoflakes: An efficient integrated photocatalytic adsorbent for the removal of bisphenol A from aqueous solution. J. Alloys Compd. 2020, 828, 154093. [Google Scholar] [CrossRef]
- Zhang, Y.; Li, X.; Liu, Z. Blending modification of alicyclic resin and bisphenol A epoxy resin to enhance salt aging resistance for composite core rods. Polymers 2022, 14, 2394. [Google Scholar] [CrossRef]
- Ullah, R.; Wang, X. Molecular vibrations of bisphenol ‘S’ revealed by FTIR spectroscopy and their correlation with bisphenol ‘A’ disclosed by principal component analysis. Appl. Opt. 2018, 57, 4884–4891. [Google Scholar] [CrossRef]
- Şomoghi, R.; Mihai, S.; Teodorescu, G.-M.; Vuluga, Z.; Gabor, A.R.; Nicolae, C.-A.; Trică, B.; Stănescu Vătău, D.M.; Oancea, F.; Stănciulescu, C.M. Influence of HNT-ZnO nanofillers on the performance of epoxy resin composites for marine applications. Coatings 2024, 14, 532. [Google Scholar] [CrossRef]
- Baghdadi, Y.N.; Youssef, L.; Bouhadir, K.; Harb, M.; Mustapha, S.; Patra, D.; Tehrani-Bagha, A.R. The effects of modified zinc oxide nanoparticles on the mechanical/thermal properties of epoxy resin. J. Appl. Polym. Sci. 2020, 137, 49330. [Google Scholar] [CrossRef]
- Bashir, S.; Awan, M.S.; Farrukh, M.A.; Naidu, R.; Khan, S.A.; Rafique, N.; Ali, S.; Hayat, I.; Hussain, I.; Khan, M.Z. In-vivo (Albino mice) and in-vitro assimilation and toxicity of zinc oxide nanoparticles in food materials. Nanomaterials 2022, 12, 4073. [Google Scholar] [CrossRef] [PubMed]
- Aboorvakani, R.; Vethanathan, S.J.K.; Madhu, K.U. Influence of Zn concentration on zinc oxide nanoparticles and their anti-corrosion property. J. Alloys Compd. 2020, 834, 155078. [Google Scholar] [CrossRef]
- Bascheka, G.; Hartwiga, G.; Zahradnik, F. Effect of water absorption in polymers at low and high temperatures. Polymer 1999, 40, 3433–3441. [Google Scholar] [CrossRef]
- Effendy, N.; Sidek, H.A.A.; Halimah, M.K.; Zaid, M.H.M. Enhancement on thermal, elastic and optical properties of new formulation tellurite glasses: Influence of ZnO as a glass modifier. Mater. Chem. Phys. 2021, 273, 125156. [Google Scholar] [CrossRef]
- Chandrasekar, L.B.; Nagarajan, S.; Karunakaran, M.; Thangadurai, T.D. Structural, optical and electrical properties of undoped and doped ZnO thin films. In 2D Materials; IntechOpen: London, UK, 2019. [Google Scholar] [CrossRef]
- Ammaih, Y.; Hartiti, B.; Ridah, A.; Lfakir, A.; Soucase, B.M.; Thevenin, P. Effect of F-doping on structural, electrical, and optical properties of ZnO thin films for optoelectronic application. In Proceedings of the 2016 International Renewable and Sustainable Energy Conference (IRSEC), Marrakech, Morocco, 14–17 November 2016. [Google Scholar] [CrossRef]
- Sivakumar, P.; Akkera, H.S.; Kumar Reddy, T.R.; Bitla, Y.; Ganesh, V.; Mohan Kumar, P.; Srinivas Reddy, G.; Poloju, M. Effect of Ti doping on structural, optical and electrical properties of SnO2 transparent conducting thin films deposited by sol-gel spin coating. Opt. Mater. 2021, 113, 110845. [Google Scholar] [CrossRef]
- Muheddin, D.Q.; Aziz, S.B.; Mohammed, P.A. Variation in the Optical Properties of PEO-Based Composites via a Green Metal Complex: Macroscopic Measurements to Explain Microscopic Quantum Transport from the Valence Band to the Conduction Band. Polymers 2023, 15, 771. [Google Scholar] [CrossRef]
- Jasim, F.A.; Hassan, T.A.A. Study the Structural and Optical Properties (Energy Gap) of Polythiophene/MWCNT/SnO2 Nanocomposite as an NO2 Gas Sensor. Iraqi J. Phys. 2024, 22, 79–87. [Google Scholar] [CrossRef]
- Atisme, B.; Yu, C.-Y.; Tseng, E.N.; Chen, Y.-C.; Shu, P.-K.; Chen, S.-Y. Interface Interactions in Conjugated Polymer Composite with Metal Oxide Nanoparticles. Nanomaterials 2019, 9, 1534. [Google Scholar] [CrossRef]
- Mamand, D.M.; Aziz, D.M.; Khasraw, S.S.; Al-Azzawi, A.G.S.; Al-Saeedi, S.I.; Aziz, S.B.; Hassan, J. Improved optical characteristics of PEO polymer integrated with graphene oxide. Sci. Rep. Aug. 2025, 15, 16778. [Google Scholar] [CrossRef]
- Li, X.; Xiong, J.; Tang, Z.; He, W.; Wang, Y.; Wang, X.; Zhao, Z.; Wei, Y. Recent progress in metal oxide-based photocatalysts for CO2 reduction to solar fuels: A review. Molecules 2023, 28, 1653. [Google Scholar] [CrossRef]
- Khan, D.; Rehman, A.; Rafiq, M.Z.; Khan, A.M.; Ali, M. Improving the optical properties of SnO2 nanoparticles through Ni doping by sol-gel technique. Curr. Res. Green Sustain. Chem. 2021, 4, 100079. [Google Scholar] [CrossRef]
- Archana, K.J.; Preetha, A.C.; Balasubramanian, K. Influence of Urbach energy in enhanced photocatalytic activity of Cu doped ZnO nanoparticles. Opt. Mater. 2022, 127, 112245. [Google Scholar] [CrossRef]
- Ikhmayies, S.J.; Ahmad-Bitar, R.N. An investigation of the bandgap and Urbach tail of vacuum-evaporated SnO2 thin films. Renew. Energy 2013, 49, 143–146. [Google Scholar] [CrossRef]
Disclaimer/Publisher’s Note: The statements, opinions and data contained in all publications are solely those of the individual author(s) and contributor(s) and not of MDPI and/or the editor(s). MDPI and/or the editor(s) disclaim responsibility for any injury to people or property resulting from any ideas, methods, instructions or products referred to in the content. |
© 2025 by the authors. Licensee MDPI, Basel, Switzerland. This article is an open access article distributed under the terms and conditions of the Creative Commons Attribution (CC BY) license.