Abstract
One-minute and five-minute Apgar scores are good measures to assess the health status of newborns. A five-minute Apgar score can predict the risk of some disorders such as asphyxia, encephalopathy, cerebral palsy and ADHD. The early prediction of Apgar score before or during birth and ranking the risk factors can be helpful to manage and reduce the probability of birth producing low Apgar scores. Therefore, the main aim of this study is the early prediction of the neonate 5-min Apgar score before or during birth and ranking the risk factors for a big national dataset using big data analytics methods. In this study, a big dataset including 60 features describing birth cases registered in Iranian maternal and neonatal (IMAN) registry from 1 April 2016 to 1 January 2017 is collected. A distributed big data analytics method for the early prediction of neonate Apgar score and a distributed big data feature ranking method for ranking the predictors of neonate Apgar score are proposed in this study. The main aim of this study is to provide the ability to predict birth cases with low Apgar scores by analyzing the features that describe prenatal properties before or during birth. The top 14 features were identified in this study and used for training the classifiers. Our proposed stack ensemble outperforms the compared classifiers with an accuracy of 99.37 ± 1.06, precision of 99.37 ± 1.06, recall of 99.50 ± 0.61 and F-score of 99.41 ± 0.70 (for confidence interval of 95%) to predict low, moderate and high 5-min Apgar scores. Among the top predictors, fetal height around the baby’s head and fetal weight denote fetal growth status. Fetal growth restrictions can lead to low or moderate 5-min Apgar score. Moreover, hospital type and medical science university are healthcare system-related factors that can be managed via improving the quality of healthcare services all over the country.
1. Background
The Apgar score has been measured at 1 and 5 min after birth for neonates, and they are good predictors of birth outcome [1,2]. Apgar score ranges from 0 to 10 points, and its higher values are more desired. The Apgar scores have been considered as standardized, effective and convenient assessments for newborn infants, with widespread application by obstetricians.
An Apgar score of 7 or higher shows that the newborn has good to excellent health situations. Low Apgar scores at 5 min after birth have been diagnosed as an important risk factor poor survival for neonates [3], birth asphyxia [4] and ADHD [5].
Moreover, previous studies have shown that neonates having low 1-min or 5-min Apgar scores have been more likely to have a low IQ score [6]. Other previous studies have demonstrated that the developmental vulnerability at 5 years old is associated with a 5-min Apgar score [7].
To reduce neonate morbidity and mortality, identifying high-risk newborns based on 1-min and 5-min Apgar scores has been recommended in order to provide the required and appropriate healthcare services.
The previous studies have shown that the newborn mortality rate has been highest for 5-min Apgar scores lower than 3 independent of gestational age [8].
Previous studies have focused on identifying the main risk factors resulting in poor Apgar scores [9,10,11,12,13]. Their aim has been recognizing the risk factors that are manageable during pregnancy and delivery in order to produce childbirth resulting in a higher Apgar score.
However, to the best of our knowledge, most previous studies have considered a few risk factors on a small dataset that is collected from a small geographical region. Many previous studies have focused on data collected from only one hospital or care-providing center.
In this study, our aim is to use a big data analytics method for predicting the neonatal 5-min Apgar score and ranking pregnancy, labor and fetal risk factors for a big national dataset.
2. Related Works
In this section, we will review the previously related studies for Apgar score prediction. For this purpose, the related works are considered from several aspects, including the analyzed dataset characteristics, analytical model and the considered features and risk factors.
2.1. Dataset Characteristics Used in the Previous Studies
A previous study has conducted a case–control study in which the data have been collected from the obstetric discharge records for 1985-89. The dataset has included 939 newborns with Apgar scores lower than 7 and 2817 newborns with 1-min Apgar scores of 7 or higher [14].
Suka et al. considered 102 birth cases and 204 control cases producing full-term deliveries at a Japanese hospital. They have divided cases into 1-min low Apgar score (<8) and high (≥8) score [15].
Dassah et al. performed a retrospective cross-sectional study of vaginal deliveries at a teaching hospital in Ghana from 1 January to 31 December 2009. They have classified 1-min and 5-min Apgar scores into very low (≤3) and not very low (>3) classes. [16].
A cross-sectional, institutional study has been conducted considering 3058 deliveries during 2014 and 2015 in Portugal to find risk factors for 1-min Apgar scores lower than 7 [10].
A previous study conducted a cross-sectional study on singleton 261 live births from March to May 2013. Data gathering has been performed from mother/newborn index using a structured and pre-tested questionnaire. They have tried to find risk factors for 5-min Apgar score lower than 7 [12].
Another study performed a retrospective, cohort study of 58,429 term singleton birth cases at a hospital in Australia in 2007–2013 to find important variables discriminating low (≤3) or moderate (4–6) and high (≥7) 5-min Apgar scores [13].
Knutzen et al. analyzed data describing 8759 neonates at a single UK teaching hospital between 23 June 2005 and 31 December 2009 to assess the association of some specific features on 5-min Apgar scores below 7 [17].
Menreiros et al. collected 552 birth cases for assessing the association between fetal heart rate and 1-min and 5-min Apgar scores [18].
Deliveries numbering 4556 at the Federal Teaching Hospital, Abakaliki, from 1 January 2016 to 30 June 2018 have been analyzed by Enze et al. to verify the association beween the considered features and 1-min and 5-min Apgar scores lower than 7 [11].
A cross sectional study has performed by considering patient records for cesarean deliveries from 1 January 2016 to 30 December 2016 at a general hospital in Southern Ethiopia. They have focused on identifying the associated risk factors of 1-min poor Apgar scores (≤7) [19].
A retrospective study analyzing the maternal and neonatal clinical data of about 10,550 infants with gestational ages of 37 to 42 weeks of singleton pregnancies with vaginal delivery for January 2013 to July 2018 has been considered for identifying the risk factors of 1-min Apgar scores lower than 7 [20].
Another previous study has considered 4475 newborns producing an Apgar score higher than 3 and 154 newborns with a 1-min Apgar score lower than 3 [9].
2.2. Data Analytical Methods in the Previously Related Works
Some researchers have used statistical univariate and multivariate analyses for comparing the risk factors of different levels of Apgar scores [13,19]. Statistical multivariate analysis has been performed to find the association between risk factors and a low Apgar score [9].
Suka et al. performed multiple conditional logistic regression analyses on the input features for assessing the association between different risk factors with low Apgar scores [15].
Dassah et al. used binomial regression with a log-link function and population-attributable fractions for examining the association between risk factors and low Apgar scores [16].
Logistic regression has been used for investigating the predictive power of the considered features to predict occurring low Apgar scores as an adverse outcome [12,13,17,20].
Medeiros et al. used multivariate linear regression models for predicting the Apgar score from the input variables [18].
Enze et al. used elementary statistical analysis such as Student’s t-test and Pearson’s chi-squared test as well as the logistic regression method for assessing the effect of birth time on Apgar scores [11].
2.3. The Considered Predictors and Risk Factors in the Previous Studies
Different features and risk factors have been considered in the previous studies for Apgar score analyses.
A previous study concluded that low fetal weight and gestational age less than 37 weeks are risk factors associated with low Apgar scores, but race has not shown significant relation with Apgar scores [14].
Suka et al. considered maternal characteristics and pregnancy complications for predicting Apgar scores for neonates [15].
Background descriptors, maternal history and the vital status of the baby at birth have been considered in a previous study. The association between the risk factors with very low Apgar scores has been investigated [16].
Costa et al. showed that different delivery teams illustrate significantly different impacts on Apgar scores [10].
Maternal demographics and pregnancy factors and socio-economic descriptors were examined to find their association with Apgar scores [13].
A previous study has identified non-vertex fetal presentation, prolonged labor, presence of meconium stained liquor, induced/augmented labor and low birth weight as the main risk factors associated with low Apgar scores [12].
Previous studies have assessed the importance of some predictors of adverse outcomes among term neonates including low 5-min Apgar scores [17]. Knutzen et al. investigated the impact of arterial pH and arterial base deficit (ABD) on Apgar scores, and they have shown that there has been no significant association [17].
Medeiros et al. evaluated and confirmed the predictive ability of intrapartum fetal heart rates on Apgar scores [18].
The association between different delivery times and low Apgar scores has been investigated, and no significant relation has been confirmed [11].
A previous study has shown that anesthesia type, type of surgery, occurring pre-term birth, maternal preeclampsia and maternal anemia have had significant associations with poor Apgar scores in cesarean deliveries [19].
Maternal education, maternal body mass index (BMI), gestational age, pathological pregnancy, a longer duration of the second stage of labor, forceps delivery or vacuum extraction, neonatal weight and gender, and meconium-stained amniotic fluid have been identified as independent risk factors for low Apgar scores [20].
Finally, the associations between maternal, delivery and neonatal features with low Apgar scores have been examined in a previous study. They have concluded that eclampsia, twin pregnancy, analgesia, preterm birth and cesarean delivery have been the risk factors of low Apgar scores [9].
2.4. Summarizing the Previous Studies and Comparing with Our Study
To the best of our knowledge, many previous studies have focused on identifying risk factors associated with low 1-min Apgar scores and fewer studies have considered 5-min Apgar score. However, according to previous studies, a 5-min Apgar score is an important measure showing some abnormalities and disorders for neonates after birth. Therefore, our main focus in this study is prediction and ranking the predictors of low, moderate and high 5-min Apgar scores.
Moreover, the size of our considered dataset is very large and to the best of our knowledge, it is one of the largest dataset analyzed for Apgar score analysis until now.
From the aspect of data analytics methods, most previous studies have used statistical univariate or multivariate analysis or regression models such as logistic regression, linear regression and conditional models. This study has a main difference with the previous studies reviewed in this study in that it uses a distributed big data analytics method based on machine learning models in this study to predict and find the most important predictors of low, moderate and high 5-min Apgar scores.
The features and predictors considered in this study for Apgar score prediction are a combination of maternal characteristics and history, fetal features and delivery descriptors, which include some different features compared to the considered features in previous studies.
The main novelties of our proposed method lie in several dimensions, including the following:
- -
- Proposing a distributed big data analytics method for neonate Apgar score prediction;
- -
- Proposing a distributed big data-feature ranking method for ranking the predictors of neonate Apgar score;
- -
- Analyzing one of the biggest datasets for neonates Apgar score prediction;
- -
- Analyzing different feature sets for Apgar score prediction.
3. Materials and Methods
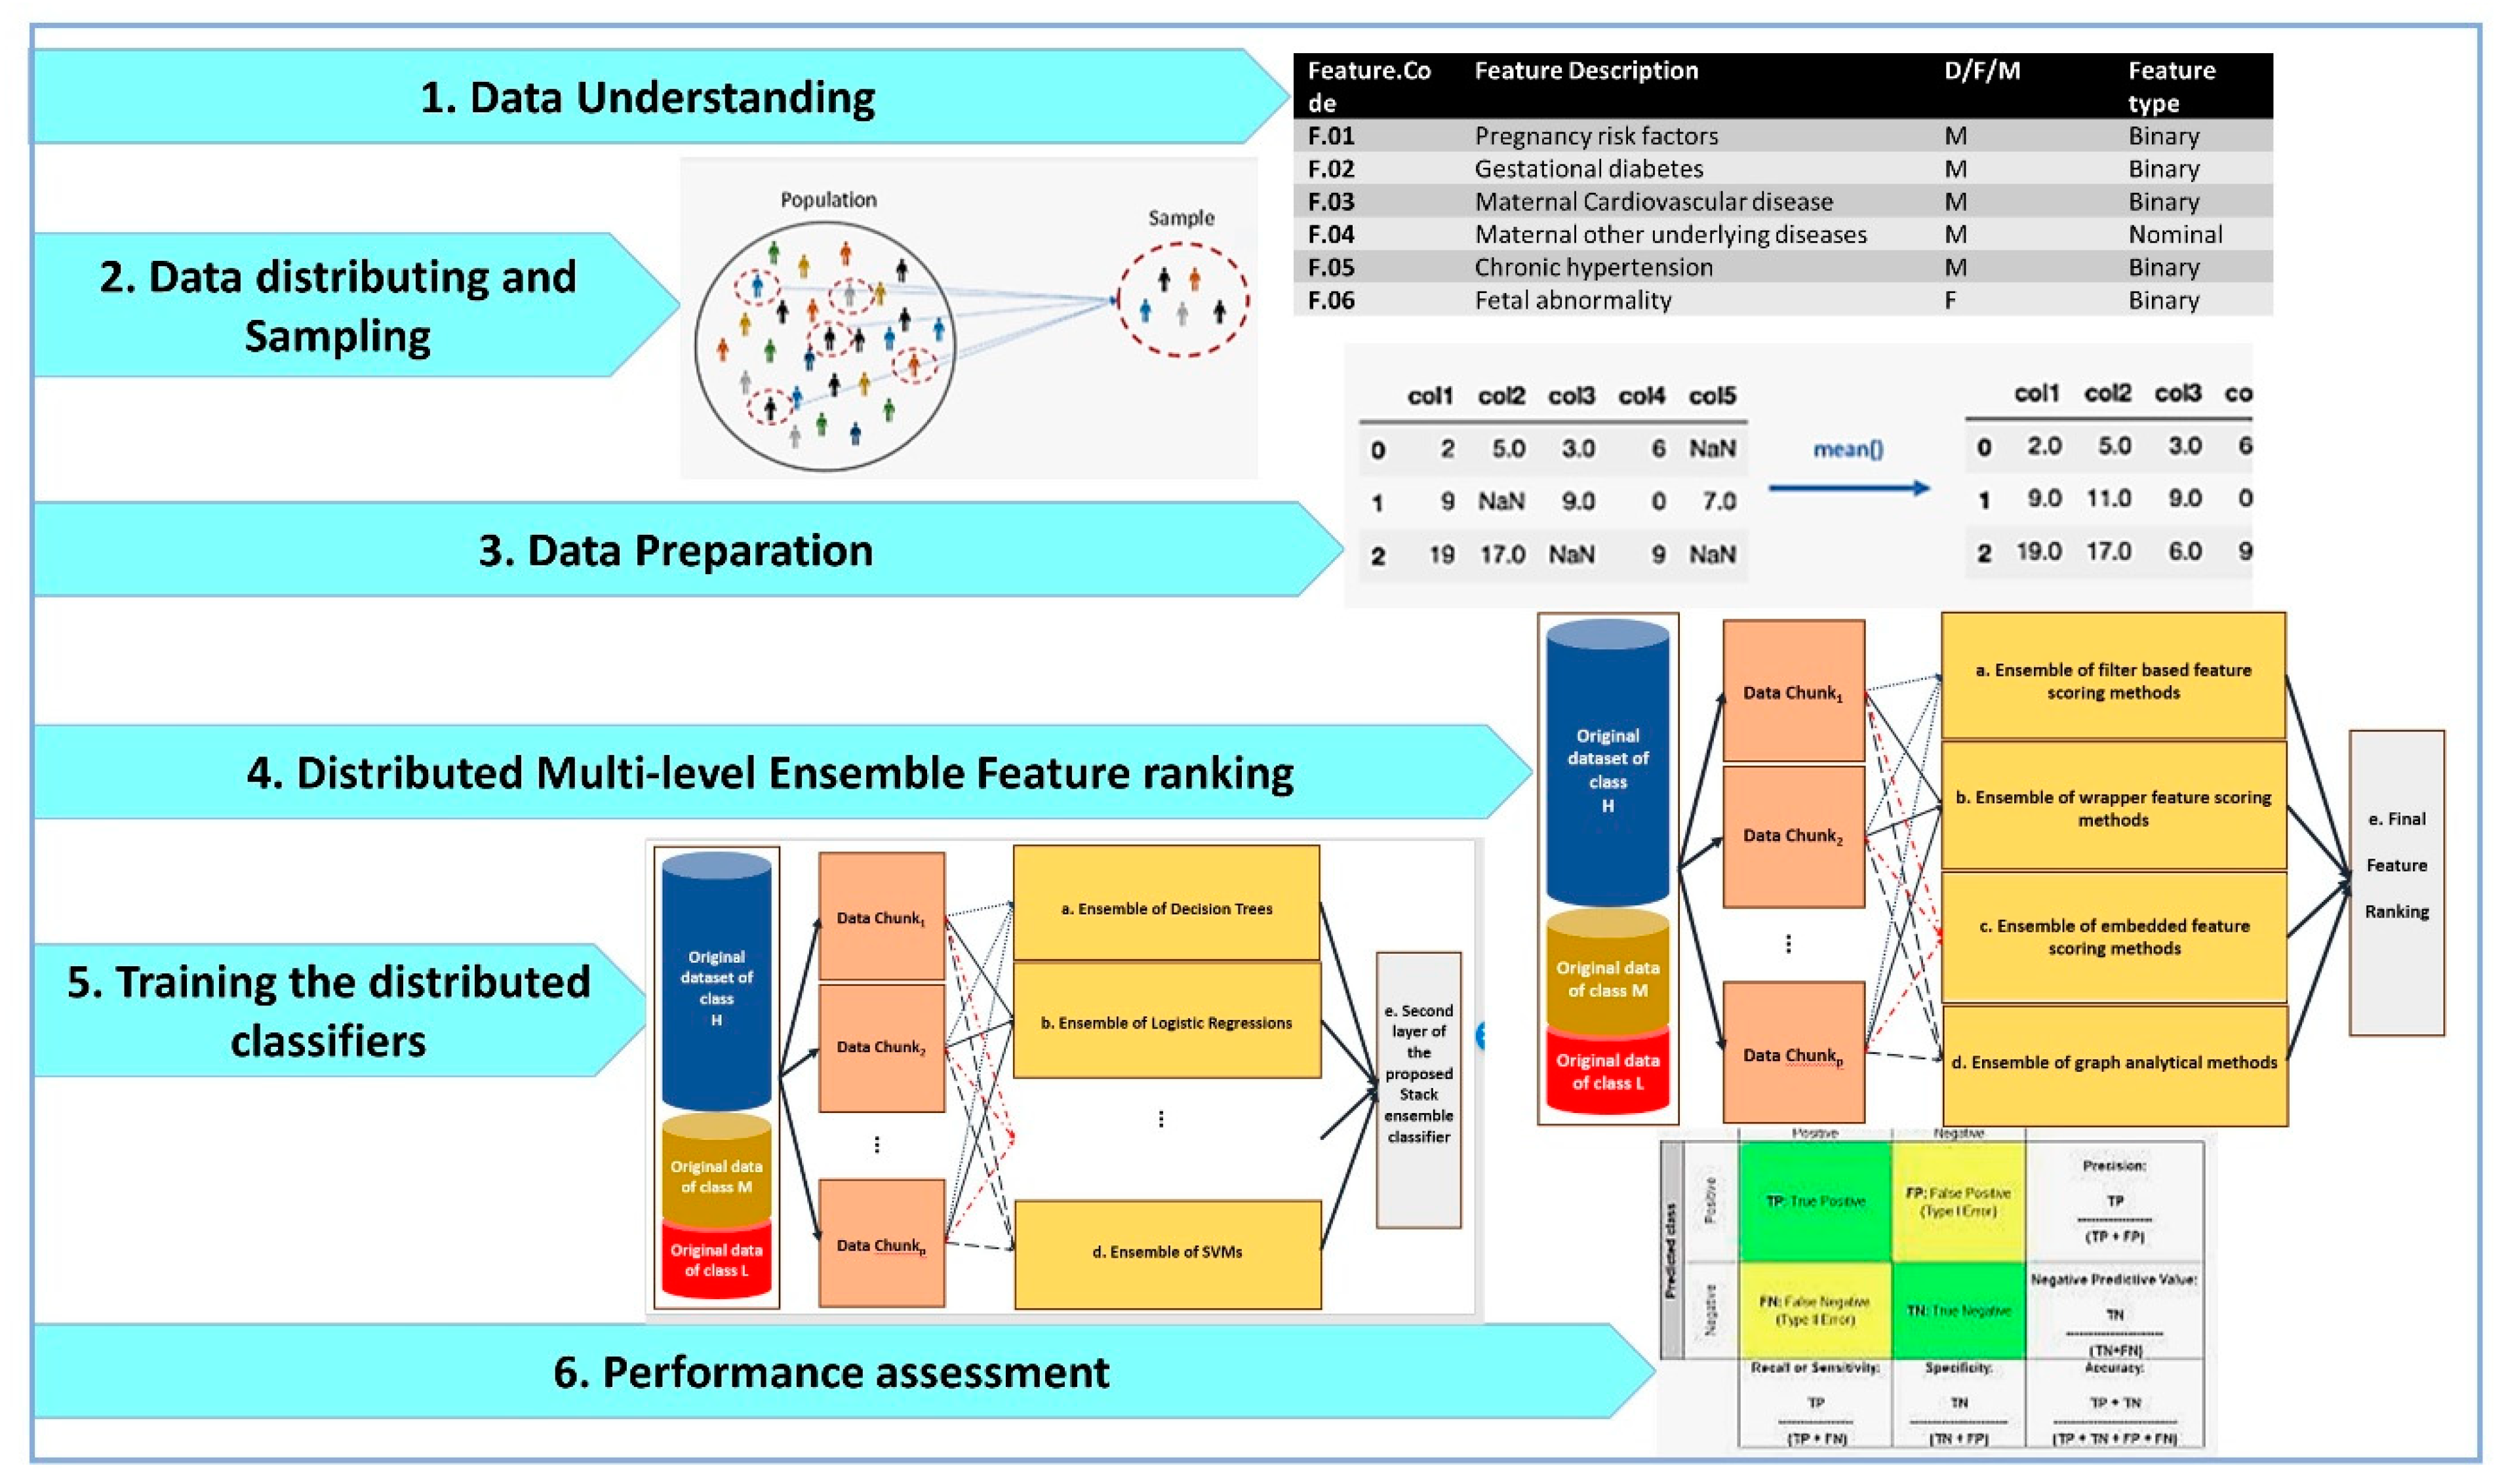
The main steps of our research methodology are shown in Figure 1.
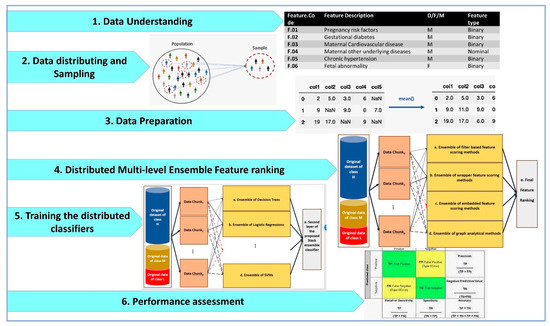
Figure 1.
The main steps of our distributed big data pipeline based on CRISP-DM methodology for Apgar score prediction and feature ranking.
As shown by Figure 1, the distributed big data pipelines for Apgar score prediction and feature ranking include data understanding, data distributing and sampling, data preparation, distributed multi-level ensemble feature ranking, training the distributed classifiers and performance assessment. These steps are designed by considering the cross-industry standard process for data mining (CRISP-DM) methodology as the standard methodology that has been proposed for data mining and machine learning tasks.
3.1. Data Understanding
In this study, a large dataset including about 1,431,597 birth cases, which is registered in the Iranian maternal and neonatal (IMAN) registry from 1 April 2016 to 1 January 2017, was collected. From these records, the instances having a gestational age more than 27 weeks and 6 days are used in this study for 5-min Apgar score predictions and feature ranking. Among the instances, 7949, 3380 and 1,404,294 instances have 5-min Apgar score less than 4, between 4 and 6 and more than 6, respectively.
Table 1 lists the information describing the dataset features including the feature code; feature description; whether the feature describes maternal (M), fetal (F) or delivery (D); and the type of the feature. We analyze 63 different features describing maternal and fetal characteristics and delivery properties.

Table 1.
Our data characteristics and features.
The perinatal outcome of 5-min Apgar score is considered as the target variable. A 5-min Apgar score (AS) is discretized into low (AS ≤ 3), moderate (3 < AS < 7) and high (7 ≤ AS). Therefore, we have a multi-class classification task in this study in which 4 different classes were considered to correspond to different levels of discretized 5-min Apgar score. The discretization cut points are chosen based on previous studies [13].
Table 2 denotes the average of some numeric features for different classes of Apgar scores in our dataset.
Table 2.
The average of some numeric features for different classes of Apgar scores in our dataset.
As listed in Table 2, the average numbers of maternal age and birth number have not shown significant difference for birth with low, moderate or high Apgar scores. Gestational age, fetal weight and around the fetal head have lower average for instances with low or moderate AS compared to high AS. Moreover, the averages of the miscarriage numbers for low and moderate AS are higher than for high AS.
3.2. Data Distributing and Sampling
The number of data chunks in this study is 145. The instances belonging to high AS class are partitioned by random into equal-sized samples based on sampling without replacement methods. Each partition is considered as the instances of high AS class of an individual data chunk.
However, the numbers of instances having low and moderate AS are lower than 10% of the number of high AS instances. Therefore, they are chosen to contribute in data chunks based on sampling with the replacement method.
The number of the instances belonging to each class in every data chunk are the same for different classes. Therefore, the number of the instances of low AS class is equal to the number of the instances of moderate AS class and is the same as the number of the instances of high AS class for each data chunk. Using this method, data distribution per class is balanced for the individual data chunks.
The training set for each data chunk comprises all of its instances and its corresponding test set is all instances of another data chunk chosen randomly from the remaining data chunks.
3.3. Data Preparation
Data preparation in this study includes missing value imputation, dummy variable insertion and data normalization.
Since our dataset has a large number of instances, simple and fast missing value imputation methods are used in this study.
The features in this study are some binary, ordinal, numeric and nominal features. Missing values for ordinal and numeric features are replaced with the feature median because of its robustness against noise and outliers. Missing values of binary and nominal features are replaced with the mode (maximum frequency) of the feature.
Nominal features are converted into dummy binary variables in this study according to previously proposed methods [21].
The ordinal and numerical features are replaced with their normalized version based on the min-max normalization method, which has been proposed in previous studies [21]. Data normalization is performed to prevent the domination of the feature with a smaller range of variation with features having larger ranges of variation. The min-max normalization of the features is computed by using Equation (1):
where is the ith input feature, and min (Fi) and max (Fi) show the lowest and highest values of the Fi feature, respectively.
3.4. Distributed Multi-Level Ensemble Feature Ranking
Different feature ranking methods have been proposed in previous studies, which have been divided into filter-based, wrappers and embedded methods [22].
Filter-based feature scoring methods are fast and simple methods that do not rely on any classifier. They have high generalization ability but we can say nothing about their impact on improving the classifiers’ performance before training and evaluating the classifiers on the features selected based on filter methods. Different measures have been proposed and used for feature scoring in filter-based feature ranking methods, including dependency [23], distance [24], mutual information [25] and consistency [26] measures. In this study, a correlation between the feature and the class label as a common and popular dependency measure is used for filter-based feature ranking.
The linear correlation coefficients between pairs of features Fp and Fq are calculated using Equation (2):
where Fx,p (Fx,q) indicates the xth row of the feature Fp (Fq), and mp (mq) denotes the average of feature Fp (Fq), respectively. If two features Fp and Fq have low (high) correlation, Corr (Fp, Fq) tends to zero (−1 or +1).
Wrappers evaluated different feature subsets as the input variables for training the classifiers [27]. Then, the performance of the classifier is compared based on their fed input feature subsets. The feature subset leading to the best performance for the classifier is considered as the best feature set. Another method of feature scoring based on wrapper methods is using the mean decrease in accuracy as the feature scoring measure. Using this method, once the classifier is trained on all features, its accuracy is reported. With another method, the classifier’s accuracy is calculated when it is trained on all features excluding one. The difference between these two accuracies is considered as the importance score of the excluded feature. This method has no generalization ability because feature importance depends on the used classifier. Therefore, one feature may be very important for one classifier and not important for another one. However, for a specific classifier that is used to evaluated the feature score, it can be concluded which features have more importance.
Embedded feature scoring methods do not separate feature subset search and evaluation steps. They measure the importance of features during training the classifiers. Random forest [28] and gradient boosting classifier [29] are two ensemble classifiers that are used as embedded feature scoring methods too.
In this study, a combination of filter and wrapper feature selection methods is used. Moreover, embedded feature scoring methods are exploited too. Graph-based methods for the features are considered in the proposed method for feature scoring in this study as well.
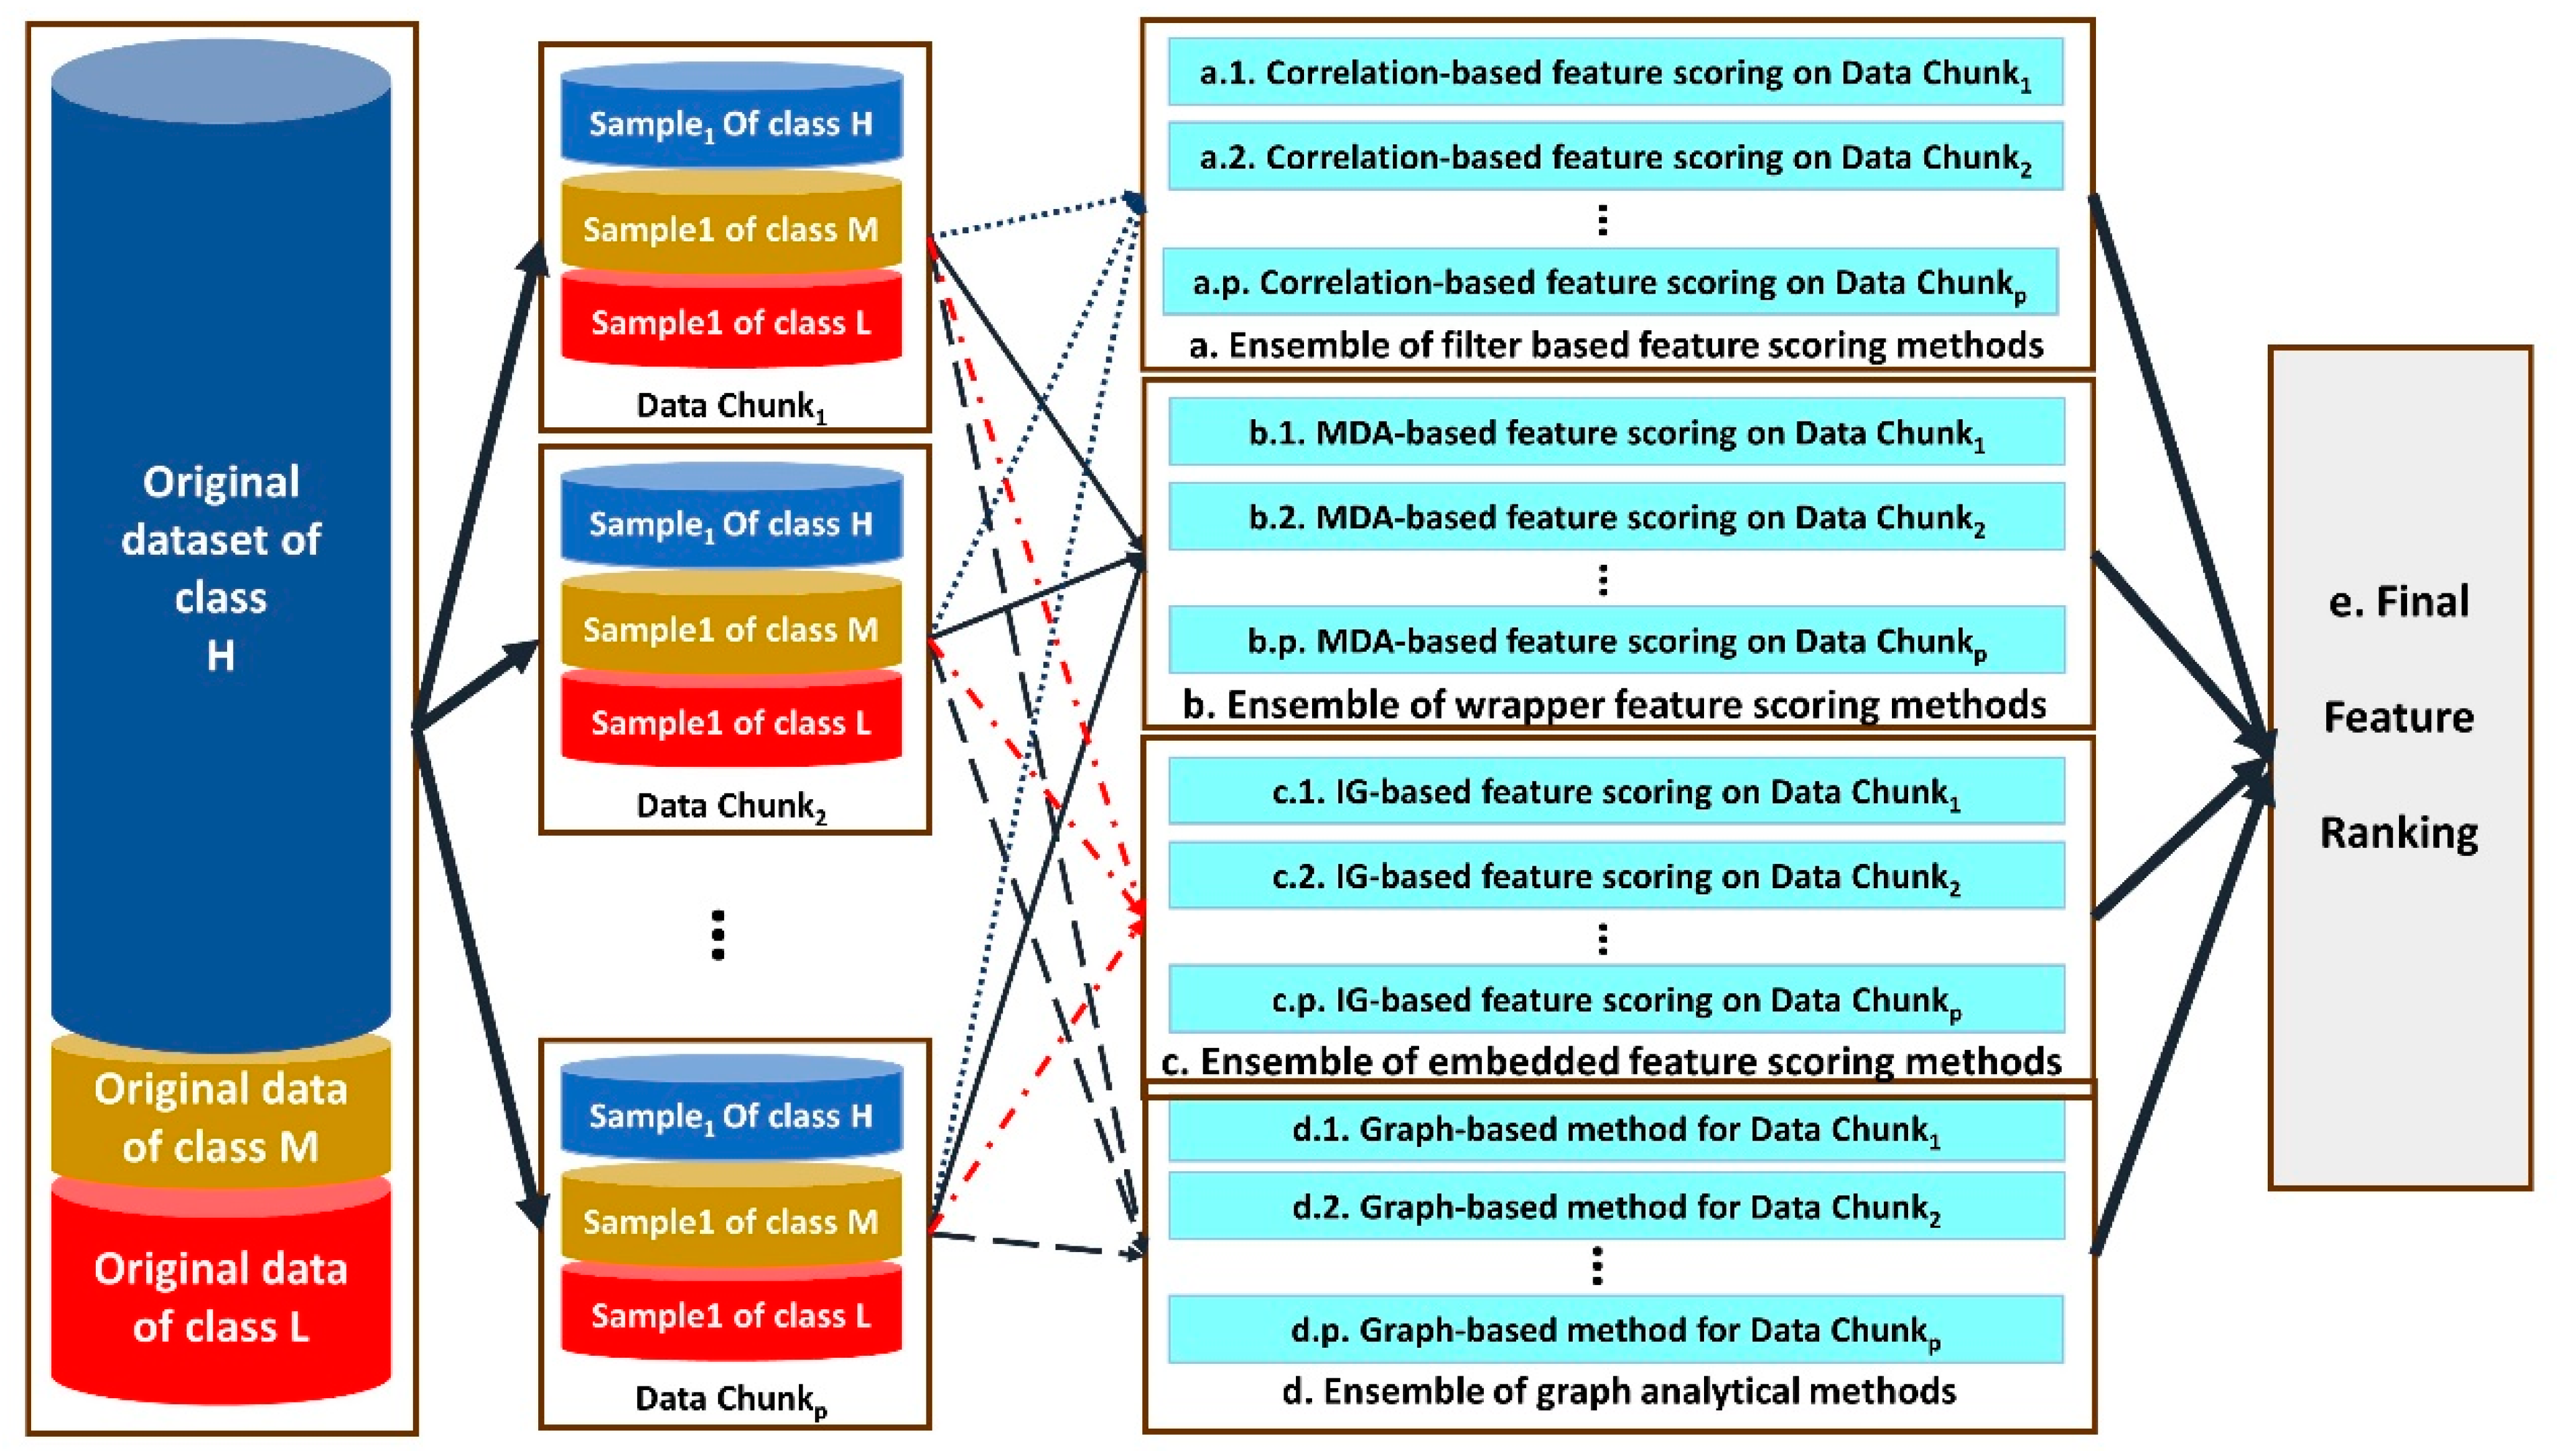
The architecture of the proposed distributed multi-level ensemble feature ranking is shown in Figure 2.
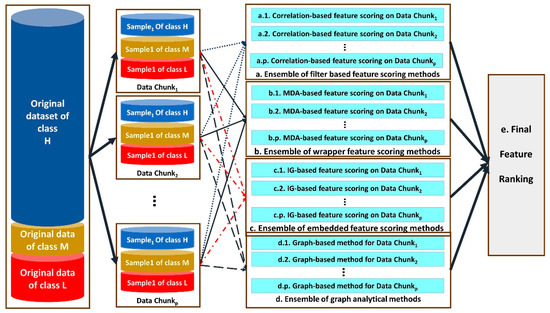
Figure 2.
The architecture of our proposed distributed multi-level ensemble feature ranking method.
As illustrated in Figure 2, different ensembles of feature selection methods are designed and used, including ensemble of filter-based (a), wrappers (b), embedded methods (c) and graph-based methods (d) for feature scoring.
Each step from a to d performs one module of feature selection for each data chunki for 1 ≤ i ≤ p. Correlation-based feature scoring is performed in the substeps of a.1–a.p. Wrappers with the feature ranking based on mean decrease accuracy (MDA) are applied on data chunks in the substeps of b.1–b.p. For this purpose, the body classifiers of the wrapper feature selection methods are DT, LR and SVM. Step c uses embedded feature selection methods including GBC and RF for each data chunk separately and then combines their results in the corresponding ensemble method. Finally, a graph-based method for ranking the features is used in the substeps of d.1–d.p.
A graph-based method for each substep of d.i for 1 ≤ i ≤ p is performed as the following steps:
- -
- Three graphs GLi, GMi and GHi are constructed for data chunki in which the nodes are features {F1, F2, …, Fm}, where m is the number of input features in this study. An edge between Fu and Fv with weight of wu,v is drawn where wu,v denotes the similarity between the columns of Fu and Fv in data chunki. The columns of Fu in GLi, GMi and GHi consist of all instances of data chunki belonging to class low, moderate and high AS, respectively.
- -
- The similarity between two columns in a data chunk is calculated based on the cosine-similarity measure, as described by Equation (3):
- -
- The edges having weights lower than the first quartile of the weights’ matrix are removed.
- -
- For each node Fu, its corresponding centrality measures in GLi, GMi and GHi are calculated, and their pairwise distance is calculated, and the average of the pairwise distances is considered as the Fu importance score.
The node degree is the number of its adjacent edges. Betweenness centrality for graph nodes has been introduced by Bavelas [30] and is calculated as Equation (4). If a node lies in many shortest paths between pairs of nodes, its Betweenness centrality will be high. Nodes with high Betweenness centrality are bridges for information flow.
Node closeness centrality measures the reciprocal of the sum of the length of the shortest paths between the node and all other nodes in the graph.
Node Eigen vector centrality is higher when the node is pointed to by many important nodes.
The clustering coefficient of a node is calculated with Equation (5).
After completing the steps of a–d, the final feature ranking is performed in step e. For this purpose, the average and standard deviation of each group of the feature selection methods, which have performed on different data chunks, are calculated. The scores having higher standard deviations than a predefined threshold are excluded. The remaining scores are averaged again for each feature, and its final score is derived.
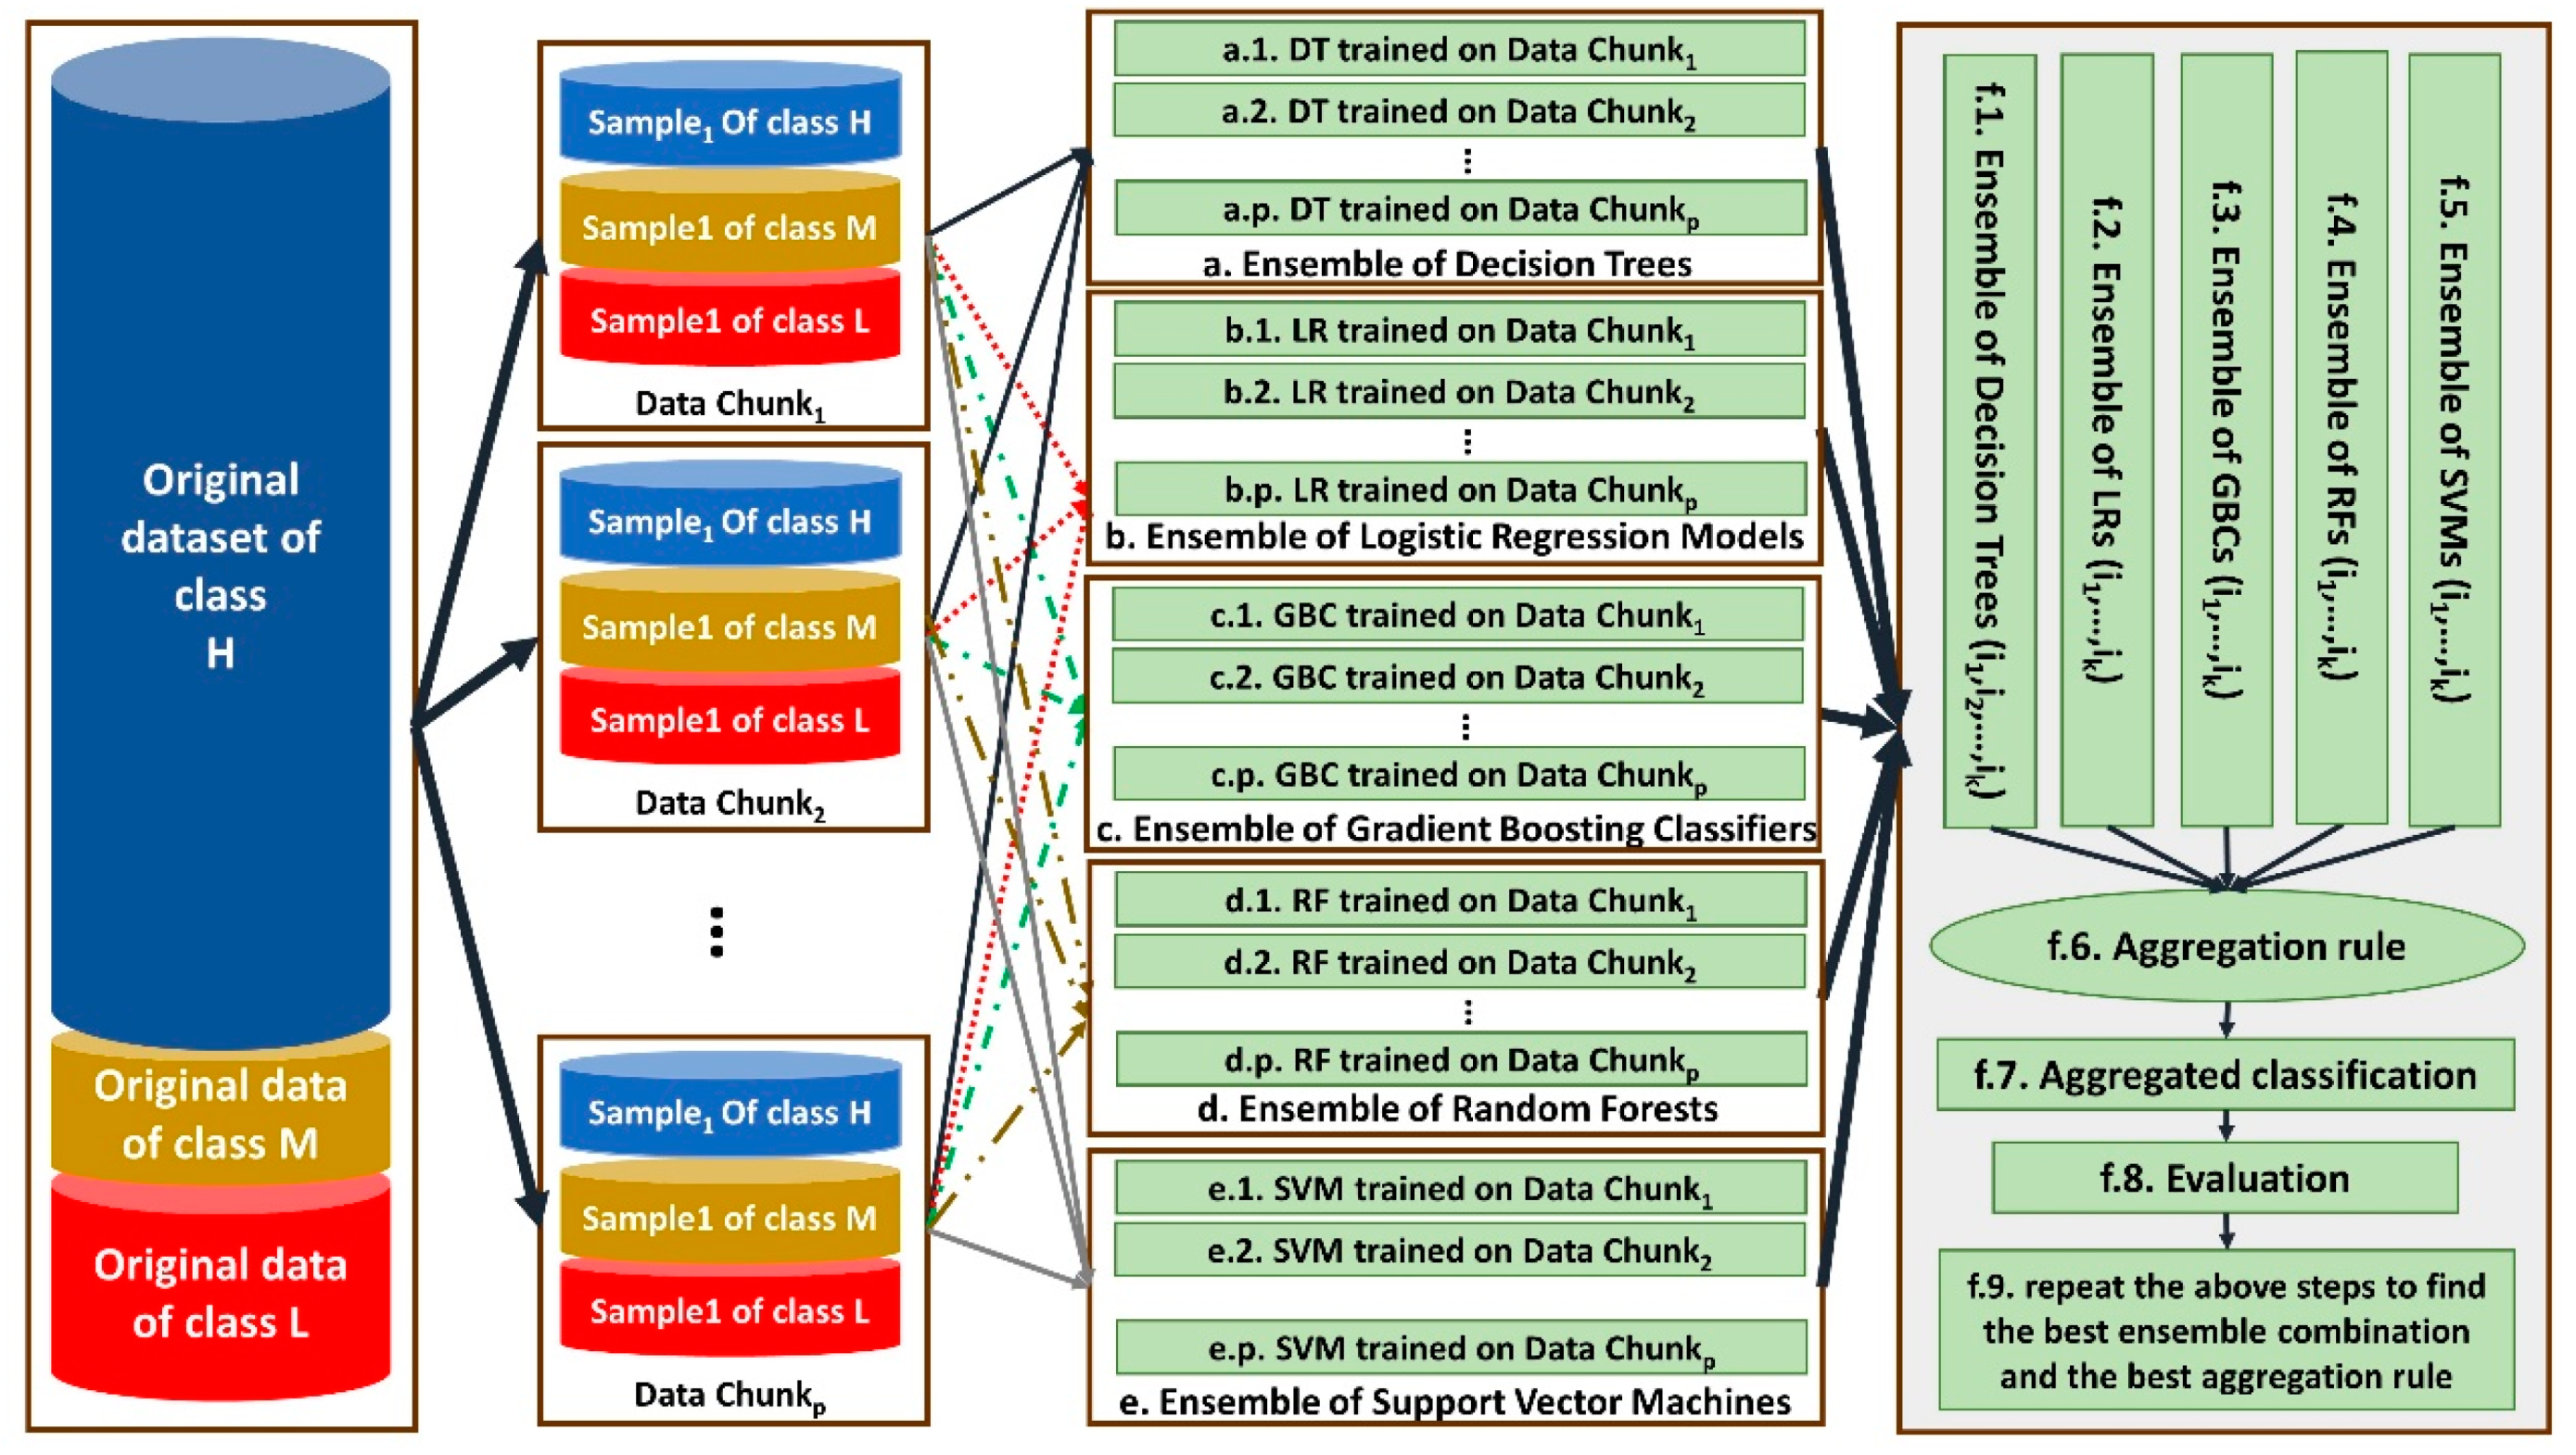
3.5. Training the Distributed Classifiers
In this study, a distributed ensemble of the classifiers trained on data chunks is shown in Figure 3.

Figure 3.
The architecture of our proposed distributed ensemble classifiers for Apgar score prediction.
As shown by Figure 3, each data chunk is used as the training set for one decision tree (DT), one logistic regression (LR), one gradient boosting classifier (GBC) and one support vector machines (SVM). Steps a–i, b–i, c–i, d–i and e–i show DT, LR, GBC and SVM trained on the ith data chunk, respectively, for 1 ≤ i ≤ 145. Since we have p = 145 data chunks, 145 DT, 145 LR, 145 GBC and 145 SVMs are trained.
Then, ensembles of different combinations of the same-type classifiers are constructed in steps f.1, f.2, f.3, f.4 and f.5. Each time, the classifiers trained on two-thirds of all data chunks considered as a combination of the classifiers in an ensemble. For example, during first time, the classifiers trained on the data chunks 1–97 are considered. The ensembles are aggregated in step f.6 based on three different aggregation rules, including majority voting, weighted voting and vote-boosting, and the aggregated classifiers are constructed in step f.7.
For weighted voting, the accuracy of each classifier on a random data chunk as its test set is considered. Vote-boosting as an aggregation strategy assigns weights to the instances based on the degree of the agreement or disagreement among its assigned labels by the base classifiers in the ensemble. Previous studies have demonstrated that vote-boosting has the ability of robustness to label noise [31].
Their performance is evaluated in step f.8 by applying them on the remaining 48 data chunks that are not considered for training any classifier in steps f.1–f.5. The best combination and best aggregation rule are considered for the final classification of data in step f.9.
3.6. Performance Assessment
The performance of the classifiers will be assessed by applying them to the test dataset after training them on their associated training datasets. For evaluating classifier performance, some common and popular measures are used, including Accuracy, Precision, Recall and F1-Score.
To overcome sampling bias, the procedure, including sampling the training dataset and test dataset, training the model and evaluating it, is repeated 30 times. The average and standard deviation values of the performance measures are calculated on 30 different data distribution and sampling with a confidence interval of 95%.
Since our problem is multi-class classification, calculating the average of F1 score, precision and recall measures is required. For each measure, there are microaverages and macroaverages that will compute slightly different values. A macroaverage will compute the measure separately for each class and then calculate their average by considering all classes equally, whereas a microaverage will sum up the contributions of all categories to compute the average of the measure. Equations (6)–(13) indicate the equations for calculating the mentioned measures:
where true positivec is the number of instances belonging to class c, and the classifier has assigned them the class c too. False positivec denotes the number of instances not belonging to class c, but the classifier has assigned them class c. False negativec is the number of instances belonging to class c, but the classifier has assigned them other class labels. Finally, true negativec shows the number of the instances not belonging to class c, and the classifier has not assigned them to class c too.
4. Results
Our experimental results lie in two dimensions, including ranking the features according to their predictive ability for 5-min Apgar score prediction and assessing the performance of different classifiers to predict 5-min Apgar scores.
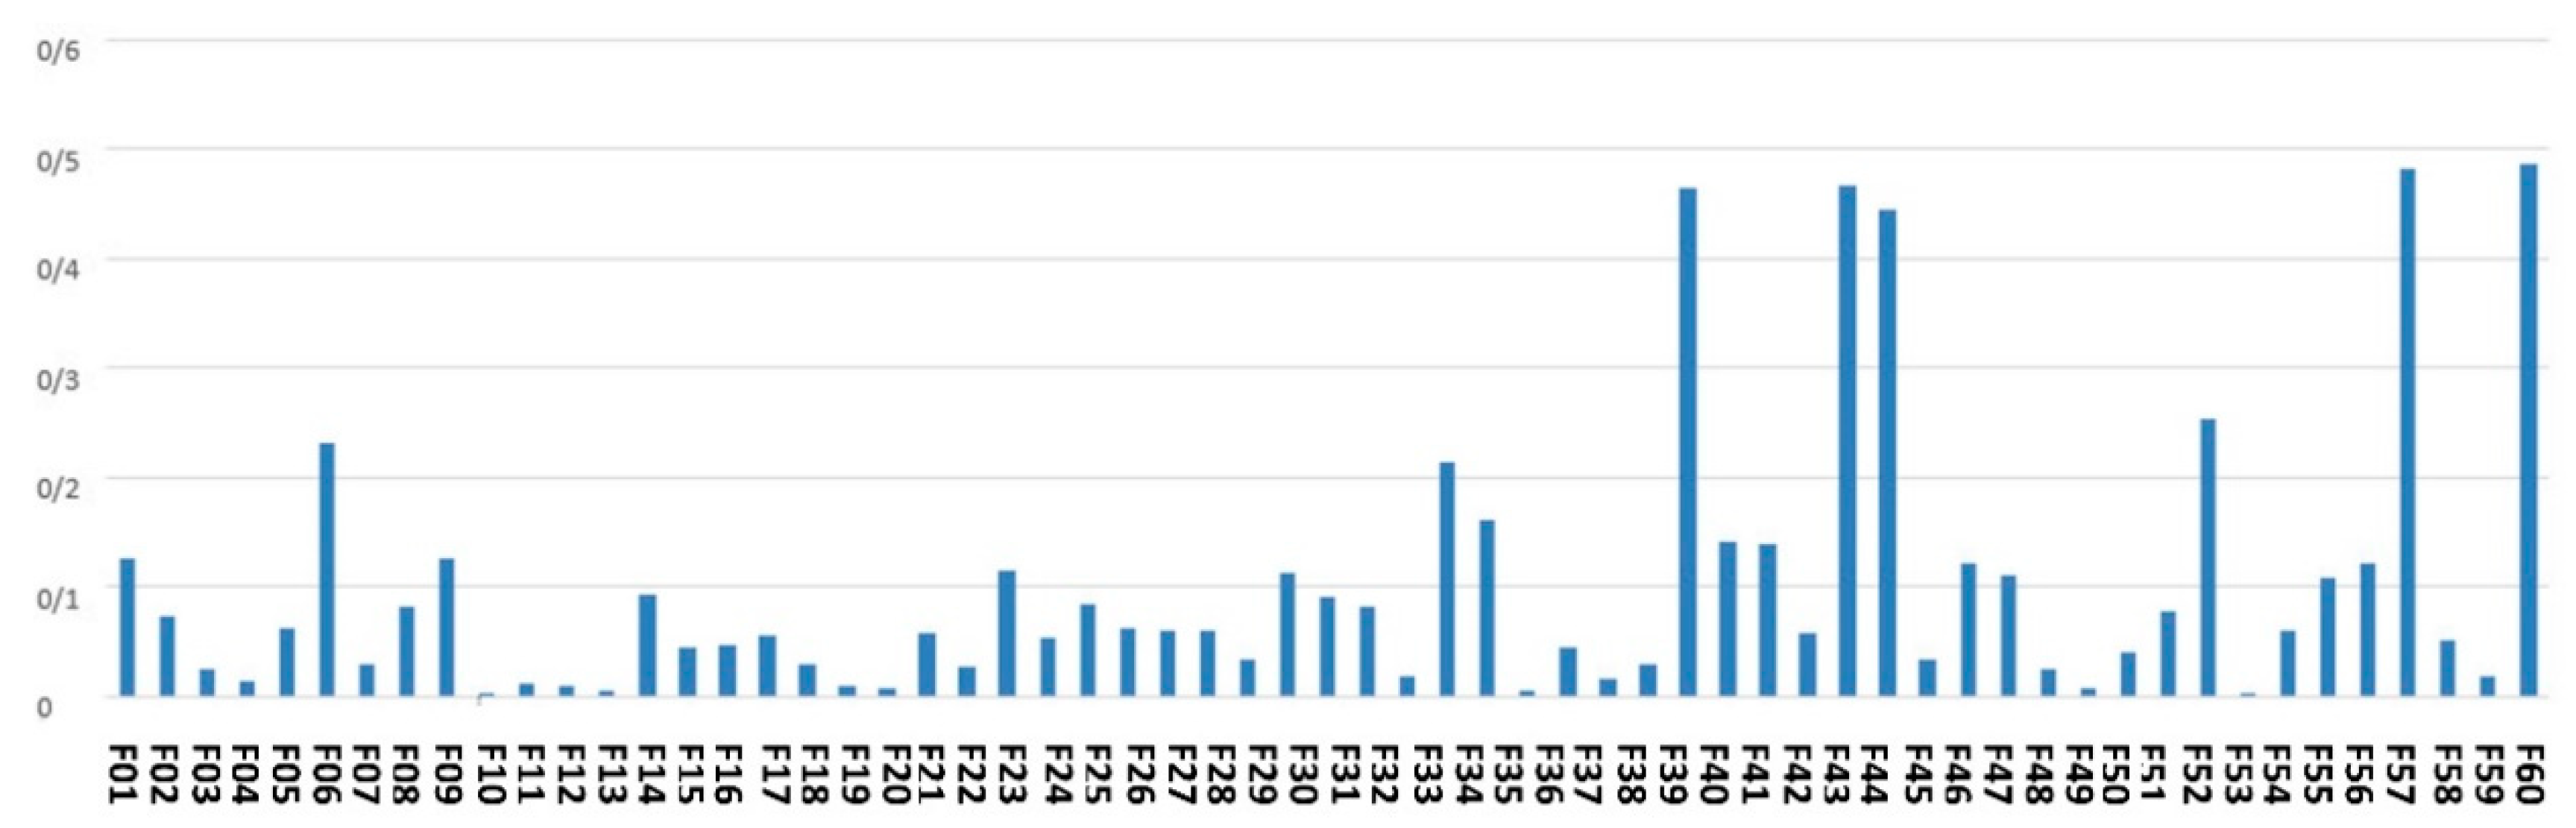
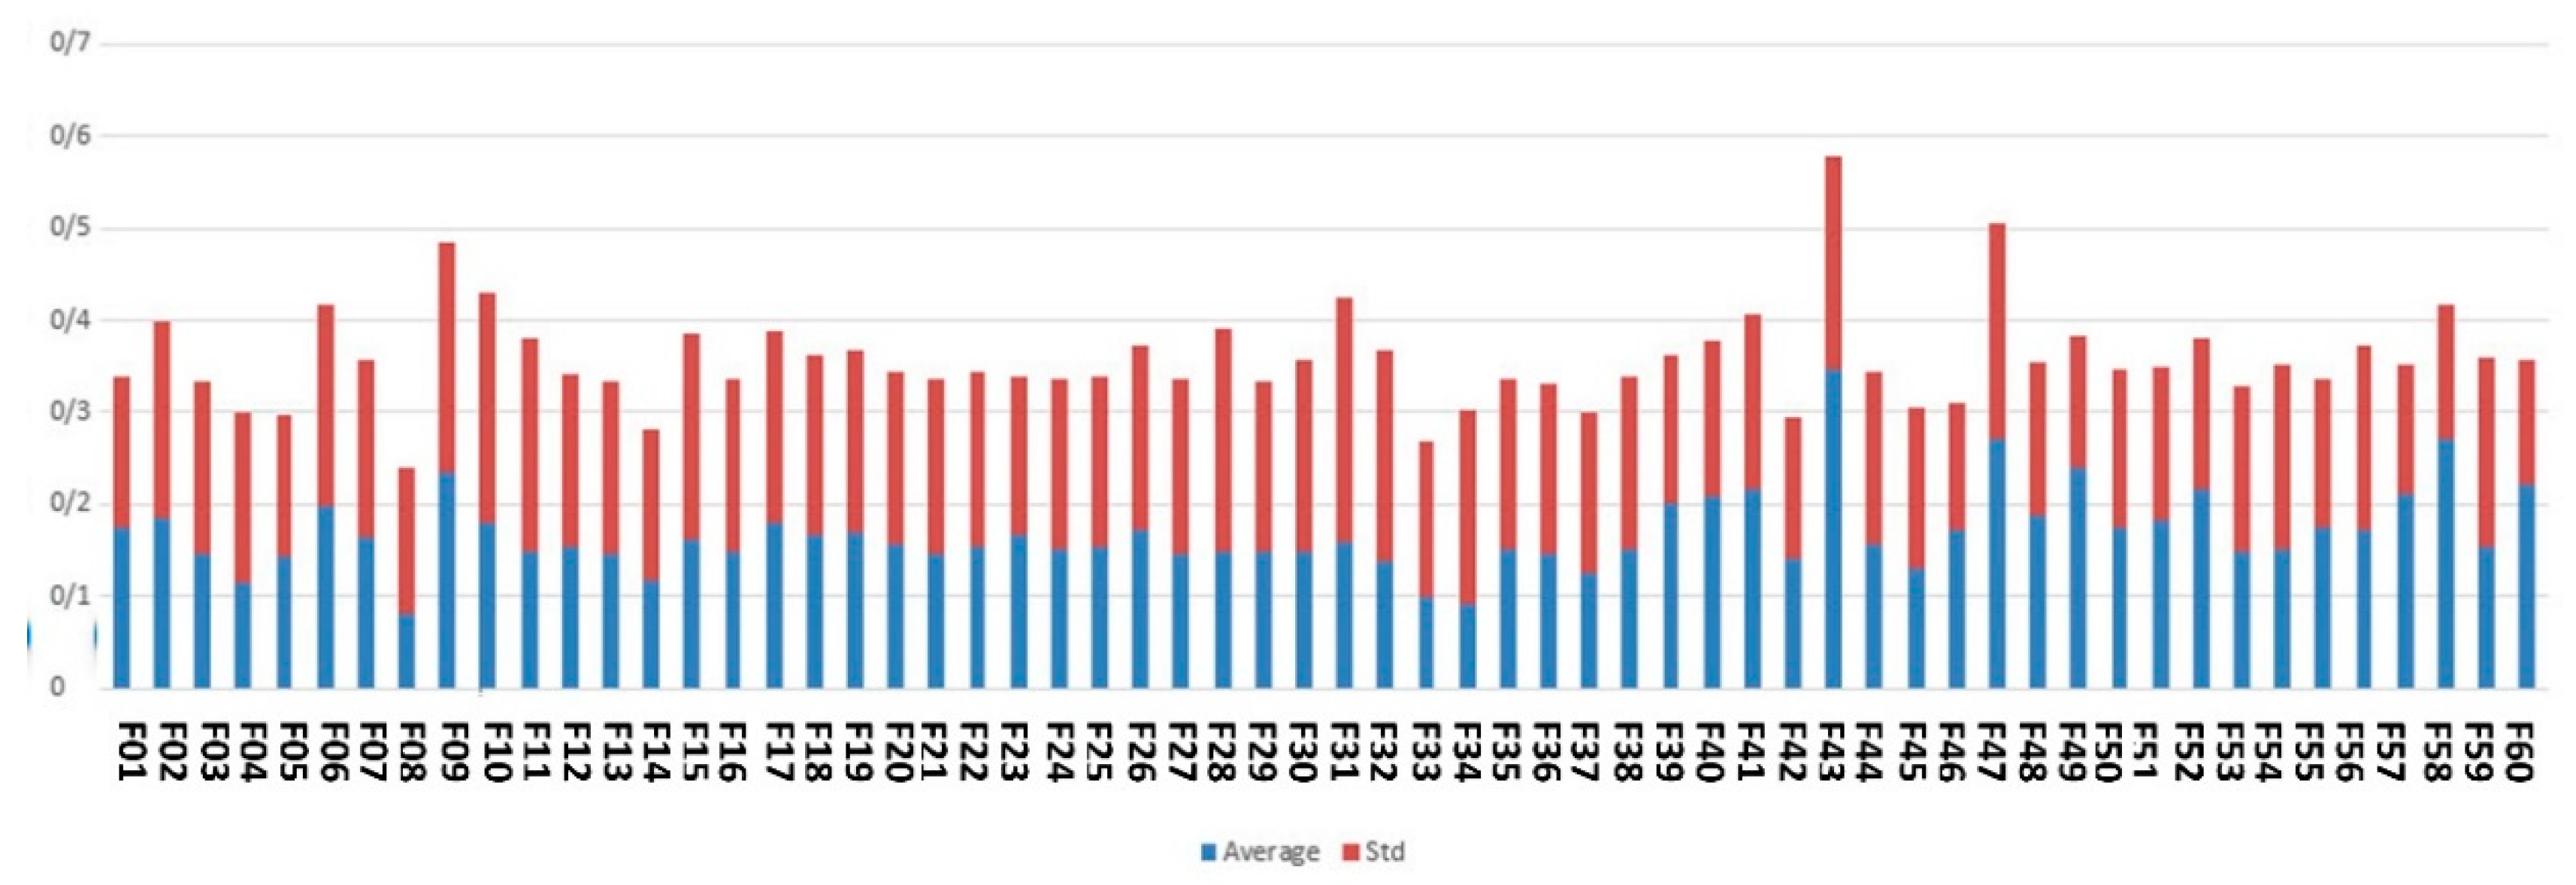
Figure 4 denotes the average of the feature scores assigned to the features by an ensemble of filter-based methods.
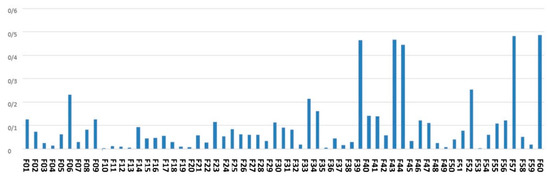
Figure 4.
The average of the feature scores obtained by ensemble of filter-based feature scoring method.
As shown by Figure 4, the top-ranked features according to the scoring with filter-based methods are maternal age, city, gestational age, around the baby’s head and fetal weight.
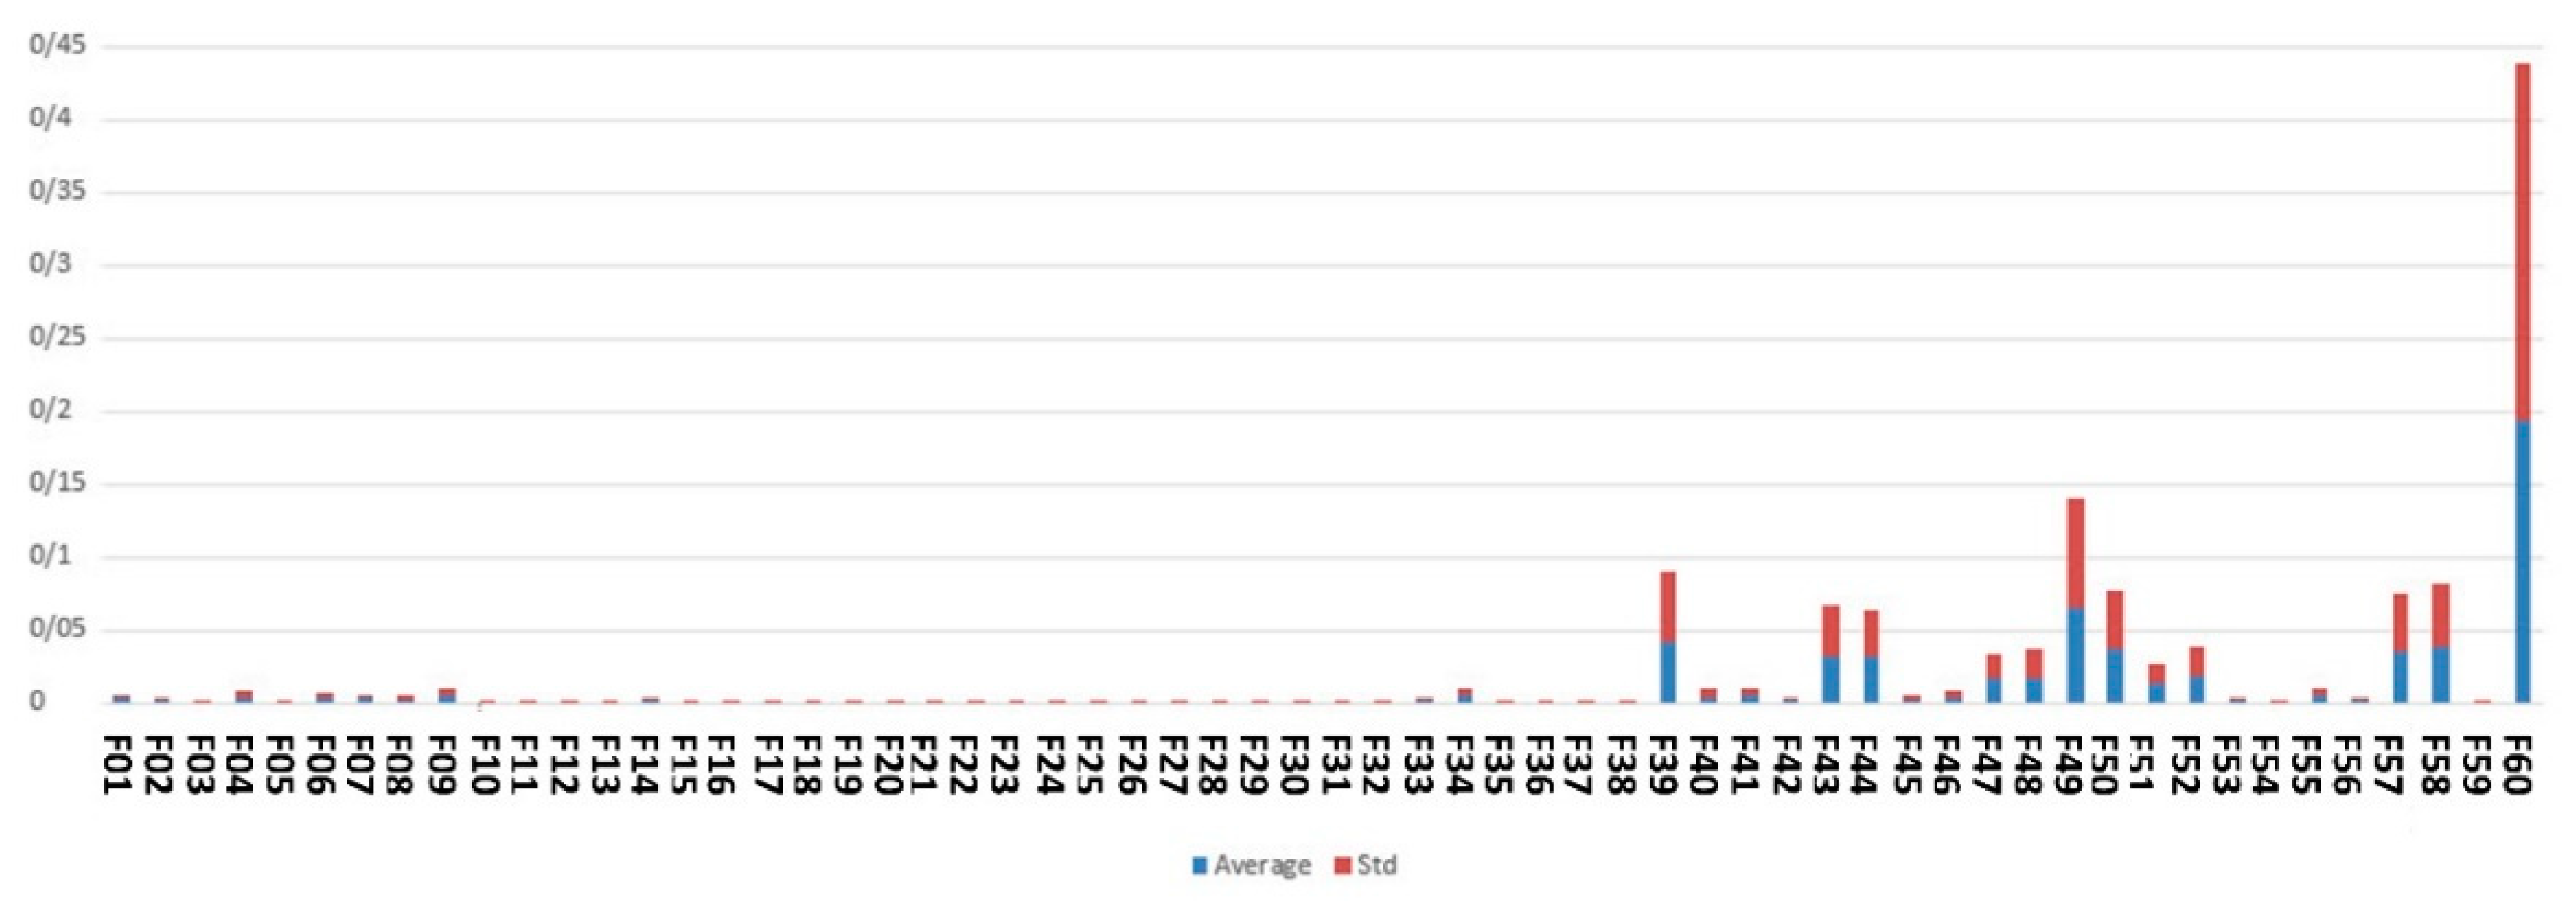
Figure 5 indicates the average and standard deviation of the feature scores assigned by an ensemble of Wrapper methods, including SVM and LR.

Figure 5.
The average and standard deviation of the feature scores according to the results of ensemble of wrapper methods in this study for Apgar score prediction.
As illustrated by Figure 5, high-ranked features based on wrapper methods are gestational age, fetal weight, type of delivery, medical science university operator of the hospital and maternal age.
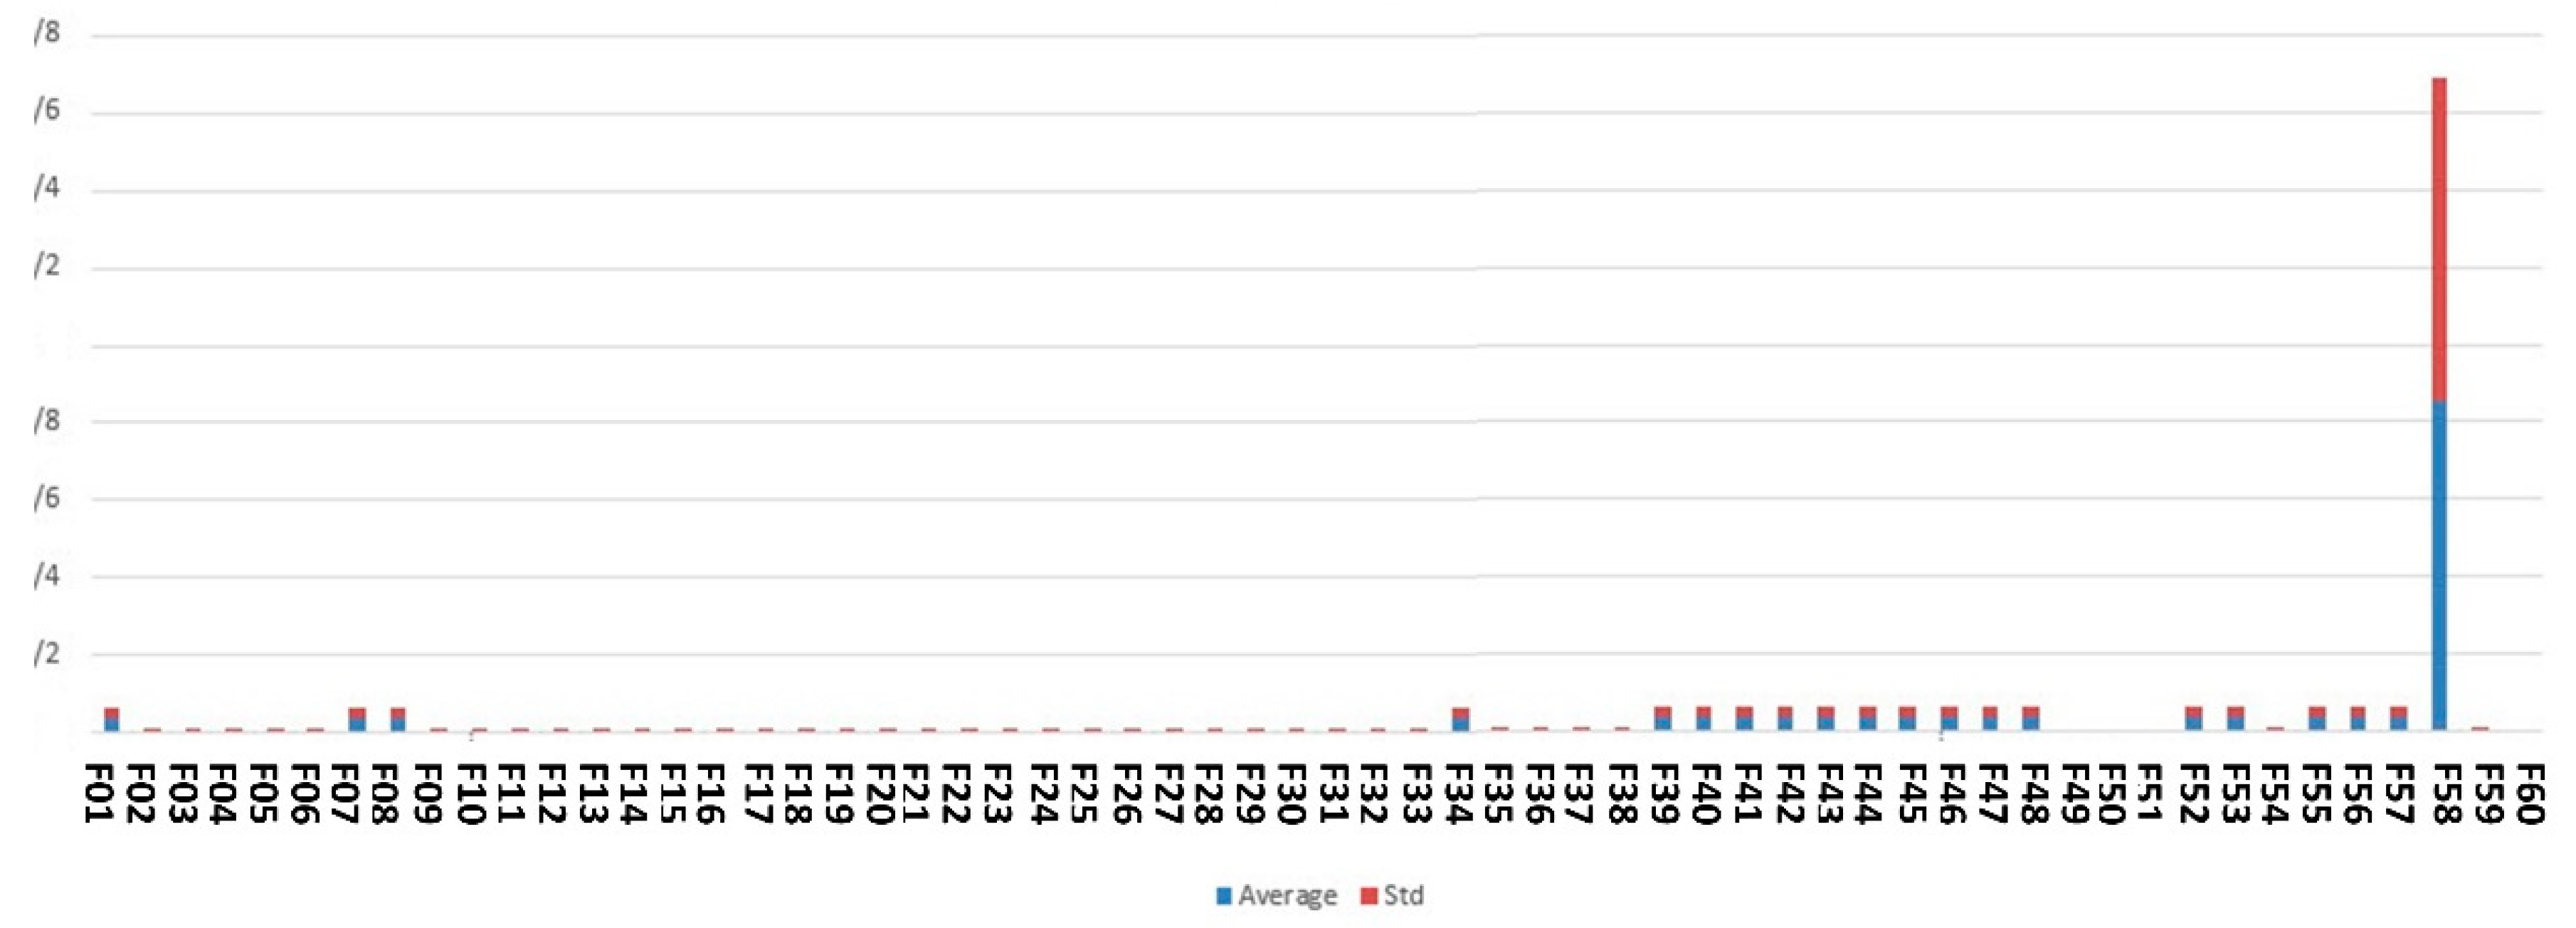
Figure 6 demonstrates the feature scores assigned by ensemble of embedded methods including DT, GBC and RF.

Figure 6.
The average and standard deviation of the feature scored based on embedded methods used in this study.
As shown by Figure 6, the top features identified by embedded methods are maternal age, medical university operator of the hospital, around the baby’s head and fetal height.
Figure 7 shows the feature scores calculated based on our proposed complex network feature-ranking method.
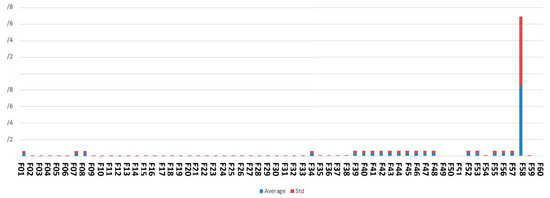
Figure 7.
The feature scores obtained by complex network analysis in this study.
As shown in Figure 7, the best-ranked feature resulting from the complex network analysis method is fetal height.
Table 2 lists the summary statistics describing the feature scores obtained by different methods in this study for Apgar score prediction.
Based on the results shown in Table 2, the features having average score more than 0.08 and their maximum score higher than 0.2 are considered as the final high-ranked features for predicting 5-min Apgar scores, and they are listed in Table 3.
Table 3.
Summary statistics for feature scores assigned by four different ensemble feature scoring methods in this study.
Table 3 indicates the ranks assigned to the selected features by each feature scoring method used in this study and shows their total rank.
The top 10 features are city, maternal age, fetal height, gestational age, around the baby’s head, fetal weight, type of delivery, hospital type, medical science university operator of the hospital and fetal abnormalities. Intervention for labor induction, number of previous deliveries and pregnancies and risk or dangerous causes of delivery form the 11th to 14th top features.
Therefore, the classifiers are trained on two different feature sets, and their performances are compared to find the best classifier and the best feature set for predicting 5-min Apgar scores. The first feature set (FS1) includes all input features listed in Table 1. The second feature set (FS2) consists of features listed in Table 3.
Since we encounter a multi-class classification task, the performance assessment measures must be averaged according to different averaging strategies used in previous studies for the evaluation of multi-class classification performance, including macroaverage and weighted average. Microaverage is not reported because it leads to the same values for all different measures per classifier. The macroaverage of the performance measures of different classifiers is listed in Table 4.
Table 4.
Top features selected by different feature scoring methods in this study.
As shown in Table 4, a new classifier is added to the list named as stack ensemble. It is a meta-ensemble of different ensembles including an ensemble of DTs, ensemble of LRs, ensemble of GBCs, ensemble of RFs and ensemble of SVMs. Its aggregation rule comrpises majority voting.
Table 5 and Table 6 illustrate the weighted average of the performance measures for different classifiers by considering different feature sets.
Table 5.
Macroaverage of performance measures for different classifiers considering different feature sets.
Table 6.
Weighted average of performance measures for different classifiers considering different feature sets.
5. Discussion
In this study, the considered features are ranked based on our proposed distributed multi-level feature scoring method, and the top 14 features are fed to the classifiers for 5-min Apgar score prediction.
Table 7 illustrates the findings in the previous studies related to some top-14 features identified in this study for Apgar score prediction.
Table 7.
The related findings in the previous studies for some top ranked features identified in this study for Apgar score prediction.
As listed in Table 7, the association between most top features identified in this study with Apgar scores has been shown in previous studies.
Our experimental results show that our proposed method outperformed the compared classifiers. Moreover, considering only the top-14 features does not worsen the Apgar score prediction’s accuracy. Therefore, they show good predictive ability for discrimination and the prediction of low, moderate and high 5-min Apgar scores.
It is recommended to categorize the top-14 features into manageable and unmanageable categories. Some manageable factors are hospital type, medical science university operatory the hospital, delivery type and city. As further research topics, finding the factors differentiating the impact of the various hospital types on their corresponding birth Apgar scores is recommended, as well as trying to manage undesirable factors. Performing these steps is recommended for other healthcare related factors too. Some perinatal abnormalities can be prevented by following the related medical instructions and nutrition guidelines. Therefore, dividing fetal abnormalities into preventable and unpreventable groups can help manage the preventable ones.
On the other hand, fetal height and weight and around the baby’s head show the growth status for newborns. Fetal growth restrictions can lead to low or moderate Apgar scores. Taking inappropriate maternal nutritional diets during pregnancies and having some preeclampsia risk factors may lead to fetal insufficient growth. The management of these factors via taking the appropriate diet and medications can be helpful to increase fetal growth rates.
6. Conclusions
This study aims at 5-min Apgar score prediction and related risk factor scoring. For this purpose, a large national dataset with 60 input variables including maternal, fetal and delivery descriptors is analyzed using a novel distributed data analytics method. Our experimental results show that our proposed method has superior performance compared to the other popular classifiers. Top-14 features are identified in this study among 60 considered features that describe fetal growth and abnormalities, maternal age, healthcare systems related factors and some other features. Training the classifiers with the top 14 identified features does not decrease classification performance. It shows that they are good predictors for 5-min Apgar scores.
However, some previous studies have examined other features describing maternal and fetal anatomical characteristics that are not included in our dataset. Augmenting the national dataset with other related risk factor for Apgar scores is proposed as a future research direction.
Considering national data for several years can inhibit seasonal and annual trends and differences among the considered features for Apgar score prediction. Therefore, it is suggested as another future research opportunity.
Different Apgar score systems have been proposed in recent years [32]. It is recommended to use the proposed methods in this study for predicting other Apgar scores obtained by other scoring methods.
Author Contributions
Conceptualization: T.K., A.F., M.M.S. and M.H.; data curation: T.K., M.M.S., A.F. and M.H.; formal analysis: T.K., M.M.S., A.F. and M.H.; funding acquisition: there is no funding; investigation: T.K., M.M.S., A.F. and M.H.; methodology: T.K., M.M.S., A.F. and M.H.; project administration: T.K.; software: T.K., M.M.S., A.F. and M.H.; supervision: T.K.; validation: T.K., M.M.S., A.F. and M.H.; visualization: T.K., M.M.S., A.F. and M.H.; writing—original draft: T.K., M.M.S., A.F. and M.H.; writing—review and editing: T.K. All authors have read and agreed to the published version of the manuscript.
Funding
This research received no external funding.
Institutional Review Board Statement
We have used data in the registry which has been collected previously by other persons. Therefore, IRB approval is not required.
Informed Consent Statement
Not applicable.
Data Availability Statement
Our study is a retrospective study of the large population (all stillbirth and living birth cases) registered in Iranian Maternal and neonatal records (IMAN registry) from 1 April 2016 to 1 January 2017.
Acknowledgments
We thank Mohammad Heidarzadeh and Health and Medical Education Ministry of Iran—Neonatal Health Office—for allowing us to have access to the dataset of IMAN registry and allowing us to perform research on this dataset and publish the obtained results.
Conflicts of Interest
The authors declare that there are no conflict of interest.
References
- Apgar, V. A proposal for a new method of evaluation of the newborn infant. Curr. Res. Anaesth. 1952, 32, 260–267. [Google Scholar]
- Casey, B.M.; McIntire, D.D.; Leveno, K.J. The continuing value of the Apgar score for the assessment of newborn infants. N. Engl. J. Med. 2001, 344, 467–471. [Google Scholar] [CrossRef] [PubMed]
- Jeganathan, R.; Karalasingam, S.; Hussein, J.; Allotey, P.; Reidpath, D.D. Factors associated with recovery from 1 minute Apgar score <4 in live, singleton, term births: An analysis of Malaysian National Obstetrics Registry data 2010–2012. BMC Pregnancy Childbirth 2017, 17, 110. [Google Scholar] [CrossRef] [PubMed] [Green Version]
- Boroviczeny, O.G.; Hempelman, J.; Zoppelli, L.; Martinez, A. Predictive value of the 1-min Apgar score for survival at 23–26 weeks gestational age. Acta Pædiatrica 2010, 99, 1790–1794. [Google Scholar] [CrossRef]
- Chaudhary, J.; Shivprasad, B.; Lakshmi, B.; Shanmughsundaram, R.; Nandhini, G.; Balamourougane, P. Analysis of Prognostic Factors in Congenital Diaphragmatic Hernia in Neonates. J. Indian Assoc. Pediatric Surg. 2019, 24, 176–179. [Google Scholar] [CrossRef]
- Olusanya, B.O.; Solanke, O.A. Correlates of birth asphyxia using two Apgar score classification methods. Nig. Q. J. Hosp. Med. 2010, 20, 153–161. [Google Scholar]
- Hanc, T.; Szwed, A.; Slopien, A.; Wolanczyk, T.; Dmitrzak-Weglarz, M.; Ratajczak, J. Perinatal Risk Factors and ADHD in Children and Adolescents: A Hierarchical Structure of Disorder Predictors. J. Atten. Disord. 2018, 22, 855–863. [Google Scholar] [CrossRef] [Green Version]
- Odd, D.E.; Rasmussen, F.; Gunnell, D.; Lewis, G.; Whitelaw, A. A cohort study of low Apgar scores and cognitive outcomes. Arch. Dis. Child. Fetal Neonatal Ed. 2008, 93, 115–120. [Google Scholar] [CrossRef] [Green Version]
- Razzaz, N.; Boyce, W.T.; Brownell, M.; Jutte, D.; Tremlett, H.; Marrie, R.A.; Joseph, K.S. Five-minute Apgar score as a marker for developmental vulnerability at 5 years of age. Arch. Dis. Child.-Fetal Neonatal Ed. 2016, 101, 114–120. [Google Scholar] [CrossRef] [Green Version]
- Bouzada, M.C.F.; Reis, Z.S.N.; Brum, N.F.F.; Machado, M.G.P.; Rego, M.A.S.; Anchieta, L.M.; Romanelli, R.M. Perinatal risk factors and Apgar score ≤ 3 in first minute of life in a referral tertiary obstetric and neonatal hospital. J. Obstet. Gynecol. 2020, 40, 820–824. [Google Scholar] [CrossRef]
- Costa, T.L.; Mota, A.; Duarte, S.; Araujo, M.; Ramos, P.; Machado, H.; Lemos, P. Predictive Factors of Apgar Scores below 7 in Newborns: Can We Change the Route of Current Events? J. Anesth. Clin. Res. 2016, 7, 1000672. [Google Scholar] [CrossRef] [Green Version]
- Eze, P.; Lawani, L.O.; Ukaegbe, C.I.; Anozie, O.B.; Iyoke, C.A. Association between time of delivery and poor perinatal outcomes -An evaluation of deliveries in a tertiary hospital, South-east Nigeria. PLoS ONE 2019, 14, e0217943. [Google Scholar] [CrossRef] [PubMed] [Green Version]
- Gudayu, T. Proportion and factors associated with low fifth minute Apgar score among singleton newborn babies in Gondar University referral hospital; North West Ethiopia. Afr. Health Sci. 2017, 17, 1–6. [Google Scholar] [CrossRef] [PubMed]
- Lai, S.; Flatley, C.; Kumar, S. Perinatal risk factors for low and moderate five-minute Apgar scores at term. Eur. J. Obstet. Gynecol. Reprod. Biol. 2017, 210, 251–256. [Google Scholar] [CrossRef]
- Rojers, J.F.; Graves, W.L. Risk factors associated with low Apgar scores in a low-income population. Paediatr. Perinat. Epidemiol. 1993, 7, 205–216. [Google Scholar] [CrossRef]
- Suka, M.; Sugimori, H.; Nakamura, M.; Haginiwa, K.; Yoshida, K. Risk factors of low APGAR score in Japanese full-term deliveries: A case-control study. J. Epidemiol. 2002, 12, 320–323. [Google Scholar] [CrossRef]
- Dassah, E.T.; Odoi, A.T.; Opoku, B.K. Stillbirths and very low Apgar scores among vaginal births in a tertiary hospital in Ghana: A retrospective cross-sectional analysis. BMC Pregnancy Childbirth 2014, 14, 289. [Google Scholar] [CrossRef] [Green Version]
- Knutzen, L.; Anderson-Knight, H.; Svirko, E.; Impey, L. Umbilical cord arterial base deficit and arterial pH as predictors of adverse outcomes among term neonates. Int. J. Gynaecol. Obstet. 2018, 142, 66–70. [Google Scholar] [CrossRef]
- Medeiros, T.K.D.S.; Dobre, M.; Silva, D.M.B.; Brateanu, A.; Baltatu, O.C.; Campos, L.A. Intrapartum Fetal Heart Rate: A Possible Predictor of Neonatal Acidemia and APGAR Score. Front. Physiol. 2018, 9, 1489. [Google Scholar] [CrossRef]
- Shitemaw, T.; Yesuf, A.; Girma, M.; Sidamo, N.B. Determinants of Poor Apgar Score and Associated Risk Factors among Neonates after Cesarean Section in Public Health Facilities of Arba Minch Town, Southern Ethiopia. EC Pediatrics 2019, 8, 61–70. [Google Scholar]
- Yang, C.; Chen, X.; Zu, S.; He, F. Retrospective analysis of risk factors for low 1-minute Apgar scores in term neonates. Braz. J. Med. Biol. Res. 2019, 52. [Google Scholar] [CrossRef] [PubMed]
- Han, J.; Kamber, M.; Pei, J. Data Mining: Concepts and Techniques; Morgan Kauffmann: Burlington, MA, USA, 2012. [Google Scholar]
- Xiong, M.; Fang, X.; Zhao, J. Biomarker identification by feature wrappers. Genome Res. 2001, 11, 1878–1887. [Google Scholar] [CrossRef] [PubMed] [Green Version]
- Lin, Y.; Hu, Q.; Liu, J.; Duan, J. Multi-label feature selection based on max-dependency and min-redundancy. Neurocomputing 2015, 168, 92–103. [Google Scholar] [CrossRef]
- Patel, S.P.; Upadhyay, S.H. Euclidean distance based feature ranking and subset selection for bearing fault diagnosis. Expert Syst. Appl. 2020, 154, 113400. [Google Scholar] [CrossRef]
- Lee, S.D.B.; Park, Y.T. A novel feature selection method based on normalized mutual information. Appl. Intell. 2012, 37, 100–120. [Google Scholar]
- Dash, M.; Liu, H. Consistency-based search in feature selection. Atificial Intell. 2003, 151, 155–176. [Google Scholar] [CrossRef] [Green Version]
- Lee, S.J.; Xu, Z.; Li, T.; Yang, Y. A novel bagging C4.5 algorithm based on wrapper feature selection for supporting wise clinical decision making. J. Biomed. Inform. 2018, 78, 144–155. [Google Scholar] [CrossRef]
- Speiser, J.L.; Miller, M.E.; Tooze, J.; Ip, W. A comparison of random forest variable selection methods for classification prediction modeling. Expert Syst. Appl. 2019, 134, 93–101. [Google Scholar] [CrossRef]
- Xu, Z.E.; Huang, G.; Weinberger, K.Q.; Zheng, A.X. Gradient Boosted Feature Selection. arXiv 2019, 1901, 04055. [Google Scholar]
- Sabzavari, M.; Martinez-Munoz, G.; Suarez, A. Vote-boosting ensemble. Pattern Recognit. 2018, 83, 119–133. [Google Scholar] [CrossRef]
- Dalili, H.; Sheikh, M.; Hardani, A.K.; Nili, F.; Shariat, M.; Nayeri, F. Comparison of the Combined versus Conventional Apgar Scores in Predicting Adverse Neonatal Outcomes. PLoS ONE 2016, 11, e0149464. [Google Scholar] [CrossRef] [PubMed]
Publisher’s Note: MDPI stays neutral with regard to jurisdictional claims in published maps and institutional affiliations. |
© 2022 by the authors. Licensee MDPI, Basel, Switzerland. This article is an open access article distributed under the terms and conditions of the Creative Commons Attribution (CC BY) license (https://creativecommons.org/licenses/by/4.0/).