Abstract
Purpose: This study investigates the static mechanical behavior of a non-modular metallic hip prosthesis through Finite Element Method (FEM) simulations, assessing compliance with ASTM F2996-13 standards. The analysis specifically evaluates how key geometric parameters, such as trunnion extension and orientation angles (adduction and flexion), affect stress distributions within the prosthesis. Methodology: A three-dimensional finite element model of a Ti6Al4V alloy hip stem was developed. Boundary and loading conditions were defined according to the standard: the distal portion of the stem was fully constrained 90 mm below the head center, and a static load of 2300 N was applied at the head center along the directions defined by the adduction and flexion angles. A mesh sensitivity analysis was conducted to ensure convergence, and stresses were evaluated. Parametric analyses varying trunnion extension and orientation angles were performed to quantify their impact on local stress concentration. Results: The findings revealed that even minor deviations in the adduction and flexion angles significantly impact the stress distribution, with the potting-level region being particularly sensitive. Additionally, the extension of the trunnion led to notably increased stress concentrations, especially at the prosthesis neck, highlighting its critical influence in implant design. Conclusions: Comparison with existing literature and standard reference data exposed discrepancies primarily attributed to variations in FEM model setups and parameter selections. This emphasizes the necessity of clearly specifying trunnion extension and orientation angles in numerical analyses to ensure consistent stress predictions, supporting the development of safer and longer-lasting hip implants. Future research should extend these analyses to different prosthesis geometries, aiming to develop generalized predictive frameworks applicable to diverse biomechanical scenarios.
1. Introduction
The Finite Element Method (FEM) is a key computational tool in the design and optimization of both orthopedic endo- and exo-prostheses, providing a robust framework to simulate the complex mechanical interactions between artificial components and biological tissues [1,2]. By accurately predicting stress distribution, deformation, and potential failure under physiological or operational loads, FEM enables virtual prototyping and patient-specific design [3], thereby reducing the reliance on costly and time-consuming experimental testing. In this study, the analysis was conducted on a non-modular metallic orthopedic hip stem to evaluate stresses in a static configuration. The numerical simulation adheres strictly to guidelines provided by ASTM F2996-13 standard [4], closely related to the experimental ISO 7206-4 (2010) [5].
- ISO 7206-4.
The geometric setup of the prosthesis is guided by this experimental standard. Regarding orientation, the hip stem is rotated by two angles: in the frontal plane and in the lateral plane, both depending on the stem length (CT). The standard also defines the embedding depth of the prosthesis in bone cement. However, since this study focuses exclusively on numerical simulation, not all parameters from the experimental protocol are relevant. Among the pertinent parameters, the inclination angles significantly influence the simulation outcome.
- ASTM F2996-13.
The numerical standard emphasizes extracting the Maximum Principal stress from three critical regions: the neck, driver hole, and potting level. To achieve accurate results, the simulation model employs boundary and load conditions precisely aligned with ASTM standard specifications for stem lengths in the considered range (). The essential imposed conditions include the following:
- A fixed region located 90 mm below the head center;
- Potting level defined at distance D = 80 mm;
- A static load of 2300 N applied at the center of the head.
Additionally, the trunnion can be extended to simulate worst-case scenarios, where the head is mounted onto the hip stem.
1.1. State of the Art
Several studies have adopted ASTM F2996-13 and ISO 7206-4 standards to evaluate various aspects of hip prostheses, including geometry, loading, material properties, wear, and fatigue behavior. However, many works adapt these guidelines to suit specific research aims.
Taqriban et al. [6,7] assessed different manufacturing processes and geometries of 316L stainless steel implants, calculating safety factors and stress distributions. Despite concluding all designs were statically safe (SF > 1), the load application was simplified, neglecting adduction and flexion angles. Celik et al. [8] designed a narrowed proximal stem region to reduce stress shielding but applied loads based on muscle force estimations from Duda et al. [9] and Bergmann et al. [10], rather than standard-defined conditions.
Chethan et al. [11,12] used the standard to optimize cross-sectional geometry, but applied the 2300 N force axially to the neck, shifting stress away from the neck to the potting region—diverging from standard specifications. Guzman et al. [13] modified loading and boundary conditions, extending fixation from 90 mm to 115 mm and using force magnitudes and directions derived from dynamic activities, prioritizing geometric optimization over strict standard adherence. Campioni et al. [14] used ISO 7206 to model various load and inclination angles, identifying worst-case scenarios for experimental validation and pointing out that ISO-based conditions may underestimate in vivo stress. Ceddia et al. [15] investigated wear by varying Morse taper designs under a 4000 N load, extending fixation up to the neck and excluding potting-level considerations. While several static analyses introduced modifications to the standard for exploring aspects beyond its original intent, fatigue studies by Sugano et al. [16] and Corda et al. [17] closely adhered to ASTM guidelines, incorporating adduction/flexion angles and precise force magnitude and direction. Moreover, Guner et al. [18] applied the standard to assess stress shielding, adding a PEEK layer coated with hydroxyapatite to the femoral stem surface and evaluating resultant stresses on both the implant and femoral bone.
In summary, while ASTM and ISO standards provide valuable guidance, their frequent modification limits cross-study comparability. Systematic analysis of how changes in parameters like inclination angles, load direction/magnitude, fixation, and trunnion use affect outcomes could enhance consistency in simulation-based prosthesis evaluation.
1.2. Aim of the Project
This project aims to investigate certain variations encountered in applying the numerical standard, with the objective of explaining discrepancies observed among literature results. Specifically, attention is focused on two primary modifications: the use and extension of the trunnion, and the inclination angles of the hip stem in the frontal (adduction) and lateral (flexion) planes. Additionally, an investigation is performed regarding the effects of loads applied axially along the prosthesis neck.
The null hypothesis of the study states that variations in the trunnion extension and stem orientation angles (, ) do not produce significant changes in the stress distribution within the hip prosthesis when analyzed under standardized boundary conditions according to ASTM F2996-13. Rejecting this hypothesis would indicate that even minor deviations in these geometric parameters substantially influence the internal stress state, thereby affecting the mechanical behavior and potentially the long-term clinical performance of the implant.
2. Materials and Methods
The overall workflow of the study is illustrated in Figure 1. It begins with the definition of the boundary conditions according to ASTM F2996-13 and the experimental reference from ISO 7206-4, followed by the development of the finite element model and the subsequent parametric analysis performed to investigate the influence of the trunnion extension and stem orientation angles on the stress distribution within the implant. The focus was on validating a finite element model of the prosthesis, developed according to the standards outlined in the Introduction, by conducting a mesh sensitivity analysis. Once validated, the model was systematically modified to investigate how these changes affect the results. All numerical simulations were performed using Ansys Mechanical 2023 (Ansys Inc., Canonsburg, PA, USA), while post-processing and data analysis were carried out in MATLAB R2023a (MathWorks, Natick, MA, USA).

Figure 1.
Workflow of the study.
2.1. Benchmark
A stem geometry as specified in the ASTM standard was considered. The 3D model of the stem was directly provided by the standard. The initial steps involved positioning the prosthesis at specific inclination angles to replicate standard conditions. The guidelines indicate two key distances from the center of the prosthesis head: 80 mm, which defines the region recommended for calculating stresses and strains, and 90 mm, which defines the upper limit of the boundary constraints.
Prior to determining these distances from the center of the prosthesis head, a reference plane was constructed by taking into account the adduction () and flexion () angles and imposing the X-axis corresponding to the stem axis.
Thanks to this procedure, the final axis is aligned with the intended force direction, accounting for the orientation angles, and the cutting planes are referenced to this axis. In accordance with the standard’s recommendation to evaluate stresses at 80 mm, two cuts were made at heights of 75 mm and 85 mm to assess the stress distribution in this region, deliberately avoiding the area immediately adjacent to the encastre region (located at 90 mm) to prevent potential numerical artifacts. The final configuration used to define the potting level and boundary regions is shown in Figure 2.
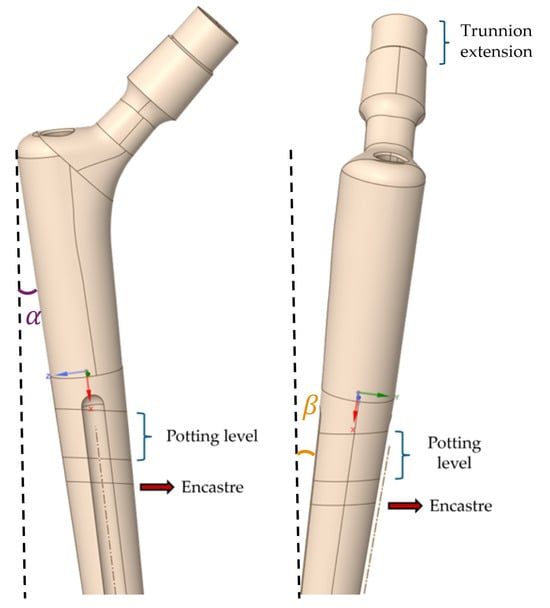
Figure 2.
Application of and angles. (Left): XZ plane; (Right): XY plane.
After orienting the space, an extrusion was applied at the top of the head. The ASTM standard does not specify the exact length of the trunnion extension, but only states that it should represent a worst-case scenario. Since the considered prosthesis presents a reduced femoral offset (about 30 mm) compared to its length (about 150 mm), it is common to add a femoral head with a few millimeters offset to best fit the patient’s anatomy. Based on a review of commercially available designs, +0, +4, and +8 mm are typical cases. Since the femoral head is not included in the model, this extrusion value is intended to reproduce that condition, adopting an extension of 8mm in the neck axis direction. The material selected for the simulation is Ti6Al4V. The choice of titanium alloy was primarily driven by its widespread clinical use in load-bearing orthopedic components. As the analysis focuses on the static behavior of the geometry, the parameters defined are the Young’s modulus and the Poisson’s ratio (which plays a minor role in this context) [19]. The parameters listed in Table 1 are consistent with the assumption of elastic behavior: the material was modeled as ‘Isotropic Elastic’. This assumption holds as long as the maximum stresses remain below the yield strength of the material, thus avoiding plastic deformation, which is not relevant to the current analysis.

Table 1.
Mechanical properties [19].
After defining the prosthesis sets, the boundary and loading conditions were established in accordance with the ASTM F2996-13 standard. Along the distal part of the stem, the encastre was applied. The load was defined as a concentrated force with a magnitude of 2300 N, applied at the center of the 8 mm extension. The force was decomposed into three components, corresponding to the global coordinate system defined by the prosthesis geometry. The formulas are reported in Equation (1), while the force is graphically represented in Figure 3b, and the Ansys setup is shown in Figure 3a.
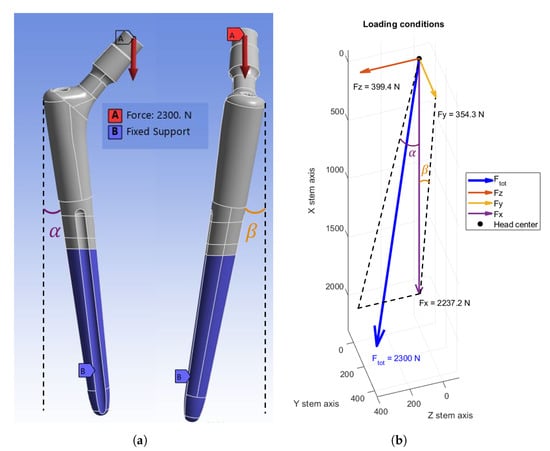
Figure 3.
Loading and boundary conditions: (a) Ansys setup. (b) Force components.
Mesh and Sensitivity Analysis
To obtain reliable results, the final step involved mesh generation and its validation through a mesh sensitivity analysis. In this study, a total of seven distinct meshes were considered, ranging from the coarsest to the most refined. The first two meshes were generated using a uniform element size across the entire geometry. Starting from the third mesh, however, spheres of influence were introduced. to allow for localized refinement in specific regions of interest. A consistent ratio of element sizes was maintained between consecutive meshes to ensure a smooth and systematic refinement process. All relevant details are summarized in Table 2, including the element size ratio, which was kept between 1.5 and 2 to ensure that each refinement stage maintains a consistent relationship with the previous one. The initial element size was set to 4 mm, and in the final mesh, it was reduced to 0.75 mm in the refined regions.

Table 2.
Mesh details.
The results obtained from the analysis focus on Von Mises and Maximum (1st) Principal stresses, computed in accordance with the recommendations provided by the standard. As previously mentioned, stress evaluation is performed in three critical regions of the prosthesis: the neck region, the driver hole, and the potting level. The relative error between the stress values obtained from consecutive meshes is reported to verify whether it falls below the 5% threshold (convergence criterion). The following tables summarize the results obtained from the seven simulations with varying element sizes. The last column reports the final error computed between the two most refined meshes. With regard to the Maximum Principal stress, Table 3 presents the trend of the values throughout the mesh refinement process, showing that the final error falls well below the defined threshold in the last computation.

Table 3.
Maximum Principal stress and final relative error.
Regarding the Von Mises stress (Table 4), the trend is very similar, and in this case as well, the final error remains within acceptable limits. In both cases, the region exhibiting the highest error is the driver hole set, due to its complex geometry and the associated challenges in the meshing process, which tend to generate more distorted elements.

Table 4.
Von Mises stress and final relative error.
2.2. Parametric Study
In order to make sense of the diversity of results obtained from the literature and to better analyze how they change depending on the geometry setups, this paragraph examines the trunnion, as well as both angles ( and ), with some combinations of values. The chosen method to determine the correct angle variation of the prosthesis involves manipulating the force components: , , and are calculated for variations of from 6° to 12° in intervals of two, and for variations of in intervals of three. The magnitude of the force remains 2300 N, while the various components vary as shown in Table 5.

Table 5.
Force components—angle variation. The section highlighted in yellow represents the baseline case defined by the standards.
Since the adoption of the flexion angle is often omitted, the considered range begins at 0°, intentionally excluding the intermediate step of 3°. Once the force components were computed, the simulations were carried out using the same validated model described in Section Mesh and Sensitivity Analysis. It is important to emphasize that the cutting planes used in this phase have not been modified, even though they refer specifically to the standard configuration. Given that the tested angles are close to the reference values, it was assumed that maintaining the fixed setup does not significantly affect the results. Particularly, the critical stress area of the potting level is in the lateral portion; therefore, is the main source of difference, and it is featured by a variation of maximum 4° from the standard configuration. Regarding the trunnion, due to the lack of information on the neck extension used for force application, three cases were considered, as previously hinted: 0 mm, 4 mm, and 8 mm.
For the computation of results, the reference model adopts the standard orientation, with and equal to 10° and 9°, respectively. Since several studies in the literature apply the load axially along the neck, this configuration was also tested, even though it diverges significantly from the standard guidelines.
3. Results
Figure 4 shows a general view of the stress distribution. The analysis focuses on the three predefined regions: neck, driver hole, and potting level. As expected, the distal portion of the stem exhibits no stress due to the fixed boundary condition.
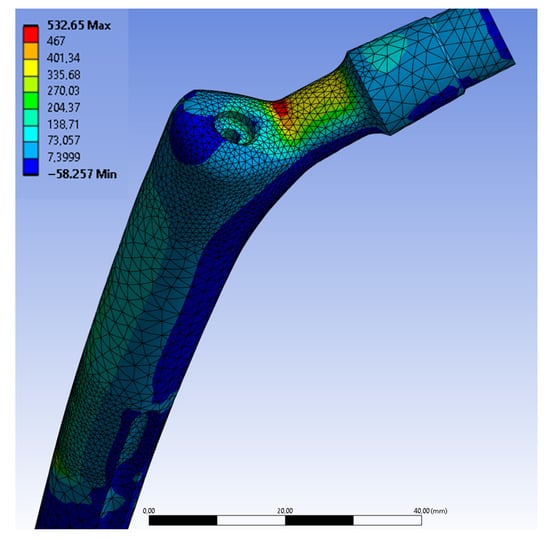
Figure 4.
Maximum principal stress distribution.
Figure 5 presents the results from both the Maximum Principal and Von Mises stress analyses; the stress distribution can be interpreted through a few key observations.
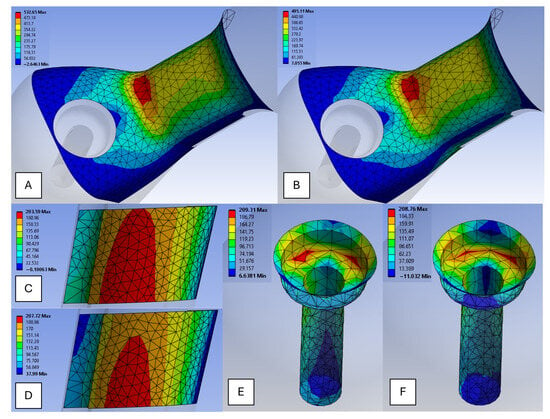
Figure 5.
Stress distribution in the three regions: (A) Neck Maximum Principal; (B) Neck Von Mises stress; (C) Potting level Maximum Principal; (D) Potting level Von Mises stress; (E) Driver hole Maximum Principal; (F) Driver hole Von Mises stress.
Starting with the neck region, shown in Figure 5A,B, it can be observed that this is the most highly stressed area, due to its function in transferring loads from the implant head to the stem. Owing to its narrow geometry, the transition creates a condition of elevated stress, subjecting the region to significant bending and torsional forces during load application. This makes it a critical point for stress concentration. The combination of high loading and unfavorable geometric factors renders the neck particularly vulnerable.
As illustrated in Figure 5E,F, the driver hole also exhibits stress accumulation, primarily due to its geometry and structural role. This region acts as a geometric notch, interrupting the continuity of the prosthesis and naturally creating a stress riser under loading conditions. Consequently, the stress distribution in the driver hole is non-uniform, with localized peaks concentrated in specific zones.
The potting level, shown in Figure 5C,D, displays a much smoother stress distribution compared to the more critical regions such as the neck and driver hole. This behavior is attributable to the more uniform geometry of the potting area, which facilitates a gradual transfer of stresses from higher to lower values. As a result, the stress distribution in this region tends to be more balanced, with minimal concentration peaks.
The stresses shown in the contour map exhibit values significantly higher than those computed during the mesh sensitivity analysis. For example, in Figure 5A, the Maximum Principal stress reaches a peak of 532 MPa, which has been excluded by applying the 97.5% percentile criterion. This approach discards extreme values that are not representative of the actual stress distribution (see Section Mesh and Sensitivity Analysis). Table 6 summarizes the final results, highlighting the maximum stress values observed in the key regions of the prosthesis.

Table 6.
Von Mises and Maximum Principal stresses of Mesh 6.
3.1. Hip Stem Orientation
The considered spectrum of possible combinations for the and angle variations consists of a 4 × 4 matrix, which reflects the force components described in Section 2.2. The corresponding results are presented in Figure 6, where the stress behavior in the three regions of interest is plotted using 3D curves. These curves are constructed based on the maximum stress values (97.5% percentile) obtained from each simulation.
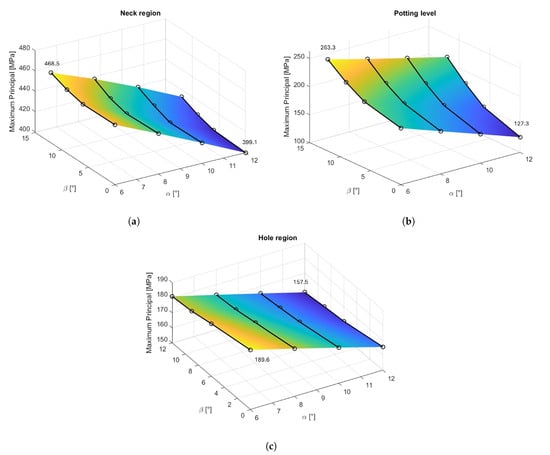
Figure 6.
Trend of Maximum Principal stress based on the variation in both angles: (a) Neck. (b) Potting Level. (c) Driver Hole. In the color scale, yellow corresponds to higher values, while blue corresponds to lower ones, referred to the single 3D plot.
The graph is composed of two axes representing the orientation angles, and a third axis displaying the corresponding stress values. The latter is also qualitatively conveyed through the surface color, which ranges from yellow (indicating higher stresses) to blue (indicating lower stresses). This surface map reveals a trend associated with the varying orientations of the prosthesis.
Table 7 reports the force values used to generate the figure above. At first glance, some differences can be observed between the regions: all exhibit the highest stress values at the lowest angle (6°). However, with respect to the angle, the behavior differs: the neck (Figure 6a) and the potting level (Figure 6b) reach their maximum stress at the highest considered (12°), while for the driver hole region (Figure 6c), the maximum is observed at the lowest (0°). It can be inferred that the component (corresponding to the out-of-frontal-plane direction) does not influence the hole region stress as significantly as it does in the other two regions. Due to the geometric configuration and the relative position of the hole with respect to the head center, the torsional effects introduced by are less impactful compared to the bending effects caused by . In contrast, for the neck and potting level, plays a more prominent role.

Table 7.
The section highlighted in yellow represents the baseline case defined by the standards; the values highlighted in bold indicate the maximum stress observed in each region.
To quantify the amplitude of stress variation, the two variables ( and ) are alternately held constant, allowing the dependence of the Maximum Principal stress on each angle to be analyzed independently across all regions. For example, by fixing at a given value, the variation is computed between the stress values obtained at ° and °; this procedure is repeated for each value of . The same analysis is performed in reverse, fixing and computing the variation between stresses at ° and °. The results of these calculations are summarized in Table 8.

Table 8.
Variations of stress depending on angles. The downward arrow indicates a decreasing variable, while the upward arrow indicates an increasing one.
From this table, the effect of the different prosthesis orientations for the three sets can be summarized in a few points:
- When reducing the adduction angle , the stress is higher for all three regions;
- The neck is the least affected region, and the maximum change (ca. 12%) is registered by varying the adduction angle;
- The driver hole behaves similarly to the neck in terms of magnitude of variation, but it presents an opposite trend with the flexion angle , albeit with negligible effects;
- The potting level is strongly dependent on both the adduction and flexion angles.
Based on these calculations, it can be concluded that the influence of the orientation angles is far from negligible when evaluating stress in the potting level region. For the other regions, the variation is also appreciable, with the angle playing a predominant role.
When the load is aligned with the neck axis, the stress distribution changes notably compared to the standard configuration (Figure 7). Bending and torsional effects are minimized, reducing neck region stresses to around 10 MPa, far below values seen previously. Slightly higher stresses appear at the potting level, and the location of maximum stress shifts to the right side of the stem in the frontal view.

Figure 7.
Maximum Principal stress distribution for a particular case.
3.2. Trunnion Extension
In this section, the results corresponding to the variations of the trunnion are presented. As shown in Figure 8, both Von Mises stress and Maximum Principal were computed for each region: all the cases were obtained with the same approach as that described in Section 2.1 regarding the 8mm extension.
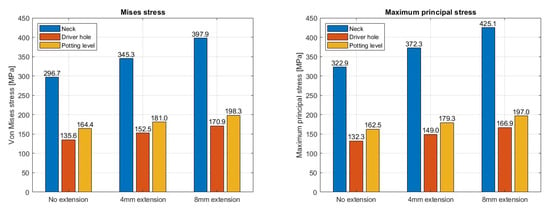
Figure 8.
Stress variations with different trunnion extensions.
As clearly expected, increasing the trunnion extension leads to higher stress values in all regions. Regarding the Maximum Principal stress, the trend is nearly linear, with increases of approximately 13%, 11%, and 9% for the neck, driver hole, and potting level, respectively. Notably, the neck is the most sensitive region, showing a substantial increase of about 24% when comparing the 8 mm extension to the no-extension case. These percentage changes refer to the Maximum Principal stress, but the Von Mises stress follows a similar trend.
In conclusion, the inclusion of the trunnion is a key factor that must be explicitly specified, as it significantly affects the peak stress values, even though it does not alter the overall stress distribution.
4. Conclusions
This section summarizes the key results from the stress analysis conducted on the hip prosthesis, offering interpretations of the observed outcomes, discussing their implications, and proposing directions for future research.
4.1. Comparison with the Standard
Following the guidelines of ASTM F2996-13 and ISO 7206-4, the results from this study were compared with reference data from a round-robin investigation reported by ASTM.
Table 9 presents the average values reported by ASTM, alongside the results obtained in this study and the corresponding relative errors.

Table 9.
Comparison with the standard.
According to the standard, an acceptable agreement is defined as a relative difference within 8%. Therefore, the model is considered validated for the neck and driver hole regions. However, the discrepancy observed at the potting level, approximately 16%, suggests differences in model setup. Possible sources of this divergence include uncertainties in orientation angles (, ) and trunnion extension, aspects only minimally detailed in ASTM F2996-13. Notably, trunnion length is user-defined, and orientation angles are explicitly specified only in the experimental ISO 7206-4 standard. Given their influence on stress distribution, particularly in regions distant from the loading point, such as the potting level, these parameters were further investigated based on insights from the literature.
4.2. Parametric Study
Variations in stress results reported across studies often arise from differing interpretations of the standard, particularly regarding prosthesis orientation angles, trunnion extension, and load application methods. Figure 6 clearly illustrates the strong dependence of potting-level stresses on adduction and flexion angles. Unfortunately, such setup details were not explicitly reported by the laboratories involved in the ASTM round-robin study, complicating the interpretation of their experimental conditions. Nevertheless, the literature provides valuable reference points.
Several studies explicitly applied the orientation angles recommended by the standard [16,18], especially in fatigue analyses. For example, Campioni et al. [14], in their investigation of worst-case orientations, reported trends and stress magnitudes consistent with the present study. They demonstrated non-linear increases in stress when decreasing and increasing , despite using different geometries.
Some studies [7,12,17] applied a purely axial load of 2300 N directed along the stem axis. When this approach was replicated in the present work, significantly higher potting-level stresses were observed (approximately 300 MPa). Although consistent with those findings, this loading condition substantially deviates from ASTM guidelines and is therefore unsuitable for identifying standard-compliant critical regions.
With regard to trunnion extension, its length plays a crucial role when the femoral head is omitted. Since physiological loading originates proximally, increasing the moment arm, the trunnion extension is essential for realistic simulation. Indeed, some studies explicitly model the femoral head instead of using a trunnion. Therefore, when analyzing the stem independently, the inclusion of a trunnion is strongly recommended.
From a biomechanical standpoint, these variations can alter the mechanical stimulus transmitted to the periprosthetic bone. Changes in stress magnitude and orientation may lead to heterogeneous bone remodeling, potentially inducing stress shielding in underloaded regions or excessive resorption near high-stress zones.
4.3. Limitations and Future Developments
Some limitations affect the generalizability of the present results. First, the computational model applies a concentrated nodal load at the top of the stem, introducing local stress artifacts at the point of application. Although mesh refinement amplifies these peaks, their physical relevance is negligible, as the affected region lies outside the critical zones under investigation. Future improvements could involve incorporating a femoral head and applying distributed loads; however, this would require modeling contact mechanics, significantly increasing computational complexity.
A second limitation is the study’s focus on a single prosthesis geometry, which may limit the applicability of the findings. While qualitative trends relating stress to orientation angles may hold across different designs, quantitative outcomes are likely to vary significantly. To address these issues, future research should consider multiple prosthesis geometries. This would enable the development of regression-based analytical models capable of predicting stress variations as functions of orientation angles (, ). Such models would provide useful guidance for the design of customized prostheses, especially for patients with anatomical irregularities or unique surgical constraints.
Eventually, in this study, only static simulations were conducted to ensure conformity with the standard, but it could also be interesting to explore dynamic configurations and evaluate other biological aspects, such as micro-motion and the associated wear in the implant. Then, combining mechanical simulations with computational mechanobiology would bridge the gap between numerical prediction and clinical outcome, supporting the optimization of hip implant design toward improved long-term osteointegration and reduced revision rates.
Author Contributions
Conceptualization, M.C., G.D. and M.B.; Methodology, M.C., G.D. and M.B.; Formal analysis, M.C. and G.D.; Investigation, M.C. and G.D.; Data curation, M.C. and G.D.; Writing—original draft, M.C. and G.D.; Writing—review and editing, M.B.; Visualization, M.C. and G.D.; Supervision, M.B. All authors have read and agreed to the published version of the manuscript.
Funding
No specific funding was received for this research.
Institutional Review Board Statement
Not applicable.
Informed Consent Statement
Not applicable.
Data Availability Statement
The data that support the findings of this study are available from the corresponding author upon reasonable request.
Acknowledgments
The authors would like to thank Giorgio Colombo (Politecnico di Milano) for his valuable contribution to the successful completion of this publication.
Conflicts of Interest
The authors declare no conflicts of interest.
References
- Belwanshi, M.; Jayaswal, P.; Aherwar, A. A study on finite element analysis methodologies and approaches used for total hip arthroplasty. Mater. Today Proc. 2022, 56, 2596–2604. [Google Scholar] [CrossRef]
- Bertolini, M.; Moreschini, C.; Siffredi, P.; Colombo, G.; Rossoni, M. Finite Element Analysis of the Donning Phase of a Prosthetic Socket for Transfemoral Amputees. In Advances in Digital Human Modeling, Proceedings of the 8th International Digital Human Modeling Symposium, Antwerp, Belgium, 4–6 September 2023; Scataglini, S., Harih, G., Saeys, W., Truijen, S., Eds.; Springer: Cham, Switzerland, 2023; pp. 1–10. [Google Scholar]
- Snekhalatha, U.; Dhason, R.; Rajalakshmi, T. Design of patient specific hip prosthesis based on finite element analysis: A comparative study. Biomed.-Eng.-Appl. Basis Commun. 2023, 35, 2350017. [Google Scholar] [CrossRef]
- ASTM F2996-13; Standard Practice for Finite Element Analysis (FEA) of Non-modular Metallic Orthopaedic Hip Femoral Stems 1. ASTM: West Conshohocken, PA, USA, 2015.
- ISO 7206-4; Implants for Surgery-Partial and Total Hip Joint Prostheses-Part 4: Determination of Endurance Properties and Performance of Stemmed Femoral Components. ISO: Geneva, Switzerland, 2010.
- Taqriban, R.B.; Ismail, R.; Jamari, J.; Bayuseno, A.P. Finite element analysis of artificial hip joint implant made from stainless steel 316L. Bali Med. J. 2021, 10, 448–452. [Google Scholar] [CrossRef]
- Taqriban, R.B.; Ismail, R.; Jamari, J.; Bayuseno, A.P. Computational Analysis of Different Designed Hip Joint Prostheses Using Finite Element Method. In Proceedings of the 2020 7th International Conference on Information Technology, Computer, and Electrical Engineering (ICITACEE), Semarang, Indonesia, 24–25 September 2020; IEEE: New York, NY, USA, 2020; pp. 164–168. [Google Scholar]
- Çelik, T.; Kişioğlu, Y. Evaluation of new hip prosthesis design with finite element analysis. Australas. Phys. Eng. Sci. Med. 2019, 42, 1033–1038. [Google Scholar] [CrossRef] [PubMed]
- Duda, G.N.; Schneider, E.; Chao, E.Y.S. Internal forces and moments in the femur during walking. J. Biomech. 1997, 30, 933–941. [Google Scholar] [CrossRef] [PubMed]
- Bergmann, G.; Deuretzbacher, G.; Heller, M.; Graichen, F.; Rohlmann, A.; Strauss, J.; Duda, G.N. Hip contact forces and gait patterns from routine activities. J. Biomech. 2001, 34, 859–871. [Google Scholar] [CrossRef] [PubMed]
- Chethan, K.N.; Zuber, M.; Shenoy, S.; Kini, C.R. Static structural analysis of different stem designs used in total hip arthroplasty using finite element method. Heliyon 2019, 5, e01767. [Google Scholar] [CrossRef] [PubMed]
- KN, C.; Zuber, M.; Bhat N, S.; Shenoy B, S. Optimized trapezoidal-shaped hip implant for total hip arthroplasty using finite element analysis. Cogent Eng. 2020, 7, 1719575. [Google Scholar] [CrossRef]
- Guzmán, M.; Durazo, E.; Ortiz, A.; Sauceda, I.; Siqueiros, M.; González, L.; Jiménez, D. Finite element assessment of a hybrid proposal for hip stem, from a standardized base and different activities. Appl. Sci. 2022, 12, 7963. [Google Scholar] [CrossRef]
- Campioni, I.; Notarangelo, G.; Andreaus, U.; Ventura, A.; Giacomozzi, C. Hip prostheses computational modeling: FEM simulations integrated with fatigue mechanical tests. In Biomedical Imaging and Computational Modeling in Biomechanics; Springer: Dordrecht, The Netherlands, 2013; pp. 81–108. [Google Scholar]
- Ceddia, M.; Solarino, G.; Cassano, G.D.; Trentadue, B. Finite element study on stability in the femoral neck and head connection to varying geometric parameters with the related implications on the effect of wear. J. Compos. Sci. 2023, 7, 387. [Google Scholar] [CrossRef]
- Sugano, N.; Hamada, H.; Uemura, K.; Takashima, K.; Nakahara, I. Numerical analysis evaluation of artificial joints. J. Artif. Organs 2022, 25, 185–190. [Google Scholar] [CrossRef] [PubMed]
- Corda, J.V.; Chethan, K.; Shenoy, S.; Shetty, S.; Zuber, M. Fatigue life evaluation of different hip implant designs using finite element analysis. J. Appl. Eng. Sci. 2023, 21, 896–907. [Google Scholar] [CrossRef]
- Guner, A.T.; Kocak, S.; Meran, C. Mechanical analysis of a PEEK titanium alloy macro-composite hip stem by finite element method. J. Braz. Soc. Mech. Sci. Eng. 2024, 46, 338. [Google Scholar] [CrossRef]
- Niinomi, M. Mechanical properties of biomedical titanium alloys. Mater. Sci. Eng. A 1998, 243, 231–236. [Google Scholar] [CrossRef]
Disclaimer/Publisher’s Note: The statements, opinions and data contained in all publications are solely those of the individual author(s) and contributor(s) and not of MDPI and/or the editor(s). MDPI and/or the editor(s) disclaim responsibility for any injury to people or property resulting from any ideas, methods, instructions or products referred to in the content. |
© 2025 by the authors. Licensee MDPI, Basel, Switzerland. This article is an open access article distributed under the terms and conditions of the Creative Commons Attribution (CC BY) license (https://creativecommons.org/licenses/by/4.0/).