Abstract
The rapid development of China’s high-speed railways (HSRs) and the implementation of revenue management policies have promoted the marketization of railway passenger transport, which is mainly reflected in the gradual transformation from a seller’s market dominated by operating companies to a buyer’s market dominated by passenger demand. Passenger travel needs are becoming increasingly diverse. In order to improve the quality of HSR services and attract more passengers, this paper starts from passenger satisfaction and considers the heterogeneity of travel preferences of passengers with different travel distances. Based on the passenger travel data of the Nanning-Guangzhou (NG) HSR line, the K-means clustering method is used to classify passengers into three categories: short-distance, medium-distance, and long-distance travel. A structural equation modeling–multinomial logit (SEM-MNL) model integrating both explicit and latent variables was constructed to analyze passenger travel origin-destination (OD) choices. Stata software was used to estimate passenger preferences for perceived satisfaction functions across different travel distances. Finally, considering constraints such as load factor, departure capacity, and spatiotemporal passenger flow demand, a line planning optimization model was constructed with the goal of minimizing train operating costs and maximizing passenger travel satisfaction. An improved subtraction optimizer algorithm was designed for the solution. Using the NG Line as a case study, the proposed method achieved a reduction in train operating costs while enhancing overall passenger satisfaction.
1. Introduction
By the end of 2024, the operating mileage of China’s HSR network had reached 48,000 km, accounting for more than 70% of the global total. The “eight vertical and eight horizontal” national HSR network had been fully established, covering 97% of cities with populations exceeding 500,000. In the same year, the number of HSR passengers reached 3.272 billion, representing 75.9% of total railway transport. HSR has thus assumed an increasingly vital role in passenger transportation. The rapid expansion of China’s HSR system has continuously reshaped the passenger transport market, with HSR progressively capturing market share from other modes of transport and intensifying intermodal competition. Meanwhile, as income levels have risen and travel options have diversified, passengers have increasingly prioritized comfort and convenience, placing greater emphasis on the overall travel experience. Railway transportation plays an important role in medium to high freight distances and is cost-effective in such situations [1].
However, due to the substantial investment required for HSR construction and its high operating costs, most HSR lines in China are currently operating at a loss. To attract more passengers, railway operators have continuously adjusted line planning and ticket pricing strategies. Line planning is generally to determine a set of lines with their corresponding operation frequencies and stop plans [2]. As an important component of the public transportation system, HSR line planning can affect service quality, which in turn directly impacts passenger travel experience and ultimately affects passenger choice behavior. Passenger satisfaction serves as a comprehensive reflection of service quality and is a key determinant of subsequent behavioral intentions. According to Oliver [3], satisfaction is a prerequisite for customer loyalty, and a significant positive correlation between satisfaction and loyalty has been well established, directly affecting passengers’ choice behavior. Passenger satisfaction not only reflects the degree of alignment between supply and demand in HSR services but also functions as a key metric for optimizing service quality. As the core element of HSR operations, the design quality of line planning plays a decisive role in enhancing the railway’s economic performance and ensuring operational success. Therefore, line planning must be developed with the objective of meeting passenger travel needs and maximizing satisfaction.
Historical ticket data shows that there are significant differences in travel needs and preferences among different OD passengers. Travel passengers have high requirements for the safety of trains, while long-distance travel passengers are more concerned about economy and comfort. This is manifested in the difficulty of obtaining tickets for some trains and the lack of seats for some trains, resulting in the current line planning scheme’s train flow not matching passenger needs well. This paper constructs a passenger satisfaction function, quantifies the satisfaction function of passengers traveling at different distances, constructs a satisfaction line planning model for passengers traveling at different distances, and optimizes and adjusts the train operation plan. To meet the travel needs of passengers, improve the operational efficiency of HSR lines, enhance the quality of passenger transportation products, attract more passenger flow, and save operating costs. The paper is divided into 6 parts and the structure is arranged as follows: the second part is a literature review; the third part explains the research problem of this paper and constructs K-means clustering, SEM-MNL model and operation plan optimization model; the fourth part is the questionnaire design, implementation and algorithm design; the fifth part takes the Nanning-Guangzhou Line as an example to study the feasibility of the research method and optimize the results; Finally, Section 6 concludes the paper.
2. Literature Review
2.1. Passenger Travel Choice Behavior
Passenger travel choice behavior, as the foundation of passenger transport organization, has long been a focal point of research. Current studies primarily concentrate on three aspects: travel mode choice behavior, train choice behavior, and ticket purchase behavior.
In terms of passenger travel mode choice behavior, Roma et al. [4] analyzed travel mode selection under the competitive environment of HSR and aviation, considering both service level factors and individual passenger characteristics. Zhang et al. [5] constructed a Binary Logit model for passenger travel choices on the Beijing–Shanghai line using Stated Preference (SP) and Revealed Preference (RP) survey data. The influence of various factors on passenger choices was quantified, thereby revealing the actual travel demand on the Beijing–Shanghai corridor. Building on this, Cheng et al. [6] incorporated emerging travel modes such as air–rail intermodal transport and civil aviation transfer, conducting OD surveys across different travel distances. Multinomial Logit and mixed Logit models were established, and the results indicated significant differences in passengers’ travel mode preferences across varying travel distances.
In terms of passenger train selection behavior, various factors influence passengers’ choices once they decide to travel by HSR, resulting in distinct train preferences. Zhao et al. [7] examined passengers’ time-based preferences by incorporating departure time into a generalized cost function and constructing a Logit model for train selection under parallel train conditions. Differences in passenger choices among parallel trains were explained in terms of selection rates and ticket purchase characteristics. Yang et al. [8] proposed a two-step approach that employed latent class analysis (LCA) to segment passengers, followed by the construction of a random parameter Logit (RPL) model to estimate heterogeneous passenger preferences and quantify their willingness to pay for parallel trains. Sun et al. [9] applied support vector regression and artificial neural networks to predict HSR passengers’ train selection types, achieving higher prediction accuracy than traditional discrete choice models.
In general, research on passenger choice behavior has primarily been conducted using disaggregate models and SEM, with the Logit discrete choice model being the most representative. In some studies, machine learning methods have also been applied. The selection of characteristic variables has mainly focused on three aspects: passenger characteristics, train attributes, and random factors.
2.2. Passenger Satisfaction Study
The theory and methodology of satisfaction were first introduced in the study of customer behavior within economic markets by Swedish scholars. Subsequently, Fornell et al. [10] developed the American Customer Satisfaction Index (ACSI) model based on the Customer Satisfaction Index (CSI), which has since been widely applied. In the transportation field, with the growing marketization of operations, passenger satisfaction has gradually become a major research focus. Le-Klähn et al. [11] employed the varimax orthogonal rotation method and principal component analysis to identify the fundamental dimensions of public transportation satisfaction in Munich. Through discriminant function analysis, the key influencing factors and tourist satisfaction levels were determined. Ratanavaraha et al. [12] applied multilevel modeling to explore the complex relationships among school policy, service quality, satisfaction, and loyalty in educational tour bus services. Another approach has involved the use of choice-based models derived from stated preference surveys on individual travel experiences, as demonstrated by Bellizzi et al. [13,14,15], who employed multinomial and mixed Logit models to assess perceived service quality and passenger satisfaction.
The theories and methods employed in the aforementioned satisfaction studies primarily focus on objective evaluations. However, transportation service quality is a complex concept that can also be assessed through passenger perceptions and opinions. Consequently, passenger satisfaction serves as a qualitative indicator for measuring travel service quality. It reflects a psychological state arising from the contrast between passengers’ expectations and their perceived service quality. Based on the CSI theory, a passenger satisfaction index was developed [16], and structural equation modeling (SEM) has increasingly been applied to identify key elements within service satisfaction or quality frameworks. For instance, Eboli et al. [17] constructed an SEM framework based on the satisfaction index to determine critical service factors, establish the relationship between railway passenger satisfaction and service quality, and identify the key determinants of satisfaction. In SEM, traditional parameter estimation relies on linear structural relationships, assuming independence among observations and multivariate normality of manifest variables [18]. Chen et al. [19] developed an SEM-Logit model to analyze passenger travel mode choice behavior. The study demonstrated that incorporating latent variables significantly improved the model’s goodness of fit compared with the traditional Logit model, confirming the substantial influence of latent variables on travel mode choice and enhancing both explanatory power and predictive accuracy.
2.3. Research on Passenger Train Line Planning
Line planning is a core component of railway transportation planning. As a traditional research topic, it has been extensively studied, with significant contributions in passenger train route design, optimization models, and solution algorithms. Chang et al. [20] developed a multi-objective optimization model that considered train stops, operation frequency, and train formations, aiming to minimize both railway enterprise costs and passenger time loss, and proposed a corresponding fuzzy mathematical solution. Claessens et al. [21] formulated a nonlinear integer programming model to minimize railway operating costs and solved it using a branch-and-bound exact algorithm. Sone [22] investigated the applicability of different train stop strategies, while Goossens et al. [23] transformed the line planning problem into a multi-commodity flow problem and established a single-objective programming model to optimize train operation costs. Ghoseiri et al. [24] proposed a multi-objective optimization model for train route planning, simultaneously considering railway operating costs and passenger travel time, and employed the Pareto solution set to identify optimal solutions iteratively.
In terms of passenger travel demand, many studies have constructed demand functions to optimize line planning [25]. Fu et al. [26] classified stations and trains based on passenger flow to determine line optimization strategies. Robenek optimized the train schedule with passengers at the center [27]. Ulusoy considers a general transit line with fixed stopping points and starting and ending requirements to meet diverse needs and achieve the lowest cost operation line planning [28]. At the same time, considering heterogeneous needs, it optimizes full stop, short turn, and rapid transit services and their related frequencies [29].
Overall, there is currently limited research on train line planning based on the preferences of passengers at different travel distances. Based on historical ticket data, this paper explores the main factors influencing the perceived satisfaction of passengers traveling at different distances and the heterogeneity of travel decisions. It constructs a satisfaction function for passengers traveling at different distances, considers the operating costs of trains, and adjusts and optimizes the operation plan accordingly to achieve a balance between passenger satisfaction and train operating costs, filling this gap.
3. Problem Formulation
Through the investigation of train operation, it was found that different OD passengers have different needs, and there is a significant gap in travel demand at different times. The existing train flow planning cannot match passenger flow demand well, resulting in low passenger satisfaction with travel.
3.1. Model Assumptions and Notation
- (1)
- Model assumptions
This study focuses on trains operating in a single direction on a specific HSR line, excluding cross-line services and passenger transfers. The train’s operating route, including its starting and ending stations, is predefined. The optimization considers only train coupling, stop patterns, and operating frequency across different time periods. The train type is determined by the train stop plan and whether it is reconnected.
- (2)
- Explanation of symbols
The relevant symbols involved in the model are shown in Table 1:

Table 1.
Notations.
3.2. Model Construction
- (1)
- K-means clustering model
K-means clustering is a commonly used distance-based clustering algorithm. Its goal is to partition a dataset into K clusters, such that each data point belongs to the closest cluster center. By repeatedly adjusting the positions of cluster centers, K-means continuously optimizes the density within clusters, resulting in clusters that are as compact and separated as possible. For each data point in the dataset, the distance from each cluster center is calculated using the following formula:
where is the data point, is the -th cluster center, is the dimension of the data, and are the values of and on the -th dimension respectively.
Update the center of each cluster, the calculation formula is as follows:
where is the set of data points of the -th cluster, is the number of data points in the set.
- (2)
- SEM-logit choice model
Based on utility theory, the multinomial logit model was modified to incorporate latent variables, passenger personal attributes, and travel characteristics. This model, known as the SEM-MNL model, was developed to model HSR passengers’ choice of different OD trips. This model considers HSR passenger travel variables such as age, monthly income, and travel time, as well as latent variables of perceived HSR travel satisfaction, such as safety, comfort, and economy. The utility function for passenger choosing OD trip category can be expressed as:
where is the observable objective variable of HSR passengers’ OD travel choices, namely the personal attribute variables and travel attribute variables of HSR passengers. is the coefficient vector for individual relative to the manifest variable. Similarly, C is the latent variable that influences HSR passengers’ OD travel choices due to service quality, specifically their potential perception of economy, timeliness, and other factors. is the coefficient vector for individual relative to the manifest variable. is the error term. Correspondingly, the probability of passenger choosing OD travel category in the logit model can be expressed as:
- (3)
- Construction of passenger travel satisfaction function
Previous studies on passenger travel satisfaction functions have primarily focused on factors related to line planning, quantifying railway service characteristics using specific measurement indicators. However, this approach has not captured passenger travel satisfaction from the perspective of individual passengers, limiting its ability to fully and accurately reflect actual satisfaction. Passengers exhibit OD heterogeneity in HSR travel; that is, individuals from different OD categories vary in personal attributes, travel characteristics, and perceived satisfaction. This study accounts for passenger travel OD heterogeneity by constructing a satisfaction function that integrates both passenger-specific and service-specific characteristics. Passenger-specific characteristics are represented by travel preferences, particularly travel time, while service-specific characteristics are modeled as latent variables. A micro-passenger satisfaction function for the specified travel time period is thus established, as shown in Equation (5).
where is the relative weight coefficient, which is obtained through SEM-MNL parameter estimation.
- (4)
- Line planning optimization model
- a.
- Minimize railway operating costs
Operating costs include variable costs and fixed costs. Variable costs mainly include train stop fees and per-kilometer operating costs. The train operation cost can be expressed as:
The operating cost of category trains can be calculated based on fixed operating costs, operating mileage costs, and stopping costs
- b.
- Maximize passenger travel satisfaction
Transforming micro-passenger travel satisfaction into macro-passenger flow satisfaction, and using passenger satisfaction as a guide when allocating passenger flow, the resulting passenger flow will require adjustments to the elements of the line planning to meet the principle of flow-based operation, thereby enabling subsequent train flow adjustments and optimization. Consider the maximum departure capacity of the station, the spatiotemporal demand for passenger flow, train capacity, passenger load factor and other constraints. Maximizing the perceived satisfaction of passengers traveling at different distances is shown in Equation (8).
Subject to:
4. Questionnaire Survey and Algorithm Design
4.1. Questionnaire
To collect travel data from HSR passengers, a questionnaire was designed and administered using a combination of online and offline methods. On 22–23 December 2023, an offline questionnaire survey was conducted in the waiting rooms of NG Line and stations, while an online survey was conducted from December 2023 to January 2024. The questionnaire comprised three main sections: passenger personal information, travel characteristics, and satisfaction with various service attributes, including overall satisfaction. The variables and their content are summarized in Table 2. For the satisfaction survey, passengers rated each attribute on a 5-point Likert scale, where 1 indicated strong disagreement and 5 indicated strong agreement. Ensuring an adequate sample size was critical for the reliability of the results. The required sample size was determined using the standard formula provided in reference [9].
where is the average daily passenger flow in one direction line, which is 21,000 passengers per day; is the probability of selecting a choice (satisfaction), for a neutral situation [30]; is the confidence level or margin of error (), and for a confidence level of 95%. According to Formula (9), the minimum sample size for this study is 377, and a total of 1153 valid samples were obtained through the survey.
Table 2.
Estimation results of SEM-MNL parameters for variables.
4.2. Algorithm Design
4.2.1. SABO Algorithm
The line planning model formulated in this paper represents an NP-hard problem, recognized as one of the most challenging optimization problems to solve. Accordingly, an improved SABO algorithm was designed to address the model, tailored to its specific characteristics. The SABO algorithm is used to solve optimization problems by updating the positions of population members in the search space using the subtraction mean of multiple search agents. Unlike previous approaches, the SABO algorithm calculates the arithmetic mean through a specialized operation “”, as defined in Equation (10).
where is -dimensional vector whose components are random numbers generated from the set {1,2}, the operation “*” represents the Hadamard product of two vectors, and are the objective function values of the search agents A and B, respectively, and sign is the sign function.
In the algorithm, the displacement of any search agent can be obtained by calculating the arithmetic mean of the search agents using subtraction, where . Therefore, the new position of the search agent can be calculated by Formula (11).
where is the new position of the search agent , is the total number of search agents, and is a vector of dimension where the components are normally distributed between 0 and 1.
Then, according to Equation (12), if the new position can improve the value of the objective function, the original position of the corresponding agent is replaced by the new position.
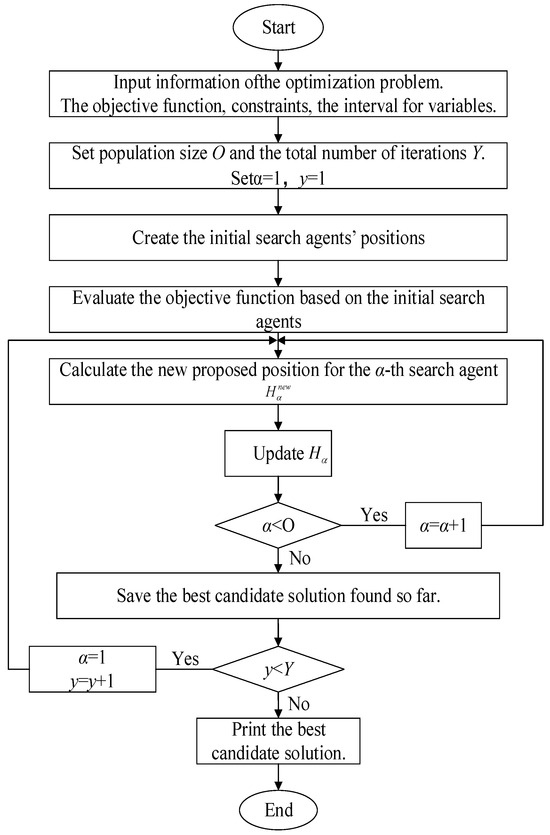
Figure 1.
SABO flowchart.
4.2.2. Algorithm Improvements
To enhance the algorithm’s efficiency and performance, the chaotic mapping method, the golden sine algorithm, and the SABO algorithm were integrated to improve the subtraction optimization algorithm. Initially, the chaotic mapping method is employed to generate random numbers, which exhibit better fitness, a more uniform distribution, and greater particle diversity. This accelerates convergence and improves solution quality, particularly in search spaces with multiple local optima, as the method facilitates more effective identification of the global optimum.
Next, the golden sine algorithm (Gold-SA) is applied to help particles escape local optima and achieve global optimization. By leveraging the sine function and its relationship with the unit circle, Gold-SA iteratively traverses the search space. During position updates, the introduction of the golden section number narrows the search focus to regions likely to yield better results. This approach significantly enhances search speed while maintaining a balance between exploration and exploitation.
4.2.3. Algorithm Key Processing
(1) Based on the form of the solution, an initialization scheme that conforms to the solution characteristics is designed. A complete line planning is represented by a one-dimensional array of , where is the total number of time periods in the line planning and is the number of train types.
(2) Every elements in the array represent the frequency of different types of trains running during a certain time period . The frequency of trains running during that time period is estimated and limited based on the maximum cross-sectional passenger flow. Assume that there are particles in the -dimensional search space, each particle represents a solution to the running plan. The position of the particle is:
In the line planning optimization model, if there are 8 time periods and 6 types of trains, the solution space is specifically composed as follows:
(3) A penalty function is introduced to process the constraints to ensure that the solution is within the feasible domain, otherwise a penalty will be imposed on the function value.
(4) Fitness function conversion. The optimization of the line planning involves two objectives: minimizing railway operating costs and maximizing passenger satisfaction. To address the differences in scale and units between these objectives, the unified objective method is employed, using linear weighting to convert the multi-objective model into a single-objective function. Dimensional differences between the objectives are adjusted using a conversion coefficient. The resulting unified and weighted objective function is expressed as follows:
Among them, and are weight coefficients, representing the weights of railway operating costs and passenger perceived satisfaction [31], respectively, , , and . In the subsequent calculations, the magnitude difference between the and values are small, and the dimensional conversion coefficient is used to eliminate the dimensional difference between the two objective functions. , the fitness function can be expressed as:
4.2.4. GSABO Algorithm Flow
Step 1: The basic data required for train line planning optimization is loaded, mainly including OD passenger flow demand, train alternative set, time period departure capacity, etc.
Step2: Set algorithm parameters, including population size , maximum number of iterations , and golden sine initialization parameters.
Step3: Population initialization, using the actual running line scheme as the initial solution, and randomly generating a line planning scheme using chaotic mapping.
Step4: Calculate the search agent fitness value , which is the normalized objective function value of each operation plan.
Step5: The random value in SABO is replaced by chaotic mapping to update the search agent position and calculate its fitness value.
Step6: If the fitness value of the search agent position updated by the SABO algorithm does not decrease, the golden sine algorithm is used to update the search agent position.
Step7: Calculate the fitness value and update the optimal value and current optimal position. If < , set and go to Step 5.
Step8: The algorithm terminates. When the number of algorithm iterations does not reach , set , , and go to Step 5. Otherwise, the algorithm terminates and outputs the current solution as the optimal solution.
5. Case Study
5.1. Line Information and Parameter Settings
Taking the NG HSR as a case study, this east west line connects Guangxi and Guangdong provinces and serves as a major trunk line in southern China, forming a key component of the “Eight Vertical and Eight Horizontal” railway network. As shown in Figure 2, the line spans 563 km and includes 14 operational stations, running from Nanning East Station in the east to Guangzhou South Station in the west. Train operations on this line occur at uniform speeds, and train types are classified according to stop sequences and reconnection status, with each train type defined by the combination of these two attributes.

Figure 2.
NG Line stations and numbers.
- (1)
- Passenger flow demand
By analyzing the historical ticket data of the NG Line, the daily travel demand of each OD passenger is obtained. The OD passenger flow demand and passenger time period demand are shown in Table 3 and Table 4, respectively.
Table 3.
Passenger OD travel demand.
Table 4.
Passenger travel demand by time period.
- (2)
- Train alternative set
To reduce computational complexity, a method based on alternative sets is employed for line planning. Considering factors such as passenger flow characteristics, station hierarchy, and train operating capacity on the NG Line, corresponding train alternative set combinations are determined. Train stop plans are classified into three types: direct, major-station stops, and selective-station stops. Each train operation section is composed of first-level nodes, and to account for network throughput, the maximum number of stops is limited to 10. Through screening, there are 1104 route planning schemes in the alternative sets. Table 5 presents several train alternative sets generated according to these rules. Stop behavior and reconnection status are represented using 0–1 variables, where “1” indicates a stop at the corresponding station or a reconnection operation, and “0” indicates no stop or a single-connection operation.
Table 5.
Partial train alternative set.
- (3)
- Parameter settings
The parameters in the model are assigned values based on the actual situation. Where person, if the trains are coupled together, person; According to the minimum train departure interval of 5 min, ; ; ; ; ; To reduce operating costs, ; ; Maximum number of iterations .
5.2. Cluster Analysis
Based on passenger data from the NG Line between December 2022 and May 2023, provided by the Nanning Railway Bureau, travel distance, passenger volume, average travel time, and other OD indicators were used for classification. To determine the optimal number of clusters, relevant indices were compared across varying cluster numbers. Higher Silhouette Coefficient (SCI) and Calinski-Harabasz Index (CHI) values indicate better clustering, while lower Davies-Bouldin Index (DBI) values reflect improved clustering performance. Clustering results using K-means and hierarchical methods are presented in Table 6. The analysis indicates that a three-cluster solution yields the best overall results. Solutions with K = 4–5 generate clusters containing less than 10% of the total sample, which hinders subsequent model fitting and interpretation, further supporting the selection of three clusters. Therefore, the three-cluster solution is considered the most appropriate.
Table 6.
Clustering effect.
Based on the above analysis, the final OD clustering results are shown in Table 7. The first category has 61 ODs with travel distances less than 250 km, which can be classified as short-distance HSR trips; the second category has 31 ODs with travel distances between 250 and 550 km, which can be classified as medium-distance trips; and the third category has 1 OD with travel distances greater than 550 km, which can be classified as long-distance HSR trips.
Table 7.
OD clustering results.
5.3. SEM-MNL Analysis
The SEM-MNL model variables for HSR passenger travel OD selection are determined based on personal attributes and travel attributes, and parameter estimation analysis is performed in Stata18 software, as shown in Table 2. There are many metrics for evaluating the goodness of fit of discrete choice models, among which McFadden’s R2, AIC, and BIC are commonly used. Based on these metrics, the SEM-MNL model parameter estimates are good.
5.4. Line Planning Optimization Results
According to the algorithm designed in this article, MATLAB encoding was used to solve the problem. After multiple stable runs, one of them was selected for explanation. The iteration situation is shown in Figure 3. Figure 3a–c the iterations of the overall objective function and the two sub-objectives, respectively. For comparison, a particle swarm optimization algorithm was also applied. The iteration curves indicate that the improved SABO algorithm (GSABO) converged after 150 iterations, achieving a faster convergence rate than the particle swarm method. This demonstrates that, in scenarios with numerous alternative concentrated line planning, the chaotic mapping method effectively enhances the initial solution generation of the subtraction optimizer, thereby improving convergence. Moreover, the GSABO algorithm avoided prolonged stagnation in local optima, suggesting that the incorporation of the golden section method strengthened the algorithm’s global optimization capability.
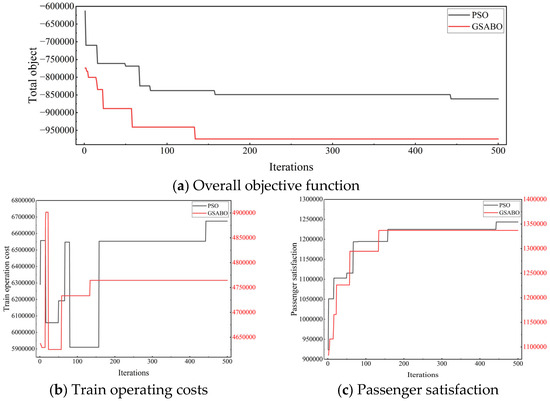
Figure 3.
Objective function iteration.
Furthermore, the iteration patterns indicate that, in balancing the two sub-objectives, passenger satisfaction—given its higher weight—was driven toward maximization, while train operating costs were minimized as far as possible within their assigned weight. Together, these adjustments guided the overall objective function toward optimal values. The rationality and efficiency observed in the iterations further demonstrate the feasibility of the improved subtraction optimizer algorithm for solving practical line planning optimization problems.
Table 8 presents a comparison of the optimization results obtained using the particle swarm optimization algorithm and the improved subtraction optimizer. The results indicate that the improved subtraction optimizer outperforms the particle swarm optimization algorithm, further confirming its efficiency and rationality in solving train operation plan optimization problems.
Table 8.
Comparison of effects before and after optimization.
Table 9 shows the current line planning scheme, while Table 10 presents the optimized line planning generated through an improved subtraction optimizer, which includes 35 trains of 14 different types. After optimization, the number of train types has decreased while the number of trains running has increased. This optimization increases train frequency while reducing the number of train types and multiplexing operations, better accommodating the diverse travel needs of passengers. Additionally, the optimized stop plan aligns more closely with actual passenger demand on the NG Line, covering all travel needs and increasing stop frequency in key zones. The revised departure schedule is also more balanced, effectively meeting the travel requirements of existing passengers.
Table 9.
Line planning scheme before optimization.
Table 10.
Optimized line planning scheme.
The comparative effect before and after optimization shows that using the improved subtraction optimizer algorithm to optimize the train operation plan can increase passenger satisfaction by 37.50% and reduce train operating costs by 13.15%. Z3 indicates that before optimization, a total of 10 trains had a passenger load factor that did not reach 50%. After optimization, all trains had a passenger load factor greater than 50%, which increased the passenger load factor of the trains. These results demonstrate that the optimized plan not only enhances passenger travel satisfaction but also lowers operating costs, effectively addressing the resource constraints and inefficiencies present in the original plan.
6. Conclusions
This study analyzes the perceived behavior of passengers based on their travel influencing factors. Based on passenger travel data, the K-means method is used to divide passengers into short, middle, and long-distance trips, construct a passenger satisfaction function, and estimate the weights of relevant factors. Then, based on the perceived satisfaction of different travel distances, the train route was fully optimized, and a subtraction optimizer algorithm was designed and improved. The results show that the optimization of the existing NG line has increased passenger satisfaction by 37.5% and reduced railway operating costs by 13.15%. The method proposed in this article can achieve a balance between passenger travel satisfaction and railway operating enterprise costs.
The satisfaction function developed in this study considers a limited set of factors. Future research could expand the model to include a broader range of variables and explore passenger perception heterogeneity in multiple dimensions, providing a more precise representation of travel choice behavior. As passenger needs continue to diversify, railway operators must offer multi-tiered transport services to improve satisfaction, attract more travelers, and strengthen their competitive position. This study offers a valuable reference for such strategic planning.
Author Contributions
X.Q.: Visualization, Validation, Methodology, Formal analysis, Data curation, Conceptualization, Writing—review & editing, Writing—original draft. L.X.: Funding acquisition, Investigation, Conceptualization, Data curation. Y.Y.: Methodology, Resources, Data curation, Writing—review & editing. C.L.: Resources, Data curation. All authors have read and agreed to the published version of the manuscript.
Funding
This work was supported by funding from the Dazhou Building Environment Engineering Technology Research Center (Grant no. SDJ2024ZC-19, Grant no. SDJ2025ZB-06).
Data Availability Statement
Data will be made available on request.
Acknowledgments
Thank you to the three experts and editors who reviewed the manuscript.
Conflicts of Interest
Author Chao Luo was employed by the company Chongqing Tongtuo Planning and Design Co., Ltd. The remaining authors declare that the research was conducted in the absence of any commercial or financial relationships that could be construed as a potential conflict of interest.
References
- Macioszek, E. Analysis of the Volume of Passengers and Cargo in Rail and Road Transport in Poland in 2009–2019. Sci. J. Silesian Univ. Technol. Ser. Transp. 2021, 113, 133–143. [Google Scholar] [CrossRef]
- Zhou, W.; Li, X.; Shi, X. Joint Optimization of Time-Dependent Line Planning and Differential Pricing with Passenger Train Choice in High-Speed Railway Networks. Mathematics 2023, 11, 1290. [Google Scholar] [CrossRef]
- Oliver, R.L. Whence Consumer Loyalty? J. Mark. 1999, 10, 33–44. [Google Scholar] [CrossRef]
- Román, C.; Espino, R.; Martín, J.C. Competition of high-speed train with air transport: The case of Madrid–Barcelona. J. Air Transp. Manag. 2007, 13, 277–284. [Google Scholar] [CrossRef]
- Zhang, R.; Ma, Y.; Zhao, B. Passenger Choice Behavior of High-speed Rail and Airline between Beijing and Shanghai. J. Transp. Syst. Eng. Inf. Technol. 2016, 16, 223–228. [Google Scholar]
- Cheng, Q.; Zhu, X.N.; Lu, W.S. Travel Mode Choice Behavior Model of Intercity Passengers with Medium and Long Haul-A Case Study of High-Speed Railway and Air Transport. J. Chongging Jiaotong Univ. 2021, 40, 39–45. [Google Scholar]
- Zhao, P.; Li, Y.F.; Li, B. Study on the train choice behavior for high speed railway passengers considering the departure time preference. J. Beijing Jiaotong Univ. 2017, 41, 49–54. [Google Scholar]
- Yang, Y.; Zhang, X.; Gao, D.; Xu, X.; Zheng, B. Research on Choice Preference of Parallel Trains for High-Speed Rail Heterogeneous Passengers. Transp. Res. Rec. 2023, 2678, 841–854. [Google Scholar] [CrossRef]
- Sun, Y.; Jiang, Z.; Gu, J.; Zhou, M.; Li, Y.; Zhang, L. Analyzing high speed rail passengers’ train choices based on new online booking data in China. Transp. Res. Part C Emerg. Technol. 2018, 97, 96–113. [Google Scholar] [CrossRef]
- Fornell, C.; Johnson, M.D.; Anderson, E.W.; Cha, J.; Bryant, B.E. The American Customer Satisfaction Index: Nature, Purpose, and Findings. J. Mark. 1996, 60, 7–18. [Google Scholar] [CrossRef]
- Le-Klähn, D.-T.; Hall, M.; Gerike, R. Analysis of Visitor Satisfaction with Public Transport in Munich. J. Public Transp. 2014, 17, 68–85. [Google Scholar] [CrossRef]
- Ratanavaraha, V.; Jomnonkwao, S.; Khampirat, B.; Watthanaklang, D.; Iamtrakul, P. The complex relationship between school policy, service quality, satisfaction, and loyalty for educational tour bus services: A multilevel modeling approach. Transp. Policy 2016, 45, 116–126. [Google Scholar] [CrossRef]
- Allen, J.; Eboli, L.; Mazzulla, G.; Ortúzar, J.d.D. Effect of critical incidents on public transport satisfaction and loyalty: An Ordinal Probit SEM-MIMIC approach. Transportation 2018, 47, 827–863. [Google Scholar] [CrossRef]
- Bellizzi, M.G.; dell’Olio, L.; Eboli, L.; Mazzulla, G. Heterogeneity in desired bus service quality from users’ and potential users’ perspective. Transp. Res. Part A Policy Pract. 2020, 132, 365–377. [Google Scholar] [CrossRef]
- Lois, D.; Monzón, A.; Hernández, S. Analysis of satisfaction factors at urban transport interchanges: Measuring travellers’ attitudes to information, security and waiting. Transp. Policy 2018, 67, 49–56. [Google Scholar] [CrossRef]
- Zhang, C.; Liu, Y.; Lu, W.; Xiao, G. Evaluating passenger satisfaction index based on PLS-SEM model: Evidence from Chinese public transport service. Transp. Res. Part A Policy Pract. 2019, 120, 149–164. [Google Scholar] [CrossRef]
- Eboli, L.; Mazzulla, G. Relationships between rail passengers’ satisfaction and service quality: A framework for identifying key service factors. Public Transp. 2015, 7, 185–201. [Google Scholar] [CrossRef]
- Chin, A.; Kit, H.; Lim, A. A new GA approach for the vehicle routing problem. In Proceedings of the 11th International Conference on Tools with Artificial Intelligence, Chicago, IL, USA, 9–11 November 1999; pp. 307–310. [Google Scholar]
- Lin, C.Y.; Gong, B.W.; Zhao, D.X.; Yang, Z.S. Timing Optimization of Traffic Signals for Emergency Evacuation in Sudden-Onset Disasters. J. South China Univ. Technol. 2013, 41, 58–65. [Google Scholar]
- Chang, Y.-H.; Yeh, C.-H.; Shen, C.-C. A Multiobjective Model for Passenger Train Services Planning: Application to Taiwan’s High-Speed Rail Line. Transp. Res. Part B Methodol. 2000, 34, 91–106. [Google Scholar] [CrossRef]
- Claessens, M.; van Dijk, N.; Zwaneveld, P. Cost optimal allocation of rail passenger lines. Eur. J. Oper. Res. 1998, 110, 474–489. [Google Scholar] [CrossRef]
- Sone, S.J.C. Novel Train Stopping Patterns for High-Frequency, High-Speed Train Scheduling. Compail 1992, 110, 102–113. [Google Scholar]
- Goossens, J.-W.; van Hoesel, S.; Kroon, L. On solving multi-type railway line planning problems. Eur. J. Oper. Res. 2006, 168, 403–424. [Google Scholar] [CrossRef]
- Ghoseiri, K.; Szidarovszky, F.; Asgharpour, M.J. A multi-objective train scheduling model and solution. Transp. Res. Part B Methodol. 2004, 38, 927–952. [Google Scholar] [CrossRef]
- Yang, Y.; Zhang, X.; Xu, X.; Gao, D. Line planning and differential pricing for high-speed parallel trains. Res. Transp. Bus. Manag. 2025, 59, 101296. [Google Scholar] [CrossRef]
- Fu, H.; Nie, L.; Meng, L.; Sperry, B.R.; He, Z. A hierarchical line planning approach for a large-scale high speed rail network: The China case. Transp. Res. Part A Policy Pract. 2015, 75, 61–83. [Google Scholar] [CrossRef]
- Robenek, T.; Maknoon, Y.; Azadeh, S.S.; Chen, J.; Bierlaire, M. Passenger centric train timetabling problem. Transp. Res. Part B Methodol. 2016, 89, 107–126. [Google Scholar] [CrossRef]
- Chien, S.I.-J.; Ulusoy, Y.Y.; Wei, C.-H. Integrated transit services for minimum cost operation considering heterogeneous demand. Transp. Plan. Technol. 2010, 33, 605–624. [Google Scholar] [CrossRef]
- Ulusoy, Y.Y.; Chien, S.I.-J.; Wei, C.-H. Optimal All-Stop, Short-Turn, and Express Transit Services Under Heterogeneous Demand. Transp. Res. Rec. J. Transp. Res. Board 2010, 2197, 8–18. [Google Scholar] [CrossRef]
- Trojovský, P.; Dehghani, M. Subtraction-Average-Based Optimizer: A New Swarm-Inspired Metaheuristic Algorithm for Solving Optimization Problems. Biomimetics 2023, 8, 149. [Google Scholar] [CrossRef]
- He, Y.Q.; Zhang, H.Z.; Mao, B.H. Multi objective Bi-level Programming Model of Making Train Working Plan for Passenger-only Line. J. China Railw. Soc. 2006, 28, 6–10. [Google Scholar]


Disclaimer/Publisher’s Note: The statements, opinions and data contained in all publications are solely those of the individual author(s) and contributor(s) and not of MDPI and/or the editor(s). MDPI and/or the editor(s) disclaim responsibility for any injury to people or property resulting from any ideas, methods, instructions or products referred to in the content. |
© 2026 by the authors. Licensee MDPI, Basel, Switzerland. This article is an open access article distributed under the terms and conditions of the Creative Commons Attribution (CC BY) license.