Abstract
This study presents a well-to-wheel life-cycle assessment (WTW-LCA) comparing battery-electric heavy-duty trucks (BEVs) with conventional diesel trucks, utilizing real-world fleet data from Southern California’s Volvo LIGHTS project. Class 7 and Class 8 vehicles were analyzed under ISO 14040/14044 standards, combining measured diesel emissions from portable emissions measurement systems (PEMSs) with BEV energy use derived from telematics and charging records. Upstream (“well-to-tank”) emissions were estimated using USLCI datasets and the 2020 Southern California Edison (SCE) power mix, with an additional scenario for BEVs powered by on-site solar energy. The analysis combines measured real-world energy consumption data from deployed battery electric trucks with on-road emission measurements from conventional diesel trucks collected by the UCR team. Environmental impacts were characterized using TRACI 2.1 across climate, air quality, toxicity, and fossil fuel depletion impact categories. The results show that BEVs reduce total WTW CO2-equivalent emissions by approximately 75% compared to diesel. At the same time, criteria pollutants (NOx, VOCs, SOx, PM2.5) decline sharply, reflecting the shift in impacts from vehicle exhaust to upstream electricity generation. Comparative analyses indicate BEV impacts range between 8% and 26% of diesel levels across most environmental indicators, with near-zero ozone-depletion effects. The main residual hotspot appears in the human-health cancer category (~35–38%), linked to upstream energy and materials, highlighting the continued need for grid decarbonization. The analysis focuses on operational WTW impacts, excluding vehicle manufacturing, battery production, and end-of-life phases. This use-phase emphasis provides a conservative yet practical basis for short-term fleet transition strategies. By integrating empirical performance data with life-cycle modeling, the study offers actionable insights to guide electrification policies and optimize upstream interventions for sustainable freight transport. These findings provide a quantitative decision-support basis for fleet operators and regulators planning near-term heavy-duty truck electrification in regions with similar grid mixes, and can serve as an empirical building block for future cradle-to-grave and dynamic LCA studies that extend beyond the operational well-to-wheels scope adopted here.
1. Introduction
The US Environmental Protection Agency (EPA) estimates that in 2021, the transportation sector was the largest contributor of greenhouse gas (GHG) emissions in the country, accounting for 29% of total GHG emissions, where medium- and heavy-duty (MHD) (the US Federal Highway Administration (FHWA) defines medium-duty vehicles as having a gross vehicle weight rating (GVWR) between 10,000 and 26,000 lbs, and heavy-duty vehicles as having a GVWR above 26,000 lbs) trucks contributed to 23% of total transportation GHG emissions [1]. The California Air Resources Board (CARB) GHG emissions inventory indicates that the transportation sector accounted for 37% of total statewide GHG emissions in 2020, with heavy-duty (HD) vehicles contributing 24% of transportation GHG emissions [2]. Furthermore, heavy-duty trucks account for four-fifths of particulate matter (PM) emissions on California roads and contribute to one-third of the state’s total oxides of nitrogen (NOx) emissions [3].
Numerous LCA studies concerning electric light-duty (LD) passenger vehicles have been published [4,5,6,7,8], while MHD applications have only recently received comparable attention. Regarding public transport, several studies have examined battery electric bus pathways, often using regional electricity mixes and prospective scenarios to compare diesel and zero-emission bus options [9,10,11,12,13]. In the freight sector, recent LCA work has investigated electric heavy-duty (HD) trucks and alternative drivetrains in European and Nordic contexts, highlighting the importance of grid carbon intensity and duty-cycle assumptions for overall GHG performance [14,15,16,17]. In the United States, Ramirez-Ibarra and Saphores [3] evaluated the potential environmental health benefits of electrifying drayage HD trucks in California, while Iyer et al. [18] and others used the GREET model to conduct vehicle-cycle and life-cycle analyses of zero-emission MHD trucks at a national scale.
Building on this body of work, Gentilucci et al. [19] provide a recent systematic review of life cycle GHG emissions of diesel and zero-emission trucks, synthesizing results across multiple cradle-to-gate and cradle-to-grave studies and outlining future perspectives for zero-emission freight. Their review emphasizes the strong dependence of reported benefits on system boundaries, energy pathways, and methodological choices. However, most studies included in that review rely on model-based or standardized test-cycle data rather than measured real-world operation, and only a few provide detailed, region-specific assessments for deployed electric HD truck fleets.
Given the limited number of studies evaluating the benefits of heavy-duty electric vehicles compared to their conventional counterparts in the context of life cycle assessment, there is a pressing need for high-quality LCA studies that utilize actual performance and emissions measurements obtained from real-world applications of heavy-duty electric trucks and their corresponding diesel trucks. The present study aims to establish an accurate and comprehensive assessment of the environmental impacts of electric short- and long-haul heavy-duty trucks in comparison to their conventional diesel counterparts. The majority of life cycle inventory data for the operation of electric and diesel short-haul and long-haul HD trucks were obtained from on-board measurements as part of the pilot Volvo Low-Impact Heavy Green Transport Solution (LIGHTS) project [20]. The Volvo LIGHTS project was a collaboration between 12 private and public organizations in Southern California, including private fleets, government agencies, ports, community colleges, a utility company, a research university, community partners, and equipment suppliers [21]. The project deployed several battery electric Class 8 long-haul trucks and Class 7 short-haul trucks to multiple fleet operators located within the greater Los Angeles area.
During the project, the performance of the electric trucks was measured and compared to the baseline of existing diesel HD fleet trucks. Emissions from baseline diesel HD vehicles were calculated using PEMSs. PEMSs are routinely used to measure vehicle tailpipe gas and particle emissions in real-world scenarios under a broad range of driving situations, including road grades, altitude differences, ambient conditions, and high accelerations. PEMS measurements are used for in-use compliance testing of heavy-duty diesel vehicles in the United States [22]. PEMSs have been employed in several studies of various types of vehicles, including heavy-duty trucks [23,24,25].
The present study builds on these efforts by providing a comprehensive operational WTW LCA of battery electric heavy-duty trucks using real-world fleet data from the Volvo LIGHTS deployment in Southern California. Its primary originality lies in the integration of actual energy consumption data from deployed BEVs with on-road PEMS data from conventional diesel trucks, combined with region-specific electricity mixes and TRACI 2.1 impact assessment. Rather than attempting a full cradle-to-grave assessment, the study is intentionally framed as an operational WTW analysis, aimed at quantifying use-phase impacts under current deployment conditions and documenting how upstream emissions shift as fleets transition to zero tailpipe emission technologies [26]. The resulting empirically grounded WTW split can subsequently serve as input to broader cradle-to-grave and scenario-based LCA studies.
2. Materials and Methods
This study employs a WTW life cycle assessment framework to quantify the environmental impacts of battery electric and diesel heavy-duty trucks operating in real-world conditions. The analysis adheres to ISO 14040 standards [27], with data sourced primarily from the Volvo LIGHTS project, which involved the deployment of Class 7 and Class 8 BEVs and baseline diesel trucks in Southern California. Emissions measurements for diesel trucks were obtained using PEMSs, while energy consumption data for BEVs were collected via onboard telematics and charging logs. The study integrates empirical data with LCI datasets from the US Life Cycle Inventory (USLCI) database and applies the TRACI 2.1 impact assessment method.
Figure 1 illustrates the operational WTW system boundary and the main steps of the life cycle assessment for Class 7–8 diesel and battery electric trucks. Within the boundary, WTT and TTW stages are used to determine operational energy use and emissions per kilometer for both diesel and BEV pathways. Vehicle manufacturing, battery production and assembly, maintenance, and non-exhaust emissions (including brake and tire wear) are excluded from the analysis and are represented in gray. End-of-life (EOL) treatment and recycling are also excluded and are represented in gray. The lower panels illustrate how the operational results inform the impact assessment using TRACI 2.1, statistical comparisons (diesel vs. BEV; Class 7 vs. Class 8), and the final interpretation of limitations and policy implications. Boxes marked with an “X” indicate life-cycle stages that fall outside the operational WTW system boundary and are not included in the analysis.
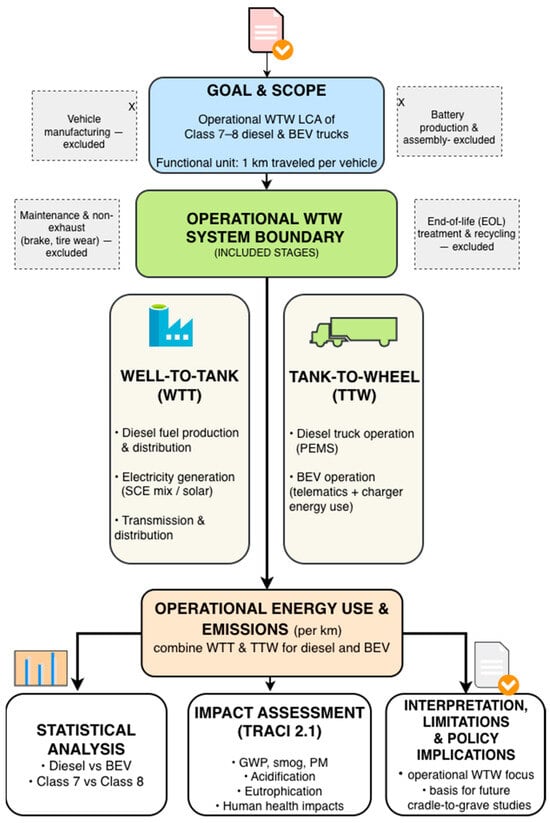
Figure 1.
Operational WTW system boundary and methodological workflow.
2.1. Goal and Scope Definition
The goal of this study is to assess and compare the environmental impacts of battery electric and diesel-powered heavy-duty trucks used in Class 7 and Class 8 applications, covering both short- and long-haul freight operations. The assessment follows the ISO 14040 and ISO 14044 standards [28] and utilizes a WTW boundary, encompassing both WTT and TTW stages. The analysis excludes vehicle manufacturing, battery production, maintenance, end-of-life, and non-exhaust emissions such as those from brake and tire wear. Real-world operational data were collected from trucks operating within the Southern California Edison (SCE) power grid. The functional unit is defined as one kilometer traveled per vehicle, consistent with the International System of Units (SI). The analysis focuses on the operational WTW impacts of diesel and BEV pathways under the specific deployment conditions of the Volvo LIGHTS project. Vehicle manufacturing, battery production, maintenance, non-exhaust emissions, and end-of-life processes are therefore excluded from the system boundary. While this focus aligns with the objective of quantifying use-phase performance and energy pathway contributions based on measured real-world data, it may lead to an underestimation of total life-cycle burdens, particularly for BEVs. Previous cradle-to-grave assessments of medium- and heavy-duty vehicles have shown that vehicle and battery production can contribute non-negligible shares of GHG emissions and resource use even when the use phase dominates overall impacts [15,16,17,18]. Accordingly, the results presented here should be interpreted as conservative estimates of operational WTW impacts, with full cradle-to-grave evaluations left to future work that extends beyond the scope of the present study.
Table 1 summarizes the system boundary adopted in this study, which includes the well-to-tank and tank-to-wheels stages, while excluding vehicle manufacturing, battery production, maintenance, end-of-life, and non-exhaust emissions.

Table 1.
Inclusion and exclusion of life cycle stages.
2.2. System Boundary
Defining the system boundary is a critical step in ensuring the accuracy and comparability of LCAs, particularly in studies evaluating the environmental performance of alternative vehicle technologies. In this study, a WTW boundary is adopted to capture both the upstream WTT and downstream TTW phases of energy use and emissions. This approach allows for a comprehensive evaluation of the total environmental impact associated with fuel production, energy conversion, and vehicle operation. By excluding vehicle manufacturing, infrastructure construction, and end-of-life processes, the analysis remains focused on the operational phase where the most immediate and policy-relevant differences between technologies, such as electric, and diesel-powered trucks, are observed. This boundary selection aligns with the study’s objective to provide actionable insights into the real-world impacts of energy pathways for medium- and heavy-duty trucks operating in California. The WTW scope adopted here is thus explicitly framed as a use-phase analysis that complements, rather than replaces, full cradle-to-grave LCA studies by providing empirically grounded operational inputs for future extensions.
2.3. Vehicle Selection and Operational Data
The study evaluates 28 heavy-duty trucks, including 17 battery electric vehicles (6 Class 7 and 11 Class 8) and 11 baseline diesel trucks (3 Class 7 and 8 Class 8). The BEVs were deployed as part of the Volvo LIGHTS project and operated in various freight applications. Diesel trucks were equipped with PEMS to capture tailpipe emissions during typical driving cycles. Energy consumption for BEVs was obtained from onboard telematics systems and charging logs.
Table 2 provides an overview of the vehicle types included in this study, along with the number of vehicles, their class designation, and the corresponding data collection methods. A total of 28 heavy-duty trucks, comprising 17 BEVs and 11 diesel trucks, were analyzed. The BEVs include Class 7 and Class 8 trucks deployed under the Volvo LIGHTS project, which are operated in various freight scenarios. Energy consumption for BEVs was recorded using onboard telematics and charging log data. For diesel vehicles, real-world tailpipe emissions were measured using PEMSs installed during typical driving cycles.
Table 2.
Summary of vehicle types and operational data collection methods.
Table 3 summarizes the monitored routes for the main vehicle groups used in this study. For each Class 7 and Class 8 diesel and battery electric truck group, the table reports the approximate route distance, typical trip duration, average speed, and a qualitative duty-cycle classification (urban, regional, or highway-dominated) [29,30]. The entries reflect representative freight operations in the greater Los Angeles area, including urban pickup and delivery, regional port drayage, and long-haul freeway segments [31,32,33]. These route descriptors provide the operational context for the PEMS and telematics measurements used in the WTW analysis, helping to relate the reported energy consumption and emissions to realistic freight applications [29,30].
Table 3.
Representative daily duty-cycle characteristics of monitored routes for main vehicle groups [29,30,31,32,33].
2.4. Life Cycle Inventory Data Sources and Assumptions
Life cycle inventory data for fuel production, distribution, and upstream emissions were obtained from the USLCI database (NREL) [34]. The BEV electricity profiles were modeled using the USLCI eGrid CAMX 2010 dataset, modified to reflect the SCE 2020 power mix. The 42% unspecified generation in the SCE mix was proportionally allocated based on known sources of generation. For BEVs charged from solar installations (SHE_5, LHE_8–LHE_11), zero WTT emissions were assumed [35,36,37].
PEMS data provided direct measurements for diesel tailpipe emissions (CO, CO2, NOx, THC, PM2.5). USLCI defaults were used for unmeasured pollutants (VOC, CH4, N2O, NH3, SO2). Diesel particulate matter (PM10) emissions were assumed equal to PM2.5 emissions due to the use of diesel particulate filters.
Figure 2 system boundary and data flow used in the WTW LCI analysis. Battery electric and diesel heavy-duty trucks are evaluated based on upstream and operational emissions. BEV impacts are derived from SCE grid electricity and solar charging scenarios, while diesel vehicle data is based on PEMS measurements and supplemented with USLCI defaults for unmeasured pollutants. Background processes for both systems are modeled using USLCI datasets. This phase corresponds to the inventory stage of the ISO 14040-compliant life cycle assessment framework. The functional unit is defined as one vehicle-km traveled.
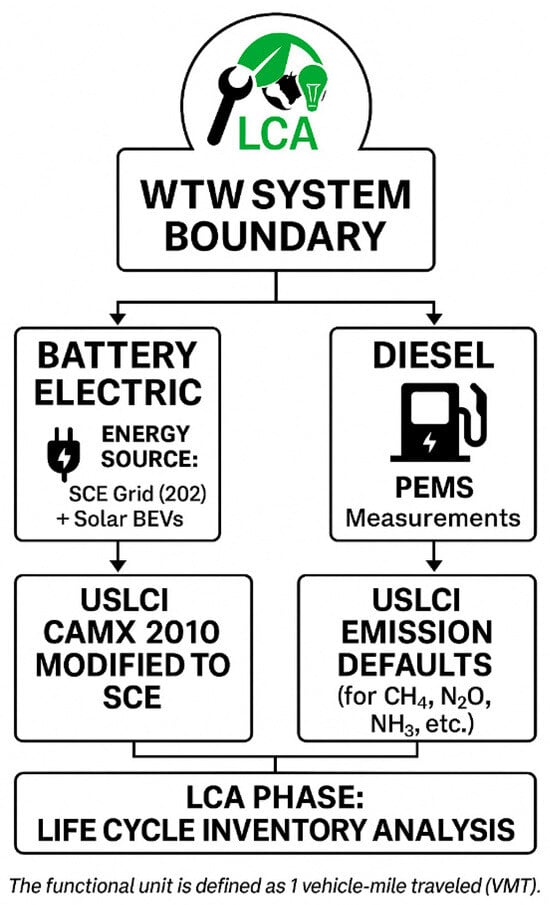
Figure 2.
Data flow and inventory sources used in the WTW system boundary.
2.5. Impact Assessment (TRACI 2.1)
BEV energy consumption data (in kWh/km) were adjusted to account for charging inefficiencies and grid transmission and distribution losses, assumed to be 12% and 5%, respectively. These assumptions lie within the typical ranges reported for commercial DC fast-charging systems and utility networks (approximately 10–15% combined charger and battery losses and 3–7% grid losses) and are consistent with values used in recent LCA and techno-economic studies of electric heavy-duty vehicles [38,39]. The effective energy use per kilometer was calculated using Equation (1):
Operational data originally recorded on a per-mile basis were converted to per-kilometer intensities using a factor of 1 mi = 1.609 km to ensure consistency with the SI system; this unit conversion does not affect relative differences between vehicle technologies. The adjusted energy consumption for BEVs was then multiplied by the appropriate grid-specific emission factors, either for the SCE grid or for solar-powered charging, to estimate WTT emissions. For diesel vehicles, measured fuel efficiency values from each truck (Table 4), expressed in kilometers per diesel gallon equivalent, were combined with USLCI emission factors to calculate their respective WTW emissions.
Table 4.
Measured Energy Efficiency of Baseline Diesel Vehicles.
For BEVs, the measured energy consumption (kWh/km) data (Table 5), collected from each vehicle, are used in conjunction with the USLCI database Electricity at eGrid, CAMX, 2010 process, to evaluate their environmental impacts. The power source mix of that process is modified to reflect SCE’s power mix listed in Table 5. Energy losses in the transmission and distribution grid are considered to be 5%. In contrast, energy losses during BEV charging, considering both EV charger and battery round-trip efficiencies, are estimated at 12%. Measured electric energy use by BEVs does not include energy regenerated from braking; instead, it represents energy from the grid alone.
Table 5.
Measured Energy Efficiency of BEVs.
The power mix of the grid where vehicles are charged has a strong influence on life-cycle GHG, criteria pollutants, and air toxic emissions for the BEV pathways. For the LIGHTS deployment area, the shares of the main generation sources in SCE’s electricity supply were obtained from SCE’s power content label [29,40]. Because the “unspecified” portion of SCE power is purchased on the open market and cannot be broken out by source, this study assumes that the 42% unspecified share follows the same source distribution as the identified portion of the mix. For diesel vehicles, WTT emissions associated with fuel production and distribution were obtained from the USLCI database, while TTW emissions were directly obtained from PEMS data when available. Total WTW impacts for each vehicle type were then calculated as the sum of WTT and TTW contributions.
2.6. Sensitivity and Statistical Analysis
Environmental impacts were evaluated using the TRACI version 2.1, developed by the U.S. EPA. This method facilitates life cycle impact assessment across multiple midpoint-level categories, including global warming potential (GWP), acidification potential (AP), eutrophication potential (EP), smog formation, human health impacts (both cancer and non-cancer), particulate matter formation, freshwater ecotoxicity, and ozone depletion potential (ODP). These categories encompass a broad range of environmental and human health impacts resulting from pollutant emissions throughout the vehicle’s life cycle [41,42].
Tailpipe emissions from BEVs were assumed to be zero due to the absence of internal combustion. However, emissions from non-exhaust sources, such as brake and tire wear, were not included in the analysis due to the lack of consistent real-world measurement data and modeling limitations in current life cycle inventory databases.
Figure 3 summarizes the impact assessment categories applied in this study, aligning with the midpoint-oriented approach of the ISO 14040 LCA framework and utilizing TRACI 2.1 characterization factors. These categories, including Global Warming Potential, Acidification, Eutrophication, Smog Formation, Human Health (Cancer), and Particulate Matter Formation, provide a structured basis for evaluating the environmental performance of vehicle technologies across key sustainability dimensions [41,42].
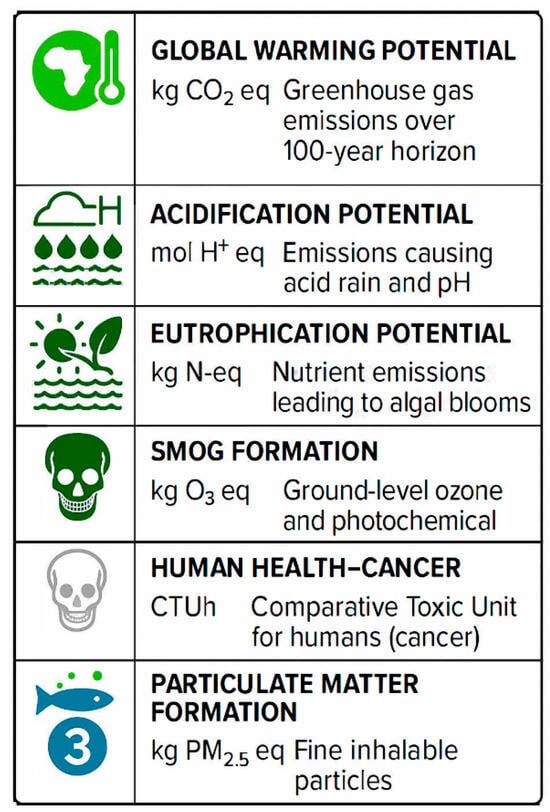
Figure 3.
TRACI 2.1 Impact Categories and Units.
2.7. Statistical Analysis and Data Visualization
This section presents a comprehensive statistical analysis of vehicle energy consumption and associated emissions for two vehicle types: battery electric vehicles (BEVs) and conventional diesel trucks. The primary aim is to quantify variability, identify trends, and explore correlations between operational efficiency (kWh/km) and emission outputs (e.g., CO2eq/km, NOx/km).
2.7.1. Descriptive Statistics
To provide a foundational understanding of the dataset, descriptive statistical measures were calculated for each vehicle category and corresponding environmental metric. Specifically, the mean (μ) and standard deviation (σ), along with minimum and maximum values, were computed to summarize the central tendency and variability of the data. The mean is calculated using [43]:
while the standard deviation is defined as:
The metrics in Figure 4 are used to characterize the well-to-wheel performance of the BEV truck fleet under real-world operating conditions. Energy consumption (kWh/km), CO2 emissions (g/km), and NOx emissions (mg/km) are summarized as bar plots, where the bar heights represent fleet-average values, black error bars denote standard deviations, and red dashed lines indicate the observed minimum–maximum range across vehicles and duty cycles. CO2 emissions exhibit a relatively high mean with substantial variability, while NOx emissions display an even wider spread, suggesting sensitivity to route composition and operating conditions. Energy consumption appears at a smaller numerical scale on the same axis but still shows noticeable dispersion within the fleet.
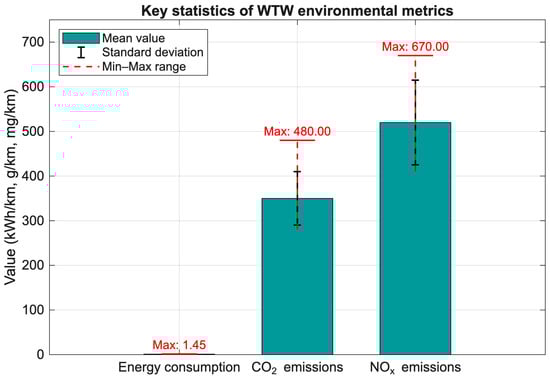
Figure 4.
Descriptive Statistics of Key Environmental Metrics.
By jointly depicting central tendency and variability, Figure 4 provides a compact statistical overview of the environmental performance data that underpins the rest of the analysis. These distributions support robust comparisons between BEVs and conventional diesel trucks, inform subsequent visualizations such as boxplots and correlation analyses, and guide TRACI-based impact assessments and model calibration by highlighting which metrics are more prone to deviation.
2.7.2. Correlation Analysis
To evaluate the linear associations between energy consumption and various emission indicators, pairwise Pearson correlation coefficients were computed [44]. This statistical measure helps quantify the strength and direction of relationships between two continuous variables, allowing for the identification of potential covariation trends within the dataset.
The Pearson correlation coefficient is calculated as shown in Equation (4):
where xi and yi are the observed values for variables x (e.g., energy use) and y (e.g., CO2 or NOx emissions), and
and
are the mean values of the respective variables.
Figure 5 presents a correlation heatmap based on this analysis, revealing strong positive correlations between energy consumption and CO2, as well as NOx emissions. These findings underscore the crucial connection between operational energy efficiency and environmental impact. Identifying such correlations is essential for designing mitigation strategies that simultaneously enhance vehicle efficiency and reduce pollutant emissions, thereby underscoring the importance of energy-focused interventions in ZEV deployment planning.
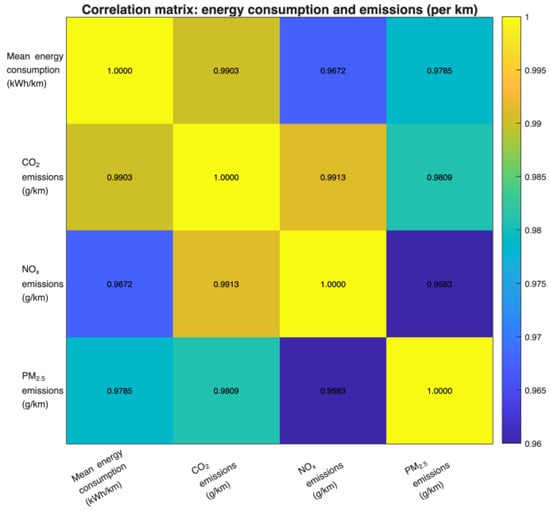
Figure 5.
Correlation Analysis of Energy Consumption and Emission Indicators.
2.8. Limitations
This study presents a comprehensive environmental and operational assessment of medium- and heavy-duty vehicle technologies; however, several limitations must be acknowledged. First, the analysis focuses solely on the use-phase emissions and excludes upstream processes such as vehicle manufacturing, battery production, and end-of-life recycling. These stages, particularly for battery electric and fuel cell vehicles, can significantly influence life-cycle emissions and should be addressed in future studies.
Second, emissions from non-exhaust sources, such as brake and tire wear, are not considered, although they can contribute notably to local air pollution, especially in urban settings. Similarly, emissions and energy use associated with infrastructure development, such as hydrogen refueling stations or electric charging networks, fall outside the scope of this analysis.
Third, the results are based on the 2020 SCE electricity grid mix, which does not account for future trends in grid decarbonization. As electricity generation continues to shift toward renewable sources, the relative environmental performance of electric vehicles is likely to improve, suggesting that our findings may be conservative for zero-emission technologies.
Finally, the dataset reflects a snapshot of real-world operations captured during a specific deployment period. Although this enhances realism, it may not encompass the full range of variability in duty cycles, operational practices, regional conditions, or seasonal effects. Future work should incorporate longitudinal data and broader geospatial representation to enhance the robustness and generalizability of the findings.
3. Results
Figure 6 presents log-scaled boxplots of trip-level CO2-equivalent (CO2-eq), NOx, and PM2.5 emissions per kilometer for diesel trucks and BEVs. The logarithmic y-axis enables pollutants that differ by several orders of magnitude to be displayed on a single scale, allowing greenhouse gas emissions and local air quality indicators to be evaluated together. For each pollutant, the left box represents diesel vehicles and the right box represents BEVs, with the median, interquartile range, and whiskers summarizing the variability in the underlying trip data. Consistent with the numerical summary, diesel trucks show higher medians and wider spreads (e.g., CO2-eq ≈ 1.21 kg/km vs. 0.28 kg/km, NOx ≈ 2.5 × 10⁻³ kg/km vs. 4.6 × 10⁻⁴ kg/km, and PM2.5 ≈ 9.4 × 10⁻⁶ kg/km vs. 4.5 × 10⁻⁷ kg/km for BEVs), indicating both larger typical emissions and greater day-to-day variability.
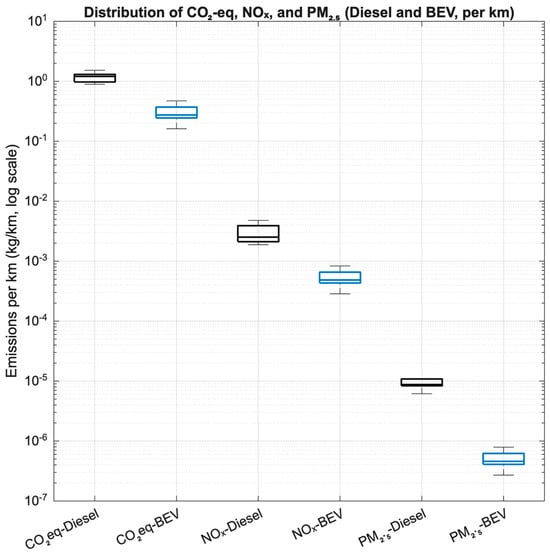
Figure 6.
Log-scaled boxplots of CO2-eq, NOx, and PM2.5 emissions per km for diesel trucks and BEVs.
Earlier sections discuss both PM2.5 and coarse particulate matter (PM10). Figure 6 focuses on PM2.5 because the available on-road measurements and the TRACI health-impact factors are defined for fine particles; PM10 is therefore omitted to avoid redundancy and to emphasize the particle size fraction with the strongest evidence of adverse health effects. Taken together, the boxplots illustrate the differences in magnitude and variability between the emission profiles of diesel and BEVs, providing the empirical basis for the correlation analysis and life-cycle impact results presented in the subsequent sections.
Figure 7 illustrates the relationship between measured energy consumption and installed battery capacity for Class 7 and Class 8 battery electric trucks. The scatter points represent the measured energy consumption per kilometer for each unit, as listed in Table 5, together with the corresponding nominal battery pack capacities taken from OEM datasheets for the Volvo VNR Electric and Freightliner eCascadia models. Class 7 vehicles (GVWR < 15 metric tons), typically used for medium-duty regional distribution, cluster at lower capacities and exhibit moderate consumption, whereas Class 8 trucks (GVWR ≥ 15 metric tons), configured for higher gross weights and tractor operation, employ larger packs and span a wider range of consumption. The solid line is an ordinary least-squares fit to all data points, indicating an average design trend in which battery capacity increases by approximately 218.9 kWh for each additional kWh/km of energy consumption, equivalent to an effective range of roughly 220 km (R2 = 0.583). By linking duty-cycle energy use from the demonstration to manufacturer pack sizing, Figure 7 highlights typical sizing strategies for regional-haul BEVs and the variability introduced by payload, route characteristics, and auxiliary loads.
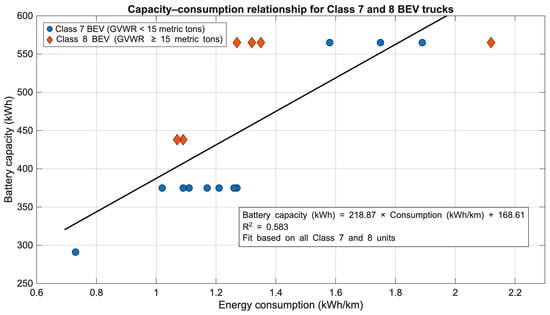
Figure 7.
Capacity consumption relationship for Class 7 and Class 8 battery electric trucks.
3.1. Correlation Between Energy Consumption and Emissions
Figure 8 illustrates the comparative GHG emissions of baseline diesel vehicles and BEVs across Class 7 and Class 8 trucks. The figure highlights significant reductions in CO2 and CH4 emissions for BEVs, aligning with the expected environmental benefits of zero-tailpipe-emission technologies.
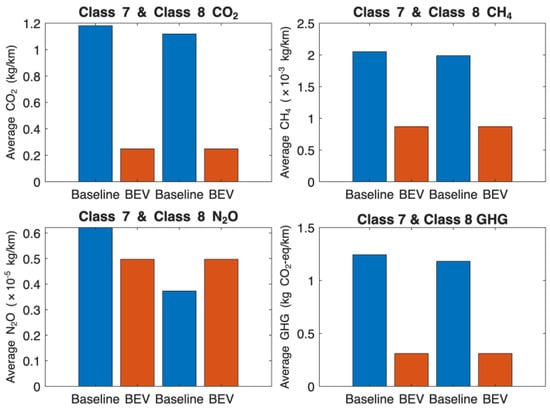
Figure 8.
Key GHG Emissions for Baseline Vehicles compared to BEVs.
Notably, average CO2eq emissions are reduced by approximately 75% in both classes when transitioning from baseline vehicles to BEVs. However, the figure also reveals a nuanced outcome: while N2O emissions are lower for BEVs in Class 7, they are slightly higher in Class 7. This is primarily attributed to the upstream electricity generation processes, particularly those involving the combustion of natural gas. As such, Figure 8 effectively supports the study’s well-to-wheel life cycle assessment by capturing both the benefits and trade-offs associated with electrification, reinforcing the need to consider energy source composition in evaluating the true environmental performance of BEVs.
Figure 9 compares the life-cycle CO2-equivalent emissions of diesel trucks and BEVs in the Class 7 and Class 8 categories, separating the contributions from WTT and TTW. For diesel vehicles, TTW emissions clearly dominate, capturing the direct CO2 released during fuel combustion, while WTT emissions from fuel production and distribution remain comparatively modest. In contrast, BEVs have zero TTW emissions in this figure; virtually all of their CO2-eq impact arises from the WTT stage, driven by electricity generation and delivery. This shift from tailpipe-dominated to upstream-dominated emissions represents a fundamental change in the carbon footprint of truck operations. Although total WTW emissions are substantially lower for BEVs than for diesel trucks, the magnitude of their advantage ultimately depends on the carbon intensity of the grid supplying the charging energy.
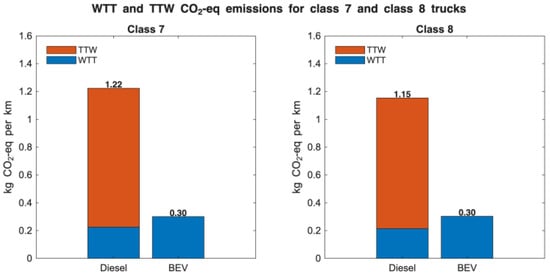
Figure 9.
WTT and TTW Contributions to CO2-equivalent Emissions of Class 7 and Class 8 Trucks.
Figure 10 summarizes the BEV-to-diesel ratios for each TRACI 2.1 impact category, with diesel serving as the 100% baseline (lower values indicate lower impact). By encoding values both numerically and by color, the heat map places indicators with different physical units on a common, unit-agnostic scale, allowing for rapid cross-category comparison without the need for lengthy tables. Across both vehicle classes, BEVs retain only about 25–26% of diesel’s global-warming impact and fall to 24–15% for acidification, 27–14% for eutrophication, 8–9% for freshwater ecotoxicity, 20–17% for human-health particulate matter, 13–13% for human-health non-cancer, and 25–14% for smog formation; ozone depletion is essentially 0% relative to diesel.
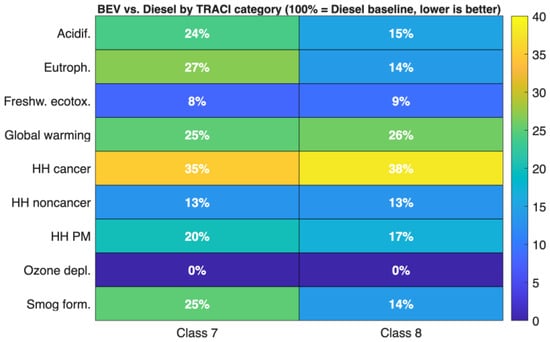
Figure 10.
Relative environmental impacts of BEVs by TRACI category (Class 7 & Class 8; Diesel baseline = 100%).
Figure 10 also clarifies where benefits are smaller: the human-health cancer indicator remains at 35–38%, indicating that upstream processes, primarily electricity generation and materials, are the dominant residual hotspot. Taken together with the WTT/TTW results, the heat map reveals that BEV advantages extend well beyond climate metrics, while also transparently highlighting priority areas for further reduction, notably continued grid decarbonization and supply-chain improvements.
Figure 11 displays the BEV-to-diesel impact ratios (in %) for each TRACI 2.1 category, with the corresponding diesel case normalized to 100%. For every category, Class 7 (blue) and Class 8 (red) BEVs appear as side-by-side bars, so class-level differences can be read directly. Across all categories, BEV impacts fall between 8% and 38% of the diesel baseline, with the lowest ratios in freshwater ecotoxicity, human-health particulate matter, ozone depletion (near zero), and smog formation. Class 7 BEVs tend to exhibit slightly lower ratios than Class 8, while the two classes are almost identical for freshwater ecotoxicity and human-health non-cancer effects, and Class 8 shows a modestly higher ratio in the human-health cancer category. By placing all indicators on the same normalized scale, Figure 11 provides a compact multi-category comparison, highlighting that BEV operation yields consistently lower life-cycle impacts than diesel.
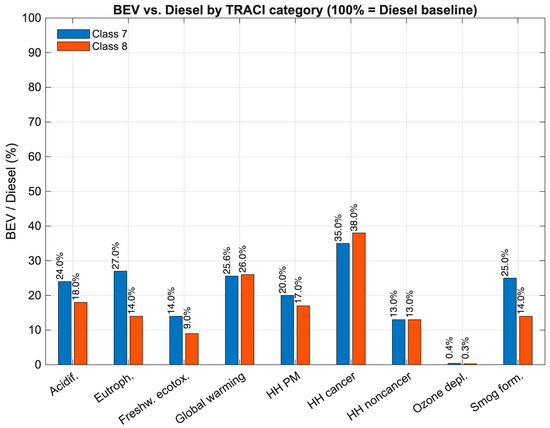
Figure 11.
Class-specific BEV/Diesel ratios by TRACI 2.1 category (Diesel baseline = 100%; lower is better).
Across all impact categories, the patterns match the discussion above: BEV impacts, expressed as a percentage of diesel, are about 25–26% for global warming, 8–9% for freshwater ecotoxicity, 24–15% for acidification, 27–14% for eutrophication, 20–17% for human-health PM, 13% for non-cancer PM, and 25–14% for smog formation. The highest residual is human-health cancer (35–38%), indicating upstream processes as the remaining hotspot. The stacked height is not a fleet-weighted aggregate and should not be interpreted as such; if a fleet-level figure is required, appropriate activity or vehicle-count weights must be applied.
3.2. Distribution of Pollutants by Vehicle Type
Figure 10 and Figure 11 illustrate a comparative analysis of average environmental impacts, as defined by the TRACI 2.1 categories, for baseline diesel trucks and BEVs across Class 7 and Class 8 vehicle types.
Acidification potential is reduced by 76% and 85% for Class 7 and Class 8 BEVs, respectively. In diesel trucks, NOx emissions, primarily from tailpipe exhaust, are the major contributors. In BEVs, however, NOx emissions originate mainly from upstream electricity generation, particularly from natural gas-fired power plants.
Eutrophication impacts follow a similar trend, showing reductions of 76% for Class 7 and 85% for Class 8 BEVs. Again, NOx emissions are the principal factor in both vehicle categories, underscoring the importance of minimizing upstream sources during energy production.
Freshwater ecotoxicity is significantly lower for BEVs, with a 91% reduction in both classes compared to diesel vehicles. This is largely due to the avoidance of barium emissions associated with crude oil extraction processes used in fossil fuel supply chains.
GWP, expressed in CO2-equivalent and detailed in Figure 10, is reduced by approximately 75% in both BEV classes. This outcome reflects substantial decreases in both CO2 and CH4 emissions during BEV operation and upstream energy use.
Human health impacts from cancer are reduced by 66% for Class 7 BEVs and 64% for Class 8 BEVs. In diesel trucks, emissions of heavy metals such as mercury, arsenic, nickel, and chromium during crude oil extraction are key contributors. In contrast, BEVs are primarily affected by trace emissions from electricity production, including mercury and formaldehyde.
Human health non-cancer effects are reduced by 87% and 86% in Class 7 and Class 8 BEVs, respectively. This improvement is again attributed to the elimination of barium emissions in water bodies linked to oil extraction processes.
Particulate matter (PM)-related health impacts show reductions of 80% and 83% in Class 7 and Class 8 BEVs, respectively. These gains result from the significant decrease in criteria pollutants (e.g., CO, NOx, SOx, PM) that are prevalent in diesel tailpipe emissions but largely absent in BEV operations. The ozone depletion potential shows a reduction of over 99.7% in BEVs.
Smog formation potential is reduced by 75% and 86% in Class 7 and Class 8 BEVs, respectively. The lower emissions of ozone precursors such as NOx and VOCs in BEV usage drive this.
The composition of the electricity grid plays a critical role in determining the upstream emissions associated with BEVs. In this study, BEVs charged via the SCE grid are subject to a power mix comprising approximately 26% natural gas, 26% solar, 16% wind, and a remaining share from other low-carbon resources. Because natural gas still represents a substantial portion of the mix, upstream emissions for grid-charged BEVs are non-negligible, particularly for CO2, CH4, and N2O.
In contrast, BEVs charged exclusively with solar power exhibit near-zero upstream emissions. This difference is clearly reflected in the comparative results, where solar-charged BEVs demonstrate the lowest environmental impacts across all categories. These findings highlight that the benefits of BEVs are closely tied to the carbon intensity of the electricity used. Therefore, policy efforts aimed at promoting electrification must be coupled with grid decarbonization strategies to fully unlock the emission reduction potential of electric vehicles.
As summarized in Table 6, BEVs demonstrate substantial environmental advantages over diesel trucks across all evaluated TRACI 2.1 impact categories. The magnitude of reduction varies by category and is influenced by the dominant emission sources in each case. For example, while the impacts of global warming and smog formation are primarily driven by CO2 and NOx emissions, respectively, freshwater ecotoxicity and non-cancer health effects are largely attributed to barium releases from oil extraction processes. In BEVs, most remaining impacts originate from upstream electricity generation, particularly from natural gas, instead of direct combustion. These findings emphasize the importance of considering upstream pathways when evaluating vehicle electrification and support the broader narrative that the emission benefits of BEVs are strongly tied to the characteristics of the energy source.
Table 6.
Summary of Key Environmental Impact Reductions in BEVs Compared to Diesel Trucks.
3.3. Trade-Offs Between Pollutants and Energy Use
This section examines the nuanced balance between energy consumption and emissions of key pollutants, specifically nitrogen oxides (NOx) and fine particulate matter (PM2.5), across various truck technologies. While ZEVs, such as BEVs and fuel cell electric vehicles, exhibit significant reductions in tailpipe emissions, they may still contribute to upstream emissions, depending on the source of electricity or hydrogen. In contrast, diesel vehicles, although often more energy-dense in fuel utilization, emit substantially higher levels of NOx and PM2.5 during operation, which are critical pollutants associated with adverse health outcomes affecting the respiratory and cardiovascular systems.
Using both boxplots and descriptive statistics, this section highlights trade-offs between energy use and pollutant emissions, illustrating how technologies that are more efficient in energy consumption do not necessarily result in lower pollutant emissions. For example, diesel trucks may exhibit moderate energy consumption but show disproportionately high NOx and PM2.5 emissions, thereby undermining air quality and public health goals.
The visualizations in this section provide comparative insights into the spread and variability of these environmental impacts. By analyzing these trade-offs, the study facilitates a deeper understanding of how fleet transition strategies must be optimized not only for climate impact but also for regional air quality and human health. Such integrated assessments are vital for policymakers to avoid narrow optimization on single indicators and instead support holistic transportation decarbonization planning.
4. Policy Implications and Recommendations
The findings of this study highlight the crucial role that data-driven environmental evaluations can play in informing transportation policy, particularly as cities and regions implement ZEV deployment strategies. The significant differences observed in energy consumption and emission profiles across vehicle technologies highlight the need for nuanced, technology-specific policies rather than one-size-fits-all approaches.
Given the comparatively lower greenhouse gas and pollutant emissions of battery electric and fuel cell electric vehicles, policy measures should increasingly focus on expanding enabling infrastructure, including high-capacity charging and hydrogen refueling stations, particularly along major freight corridors and in urban logistics hubs.
Targeted incentives for fleet operators, including purchase subsidies, access to low-emission zones, and grid integration credits, can further accelerate the adoption of these technologies.
Additionally, our results suggest that policy measures should consider the source of electricity used by electric vehicles. Investments in grid decarbonization, such as expanding solar and wind capacity, improving storage technologies, and modernizing transmission systems, will amplify the benefits of vehicle electrification and ensure long-term sustainability gains.
Lastly, the variability in operational emissions suggests that real-world performance monitoring should be embedded into regulatory planning. Integrating telematics and fleet-level emissions reporting into compliance mechanisms can provide more accurate baselines, enabling adaptive policymaking.
The transition to cleaner heavy-duty transportation requires a coordinated policy effort that aligns technological innovation with infrastructure readiness, economic incentives, and ongoing performance validation.
5. Discussion
This study provides a comprehensive, well-to-wheel life cycle assessment of BEVs relative to conventional diesel trucks operating under real-world conditions in Southern California. The results clearly demonstrate the environmental advantages of BEVs across various categories, including GHG emissions, air pollutants, and broader health-related and ecological impact categories, as defined by the TRACI 2.1 framework.
Across both Class 7 and Class 8 vehicles, BEVs achieve approximately 75% lower CO2-equivalent emissions than their diesel counterparts, primarily due to the elimination of tailpipe emissions and the relatively clean regional electricity mix. Reductions in criteria pollutants such as NOx, PM2.5, VOCs, and SOx are even more pronounced, exceeding 90% in some cases, directly supporting regional air quality improvements and public health targets.
However, the analysis also reveals important nuances. In particular, N2O emissions in Class 8 BEVs are slightly higher than those from diesel vehicles, which are driven by upstream electricity production, especially natural gas-based generation. This indicates that upstream emissions, although lower than those from diesel combustion, remain significant and must be addressed through ongoing decarbonization of the power grid.
Consistent with the broader patterns synthesized in recent systematic reviews of diesel and zero-emission truck LCAs [45,46], our results confirm large operational WTW GHG and air-quality benefits from electrification, while adding new empirical evidence from a deployed BEV fleet operating under real-world conditions in Southern California.
A further limitation is the exclusion of non-exhaust sources such as brake and tire wear, which, although common in LCA studies, may become more prominent as tailpipe emissions are reduced or eliminated. Likewise, emissions associated with vehicle manufacturing, battery production, and end-of-life processes were not included in this study. These omissions imply that the reported values may underestimate the full life-cycle burdens of BEVs, reinforcing the need for future cradle-to-grave analyses that build on the operational WTW framework presented here.
Another key insight is the strong correlation observed between vehicle energy efficiency (kWh/km) and several environmental impact metrics. This relationship highlights the dual need for clean energy sources and efficient vehicle operation to maximize climate and health benefits, particularly as the deployment of electric trucks scales up.
Overall, the findings align with and build upon existing literature, offering new value by grounding the analysis in real-world fleet operation data. Significant reductions in smog formation, acidification, eutrophication, and ecotoxicity further broaden the environmental case for BEVs beyond GHG mitigation alone.
From a policy perspective, these results offer clear, evidence-based support for ZEV strategies [47]. Incentive programs, investments in charging infrastructure, and grid modernization efforts will be essential to accelerate adoption and magnify the environmental benefits identified here.
In the short term, operational measures can leverage the strong linkage observed between energy use and emissions. Telematics-based monitoring, eco-driving programs, and optimized route and load assignment can reduce kWh/km, thereby lowering both GHG and air pollutant emissions from existing fleets [48,49]. Targeted incentives for early BEV adopters, preferential access to congestion or low-emission zones, and strategic siting of chargers at depots and logistics hubs can further improve utilization and reduce the need for inefficient detours or partial charging.
In the longer term, the dominance of WTT contributions for BEVs and the residual human-health cancer hotspot highlight the importance of systemic interventions. Continued grid decarbonization through increased shares of renewables and storage, development of battery recycling and second-life applications, and supply-chain decarbonization for critical materials is necessary to fully realize the environmental potential of heavy-duty electrification [41,42]. The empirically derived WTW split documented in this study provides a starting point for integrating such measures into prospective cradle-to-grave and scenario-based analyses.
Looking ahead, future research should expand to a full cradle-to-grave scope, including supply-chain emissions for batteries and manufacturing processes, as well as end-of-life treatment. Incorporating longitudinal fleet data will also allow for more robust insights into operational variability, seasonal effects, and long-term sustainability outcomes as BEVs become more widespread.
6. Conclusions
This study integrates real-world performance data from the Volvo LIGHTS deployment with a WTW life-cycle assessment framework to evaluate BEVs relative to their diesel counterparts in Class 7 and Class 8 segments. Empirical diesel tailpipe emissions, collected via PEMSs, and BEV energy consumption, derived from telematics and charging records, were combined with upstream fuel and electricity inventory data and analyzed using the TRACI 2.1 methodology.
By separating WTT and TTW contributions, the analysis clarifies how electrification shifts environmental burdens upstream, from tailpipe emissions to electricity generation. This enables a consistent comparison of operational impacts during use and reveals key insights into the redistribution of emissions across the life cycle.
Across both weight classes, the results are robust and compelling. BEVs reduce WTW greenhouse gas emissions by approximately 75% compared to diesel. For TRACI impact indicators, BEVs show sharp declines, approximately 25–26% of the diesel baseline for global warming, 24–15% for acidification, 27–14% for eutrophication, 20–17% for human-health PM, 13% for human-health non-cancer, and ~8–9% for freshwater ecotoxicity. Ozone depletion potential is virtually eliminated. The only major residual hotspot is the human-health cancer category (35–38%), attributed to upstream electricity and material inputs, emphasizing the importance of grid decarbonization and cleaner supply chains.
The study’s operational focus enhances Its Immediate policy relevance. The WTT/TTW split confirms that diesel vehicles concentrate impacts in the use phase. At the same time, BEV burdens are more grid-dependent, highlighting the need for continued investment in renewable energy infrastructure. Moreover, the strong correlation between energy use per km and battery capacity supports data-driven strategies for route optimization, vehicle assignment, and charging logistics.
Although this assessment excludes vehicle manufacturing, battery production, and end-of-life stages, thereby adopting a conservative scope, it provides a rigorous and actionable foundation for fleet operators and policymakers. As electric vehicle deployment accelerates, aligning the adoption of clean vehicles with clean energy sourcing will be crucial to fully realizing the environmental and health benefits of zero-emission freight transport.
Author Contributions
Conceptualization, A.S.K.R.; methodology, M.P. and K.C.J.; software, T.C.A.; validation, A.S.K.R.; writing—review and editing, A.S.K.R., M.P., K.C.J. and T.C.A. All authors have read and agreed to the published version of the manuscript.
Funding
This research was partially supported through the Volvo LIGHTS project (Contract No. 19278).
Data Availability Statement
The raw data supporting the conclusions of this article will be made available by the authors on request.
Conflicts of Interest
The authors declare no conflicts of interest.
Abbreviations
| BEV | Battery Electric Vehicle |
| CAMX | California Mexico electric power subregion |
| CE-CERT | College of Engineering Center for Environmental Research and Technology |
| CH4 | Methane |
| CO | Carbon Monoxide |
| CO2 | Carbon Dioxide |
| CO2eq | Carbon Dioxide Equivalent |
| EGRID | Emissions & Generation Resource Integrated Database |
| EPA | Environmental Protection Agency |
| FHWA | Federal Highway Administration |
| GHG | Greenhouse Gas |
| GREET | Gases, Regulated Emissions, and Energy use in Transportation |
| GVWR | Gross Vehicle Weight Rating |
| HD | Heavy-duty |
| KPDLE | Kilometer per Diesel Liter Equivalent |
| LCA | Life Cycle Assessment |
| LCI | Life Cycle Inventory |
| LD | Light-duty |
| MD | Medium-duty |
| MHD | Medium- and Heavy-duty |
| N2O | Nitrous Oxide |
| NH3 | Ammonia |
| NOX | Nitrogen Oxides |
| PEMS | Portable Emissions Measurement System |
| PM | Particulate Matter |
| PM10 | Particulate Matter ≤ 10 µm |
| PM2.5 | Particulate Matter ≤ 2.5 µm |
| SB | Senate Bill |
| SCE | Southern California Edison |
| SO2 | Sulfur Dioxide |
| SOX | Sulfur Oxides |
| THC | Total Hydrocarbons |
| TRACI | Tool for Reduction and Assessment of Chemicals and other Environmental Impacts |
| TTW | Tank-to-Wheels |
| UCR | University of California, Riverside |
| USLCI | U.S. Life Cycle Inventory |
| VOC | Volatile Organic Compound |
| WTT | Well-to-Tank |
| WTW | Well-to-Wheels |
| ZEV | Zero-Emission Vehicle |
References
- EPA. Inventory of U.S. Greenhouse Gas Emissions and Sinks: 1990–2021; U.S. Environmental Protection Agency: Washington, DC, USA, 2023.
- California Air Resources Board (CARB). California Greenhouse Gas Emissions for 2000 to 2020; CARB: Sacramento, CA, USA, 2022.
- Ramirez-Ibarra, M.; Saphores, J.D.M. Health and equity impacts from electrifying drayage trucks. Transp. Res. Part D Transp. Environ. 2023, 116, 103616. [Google Scholar] [CrossRef]
- Marmiroli, B.; Venditti, M.; Dotelli, G.; Spessa, E. The transport of goods in the urban environment: A comparative life cycle assessment of electric, compressed natural gas and diesel light-duty vehicles. Appl. Energy 2020, 260, 114236. [Google Scholar] [CrossRef]
- Usai, L.; Hung, C.R.; Vásquez, F.; Windsheimer, M.; Burheim, O.S.; Strømman, A.H. Life cycle assessment of fuel cell systems for light-duty vehicles: Current state-of-the-art and future impacts. J. Clean. Prod. 2021, 280, 125086. [Google Scholar] [CrossRef]
- Nordelöf, A.; Messagie, M.; Tillman, A.M.; Ljunggren Söderman, M.; Van Mierlo, J. Environmental impacts of hybrid, plug-in hybrid, and battery electric vehicles—What can we learn from life cycle assessment? Int. J. Life Cycle Assess. 2014, 19, 1866–1890. [Google Scholar] [CrossRef]
- Prevedouros, P.; Mitropoulos, L. Life cycle emissions and cost study of light-duty vehicles. Transp. Res. Procedia 2016, 15, 749–760. [Google Scholar] [CrossRef]
- Wolfram, P.; Wiedmann, T. Electrifying Australian transport: Hybrid life cycle analysis of a transition to electric light-duty vehicles and renewable electricity. Appl. Energy 2017, 206, 531–540. [Google Scholar] [CrossRef]
- Cooney, G.; Hawkins, T.R.; Marriott, J. Life cycle assessment of diesel and electric public transportation buses. J. Ind. Ecol. 2013, 17, 689–699. [Google Scholar] [CrossRef]
- Nordelöf, A.; Romare, M.; Tivander, J. Life cycle assessment of city buses powered by electricity, hydrogenated vegetable oil, or diesel. Transp. Res. Part D Transp. Environ. 2019, 75, 211–222. [Google Scholar] [CrossRef]
- Jwa, K.; Lim, O. Comparative life cycle assessment of lithium-ion battery electric bus and diesel bus from well-to-wheel. Energy Procedia 2018, 145, 223–227. [Google Scholar] [CrossRef]
- Song, Q.; Wang, Z.; Wu, Y.; Li, J.; Yu, D.; Duan, H.; Yuan, W. Could urban electric public bus really reduce the GHG emissions: A case study in Macau? J. Clean. Prod. 2018, 172, 2133–2142. [Google Scholar] [CrossRef]
- Zhou, B.; Wu, Y.; Zhou, B.; Wang, R.; Ke, W.; Zhang, S.; Hao, J. Real-world performance of battery electric buses and their life-cycle benefits with respect to energy consumption and carbon dioxide emissions. Energy 2016, 96, 603–613. [Google Scholar] [CrossRef]
- Gustafsson, M.; Svensson, N.; Eklund, M.; Dahl Öberg, J.; Vehabovic, A. Well-to-wheel greenhouse gas emissions of heavy-duty transports: Influence of electricity carbon intensity. Transp. Res. Part D Transp. Environ. 2021, 93, 102757. [Google Scholar] [CrossRef]
- Booto, G.K.; Aamodt Espegren, K.; Hancke, R. Comparative life cycle assessment of heavy-duty drivetrains: A Norwegian study case. Transp. Res. Part D Transp. Environ. 2021, 95, 102836. [Google Scholar] [CrossRef]
- Sacchi, R.; Bauer, C.; Cox, B.L. Does size matter? The influence of size, load factor, range autonomy, and application type on the life cycle assessment of current and future medium- and heavy-duty vehicles. Environ. Sci. Technol. 2021, 55, 5224–5235. [Google Scholar] [CrossRef] [PubMed]
- van den Oever, A.E.M.; Costa, D.; Messagie, M. Prospective life cycle assessment of alternatively fueled heavy-duty trucks. Appl. Energy 2023, 336, 120834. [Google Scholar] [CrossRef]
- Iyer, R.K.; Kelly, J.C.; Elgowainy, A. Vehicle-cycle and life-cycle analysis of medium-duty and heavy-duty trucks in the United States. Sci. Total Environ. 2023, 891, 164093. [Google Scholar] [CrossRef] [PubMed]
- Gentilucci, G.; Accardo, A.; Spessa, E. Life cycle greenhouse gas emissions of diesel oil and zero-emission trucks: Systematic review of status and perspectives. Transp. Res. Interdiscip. Perspect. 2025, 32, 101563. [Google Scholar] [CrossRef]
- Volvo Group North America. VOLVO LIGHTS: Bringing Battery-Electric Freight Trucks to Market—From Demonstration to Commercialization; Volvo Group North America: Greensboro, NC, USA, 2022. [Google Scholar]
- Fenton, D.; Kailas, A. Redefining goods movement: Building an ecosystem for the introduction of heavy-duty battery-electric vehicles. World Electr. Veh. J. 2021, 12, 147. [Google Scholar] [CrossRef]
- McCaffery, C.; Zhu, H.; Li, C.; Durbin, T.D.; Johnson, K.C.; Jung, H.; Brezny, R.; Geller, M.; Karavalakis, G. On-road gaseous and particulate emissions from GDI vehicles with and without gasoline particulate filters (GPFs) using portable emissions measurement systems (PEMS). Sci. Total Environ. 2020, 710, 136366. [Google Scholar] [CrossRef]
- Johnson, K.C.; Durbin, T.D.; Cocker, D.R.; Miller, W.J.; Bishnu, D.K.; Maldonado, H.; Moynahan, N.; Ensfield, C.; Laroo, C.A. On-road comparison of a portable emission measurement system with a mobile reference laboratory for a heavy-duty diesel vehicle. Atmos. Environ. 2009, 43, 2877–2883. [Google Scholar] [CrossRef]
- Ma, T.; Li, C.; Luo, J.; Frederickson, C.; Tang, T.; Durbin, T.D.; Johnson, K.C.; Karavalakis, G. In-use Nox and black carbon emissions from heavy-duty freight diesel vehicles and near-zero emission natural gas vehicles in California’s San Joaquin Air Basin. Sci. Total Environ. 2024, 907, 168188. [Google Scholar] [CrossRef]
- McCaffery, C.; Zhu, H.; Tang, T.; Li, C.; Karavalakis, G.; Cao, S.; Oshinuga, A.; Burnette, A.; Johnson, K.C.; Durbin, T.D. Real-world Nox emissions from heavy-duty diesel, natural gas, and diesel hybrid electric vehicles of different vocations on California roadways. Sci. Total Environ. 2021, 784, 147224. [Google Scholar] [CrossRef] [PubMed]
- Liu, X.; Elgowainy, A.; Vijayagopal, R.; Wang, M. Well-to-Wheels Analysis of Zero-Emission Plug-In Battery Electric Vehicle Technology for Medium- and Heavy-Duty Trucks. Environ. Sci. Technol. 2021, 55, 538–546. [Google Scholar] [CrossRef] [PubMed]
- ISO 14040; Environmental Management-Life Cycle Assessment-Principles and Framework. The International Organization for Standardization: Geneva, Switzerland, 2006.
- ISO 14044; Environmental Management–Life Cycle Assessment-Requirements and Guidelines. The International Organization for Standardization: Geneva, Switzerland, 2006.
- California Energy Commission (CEC). 2020 Power Content Label Submitted by Southern California Edison; California Energy Commission: Sacramento, CA, USA, 2021. Available online: https://www.energy.ca.gov/filebrowser/download/3902 (accessed on 8 December 2022).
- CALSTART. Volvo LIGHTS: Zero-Emission Goods Movement; CALSTART: Pasadena, CA, USA, 2023; Available online: https://calstart.org/zero-emission-goods-movement-facts/ (accessed on 15 October 2025).
- Gordon, J.; Ivina, A.; Song, S.; Crippen, A.; LeCroy, C.; Johnson, K. Volvo LIGHTS Project: Summary Report; CALSTART and University of California: Riverside, CA, USA, 2022; Available online: https://calstart.org/wp-content/uploads/2023/10/Volvo-LIGHTS-Project_ADA-Remediated_FINAL_10.19.23.pdf (accessed on 15 October 2025).
- Gordon, J.; Lecroy, C.; Latif, B.; Ichien, D.; Arora, M.; Johnson, K.; Kailas, A.; Fenton, D.; Brandis, K. The Zero-Emission Freight Revolution: California Case Studies. In Proceedings of the 35th International Electric Vehicle Symposium and Exhibition (EVS35), Oslo, Norway, 11–15 June 2022. [Google Scholar]
- Nair, V.; Saxena, H.; Pillai, S. Class 7 and Class 8 Tractor–Trailer Electrification for Mys 2030 and 2032; ROUSH: Livonia, MI, USA, 2023; Available online: https://www.edf.org/sites/default/files/2023-08/Roush%20Class%207%20and-%20%208%20Tractor%E2%80%93Trailer%20Electrification%20for%20MYs%202030%20and%202032.pdf (accessed on 13 October 2025).
- National Renewable Energy Laboratory (NREL). U.S. Life Cycle Inventory Database. Available online: https://www.lcacommons.gov/nrel/search (accessed on 21 November 2025).
- Yang, H.; Miller, M.; Fulton, L.; Kailas, A. Medium- and Heavy-Duty Electric Truck Charging Assessment to 2035 in California: Projections and Practical Challenges. Sustainability 2025, 17, 8693. [Google Scholar] [CrossRef]
- Smith, B.L.; Sekar, A.; Mirletz, H.; Heath, G.; Margolis, R. An Updated Life Cycle Assessment of Utility-Scale Solar Photovoltaic Systems Installed in the United States; U.S. Department of Energy, Office of Scientific and Technical Information: Washington, DC, USA, 2024. [CrossRef]
- U.S. Environmental Protection Agency (EPA). eGRID 9th Edition, Version 1.0: Year 2010 Summary Tables; U.S. Environmental Protection Agency: Washington, DC, USA, 2014. Available online: https://www.epa.gov/sites/default/files/2015-01/documents/egrid_9th_edition_v1-0_year_2010_summary_tables.pdf (accessed on 13 October 2025).
- Yusuf, J.; Hasan, A.S.M.J.; Garrido, J.; Ula, S.; Barth, M.J. A comparative techno-economic assessment of bidirectional heavy duty and light duty plug-in electric vehicles operation: A case study. Sustain. Cities Soc. 2023, 95, 104582. [Google Scholar] [CrossRef]
- Biswas, P.; Rashid, A.; Habib, A.K.M.A.; Mahmud, M.; Motakabber, S.M.A.; Hossain, S.; Rokonuzzaman, M.; Molla, A.H.; Harun, Z.; Khan, M.M.H.; et al. Vehicle to Grid: Technology, Charging Station, Power Transmission, Communication Standards, Techno-Economic Analysis, Challenges, and Recommendations. World Electr. Veh. J. 2025, 16, 142. [Google Scholar] [CrossRef]
- Khan, A.U.; Huang, L. Toward Zero Emission Construction: A Comparative Life Cycle Impact Assessment of Diesel, Hybrid, and Electric Excavators. Energies 2023, 16, 6025. [Google Scholar] [CrossRef]
- Raju, A.S.K.; Wallerstein, B.R.; Johnson, K.C. Achieving NOx and greenhouse gas emissions goals in California’s heavy-duty transportation sector. Transp. Res. Part D Transp. Environ. 2021, 97, 102881. [Google Scholar] [CrossRef]
- Sisani, F.; Di Maria, F.; Cesari, D. Environmental and human health impact of different powertrain passenger cars in a life cycle perspective: A focus on health risk and oxidative potential of particulate matter components. Sci. Total Environ. 2022, 805, 150171. [Google Scholar] [CrossRef]
- Marsh, E.; Hattam, L.; Allen, S. A method to create weighted-average life cycle impact assessment results for construction products, and enable filtering throughout the design process. J. Clean. Prod. 2025, 491, 144467. [Google Scholar] [CrossRef]
- Tas, G.; Klemettinen, A.; Serna-Guerrero, R. Circular and Sustainable: Evaluating Lithium-Ion Battery Recycling Using a Combined Statistical Entropy and Life Cycle Assessment Methodology. ChemSusChem 2024, 17, e202400376. [Google Scholar] [CrossRef]
- Roman, G.; Zadek, H. Zero-Emission Heavy-Duty Trucks in Logistics: A Systematic Review and Analysis of Relevant Adoption Parameters. In Latest Advancements in Mechanical Engineering; Concli, F., Maccioni, L., Vidoni, R., Matt, D.T., Eds.; Springer: Cham, Switzerland, 2024; Volume 1125. [Google Scholar] [CrossRef]
- Fabianek, P.; Madlener, R. Assessing Zero-Emission Vehicles from the Customer’s Perspective by Using a Multi-Criteria Framework. Sustainability 2024, 16, 11149. [Google Scholar] [CrossRef]
- Serrano-Guevara, O.S.; Huertas, J.I.; Quirama, L.F.; Mogro, A.E. Energy Efficiency of Heavy-Duty Vehicles in Mexico. Energies 2023, 16, 459. [Google Scholar] [CrossRef]
- Savickas, D.; Steponavičius, D.; Domeika, R. Analysis of Telematics Data of Combine Harvesters and Evaluation of Potential to Reduce Environmental Pollution. Atmosphere 2021, 12, 674. [Google Scholar] [CrossRef]
- Ghaffarpasand, O.; Pope, F.D. Telematics Data for Geospatial and Temporal Mapping of Urban Mobility: Fuel Consumption, and Air Pollutant and Climate-Forcing Emissions of Passenger Cars. Sci. Total Environ. 2023, 894, 164940. [Google Scholar] [CrossRef]


Disclaimer/Publisher’s Note: The statements, opinions and data contained in all publications are solely those of the individual author(s) and contributor(s) and not of MDPI and/or the editor(s). MDPI and/or the editor(s) disclaim responsibility for any injury to people or property resulting from any ideas, methods, instructions or products referred to in the content. |
© 2025 by the authors. Licensee MDPI, Basel, Switzerland. This article is an open access article distributed under the terms and conditions of the Creative Commons Attribution (CC BY) license (https://creativecommons.org/licenses/by/4.0/).