Abstract
Tyre wear is a major contributor to global microplastic pollution, affecting air, soil, water, and wildlife as well as human health. In the European Union (EU), the latest Euro 7 regulation foresees the introduction of tyre abrasion limits covering all tyre categories, referring to two testing methods (convoy on road or laboratory drum) developed by the United Nations (UN) Economic Commission for Europe (UNECE) World Forum for Harmonization of Vehicle Regulations (WP.29). In this study, we applied the convoy method adopted by the UNECE Working Group on Noise and Tyres (GRBP) as part of the UN Regulation 117 on tyre performance parameters. The method has been developed by the Task Force on Tyre Abrasion (TFTA) of the UNECE and involves vehicles driving on public roads for about 8000 km. Candidate and reference tyres are fitted in a convoy of up to four vehicles, and an abrasion index for each candidate tyre is determined as a ratio of the abrasion of the candidate and reference tyres. In our tests, in addition to the abrasion rate, we measured the tread depth reduction and defined a service life index (i.e., total mileage potential) without the need of a different methodology. The results from six summer and nine winter C1 class passenger car tyres of various sizes showed a wide range of abrasion rates and service life values. We also compared our results with values reported in the literature and on websites. The conclusions of this study are expected to support the ongoing discussion on limit setting for C1 tyres and the definition of a service life index.
Keywords:
microplastics; abrasion rate; tread depth reduction; tyre service life; Euro 7; summer tyres; winter tyres; M+S; 3PMSF; snow tyres 1. Introduction
As tailpipe emissions decline, it is estimated that non-exhaust sources such as brake and tyre particulate matter (PM) will represent >90% of road transport particulate emissions by 2050 [1]. Already in 2022, estimated vehicle-related non-exhaust PM levels in a simulated city environment were significantly higher than the exhaust PM levels [2]. Tyre particles are generated by shear forces between the tread and the road pavement. Small particles of a few μm originate from micro vibration, and larger particles in the range of a few hundred μm are attributed to stick-slip motion [3]. Nanosize tyre particles can also be produced by volatilisation [4]. Recent studies find lower tyre PM emission factors than in the past [5]. Nevertheless, tyre wear particles are the main source of microplastic emissions in the EU, with an estimated 500–1000 kt annual release [6,7]. Tyre-derived microplastics contaminate air, water, and soil, with emerging evidence linking exposure to health risks in humans and terrestrial and aquatic life [8]. Following the adoption of its Zero Pollution Action Plan [9], the European Commission (EC) has committed to reducing microplastic released to the environment by 30% by 2030.
With the Euro 7 Regulation [10], the EU has introduced the world’s first legal framework to control and reduce pollution from tyres used by passenger vehicles (C1 tyres), vans (C2 tyres), buses and trucks (C3 tyres). The Euro 7 regulation refers to the work of the United Nations (UN) Economic Commission for Europe (UNECE) to determine the methods to measure tyre abrasion and the applicable tyre abrasion limits, which are yet to be defined.
While tyre wear is a growing concern within the EU globally, consumer awareness remains limited. Surveys consistently show that safety is consumers’ top priority, followed by price, service life (total mileage), and rolling resistance [11,12]. Tyre wear (abrasion performance) usually scores very low, if at all, when considered distinctly from service life. The service life can sometimes be determined with testing until the tread depth reaches the minimum height of 1.6 mm [13] or 3–4 mm for winter tyres. Practically shorter distances are driven, and the total service life is predicted. In the United States of America (USA), service life is characterised by the Uniform Tyre Quality Grading (UTQG) for tread wear [14]. UTQG is determined by comparing the tread depth reduction of candidate tyres to that of monitor tyres installed on vehicles driven for more than 10,000 km (7200 miles). Data for service life can be found in USA reports with UTQG [15]. In the context of the UNECE World Forum for Harmonization of Vehicle Regulations, a characterisation methodology for a service life (mileage potential) index for tyres is still under discussion at TFTA. In Europe, some civil society organisations, such as the General German Automobile Club (Allgemeiner Deutscher Automobil-Club) (ADAC), often test tyres and report their results. Some websites also provide scores based on testing or consumer feedback. Publicly available data regarding tyre wear remain limited, as a recent review highlighted [6]. Since procedures are not fully standardised and tyre wear depends on several factors (e.g., ambient conditions, road, driving style), these results may not be directly comparable [6,16,17]. For the future, research focuses on sensors and models that can predict tyre wear not only for service life estimation but for safety reasons as well [18,19,20,21,22,23].
A recent market assessment of the abrasion performance of C1 tyres was performed within TFTA, following the UN Regulation 117 (from now on UNR 117) Annex 10 test methods (the on-road or ‘convoy’ method and the laboratory or ‘drum’ method) and including more than 160 unique tyre references. The anonymised data were presented during discussion on setting abrasion limits for C1 tyres to be included in a newly proposed UNR specifically dedicated to tyre abrasion, which would supersede existing requirements under UNR 117 Annex 10 [24]. This proposal includes a “core” limit of 1.00 with an additional margin accounting for testing method uncertainties and tyre specificities (Table 1). The values refer to the abrasion level limit (candidate to reference tyres abrasion, normalised to load), as will be explained later.

Table 1.
Proposed effective limits for C1 tyres (only those relevant to this study, i.e., those applicable to the ‘convoy’ method). ‘Effective limit’ is the ‘core’ limit with the addition of a margin to account for the uncertainty of the method. Values refer to the abrasion level index.
This study aims to assess mass loss and tread depth reduction of summer and winter tyres using the recently introduced ‘convoy’ testing method defined in UN R117. We follow the regulated procedure, as it is expected to be the golden standard in the future for type-approving tyres for their abrasion and tread depth performance. We apply, for the first time according to our knowledge, the convoy method, as it is more representative of the actual situation on the roads. We also test a convoy with reference tyres but on different vehicles, including a pure electric vehicle, to identify uncertainties of the method. The data are compared with existing literature sources, including a limited number of tests with the drum method and another circuit. The analysis includes tyre wear as a function of distance travelled, differences of front and rear tyre wear, and theoretical vs. estimated mass loss per mm of tread depth reduction. A service life (mileage potential) index is also proposed without the need of modifying the test procedure, other than measuring the tread depth at the same time as weighing the tyres. As there are not many results available with the regulated or any other real-driving method, our results in comparison to other values reported on websites highlight the need for standardised methods.
2. Materials and Methods
For legislative purposes, tyres are divided into normal and snow tyres; drivers often characterise them by the season as summer and winter tyres, respectively. The three peak mountain and a snowflake (3PMSF) marking indicate that the tyre has been designed for severe snow conditions requiring extra traction for safe driving. Some tyres are marked with M+S on the sidewall, which stands for the words “Mud” and “Snow”. These are considered snow tyres, but the performance under winter conditions is not subject to regulatory testing. In our analysis, we adopt the commonly used terminology: “summer tyres” for normal tyres and “winter tyres” for M+S and 3PMSF tyres.
Table 2 gives an overview of the tyres tested for this study and their characteristics (winter and summer tyres of sizes 195/65 R15, 205/55 R16, and 235/60 R18). The last column gives their code for this study, which is the number of the convoy (3–8) and an identification letter for the vehicle number in the convoy (a–c, d is the reference vehicle with the reference tyres). Details of the tyres can be found in the Appendix A.

Table 2.
Overview of tested tyres.
Tyres approved to UNR 117 are characterised by a set of standard markings on their sidewall. For example, 225/45 R17 94V XL means a tyre with a design “section” width of 225 mm (note that the actual contact width of the tyre with the road surface is smaller), an aspect ratio (distance between the wheel and the edge of the tyre to the tyre design width) of 45%, a radial (“R”) type construction, a rim size (internal diameter of tyre) of 17 inches, a load index of 94 (i.e., tyre that withstands a max load of 670 kg), a speed rating of V (i.e., max speed of 240 km/h), and which is reinforced (XL) (i.e., tyre for increased load capacity).
The tests were carried out at the premises of DEKRA in Narbonne, France. The testing facility carried out all tests fulfilling the requirements of the UNR 117 (Annex 10) with values in the middle of any range prescribed in the regulation, unless otherwise specified below. A schematic representation of the tests is given in Figure 1.

Figure 1.
Schematic representation of tests carried out with winter and summer tyres. Dashed lines represent the circuit. Each convoy (#3–8) consisted of four vehicles, one of them fitted with the reference tyres (SRTT17-S or SRTT17-W) (except convoy #5 with all vehicles fitted with reference summer tyres SRTT17-S).
In short, convoys (#3–8) of 4 vehicles (codes a–d) were driving circuits of 500 km of different roads (in one direction) on each shift, covering well-defined types of driving (i.e., urban, rural, motorway). Table 3 gives an overview of UNR 10 Annex 10 requirements and the actual values of the tests in this measurement campaign. Based on speed, the shares were 12–14% urban, 45–50% rural, and 40–42% motorway (Table 3). Based on the standard deviation of accelerations prescribed in the regulation, the shares were around 35–40% urban (longitudinal 0.45–0.90 m/s2 and lateral 0.40–1.20 m/s2) and 35–40% highway (longitudinal 0.10–0.45 m/s2 and lateral 0.15–1.00 m/s2). The circuit was designed to include different kinds of public paved roads, representative of actual use, fulfilling the regulation requirements (wear rate of reference tyres between 25 and 75 mg/km/t), but at the same time allowing convoys of four vehicles without disrupting the traffic and vice versa, avoiding too much traffic that would impact the tests’ reproducibility. This circuit has also been used to carry out tests for the market assessment of C1 tyres. The positions of the vehicles and drivers were rotating every 500 km, but the tyres were not rotating, i.e., they remained at the same positions as per UNR 117 Annex 10. Each convoy carried out tests until a total distance of 8000 km was reached (on one occasion 10,000 km, convoy #3). The location, speed, and acceleration of the vehicle were determined by a Global Positioning System (GPS) (Racelogic PerformanceBox, Buckingham, UK) with a 10 Hz sampling rate. The standard deviations of the longitudinal and lateral accelerations of each vehicle were within the permissible range prescribed in the regulation (0.45 ± 0.10 m/s2 and 0.93 ± 0.10 m/s2, respectively) (see Table 3). As required by the regulation, the tyre inflation pressure was 2.5 bar for standard load tyres and 2.9 bar for reinforced load tyres (XL). The average ambient temperature of the winter tyre tests was 8–11 °C with 4% of the total distance driven in rainy conditions, while for the summer tyre tests it was around 18–19 °C with 2% rain. Note that regulation requires M+S tyres to be tested with a winter reference tyre (SRTT17-W).

Table 3.
UNR 117 Annex 10 on-road trip requirements. D = Distance.
One of the vehicles (vehicle d) was fitted with reference tyres, while the remaining three vehicles with candidate tyres (vehicles a–c). For winter candidate tyres, vehicle (d) featured the reference winter tyre (SRTT17-W), while for summer candidate tyres, vehicle (d) featured the corresponding summer reference tyre (SRTT17-S). The reason for having reference tyres is that the wear of each set of tyres is compared to the reference tyres to give an index that absorbs the impact of the parameters that affect wear. The main ones, in addition to the tyre itself, are the vehicle (e.g., load, suspension), the road (e.g., surface, dust loading), driving style (e.g., longitudinal and lateral accelerations), and environmental conditions (e.g., temperature, humidity) [6,25]. The equations for the calculation of the index will be given later.
The vehicles with the candidate and reference tyres were of the same model for tyre sizes 195/55 R15 and 205/55 R16. They were front-wheel-drive compact C-segment vehicles with an empty weight of 1450 kg and engine power of 110 kW. Some payload was added to reach 67% of the tyre load index (Table 4) with a load distribution of 56% load at the front wheels and 44% load at the rear wheels, as required in UNR 117 Annex 10. The choice of the vehicle was based on the possibility of fitting the selected tyre sizes, reaching the desired load without exceeding 85% of the maximum payload, and market availability. For the larger tyre size 235/60 R18, the three vehicles of the candidate tyres were of the same model; however, they were a different model compared to the fourth vehicle with the reference tyres. The vehicle fitted with the 235/60 R18 tyres had an empty mass of 2300 kg and engine power of 110 kW. For these 235/60 R18 tyres, due to practical difficulties of vehicle loading at the front part, the load that could be reached was 62%, and the load distribution of front-rear axles was 50%/50%, within the boundaries of the requirements in UNR 117 Annex 10 (Table 3). The interested reader is referred to the regulation for further details [24].

Table 4.
Load index of tyres of this study and respective vehicle loading: 62% (235/60 R18) or 67% (the rest of the tyres) of the tyre load index.
The impact of the vehicle was investigated with convoy #5 fitted only with the SRTT17-S: two vehicles (vehicles c, d) were of the same model and were always used as reference vehicles and for most candidate tyres (195/65 R15, 205/55 R16) (only internal combustion engine); another vehicle was a different model (only internal combustion engine) (vehicle b), and the fourth (vehicle a) was a pure electric (i.e., battery electric vehicle). This test was performed at an average ambient temperature of 28 °C, where abrasion levels are expected to be low, making any differences (expressed as a ratio) more discernible. Nevertheless, the impact of the vehicle is expected to be small, because all vehicles were loaded to reach 67% of the tyre load index.
The weight of the vehicle and the load on each wheel was determined with four scales (one for each position) with an accuracy of 1% of the measured weight. The tyres were weighed at the beginning and at the end of the test (after 8000 km) on a 2 g accuracy scale (without any air inside). The tyres mounted on the rims without air were weighed on the same scale at the beginning, every 2000 km, and at the end after careful cleaning (with air inside at cold conditions at the prescribed inflation pressure). The 8000 km (or 10,000 km) results are calculated by subtracting the start and end tyre weight measurements. Every 2000 km, results are calculated by using the tyre and wheel assembly weight measurements. The two mass results (i.e., tyre vs. tyre and rim mass loss) at 8000 km (or 10,000 km) were within 5% in most cases. The tread depth was manually measured on 6 grooves (2 shoulders and 4 centres) at 4 sectors (every 90°) using an electronic gauge (see Appendix A, Figure A1) every 2000 km, with an accuracy of ±0.1 mm.
The wear of the tyres can be expressed in various ways, typically as mass loss per distance travelled or tread depth reduction.
The abrasion rate (AR) of a tyre (mg/km) is defined as follows:
where m (g) is the sum of the mass loss of the four tyres (every 2000 km or at the end of the test after 8000 km) and D (km) is the distance (2000 km or 8000 km). The abrasion level (AL) of a tyre (mg/km/t) is as follows:
where Q (kg) is the total load of the vehicle (which corresponds to the sum of 62% or 67% of the load index of the tyres). The abrasion rate (and level) depends on the driving and environmental conditions. In order to be able to compare tyres, the ratios to the reference tyres are used. The abrasion ratio index (ARI) and abrasion level index (ALI) of the candidate tyres are as follows:
AR = 1000 m/D
AL = AR/Q/1000
ARI = ARcand/ARref
ALI = ALcand/ALref
This way, the influencing factors’ contribution is minimised, as it is assumed that it is similar to both candidate and reference tyres and cancels out by dividing the two absolute wear rates. This might not be completely true for very low- or high-test ambient temperatures that might affect differently the candidate and reference tyres. However, this was not the case for our tests, where both winter and summer tyres were tested at the middle of the temperature range allowed (see Table 3).
Note that the ARI of the 235/60 R18 tyres might be underestimated by 8% (67%/62%) due to the lower load of the candidate tyres (62%) compared to the reference tyres (67%). This correction was not applied to the 235/60 R18 ARI results. Note that the ALI results are not affected by such small variations, as the equation considers the tyre load. On the other hand, a large tyre with a high load index may have a similar ALI to a small tyre with a low load index even if in absolute terms it loses more tread mass. In the regulation only ALI is defined and subject to a limit (see Table 1).
To estimate the service life (SL) (km) of the tyres (i.e., how many km they would last under the specific driving and environmental conditions), we extrapolated the tread depth reduction after 8000 km of driving to the minimum required of 1.6 mm according to Directive 89/459 [13].
where Ds is the starting distance (0 km), De is the end distance (8000 km), Ts is the start tread depth (mm), and Te is the end tread depth (mm). This was calculated for each of the main grooves (three or four) and not the shoulders. For the calculations, we used the average tread of all four tyres. The service life index (SLI) was then calculated by dividing the minimum SL of the candidate and the minimum SL of the reference tyres, considering the minimum value across the different measurements of the main grooves:
SL = Ds + [(1.6 − Ts)/(Te − Ts)] × (De − Ds)
SLI = SLmin, cand/SLmin, ref
Note that we used the same value of Te of 1.6 mm for both summer and winter tyres. Although this might not be valid for some countries that require a minimum height of 3–4 mm for winter tyres, the index should be independent from the chosen minimum height.
3. Results and Discussion
Figure 2 plots an example of the mass loss and the tread depth reduction of a candidate tyre (Figure 2a) and the reference summer tyre (SRTT17-S) (Figure 2b) every 2000 km. The averages of the two front and two rear tyres are plotted. Both tyres (and in general all tyres we tested) had higher wear at the first 4000 km and lower after 6000 km. Wear was relatively stabilised afterwards, within experimental uncertainties. This applied to both mass and tread depth. The front tyres had a higher wear rate than the rear tyres for the front-wheel-drive vehicles of this study. From this figure it is clear that when calculating a value (e.g., abrasion rate or service life), the absolute value depends on the start and end distance used (e.g., 0 to 8000 km or 4000 to 8000 km). The index (i.e., ratio to reference tyres) is less impacted by this choice, as it will be discussed later.

Figure 2.
Mass loss and tread depth reduction for front and rear tyres: (a) set of candidate tyres (#3c); (b) set of reference summer tyres (#3d).
The total mass loss after 10,000 km was 315 g for one reference front tyre and 120 g for one reference rear tyre. For the 2 g accuracy scales of our study, the uncertainty of the final mass measurements is expected to be 2.8 g (propagation of errors subtracting two quantities). This translates to a relative error of 2–3% for the reference tyres. For the candidate tyres, the lowest mass loss was 50 g and the highest 550 g, corresponding to an uncertainty of 0.5% up to 5.6%. For every 2000 km measurement, the uncertainty is around 4 times higher due to the four times less mass loss measured every 2000 km.
The total tread depth reduction after 10,000 km was 1.4–1.7 mm for the front tyres and 0.5–0.9 mm for the rear tyres. For an accuracy of 0.1 mm, the corresponding uncertainty was from 6% to 20%. For the candidate tyres, at 8000 km the minimum tread depth reduction was 0.3 mm and the maximum 2.2 mm.
In the following results, the average of the two tyres (front or rear) is plotted. In general, the difference between right and left tyre mass loss was negligible for the front reference tyres and around 5% (right tyre higher) for the front candidate tyres. For the rear tyres, the right tyre was around 15% higher than the left tyre. This might be due to the lateral forces being slightly higher for the right tyres for the specific driven circuits, as they were driven only in one direction (and not the opposite).
3.1. Reference Tyres
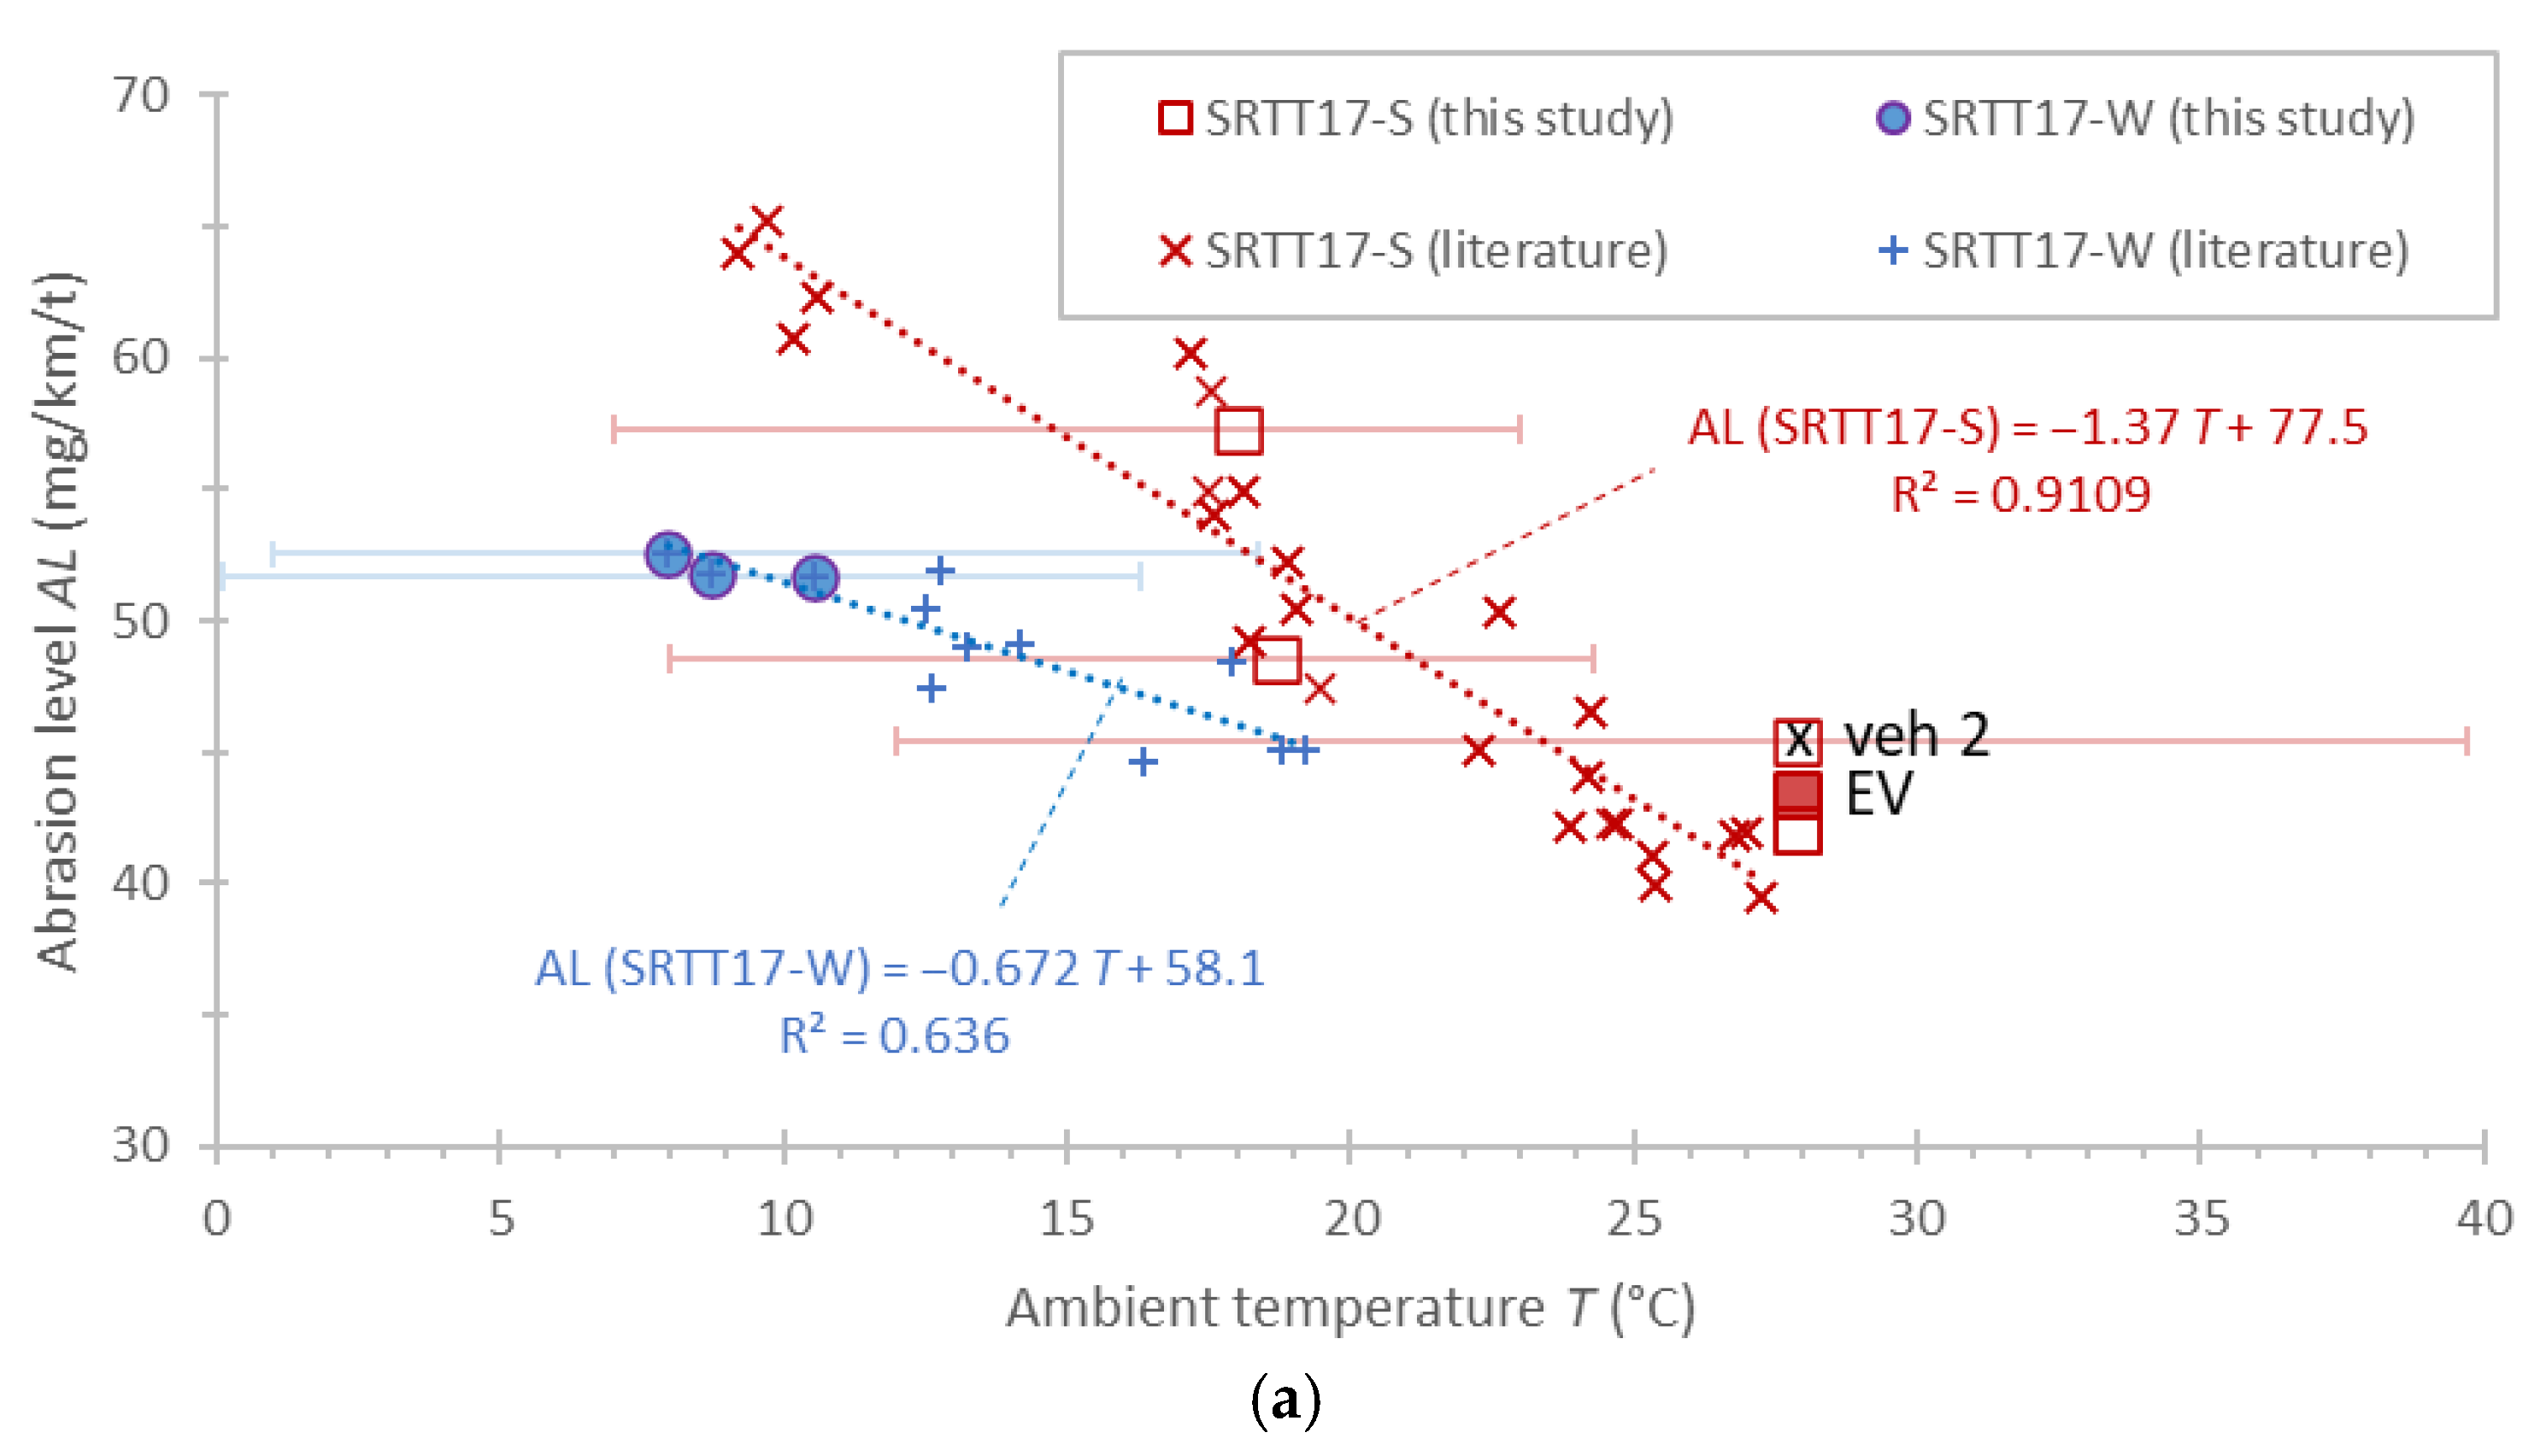
The abrasion rate and level of the reference tyres as a function of the ambient temperature are plotted in Figure 3. In addition to our tests, reported values in the literature [26] for the same circuit are plotted. According to our knowledge, the tests in the literature were carried out with the same reference vehicle as in our study. The points refer to the average temperature over the 8000 km test. For our tests, we also provide the minimum and maximum temperatures during the whole 8000 km trip, which spanned about ±10 °C from the average value.
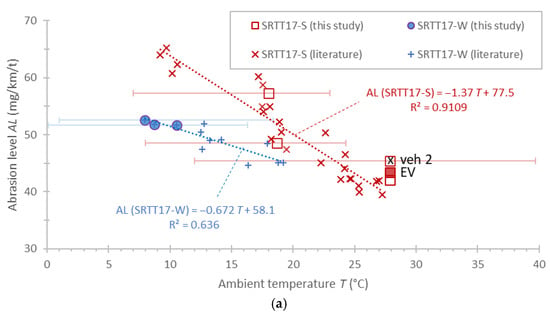
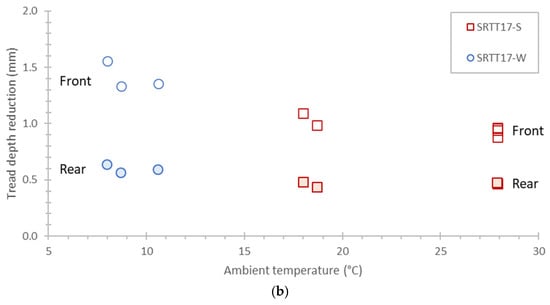
Figure 3.
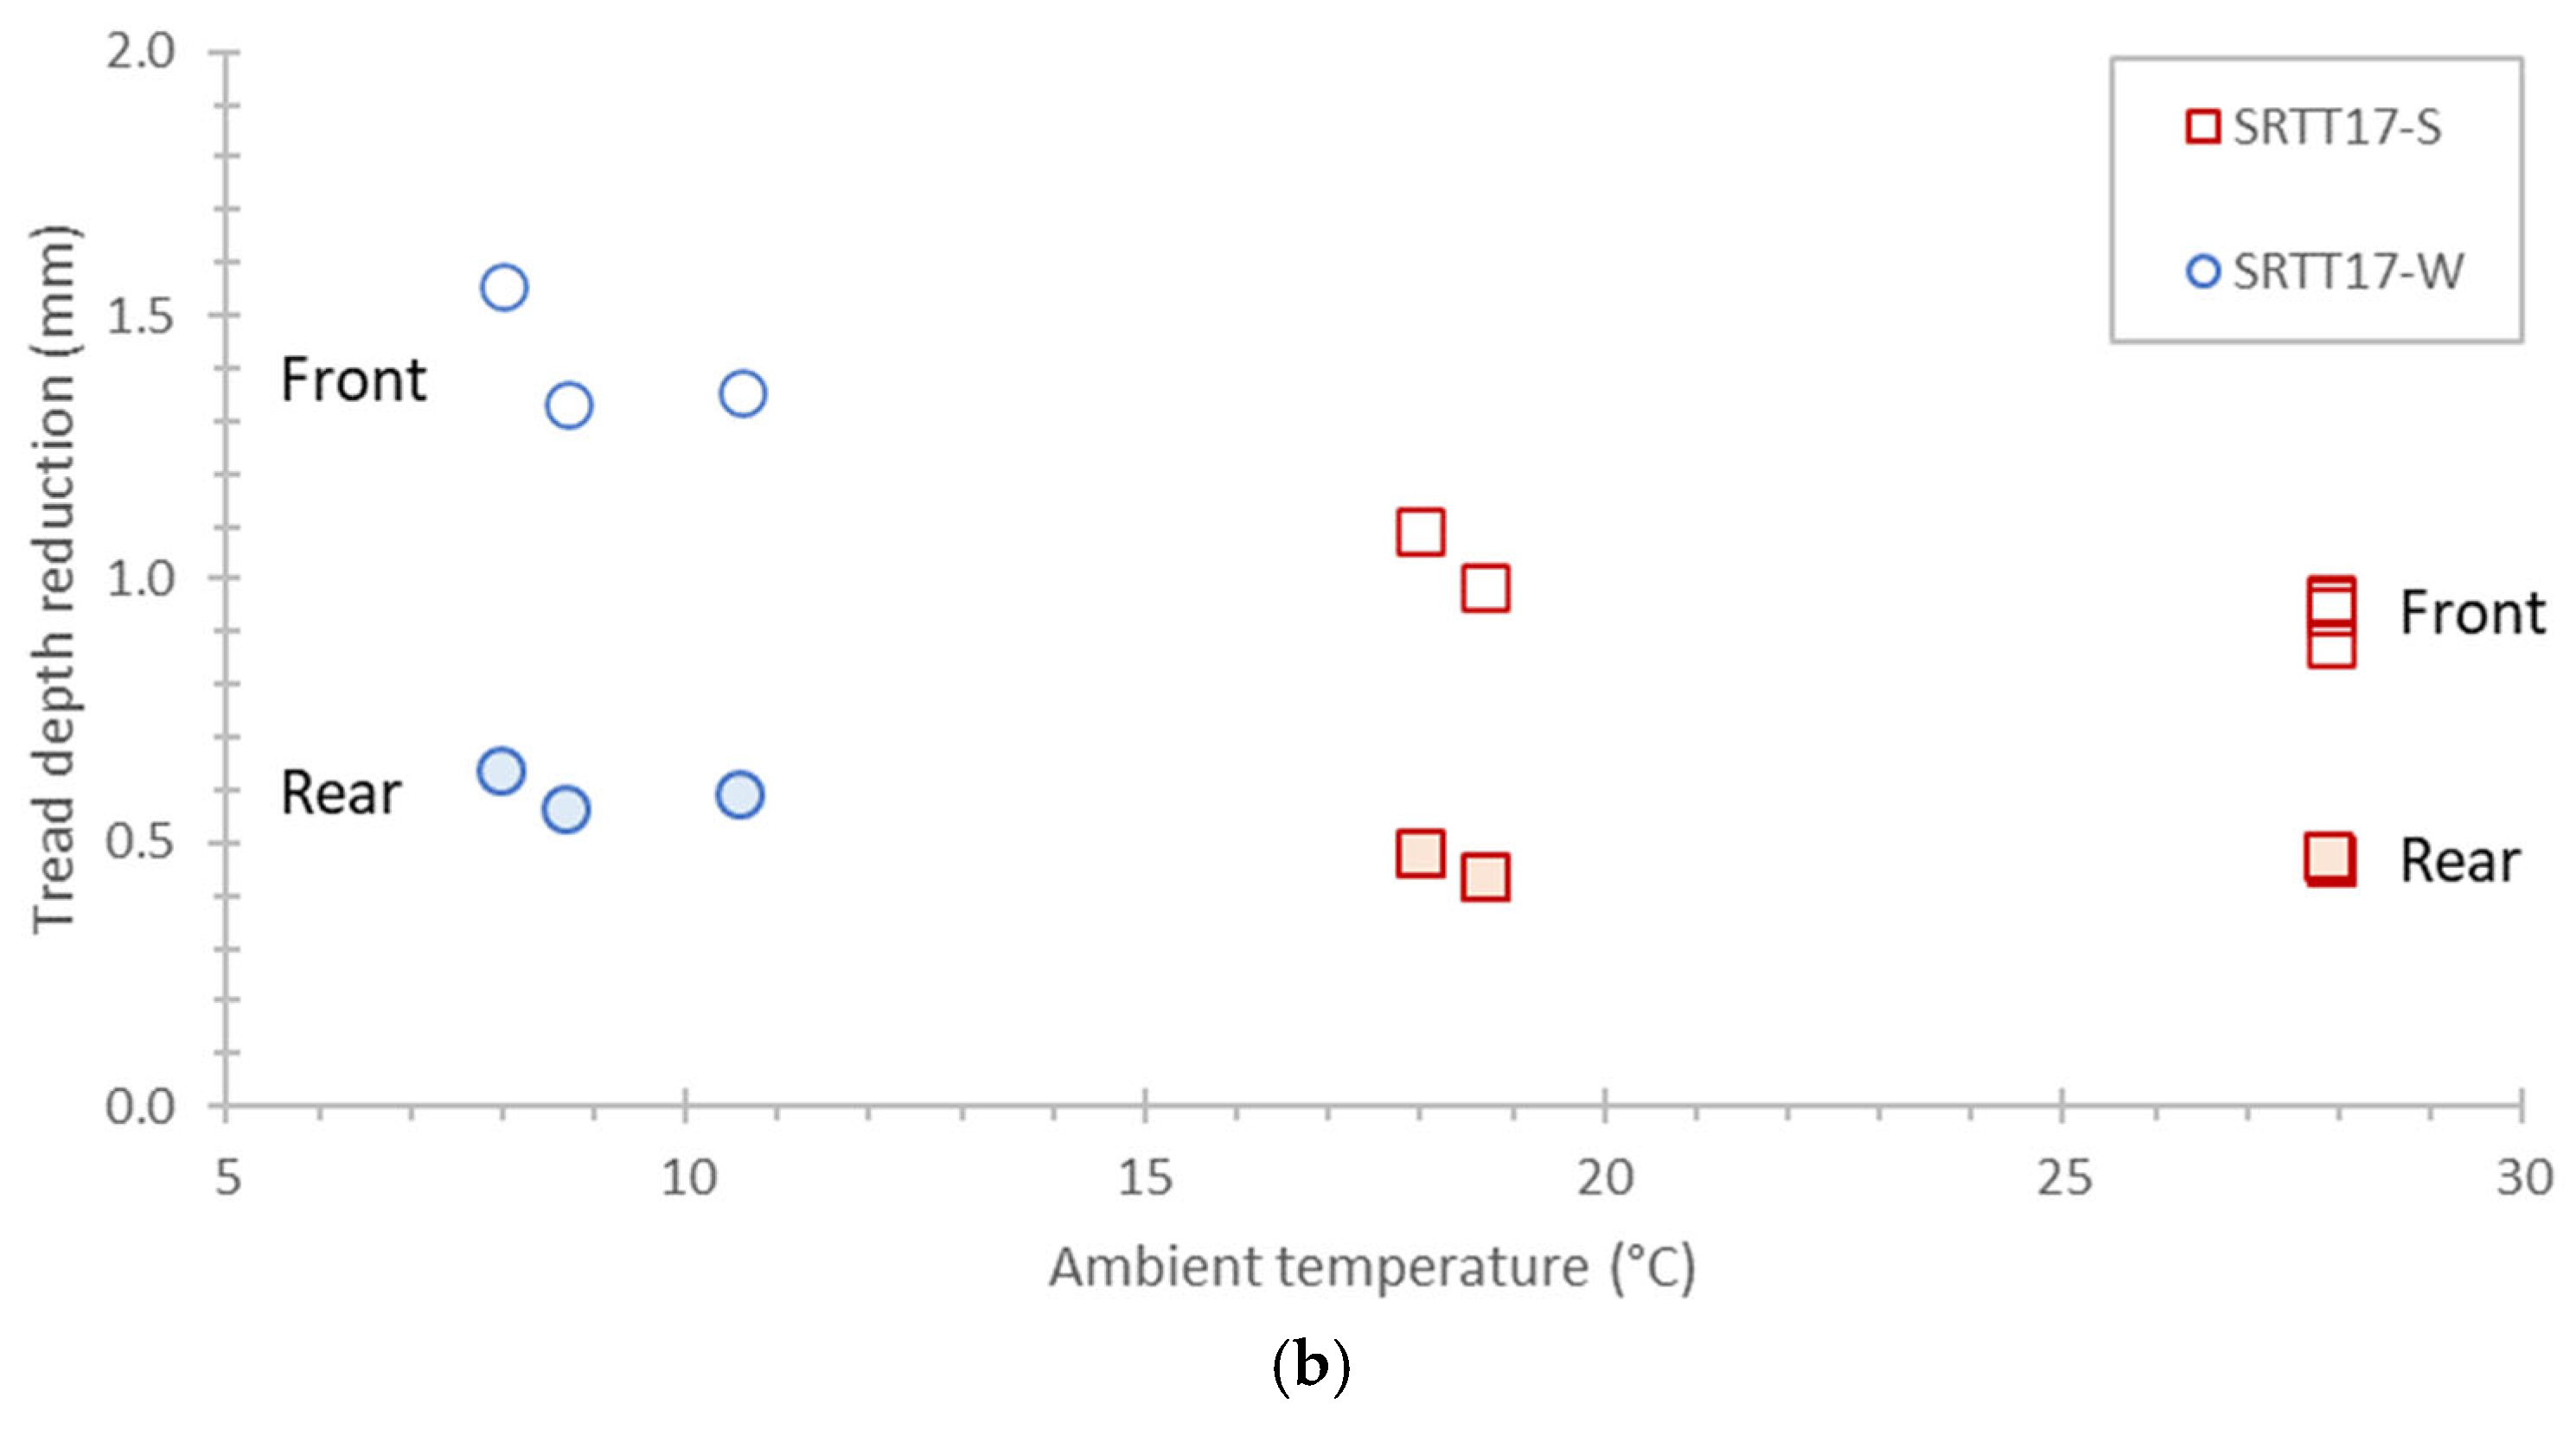
Reference tyre wear in function of average ambient temperature of the 8000/10,000 km tests: (a) abrasion level. The electric vehicle (EV) is highlighted with a solid background, and the second vehicle is “veh 2”. All other points were with the reference vehicle 1. Error bars give min-max temperatures; (b) tread depth reduction for front (outline markers) and rear tyres (filled markers). Solid symbols refer to the rear tyres.
Both reference tyres exhibited decreasing abrasion levels with increasing temperature. This dependency was rather weak for SRTT17-W (around −7 mg/km/t for every 10 °C temperature decrease), but much more evident with SRTT17-S (around −14 mg/km/t for every 10 °C temperature decrease). This indicates that temperature variations might be more critical for summer tyres when performing the legislative procedure compared to winter tyres. For the specific circuit, the SRTT17-S abrasion levels varied between 40 and 65 mg/km/t between temperatures of 8 and 28 °C. On another circuit in Germany, abrasion levels ranged between 40 and 55 mg/km at temperatures between 7 and 22 °C. The trends are in general consistent with literature findings, which mostly report decreased PM levels with increasing temperature [27,28].
At 20 °C, the abrasion level of the SRTT17-S was around 50 mg/km/t. At 10 °C the abrasion level of the SRTT17-W was around 51 mg/km/t. Abrasion variability at a specific temperature was around ±7 mg/km/t. The temperatures of 20 °C for the SRTT17-S and 10 °C for the SRTT17-W have been selected as normalisation temperatures in the UNR 117 Annex 10. At these temperatures, the abrasion levels have to be between 25 mg/km/t and 75 mg/km/t. Our tests met this requirement and suggest that the limits could potentially be narrowed in the future. However, this needs to be confirmed with additional circuits and test locations. For example, ADAC recently reported values of 70–74 mg/km/t for the SRTT17-W (the exact ambient temperature was not reported) [29]. For another circuit in Germany, the abrasion level was around 45 mg/km/t at 20 °C, with a variability of ±5 mg/km/t.
Convoy #5 of the SRTT17-S tyres at 29 °C gave abrasion levels of 42.0–45.4 mg/km/t. The electric vehicle (a) had an abrasion level of 43.3 mg/km/t, indicating that electric vehicles with the same weight and same driving style as internal combustion engine vehicles result in similar abrasion levels and thus tyre wear. The other vehicle (b) with an internal combustion engine (veh 2), which was different than the reference vehicle (veh 1) that was used for all reference and most candidate tyres, was approximately 7% higher than vehicle d. The impact of the reference vehicle on the results needs further investigation, but our results in general show that the impact can be on the order of 5% (3–7%). The differences are close to the measurement uncertainty of the method: considering 2–3% mass loss measurement uncertainty, 1% load measurement uncertainty and no uncertainty for the distance as the same distance is used for all vehicles, the combined uncertainty is in the order of 3%. The remaining difference of 2–5% could originate from other influences such as small differences in driving style, rotation of the drivers, and vehicle position. The aerodynamic coefficients of the vehicles that could play a role in the forces applied to the tyres were close to each other: 0.0306 N/(km/h)2 for the electric vehicle a, 0.0278 N/(km/h)2 for vehicle b, and 0.0286 N/(km/h)2 for vehicles c and d.
Figure 3b shows tread depth reduction after 8000 km of testing as a function of average ambient temperature. No clear effect of ambient temperature on tread wear was observed. However, the limited number of data points restricts the ability to draw statistically significant conclusions. Furthermore, temperature differences were not large enough to clearly reveal any potential effect on tread depth reduction. Finally, the data are limited to our tests, as no other literature data exist for these specific tyres. The SRTT17-S reference summer tyre had a reduction of 1.3–1.6 mm for the front tyres and around 0.45 mm for the rear tyres after 8000 km. The SRTT17-W reference winter tyre had a reduction of 0.9–1.1 mm for the front tyres and around 0.6 mm for the rear tyres.
3.2. Candidate Tyres
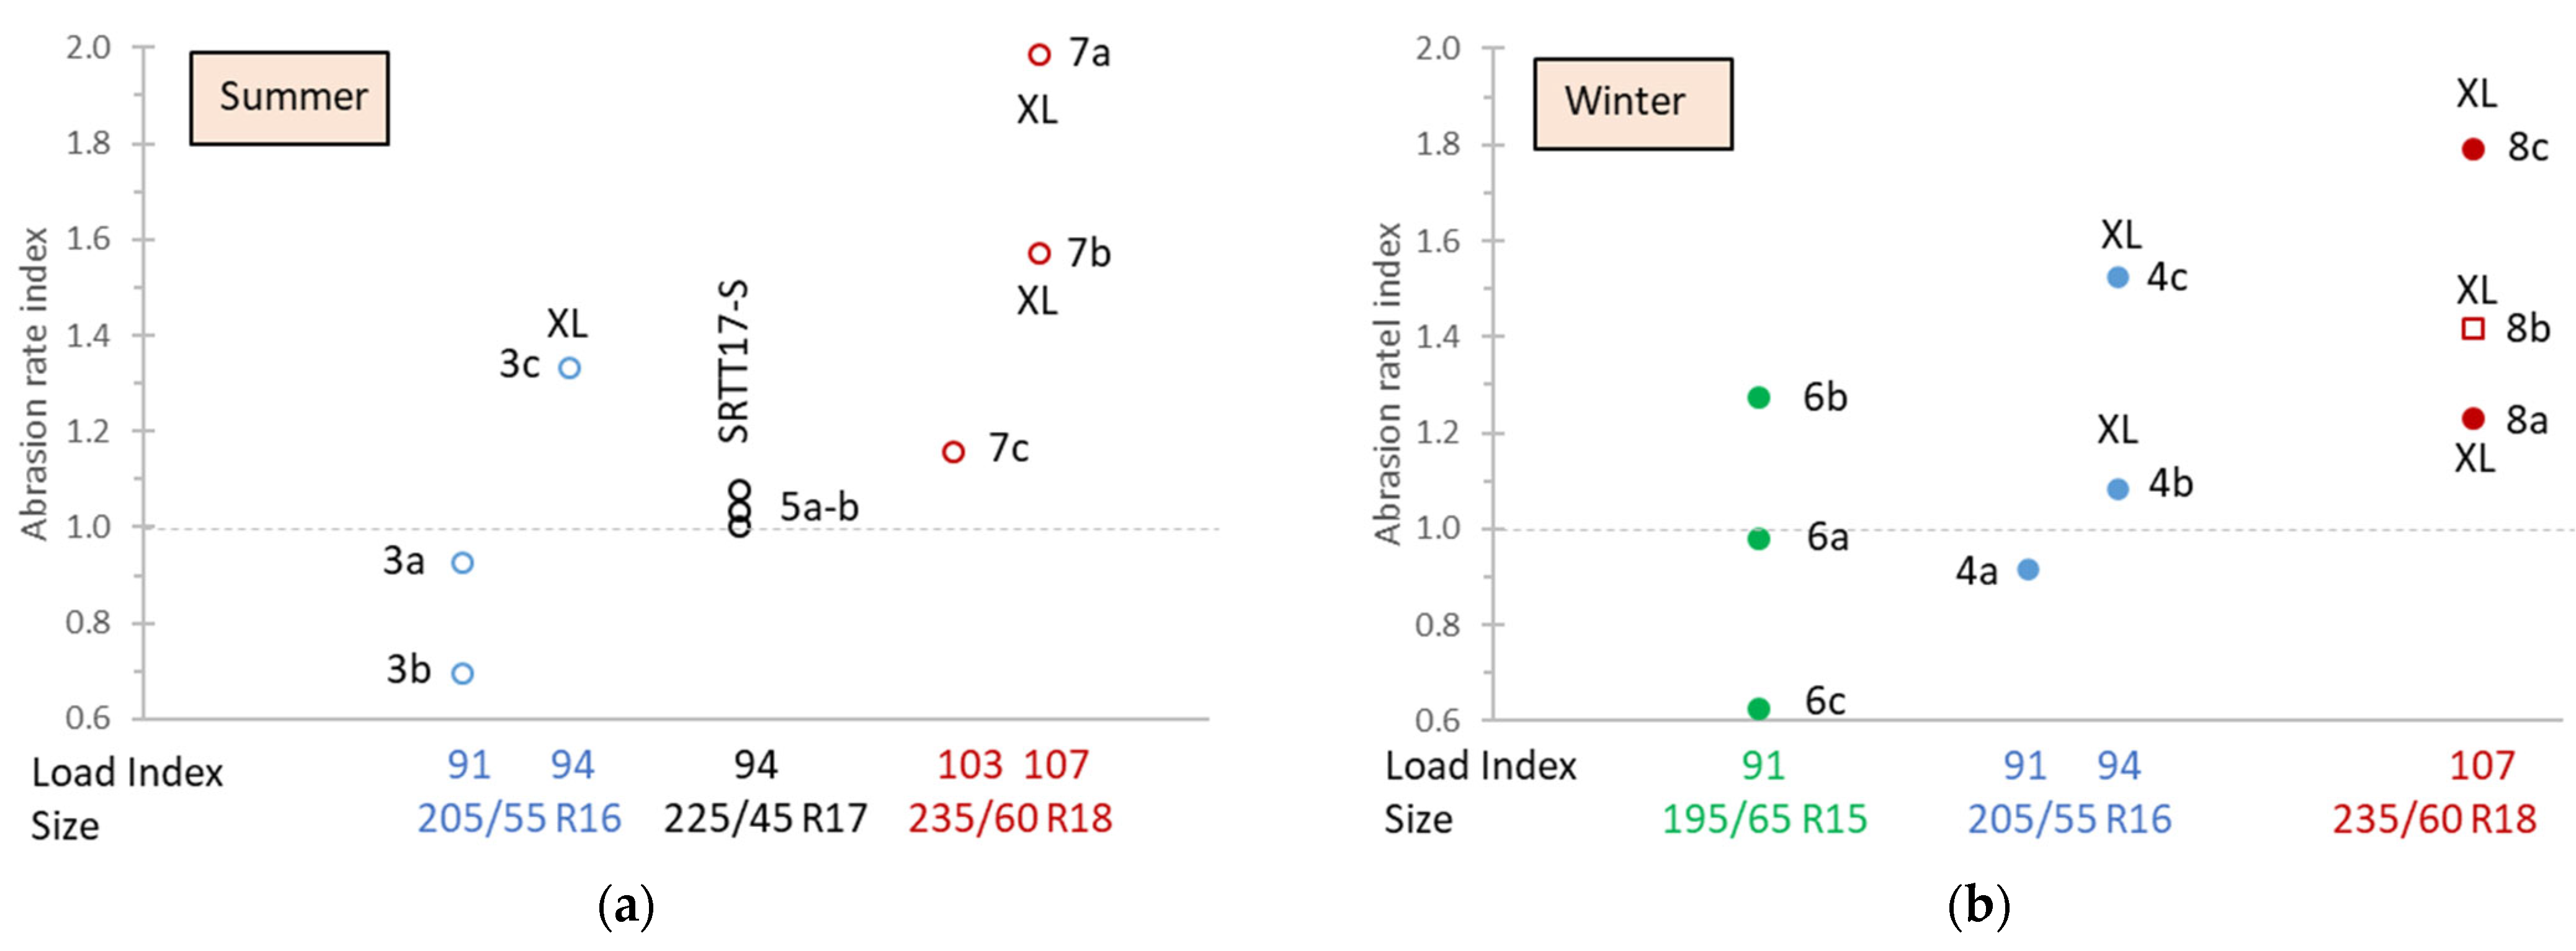
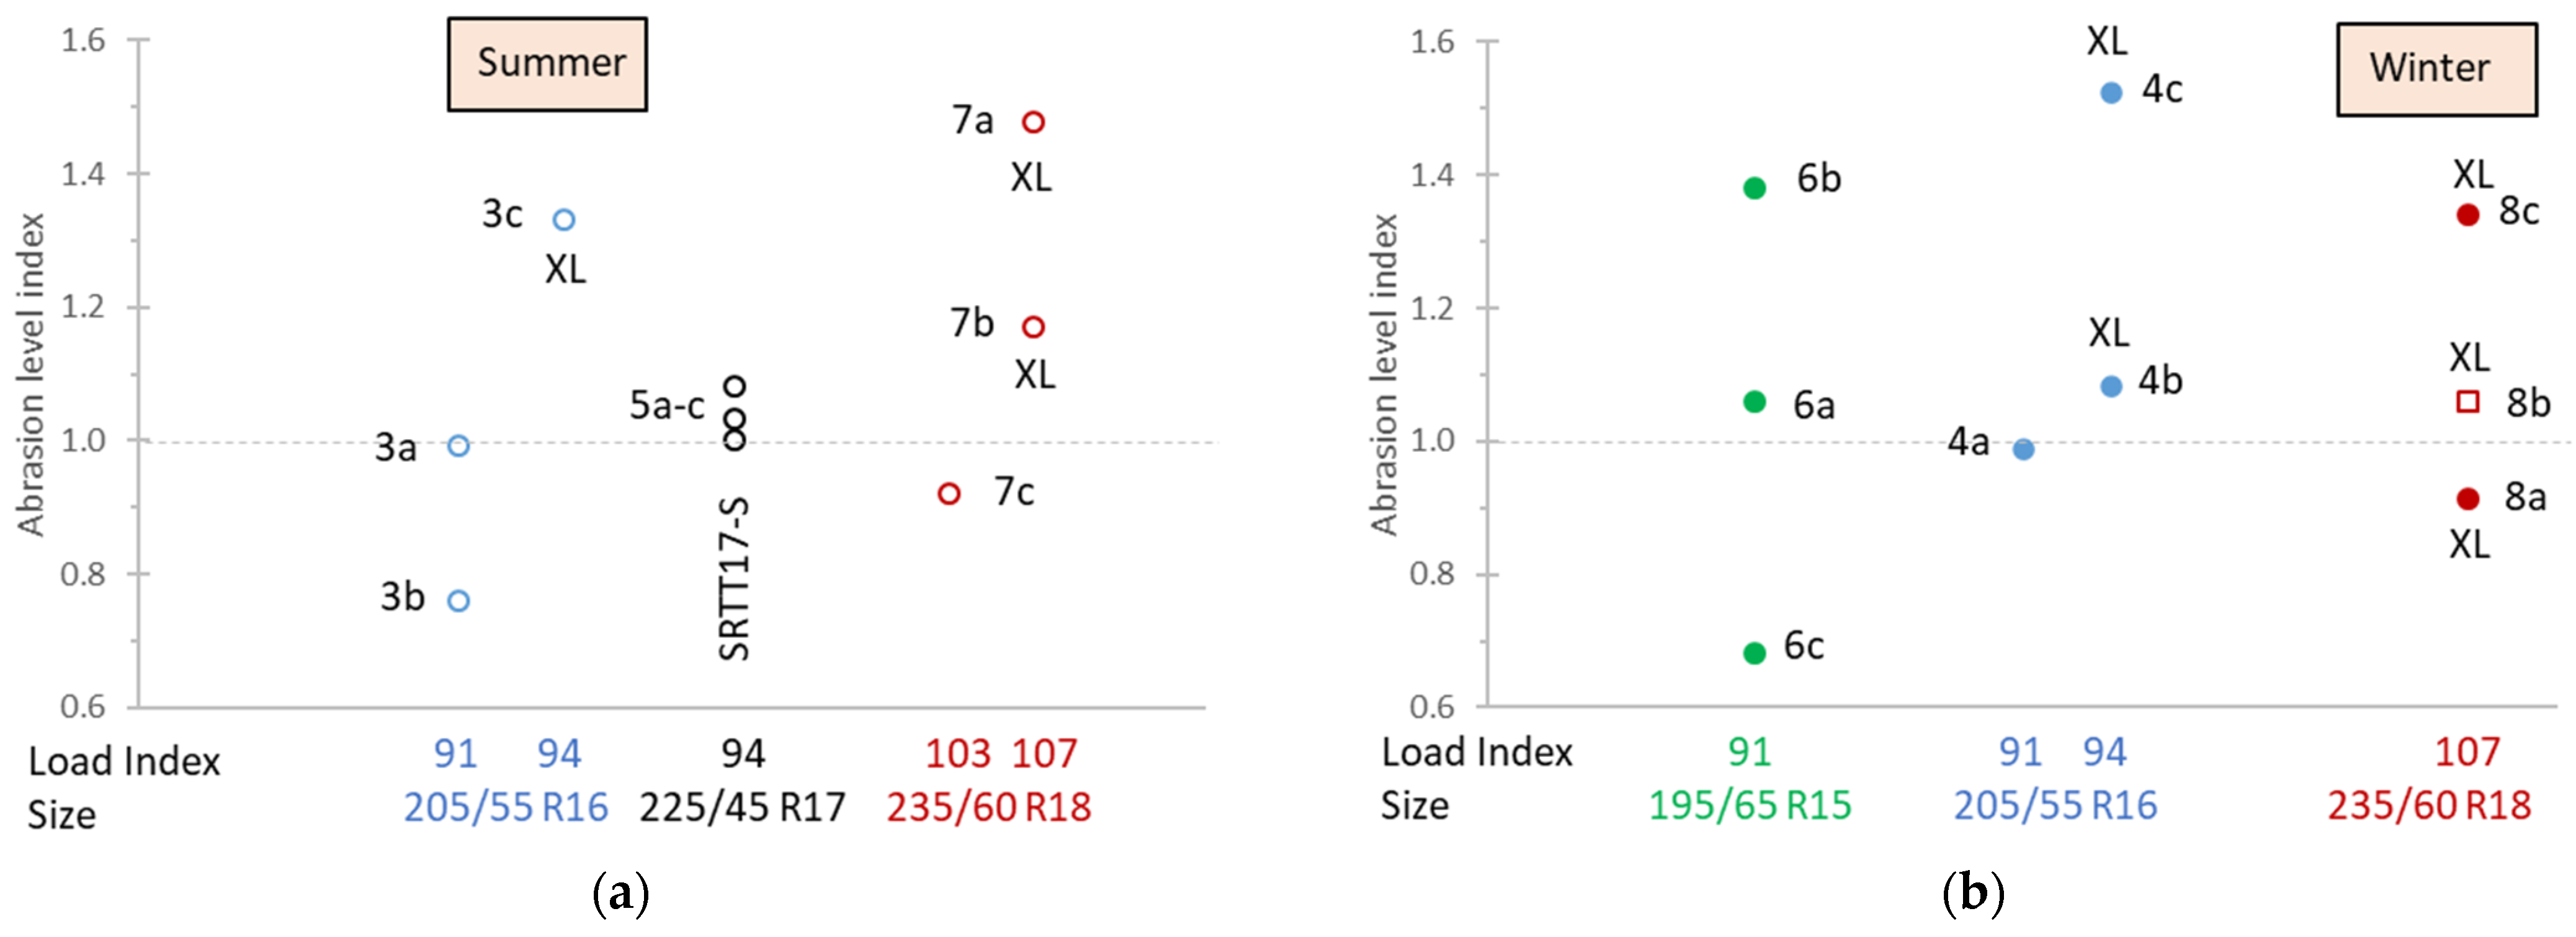
Figure 4 presents the abrasion rate index (ARI) of the candidate tyres as a function of their size and load index. Results are provided separately for summer (Figure 4a) and winter tyres (Figure 4b). Similarly, Figure 5 presents the abrasion level index (ALI) of the tyres. The results of the SRTT17-S convoy are also plotted. Note that abrasion rate is expressed in mg/km, while abrasion level is in mg/km/t. The index is calculated as the ratio of candidate tyre abrasion to the reference tyre abrasion (no matter if rate or level, as the units cancel out). Higher values indicate higher abrasion compared to the reference tyres.
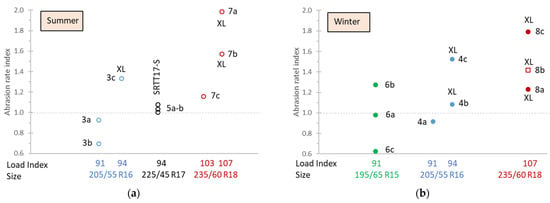
Figure 4.
Abrasion rate index (ARI) results: (a) summer tyres; (b) winter tyres. XL indicates reinforced tyres. All winter tyres are 3PMSF, except the square point, which is only M+S.
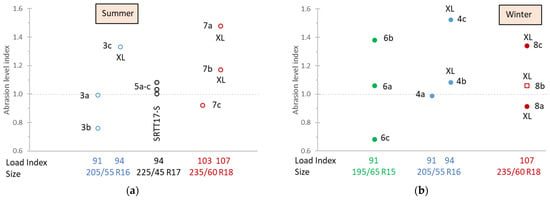
Figure 5.
Abrasion level index (ALI) results: (a) summer tyres; (b) winter tyres. XL indicates reinforced tyres. All winter tyres are 3PMSF, except the square point, which is only M+S.
The results reveal a wide range of abrasion rate index values (Figure 4). These range from as low as 0.6 up to as high as 2.0. There is a tendency of increasing wear with increasing load index. When the abrasion is normalised to the tyre load, the scatter of the results becomes smaller (0.68–1.52), and there seems not to be a dependency on load or tyre size (Figure 5). The results confirm that, on average, there is an almost linear relation between abrasion and load on the tyre. It should be recalled that XL tyres are tested with higher inflation pressure (2.9 bar vs. 2.5 bar) as more representative of real-life application. Whether the inflation has an impact on the wear is under discussion. While older studies [30] showed lower wear with higher pressure, recent studies show the opposite [27,31,32]. A market assessment study took place in 2024 which included approximately 100 summer and 60 winter tyres representative of the market status. The average ALI of summer tyres was 1.14 (0.61–1.71) and 1.20 (0.69–2.02) for winter tyres [26].
It should be added that the abrasion index calculated by summing all tyres’ mass loss was the same as with summing only the front tyres (slope 1.04, R2 = 0.98). Using the sum of rear tyres gave a lower slope and worse correlation (slope 0.85, R2 = 0.64), most likely due to the lower mass loss and higher experimental uncertainty. In the previous values, the 235/60 R18 tyres were not considered, as the load percentage was lower compared to the reference tyres (62% vs. 67%) and the load distribution different (50/50% vs. 56%/44%).
Assuming a reference tyre abrasion level of 50 mg/km/t and a 1.8 t reference vehicle weight (67% of the reference tyre load index), the abrasion rates in our study ranged from 54 mg/km to 180 mg/km or 35 mg/km/t to 85 mg/km/t. The average abrasion rate of all tests was 117 mg/km, or 58 mg/km/t. In our recent review, the average abrasion level was between 58 mg/km/t (EU) and 68 mg/km/t (worldwide), depending on the countries considered [6]. A recent study estimated the environmental benefits of tyre abrasion reductions. In that study the average value of EU27 of 64 mg/km/t was used [7], and 315 kt of tyre wear were emitted to the environment in the year 2025.
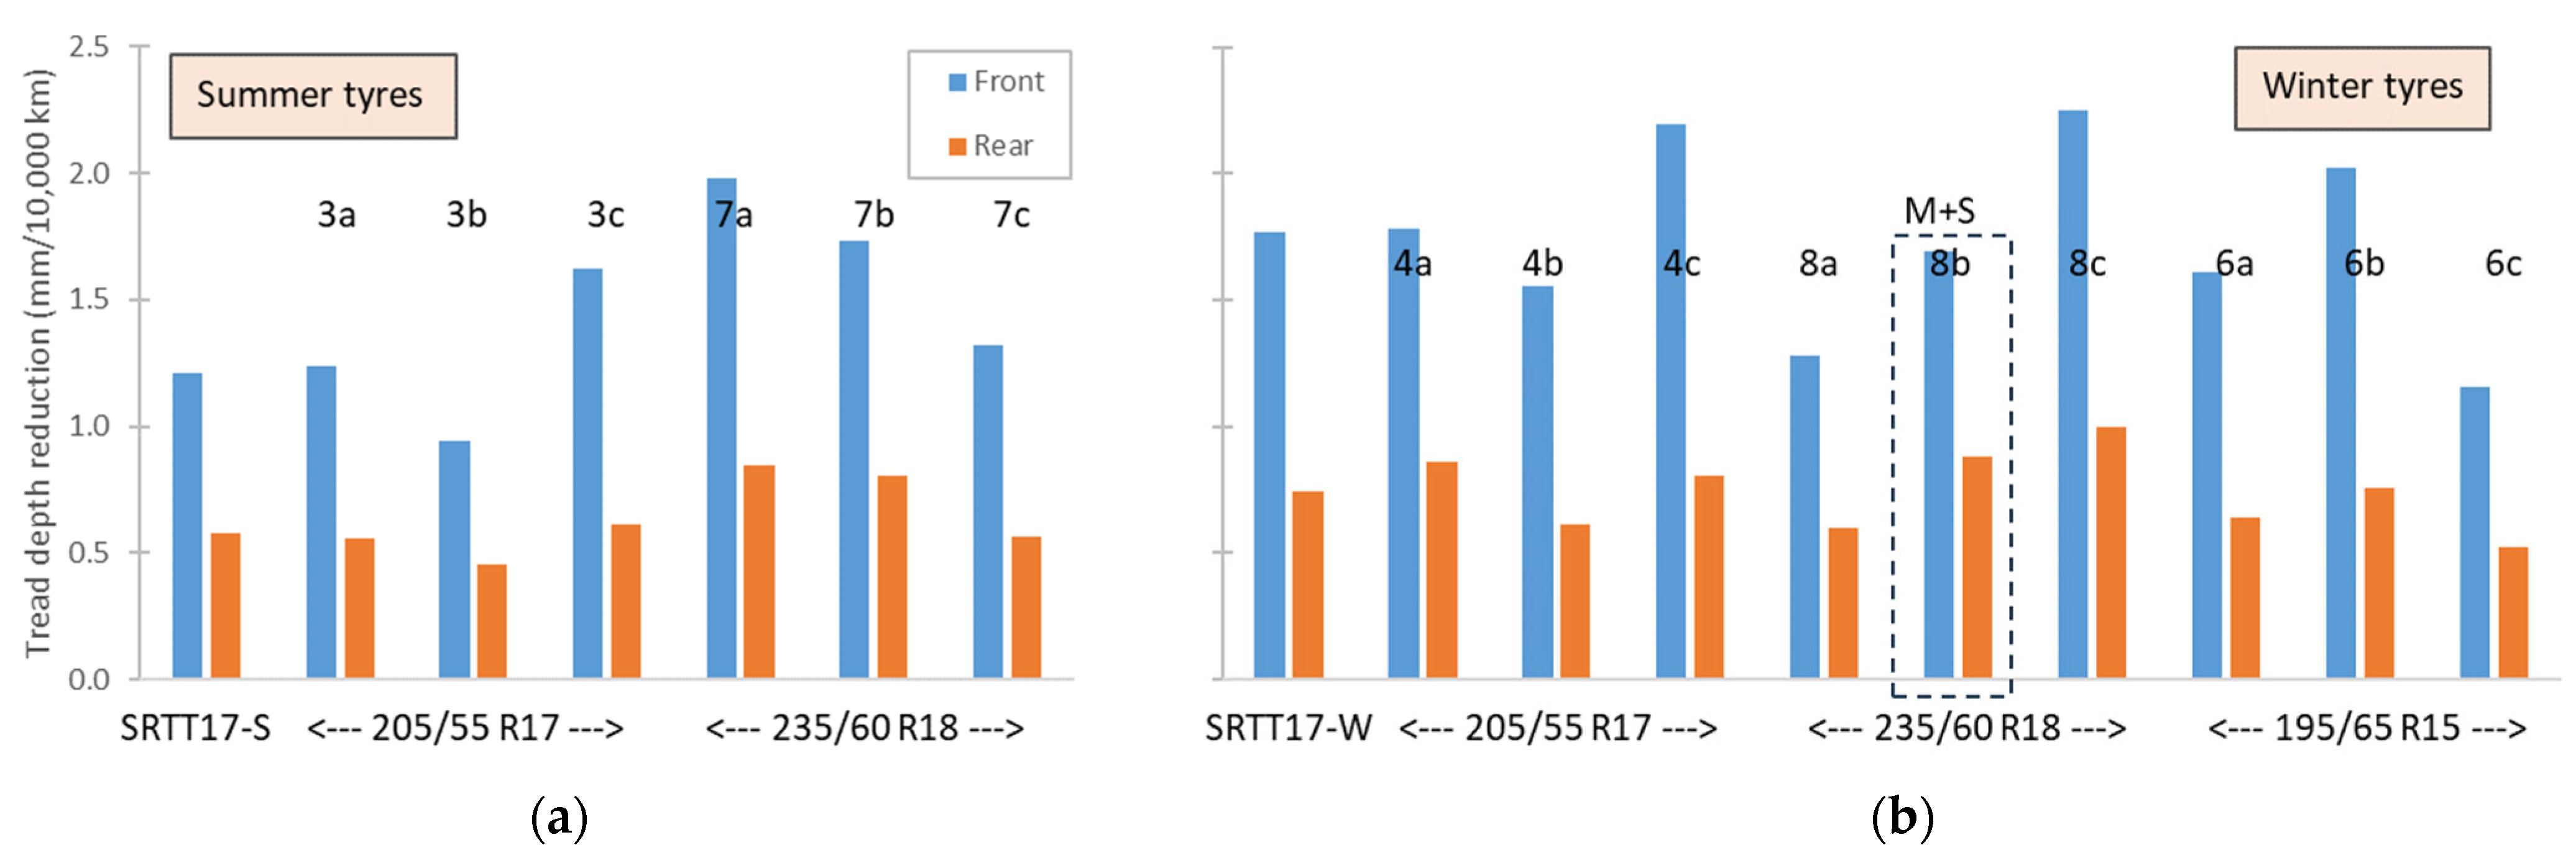
Figure 6 plots the tread depth reduction expressed per 10,000 km (instead of the 8000 km duration of most tests). The average wear rates were 1.47 mm (range 0.9–2.0) and 0.64 mm (range 0.5–0.9) per 10,000 km for the front and rear summer tyres, respectively. The 3PMSF winter tyres had average wear of 1.73 mm (range 1.2–2.2) and 0.73 mm (0.5–1.0 mm) per 10,000 km for the front and rear tyres, respectively. The only M+S tyre had wear rates of 1.69 and 0.88 mm per 10,000 km. Details of tread depth measurements can be found in Appendix A. The results are, in general, in agreement with our review and the studies within [14].
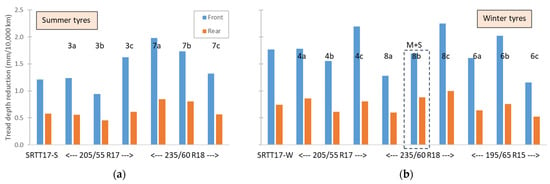
Figure 6.
Tread depth reduction for front and rear tyres: (a) summer tyres; (b) winter tyres. The M+S winter tyre is inside dotted boxes.
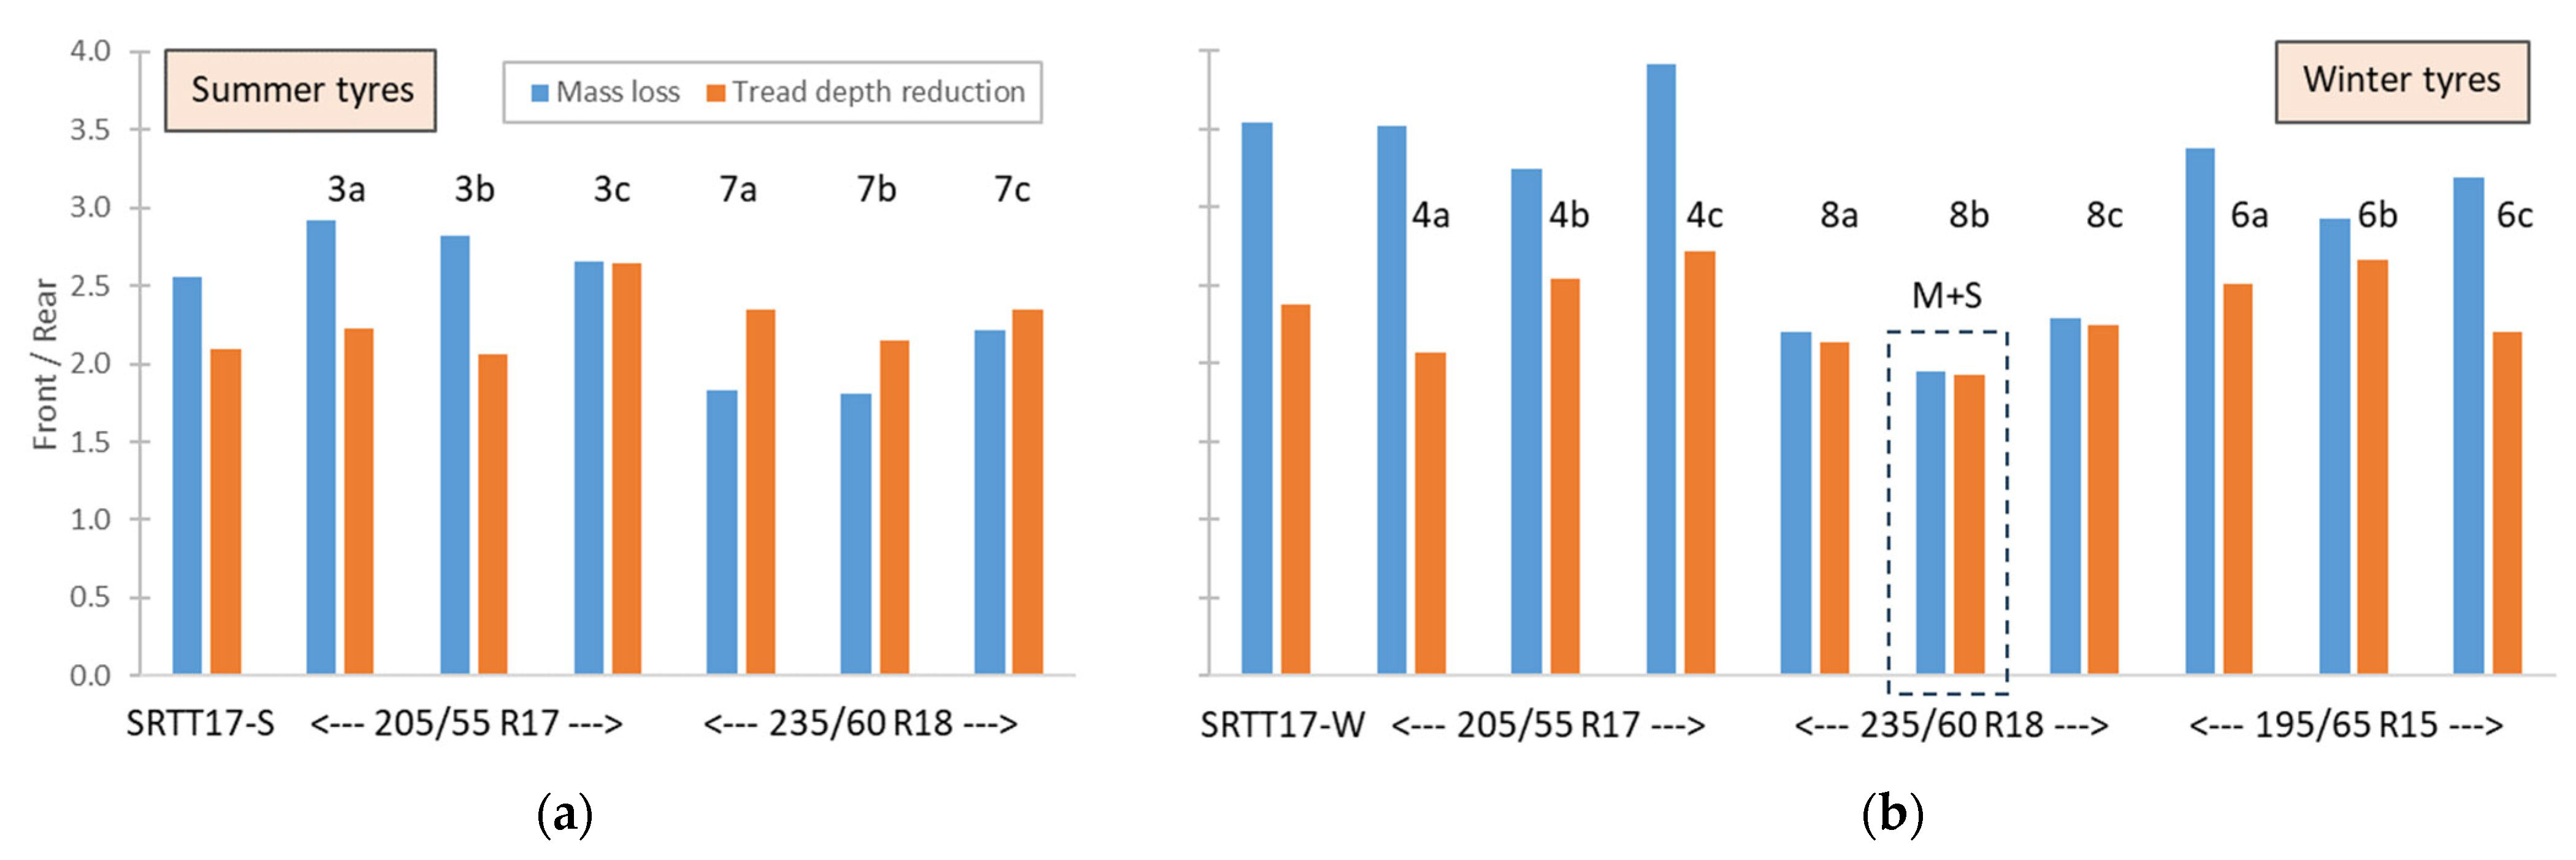
Figure 7 plots the front-to-rear tyre wear ratio in terms of mass and tread depth reduction. For the front-wheel drive vehicles of this study, the ratio was on average (both summer and winter tyres) around 2.4. While for the tread, this ratio varied only between 2.1 and 2.7; for the mass, it varied between 1.8 and 3.9. It should be recalled that the load distribution was 50%/50% for the 235/60 R18 tyres and 56%/44% for the rest of the tyres. On average, the front-to-rear wear ratio was 2.1 for the 235/60 R18 tyres and 3.1 for the rest of the tyres. The figure suggests that, for front-wheel drive vehicles fitted with the same tyres, the measurement of one tyre can estimate wear for both front and rear tyres. For example, if one has only the mass loss measurements of one front tyre, the 2.4 factor means they could multiply by 2.8 to convert the front tyre to total vehicle level mass loss. The 2.8 factor is calculated by solving the equations for total vehicle tyre mass loss (2F + 2R) and F = 2.4R, where F and R are the mass losses of the front and rear tyres, respectively.
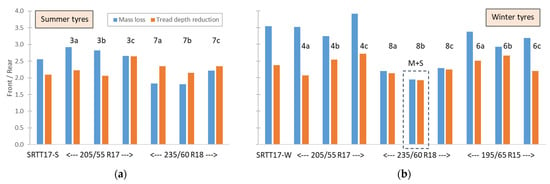
Figure 7.
Ratio of front and rear tyres regarding mass loss and tread depth reduction: (a) summer tyres; (b) winter tyres. The M+S winter tyre is inside dotted boxes. The load distribution was 50%/50% for the 235/60 R18 tyres and 56%/44% for the rest of the tyres.
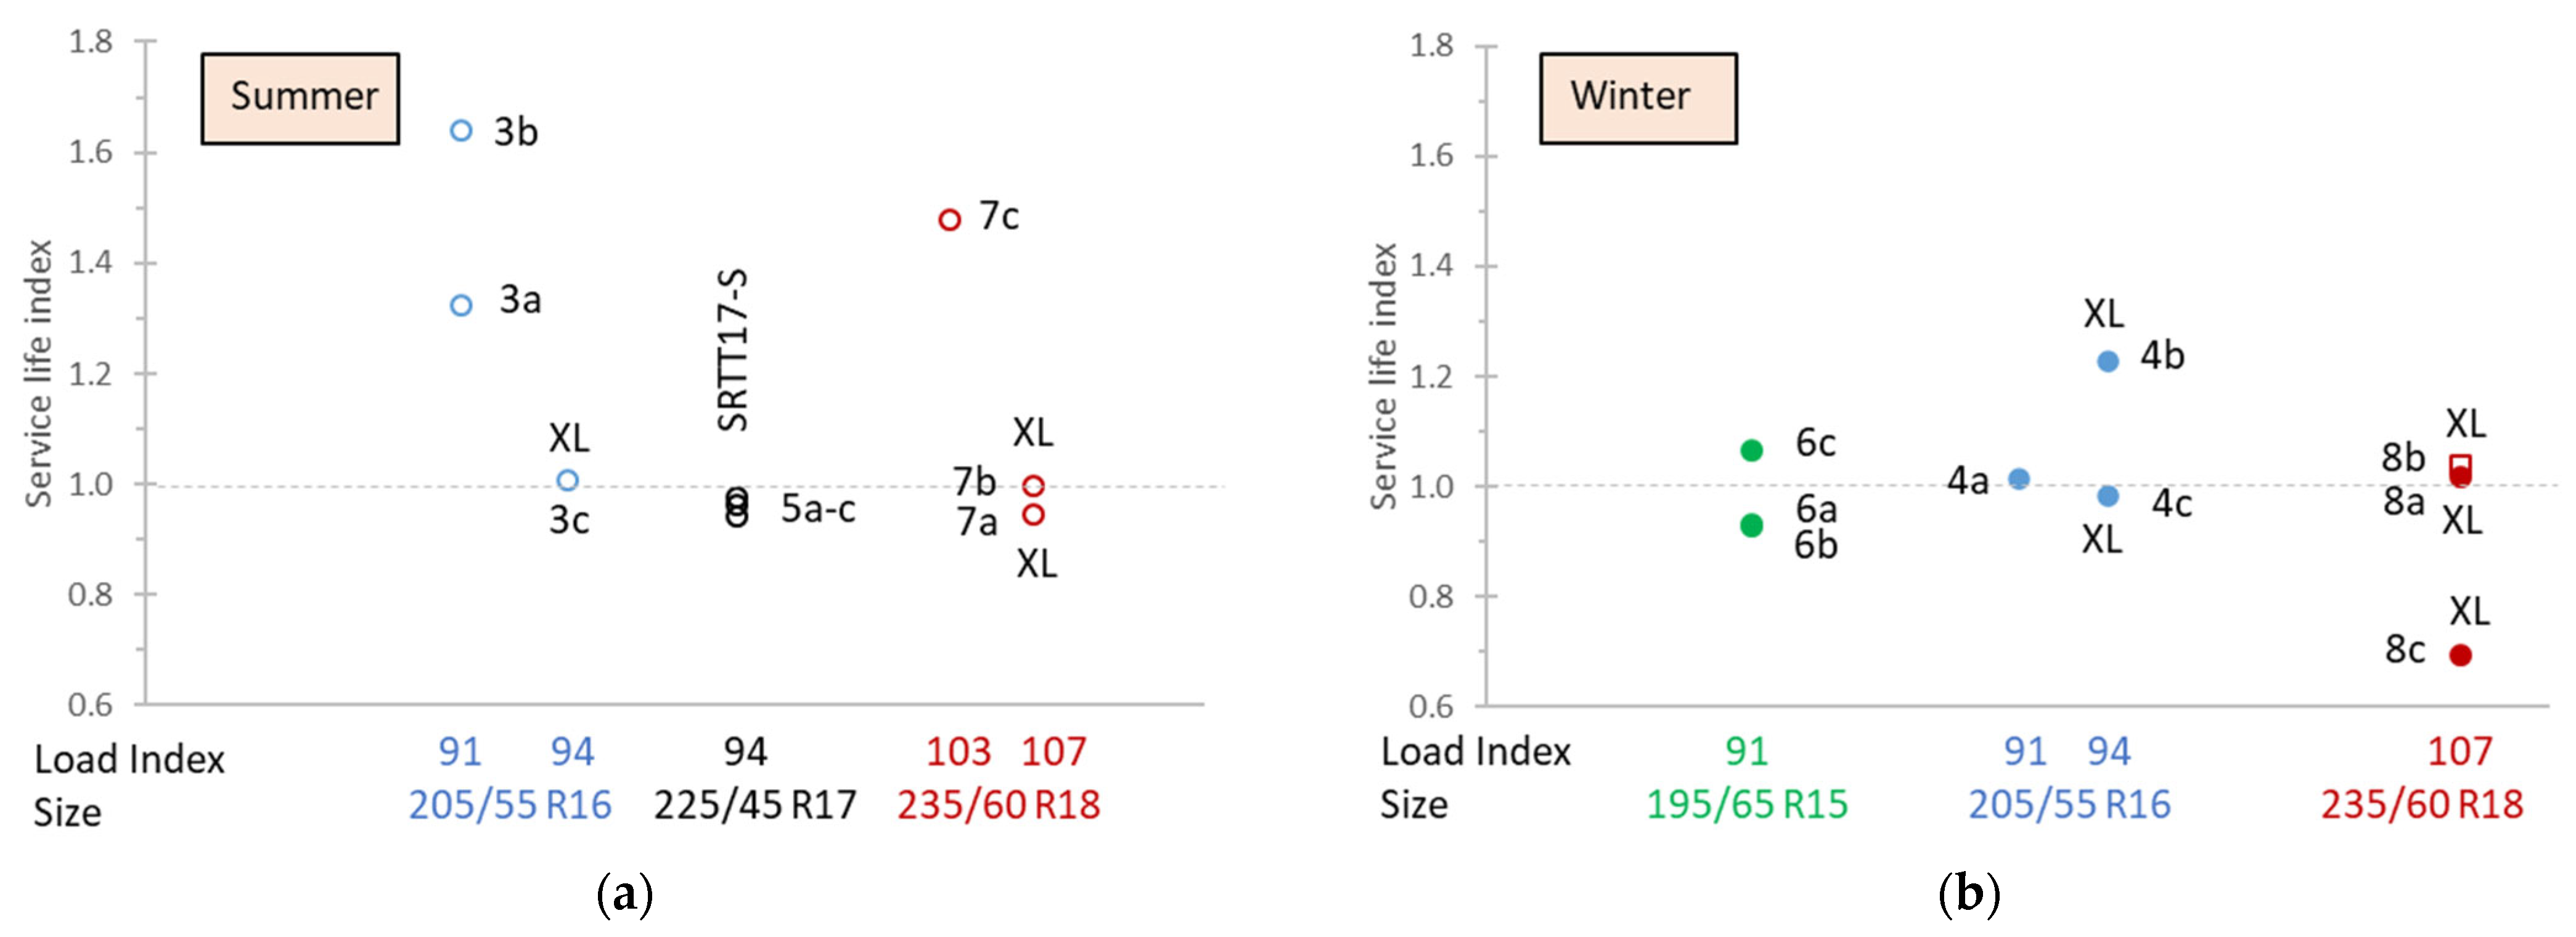
Figure 8 summarises the service life index values of the tested tyres. Service life index values were estimated with Equation (6), as described in the Section 2. A higher index corresponds to a higher service life (mileage) compared to the reference tyres. The values ranged from approximately 0.7 to 1.64. A service life index of 1 corresponds to approximately 45,000 km, as indicated by the reference tyre results (for the SRTT17-W at 8–11 °C and for the SRTT17-S at 18–19 °C, applying Equation (5) for the respective tests, vehicle d of each convoy). The 3PMSF winter tyres of this study had a service life index of 0.98, while summer tyres had a service life index of 1.23, and the one M+S tyre had a service life index of 1.04. As, on average, the start tread depths of summer and winter tyres were similar (7.5 to 7.7 mm) and the ambient temperature should have a small effect on the service life index (as with the abrasion index), the higher values of winter tyres can be explained by the softer rubber compounds typically used in the tread.
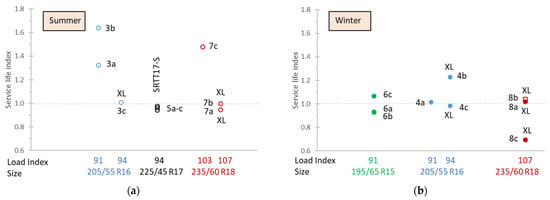
Figure 8.
Service life index of: (a) summer tyres; (b) winter tyres. XL indicates reinforced tyres. All winter tyres are 3PMSF, except the square one, which is only M+S.
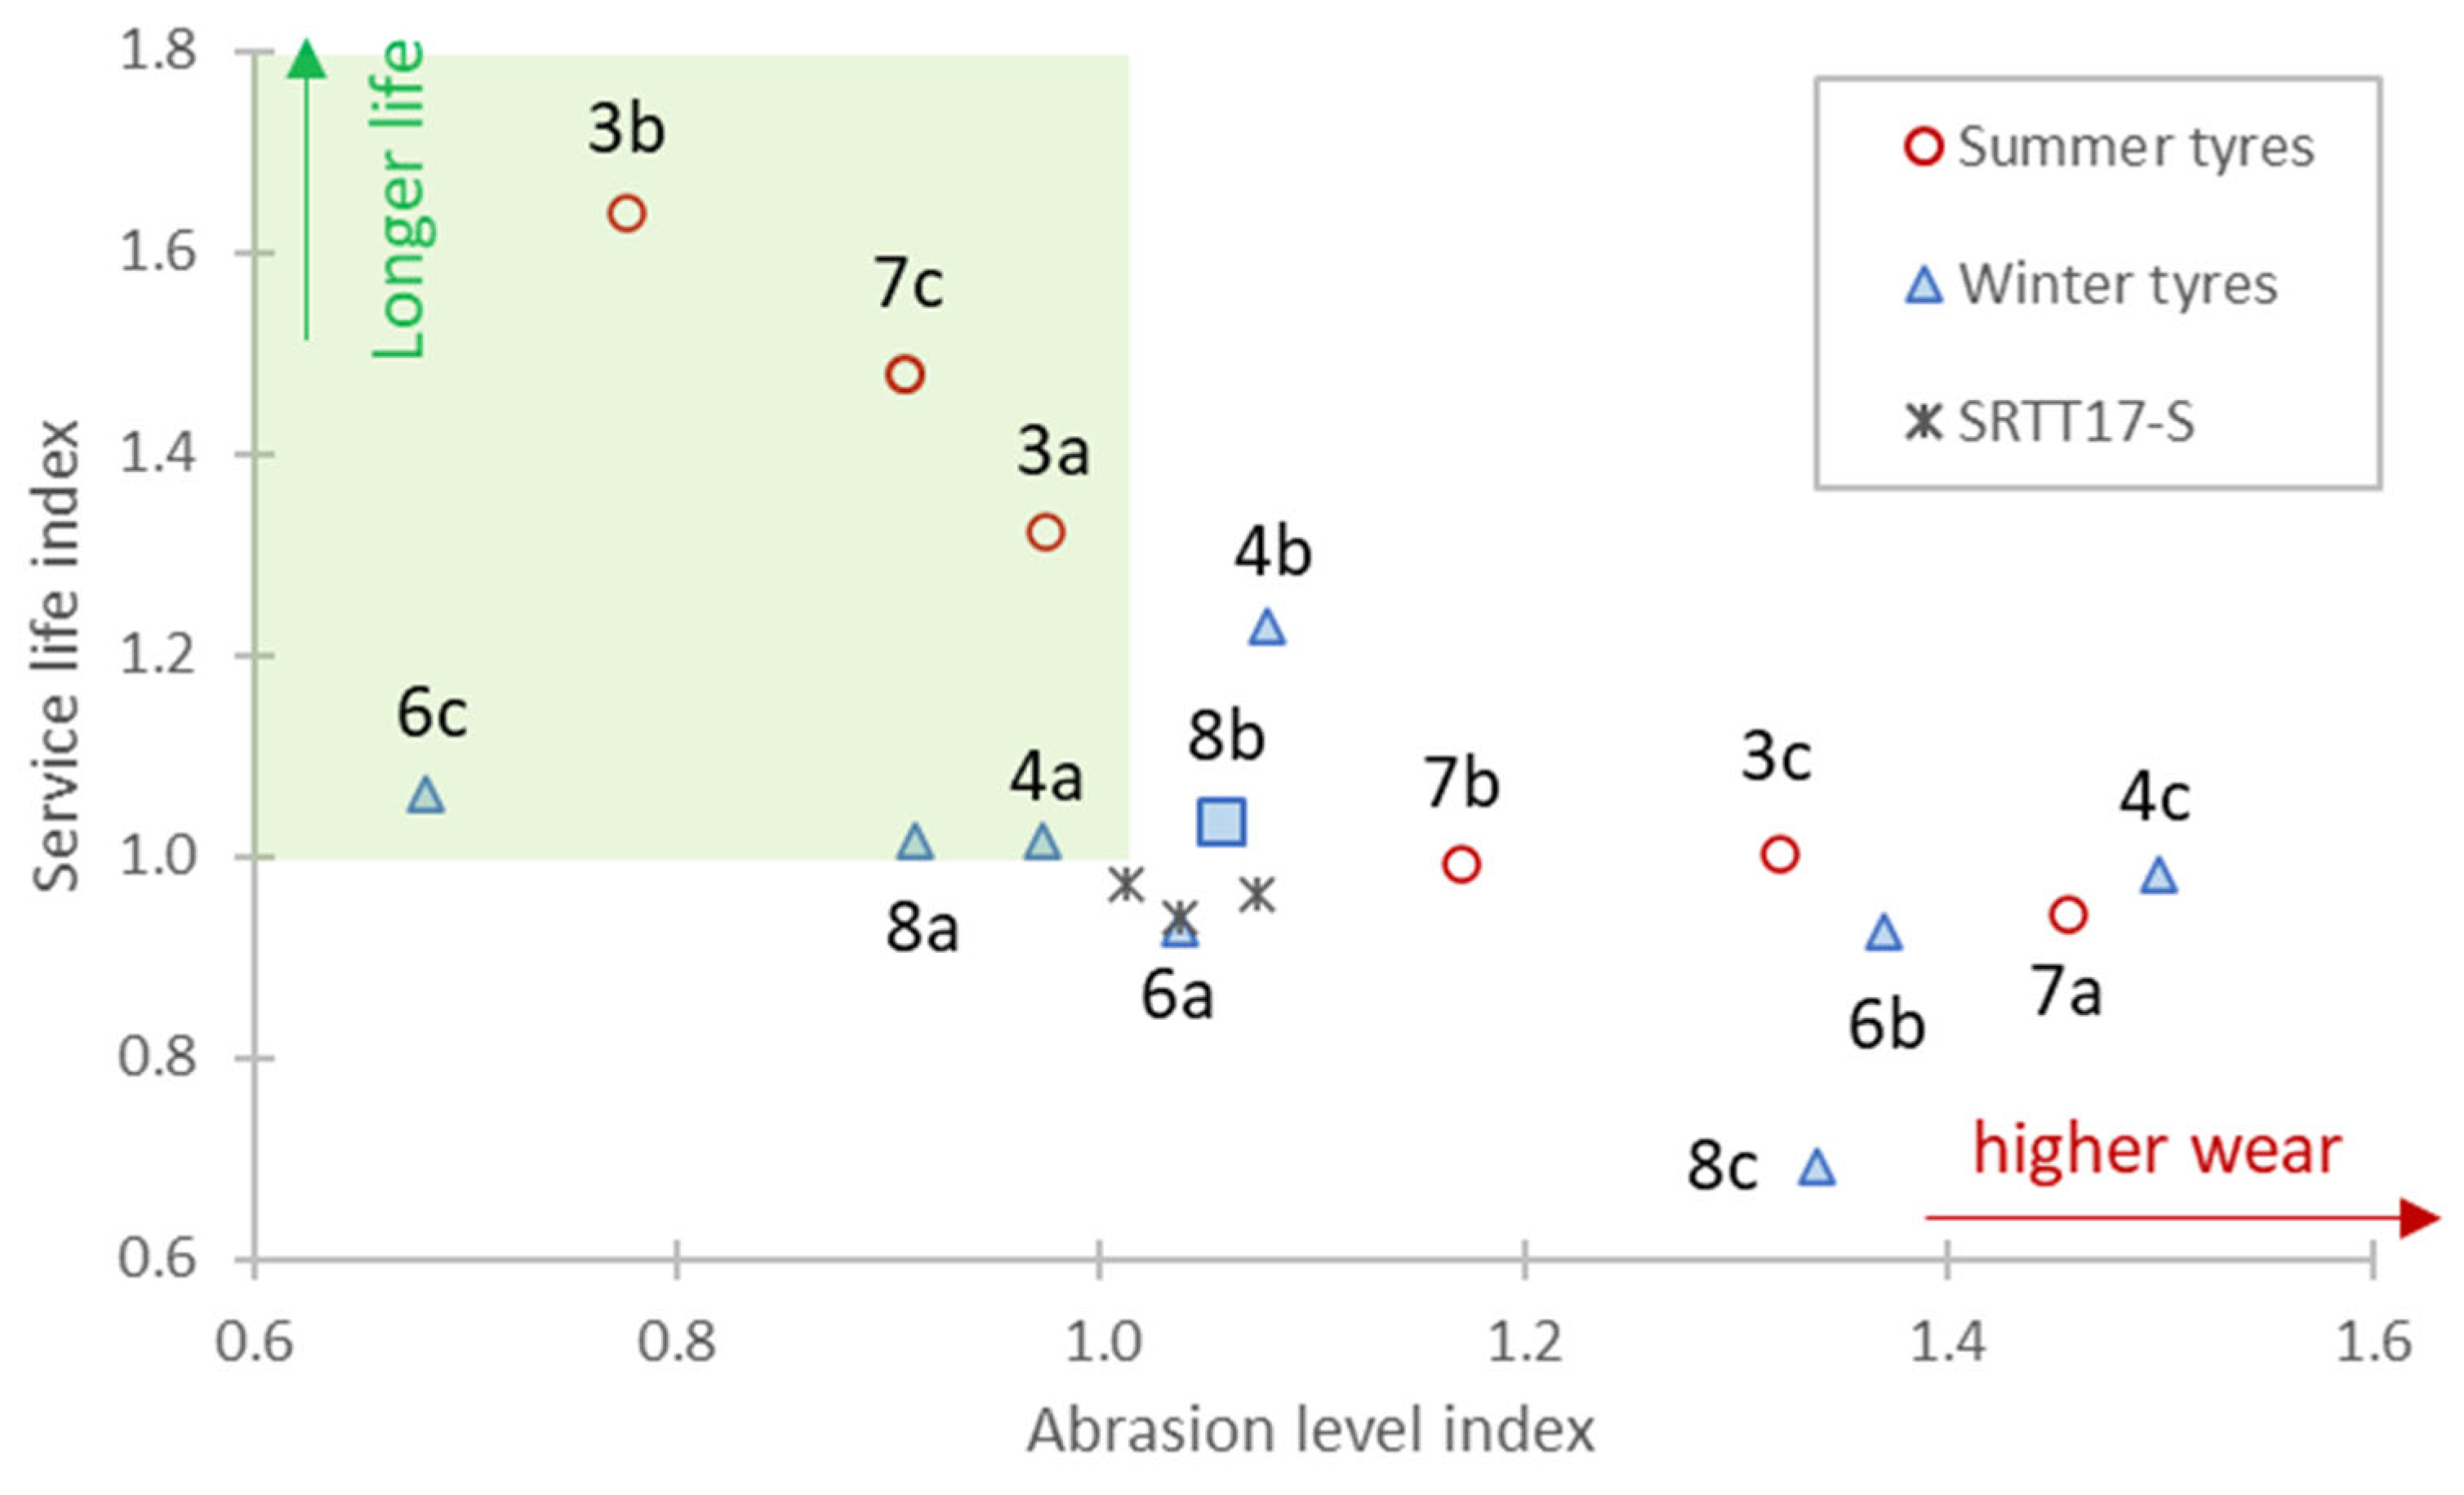
Figure 9 compares the service life and abrasion rate indices. Although, in general, higher abrasion (high abrasion rate index) should result in lower service life (lower service life index), the trend was not so clear, particularly for the winter tyres. This is because the total available tread depth is also important. For example, even if a tyre has a high abrasion rate, it may still have a long service life if the tread depth is higher than that of another tyre with low abrasion but low tread depth.
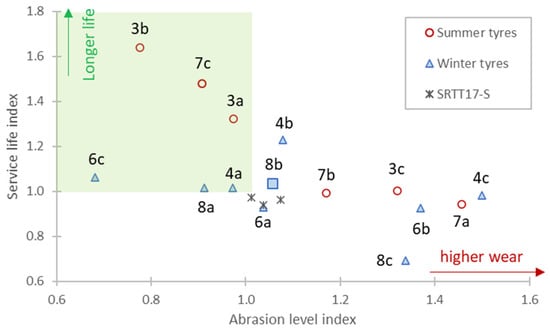
Figure 9.
Correlation between abrasion level index and service life index. Outline circle markers represent summer tyres, while filled triangle markers are 3PMSF winter tyres (the only M+S tyre is square). The shaded green area indicates tyres with better performance than the reference tyres.
The two indices could be combined into a single ‘environmental index’ and be included in European tyre labelling. Tyre Labelling Regulation (EU) 2020/740 [33] includes a provision to add information on abrasion and service life to the label as soon as appropriate methods become available. Here, we demonstrated that the methods are available and both metrics can be quantified. However, how to combine them (i.e., whether weighting factors are needed) requires further discussion. Two tyres, one emitting half and lasting half as long as the other, do not necessarily have the same environmental impact. There is no official cost of the abrasion mass loss. The only estimate is based on costs of plastics to the environment [7]. Similarly, the costs of the tyre production need to be determined and quantified. In addition to life cycle analysis and environmental costs, the preferences of the users need to be considered. All surveys clearly demonstrate that the service life has much higher value to the users than the wear rate [11,12]. The research on environmental tyres is ongoing: for example, with tyres that can be retreaded [34] or made from sustainable, more environmentally friendly, and less toxic materials [35,36,37,38,39].
3.3. Comparisons with Other Studies
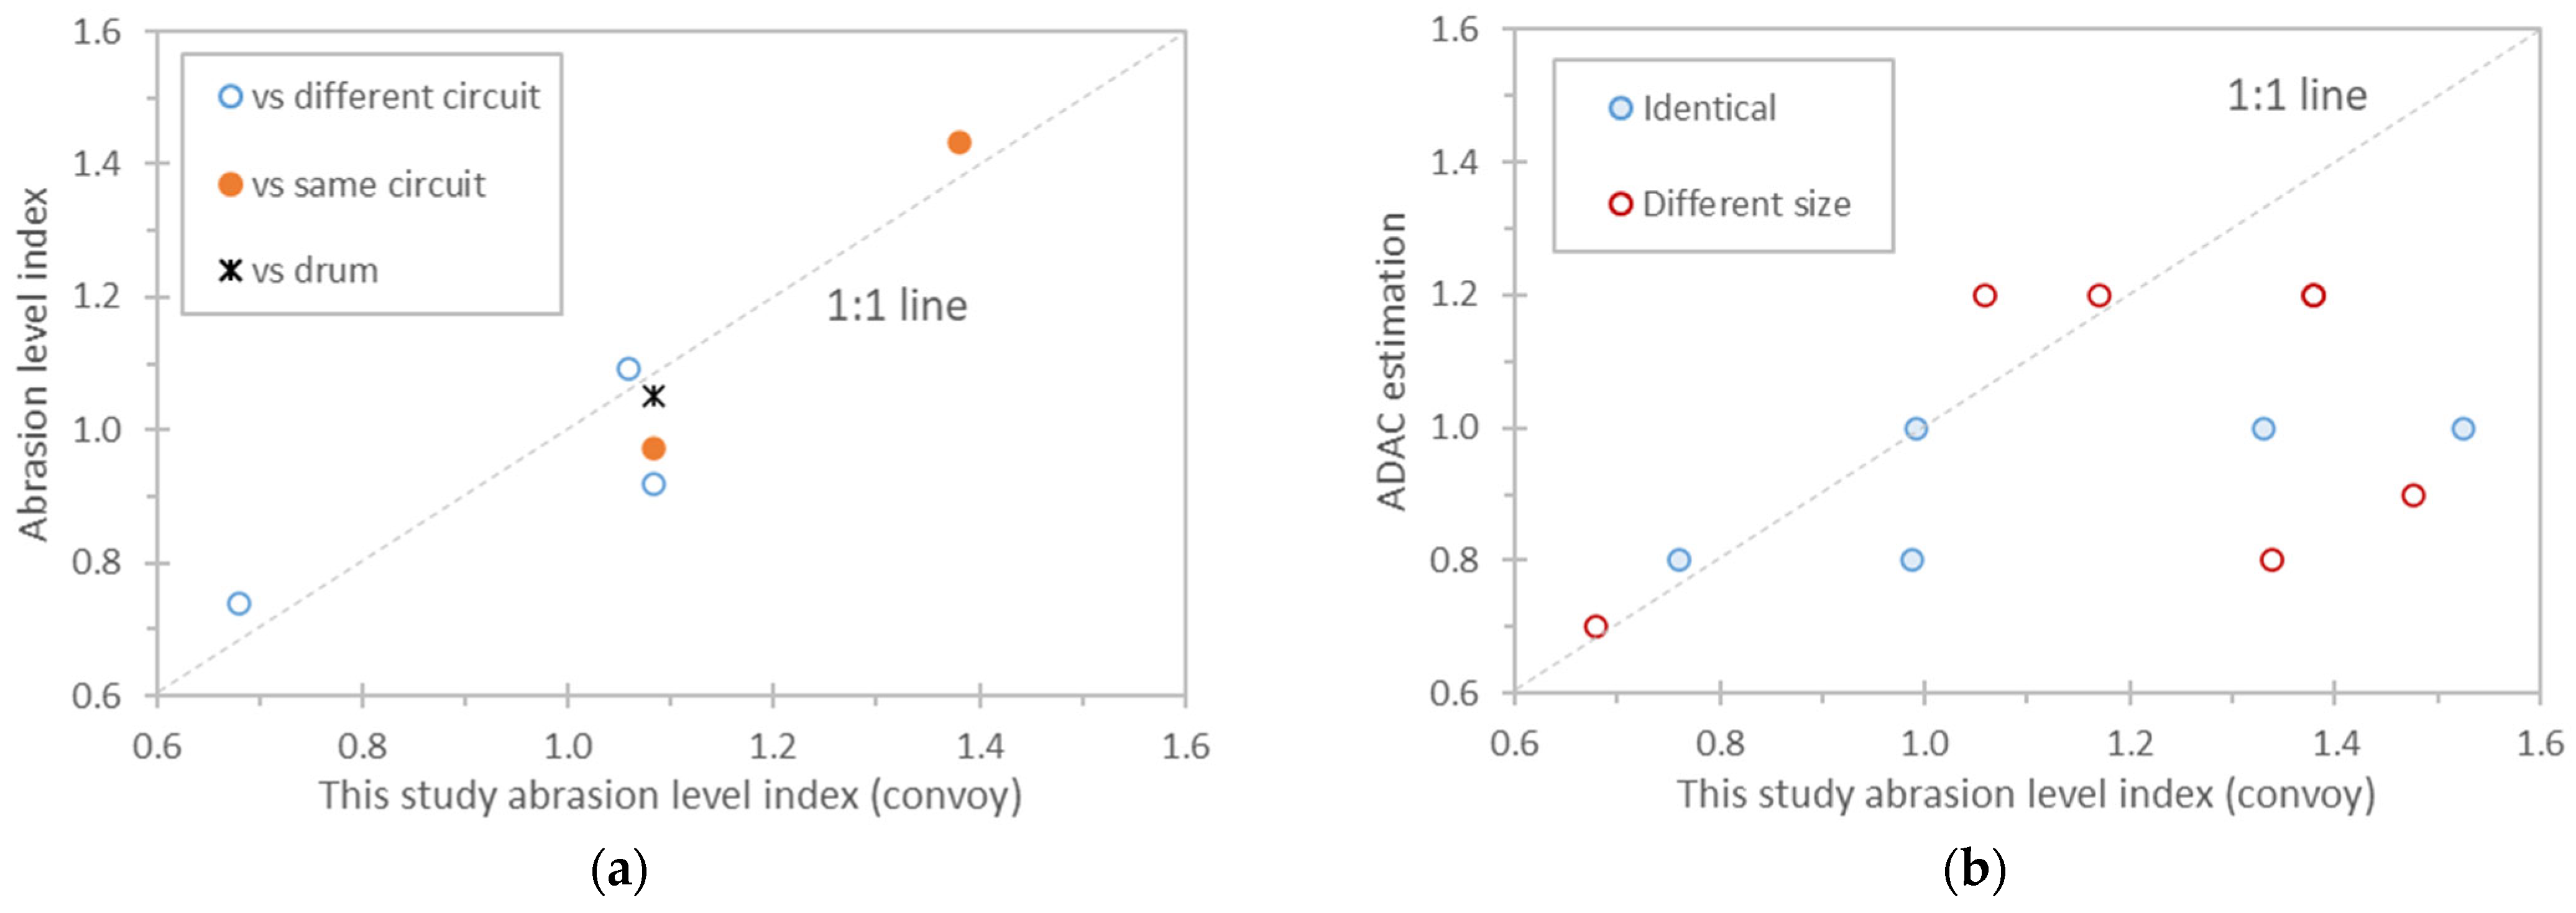
Some tyres from our study were also evaluated by others. Figure 10a compares four winter tyres tested at a different time period at the same circuit (location), at a different circuit in Germany following the UNR 117 Annex 10 requirements, and in a laboratory with the drum method (compliant to UNR 117 Annex 10). The agreement is very good, with differences less than 0.16. It should be highlighted, though, that the agreement is not always good, in particular with the drum method. Recent studies demonstrated larger differences, and the choice of the drum surface and the dispersion material between the drum surface and the tyre can have a big impact [40]. Furthermore, the on-road results might be different when comparing tests carried out at different ambient temperatures due to the different impact of the temperature on the candidate and reference tyres. The work on how to mitigate these issues is ongoing. Our tests were conducted at temperatures close to the mid-range prescribed in the regulation where the ambient temperature impact should be minimal. Figure 10b compares our results with values reported by ADAC. For five tyres, the tyre size was identical; for another six, the size differed (only the model name was the same). In seven of the eleven tyres, results from the two studies differed by less than 0.19, while for four tyres, the differences ranged from 0.33 to 0.58. There is no clear explanation for these high discrepancies. Recently, ADAC showed that the circuit is UNR 117 Annex 10 compliant. However, their past tyre studies were conducted with some differences in the procedure, the most important being that the reference tyres were not those specified in UNR 117 Annex 10, as they were conducted before the preparation and adoption of the regulation [41,42]. The choice of the reference tyre will have an impact on the absolute value of the abrasion index; however, we do not have the evidence to assess this influence. Furthermore, some of the tests were carried out in the laboratory with the drum method. Other differences, such as the ambient conditions (which were not reported) and the fact that not all four reference tyres were fitted to one vehicle, might also have contributed to the differences.
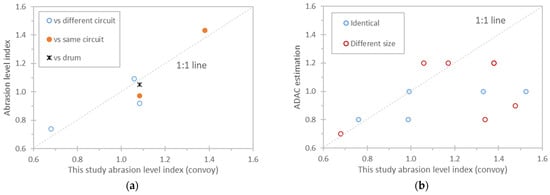
Figure 10.
Comparison of this study’s results with other studies: (a) market assessment and validation (TFTA study); (b) ADAC database with tyres of the same or different size.
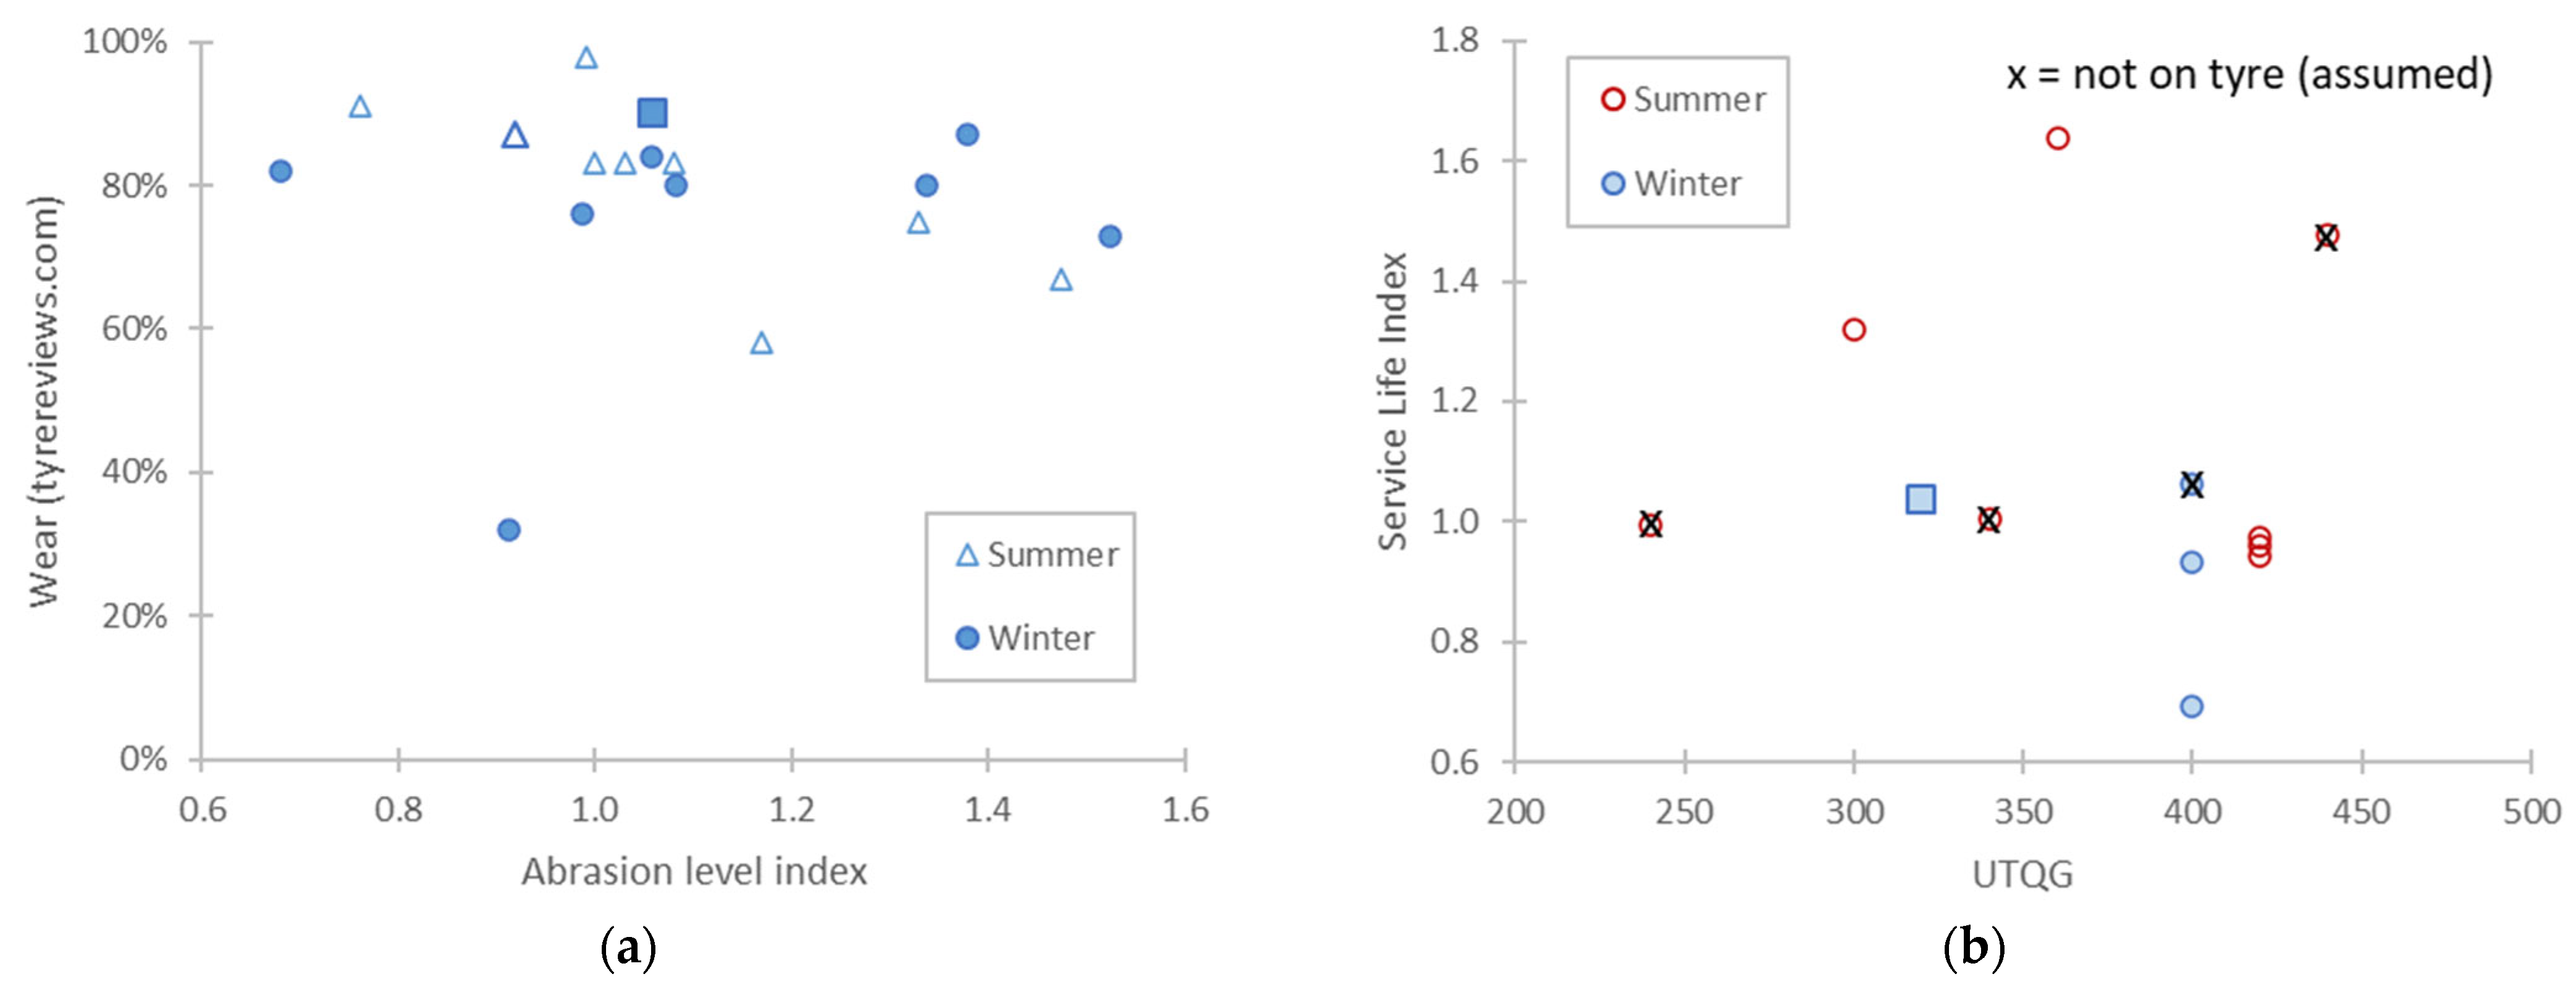
For illustration purposes only, Figure 11a plots the abrasion index and the wear index from “Tyre reviews” [43]. A high wear index (e.g., 100%) indicates a better (more wear-resistant) tyre and should have a low abrasion index. The agreement is quite good, with one exception/outlier (point 1.23–32%). However, the method used to calculate the wear index is unknown (most likely a combination of abrasion, total mileage, and reviewers’ comments), so a deeper explanation of the differences is not possible.
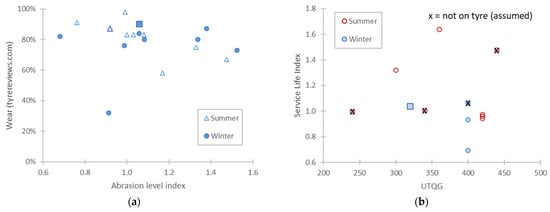
Figure 11.
Comparison of this study’s results with other studies: (a) wear grading [43]. The square symbol indicates only M+S winter tyres; (b) UTQG. x” indicates values that were assumed based on similar tyres but not reported on the tyre.
Figure 11b compares the service life index with the USA UTQG. There is no correlation between the two values, even though both indices indicate how fast the tread depth is reduced compared to a reference tyre. The reasons for the differences need further investigation. One reason is that the UTQG value is not necessarily the measured or maximum one, but one that the tyre manufacturer can guarantee. This means that manufacturers might be declaring values that are not the ones measured but can be reproduced regardless of the test conditions. Additionally, the UTQG value can be determined at the manufacturer’s circuit, and environmental conditions and driving style are not well defined. The service life index is estimated from 0 km, while the UTQG is after the ‘break-in’ distance of 800 miles (1287 km).
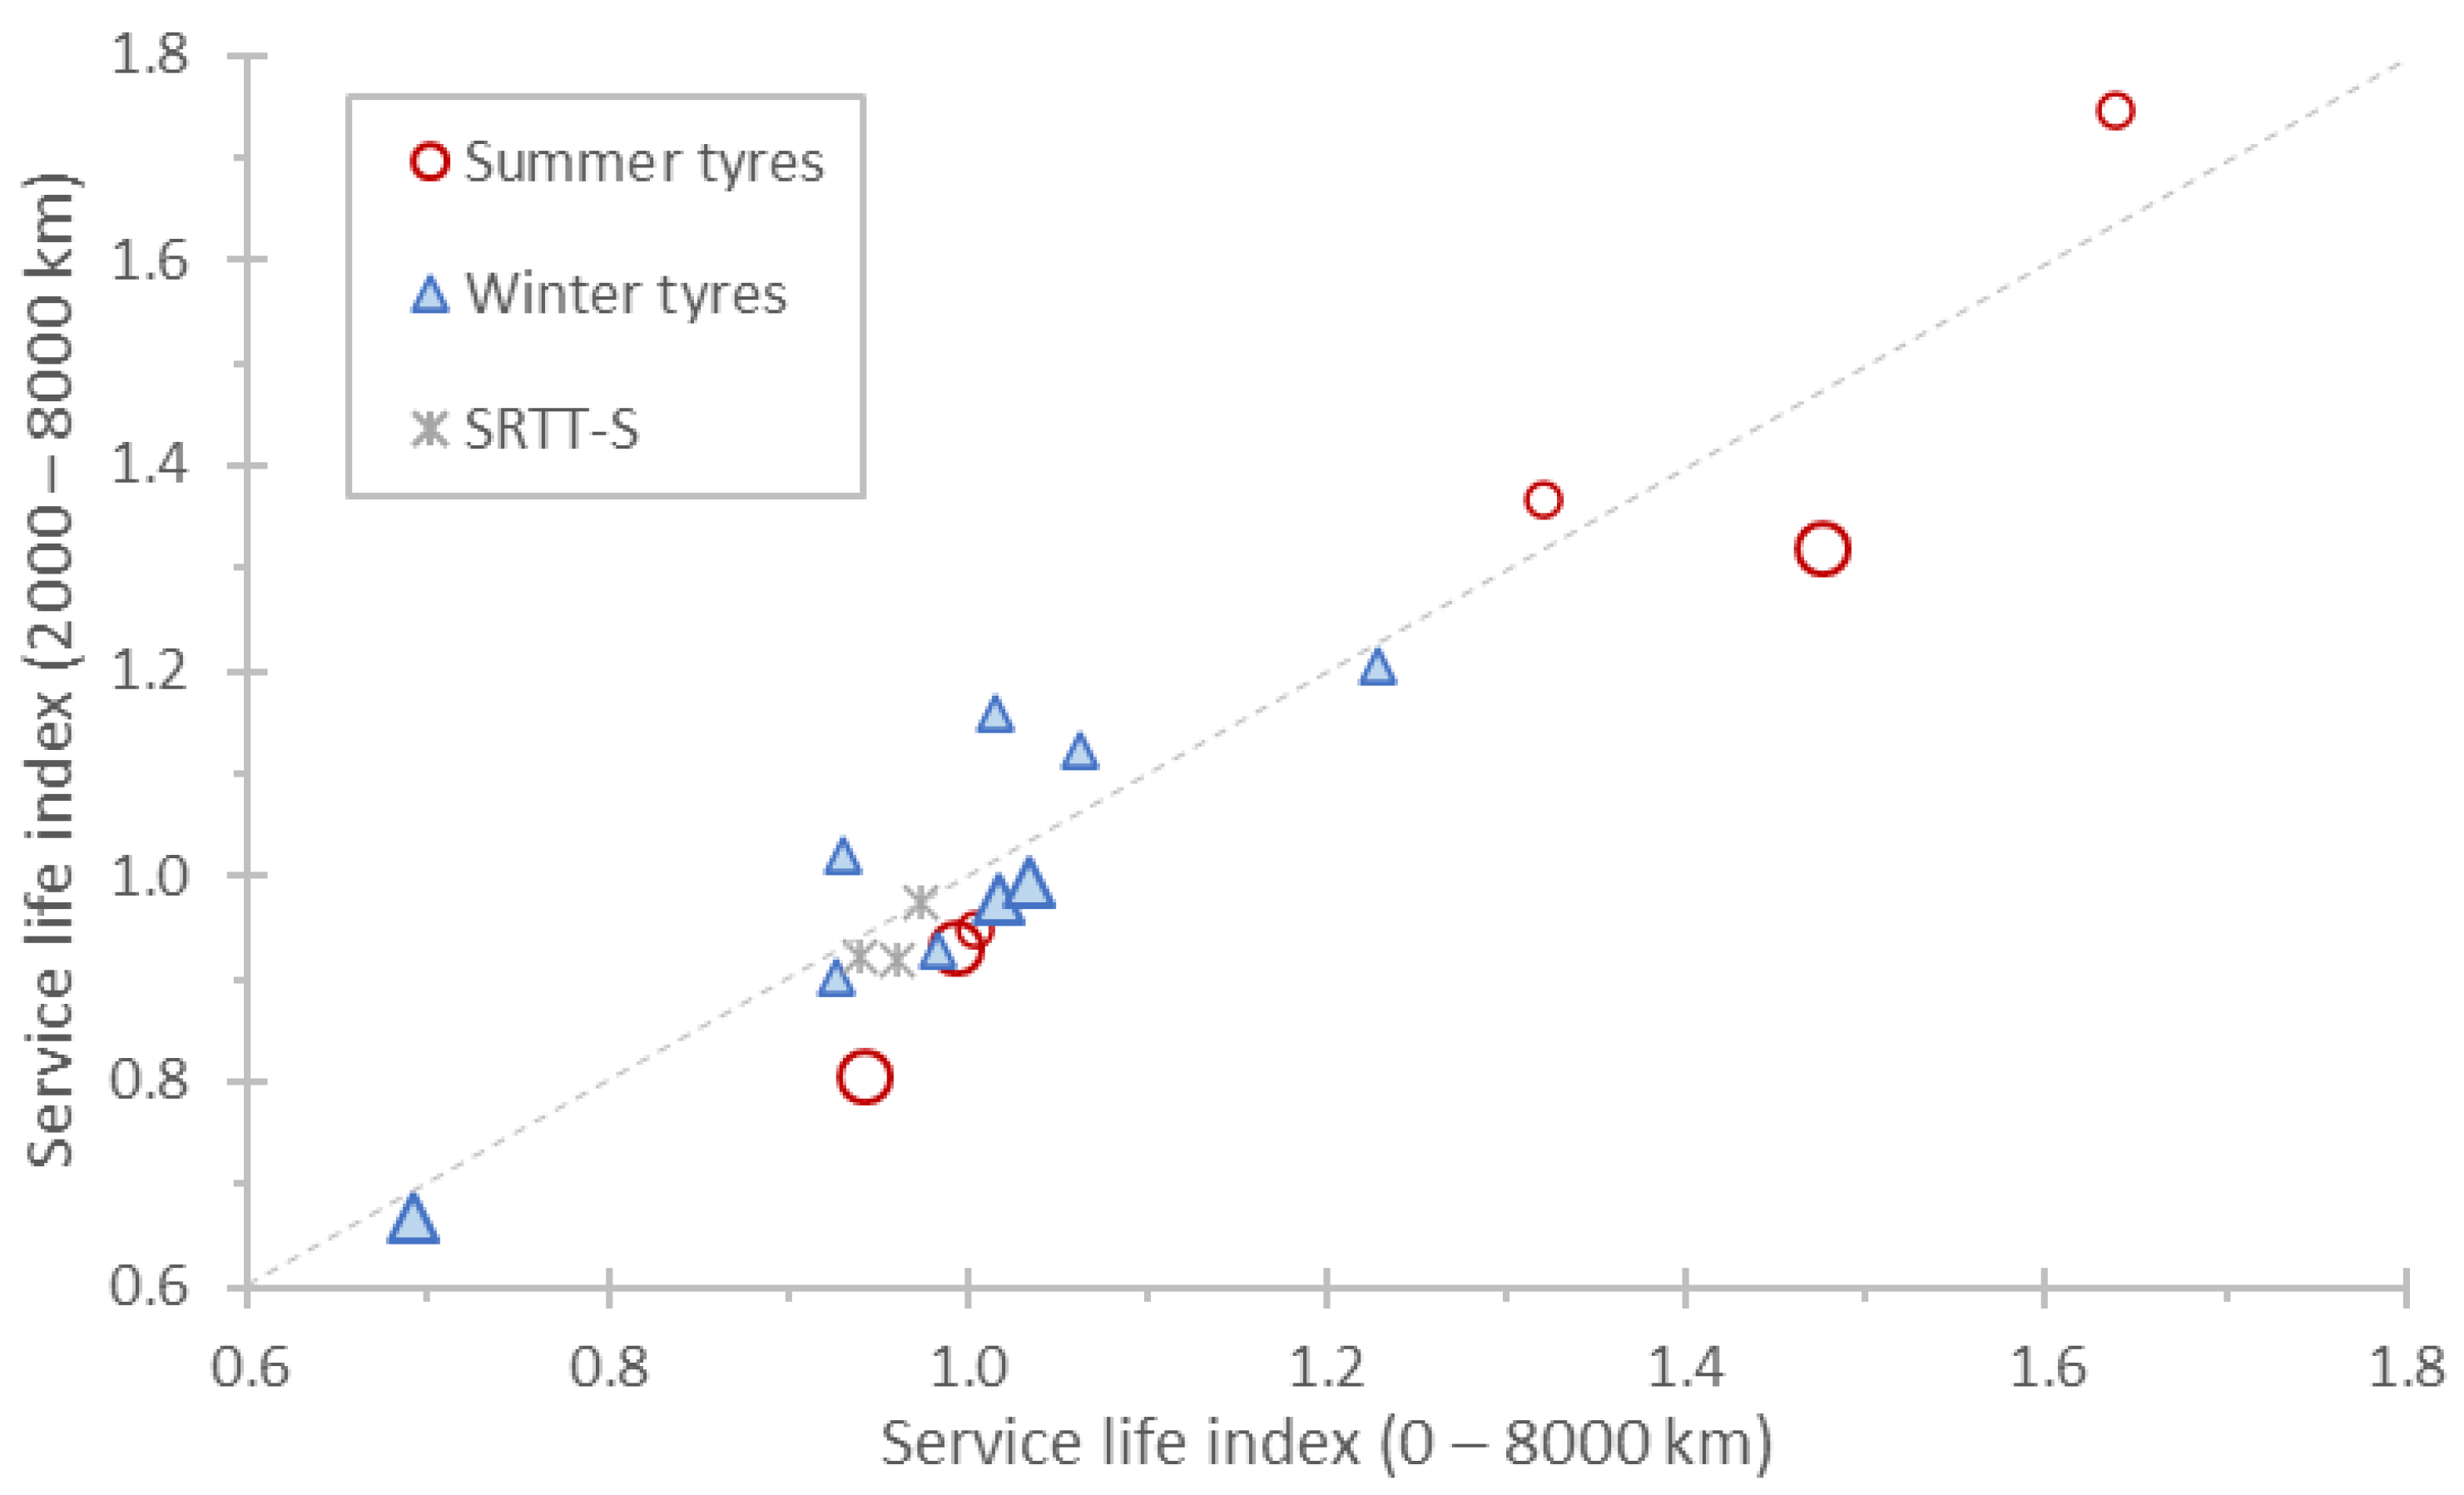
As was discussed in Figure 4, the wear of the tyres is higher at the beginning, and consequently, the wear ratio to the reference tyre for the first thousands of km might be very different. Thus, the absolute service life will be different depending on the start distance, and the service life index might be different as well. For example, the absolute service life of the reference tyres increases from 45,000 km to 52,000 km when changing the start distance from 0 to 2000 km. In order to investigate the impact of including or not the ‘break-in’ period to the service life index, we compared the service life indices applying Equations (5) and (6) with both starting distances, Ds, of 0 km and 2000 km. Figure 12 plots the results. In general, the agreement is good (slope 1.04, R2 = 0.9), indicating that using ratios minimises the impact of influencing parameters. Although there are a few points with higher deviations, it should be remembered that the measurement uncertainty of the tread depth measurement is high, and these differences do not necessarily have to do with the actual tyre behaviour. In the UNR 117 Annex 10 methodology, the wear is measured only at the beginning and at the end of the test. Adding a point at 2000 km would increase significantly the time (and cost) without clear benefits. It should be remembered that the service life index is an index, and the final driven distance with the same tyres depends on many other parameters (roads, driving style, etc.).
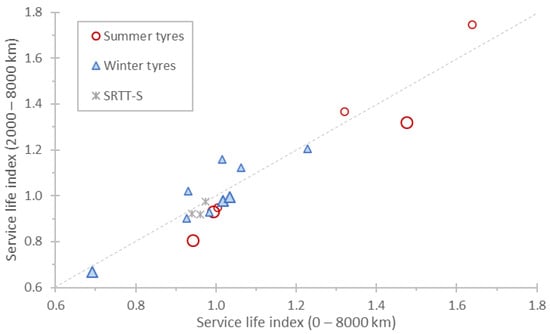
Figure 12.
Comparison of service life indices calculated using start distances of 0 km or 2000 km. The larger symbols indicate the 235/60 R18 tyres.
Notably, the SRTT17-S had a UTQG of 420 (no info for the SRTT17-W). In our previous review, a UTQG of 420 corresponded to 42,000 warranty miles (67,600 km) [14]. In this study we calculate a service life of 45,000 km for the SRTT-S with a start distance of 0 km and 52,000 km with a start distance of 2000 km, which is closer to the UTQG procedure, which includes a ‘break-in’ distance.
4. Conclusions
In this study, we measured the mass loss and tread depth reduction of six summer and nine winter tyres of sizes 195/65 R15, 205/55 R16, and 235/60 R18. The tests were carried out in convoys according to the recently introduced methodology in UN Regulation 117 (Annex 10). The results showed higher wear during the first 4000 km. Wear stabilised after 6000 km. For the front-wheel-drive vehicles of our study, the front-to-rear tyre wear was on average 2.1 for a front-to-rear axle load distribution of 50%/50% and 3.1 for a 56%/44% load distribution.
The abrasion rate of the reference winter tyres had a weak temperature dependence of around −7 mg/km/t for every 10 °C temperature decrease, while the summer reference tyres showed approximately twice that value. A convoy with only summer reference tyres fitted on different vehicles had abrasion rates within 5%. One of the vehicles was pure electric, and its wear was within the conventional ones.
The abrasion rate indices of the candidate tyres varied from 0.6 to 2.0 with an increasing tendency as the load index of the tyres increased. When normalised to tyre load, the abrasion level indices ranged from 0.68 to 1.52, with no evident dependency on tyre load index.
The tread depth was reduced on average 1.47 mm per 10,000 km for the front and 0.64 mm per 10,000 km for the rear summer tyres. The 3PMSF tyres had a tread depth reduction of 1.73 mm for the front tyres and 0.73 mm per 10,000 km for the rear tyres.
We defined a service life index, i.e., mileage potential, using the same methodology for abrasion and just adding tread depth measurements at 0 km and 8000 km. The service life index varied from 0.7 to 1.64. The 3PMSF winter tyres of this study had an average service life index of 0.98, while summer tyres had a service life index of 1.23. The service life and abrasion level indices did not correlate very well, particularly for the winter tyres. The two indices could be combined into a single ‘environmental index’ and be included in European tyre labelling.
While the results of this study were in good agreement with other tests following the same methodology, the correlation with other literature studies for the same tyres was weaker. Nevertheless, the newly introduced methodology in the regulation is expected to better characterise and compare tyres in the future. Further studies should aim to better characterise the uncertainty of the method.
Author Contributions
Conceptualisation, T.G.; formal analysis, B.G.; writing—original draft preparation, B.G.; writing—review and editing, T.G., C.F. and V.F. All authors have read and agreed to the published version of the manuscript.
Funding
This research received no external funding.
Institutional Review Board Statement
Not applicable.
Informed Consent Statement
Not applicable.
Data Availability Statement
The original contributions presented in this study are included in the article. Further enquiries can be directed to the corresponding author.
Acknowledgments
The authors would like to acknowledge Dalia Broggi for her useful insight during the preparation of the document.
Conflicts of Interest
The authors declare no conflicts of interest. Disclaimer: The information and views set out are those of the authors and do not necessarily reflect the official opinion of the European Commission. Neither the European Union institutions and bodies nor any person acting on their behalf may be held responsible for the use which may be made of the information contained therein. Mention of trade or commercial products does not constitute endorsement or recommendation by the authors or the European Commission.
Abbreviations
The following abbreviations are used in this manuscript:
| 3PMSF | Three Peak Mountain and a Snowflake |
| ADAC | General German Automobile Club (Allgemeiner Deutscher Automobil-Club) |
| AL | Abrasion Level |
| ALI | Abrasion Level Index |
| AR | Abrasion Rate |
| ARI | Abrasion Rate Index |
| EC | European Commission |
| EU | European Union |
| GPS | Global Positioning System |
| GRBP | Working Group on Noise and Tyres |
| M+S | Mud and Snow |
| PM | Particulate Matter |
| SUV | Sport Utility Vehicle |
| TFTA | Task Force on Tyre Abrasion |
| SL | Service Life |
| SRTT | Standard Referent Test Tyre |
| UN | United Nations |
| UNECE | United Nations Economic Commission for Europe |
| UNR | United Nations Regulation |
| UTQG | Uniform Tyre Quality Grading |
| WP.29 | World Forum for Harmonization of Vehicle Regulations |
Appendix A
Appendix A.1. Tyre Parameters
Table A1 gives an overview of the tyre parameters. The winter tyres in alphabetical order were Apollo Alnac 4G all seasons, Atlas Green3 4S, Dunlop SP Winter Sport 3D*, Firestone Winterhawk 4, Kumho Solus 4S HA32+, Michelin Crossclimate 2, Michelin Latitude Cross X, Nexen N Blue 4 season 2, and Vredestein Quatrac Pro+. The summer tyres in alphabetical order were Fulda EcoControl HP2, Bridgestone Turanza T005 Driveguard, GY EfficientGrip Performance 2, Nokian PowerProof SUV, Sailun Terramax CVR, and Toyo Proxes Sport SUV.

Table A1.
Overview of tested tyres. Prices in euro, as indicated by the test provider at the time of purchase (year 2024). Rolling resistance (RR), wet grip (WG) and noise according to tyre labelling regulation (EU) 2020/740. Details for the General German Automobile Club (ADAC), tyre reviews (TR), and Uniform Tyre Quality Grading (UTQG) sources are in the text.
| Tyre | Price | RR | WG | Noise | ADAC | TR | UTQG |
|---|---|---|---|---|---|---|---|
| Reference tyres | |||||||
| 5 (SRTT17-S) | - | - | - | - | - | - | 420 |
| - (SRTT17-W) | - | - | - | - | - | - | - |
| Winter tyres | |||||||
| 6a | 56 | C | C | B 70 | (1.2) * | 84% | 400 |
| 6b | 64 | D | B | B 71 | (1.2) * | 87% | - |
| 6c | 83 | C | B | A 69 | (0.7) * | 82% | [400] ** |
| 4a | 84 | D | C | B 72 | 0.8 | 76% | - |
| 4b | 70 | C | B | B 72 | 1.0 | 80% | [240] ** |
| 4c | 58 | C | B | B 72 | - | 73% | - |
| 8a | 125 | C | C | A 68 | - | 32% | - |
| 8b (M+S) | 129 | C | C | B 71 | - | 90% | 320 |
| 8c | 110 | C | B | B 72 | (0.8) * | 80% | 400 |
| Summer tyres | |||||||
| 3a | 57 | C | B | B 70 | 1.0 | 98% | 300 |
| 3b | 70 | B | A | B 69 | 0.8 | 91% | 360 |
| 3c | 92 | C | A | B 72 | 1.0 | 75% | [340] ** |
| 7a | 136 | C | A | B 72 | (0.9) * | 67% | - |
| 7b | 121 | C | A | A 70 | (1.2) * | 58% | [240] ** |
| 7c | 93 | C | D | B 71 | - | 87% | [440] ** |
* () indicate that the value is for a different tyre size; ** [] indicate that the value is for a similarly named tyre.
The following Figure A1, Figure A2 and Figure A3 present the footprints of the tested tyres. They were taken with a loaded car (67% of the tyre load index except 235/60 R18 62%) and the tyre inflation pressure set at 2.5 bar (or 2.9 bar for XL tyres). The car moves forward towards the left side, and the outer side of the tyre is the lower part of the photo (see example in Figure A1). The black areas are the treadwear indicator location, while the black crosses show where the tread depth measurements were taken. Tread depth location 1 is on the lower part of the figure, while 6 is on the upper part. Measurements on the tread wear indicator might have uncertainties when approaching the minimum value, and for this reason the measurements were taken at some distance for better accuracy for this campaign.
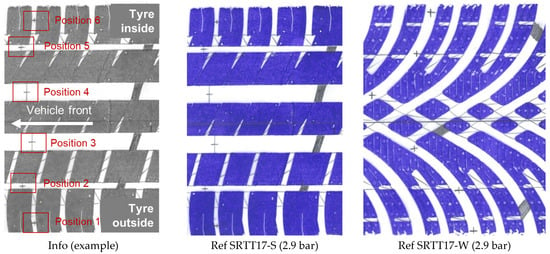
Figure A1.
Example of tread depth measurement positions and reference tyres for summer and winter convoys (225/45 R17).
Figure A1.
Example of tread depth measurement positions and reference tyres for summer and winter convoys (225/45 R17).
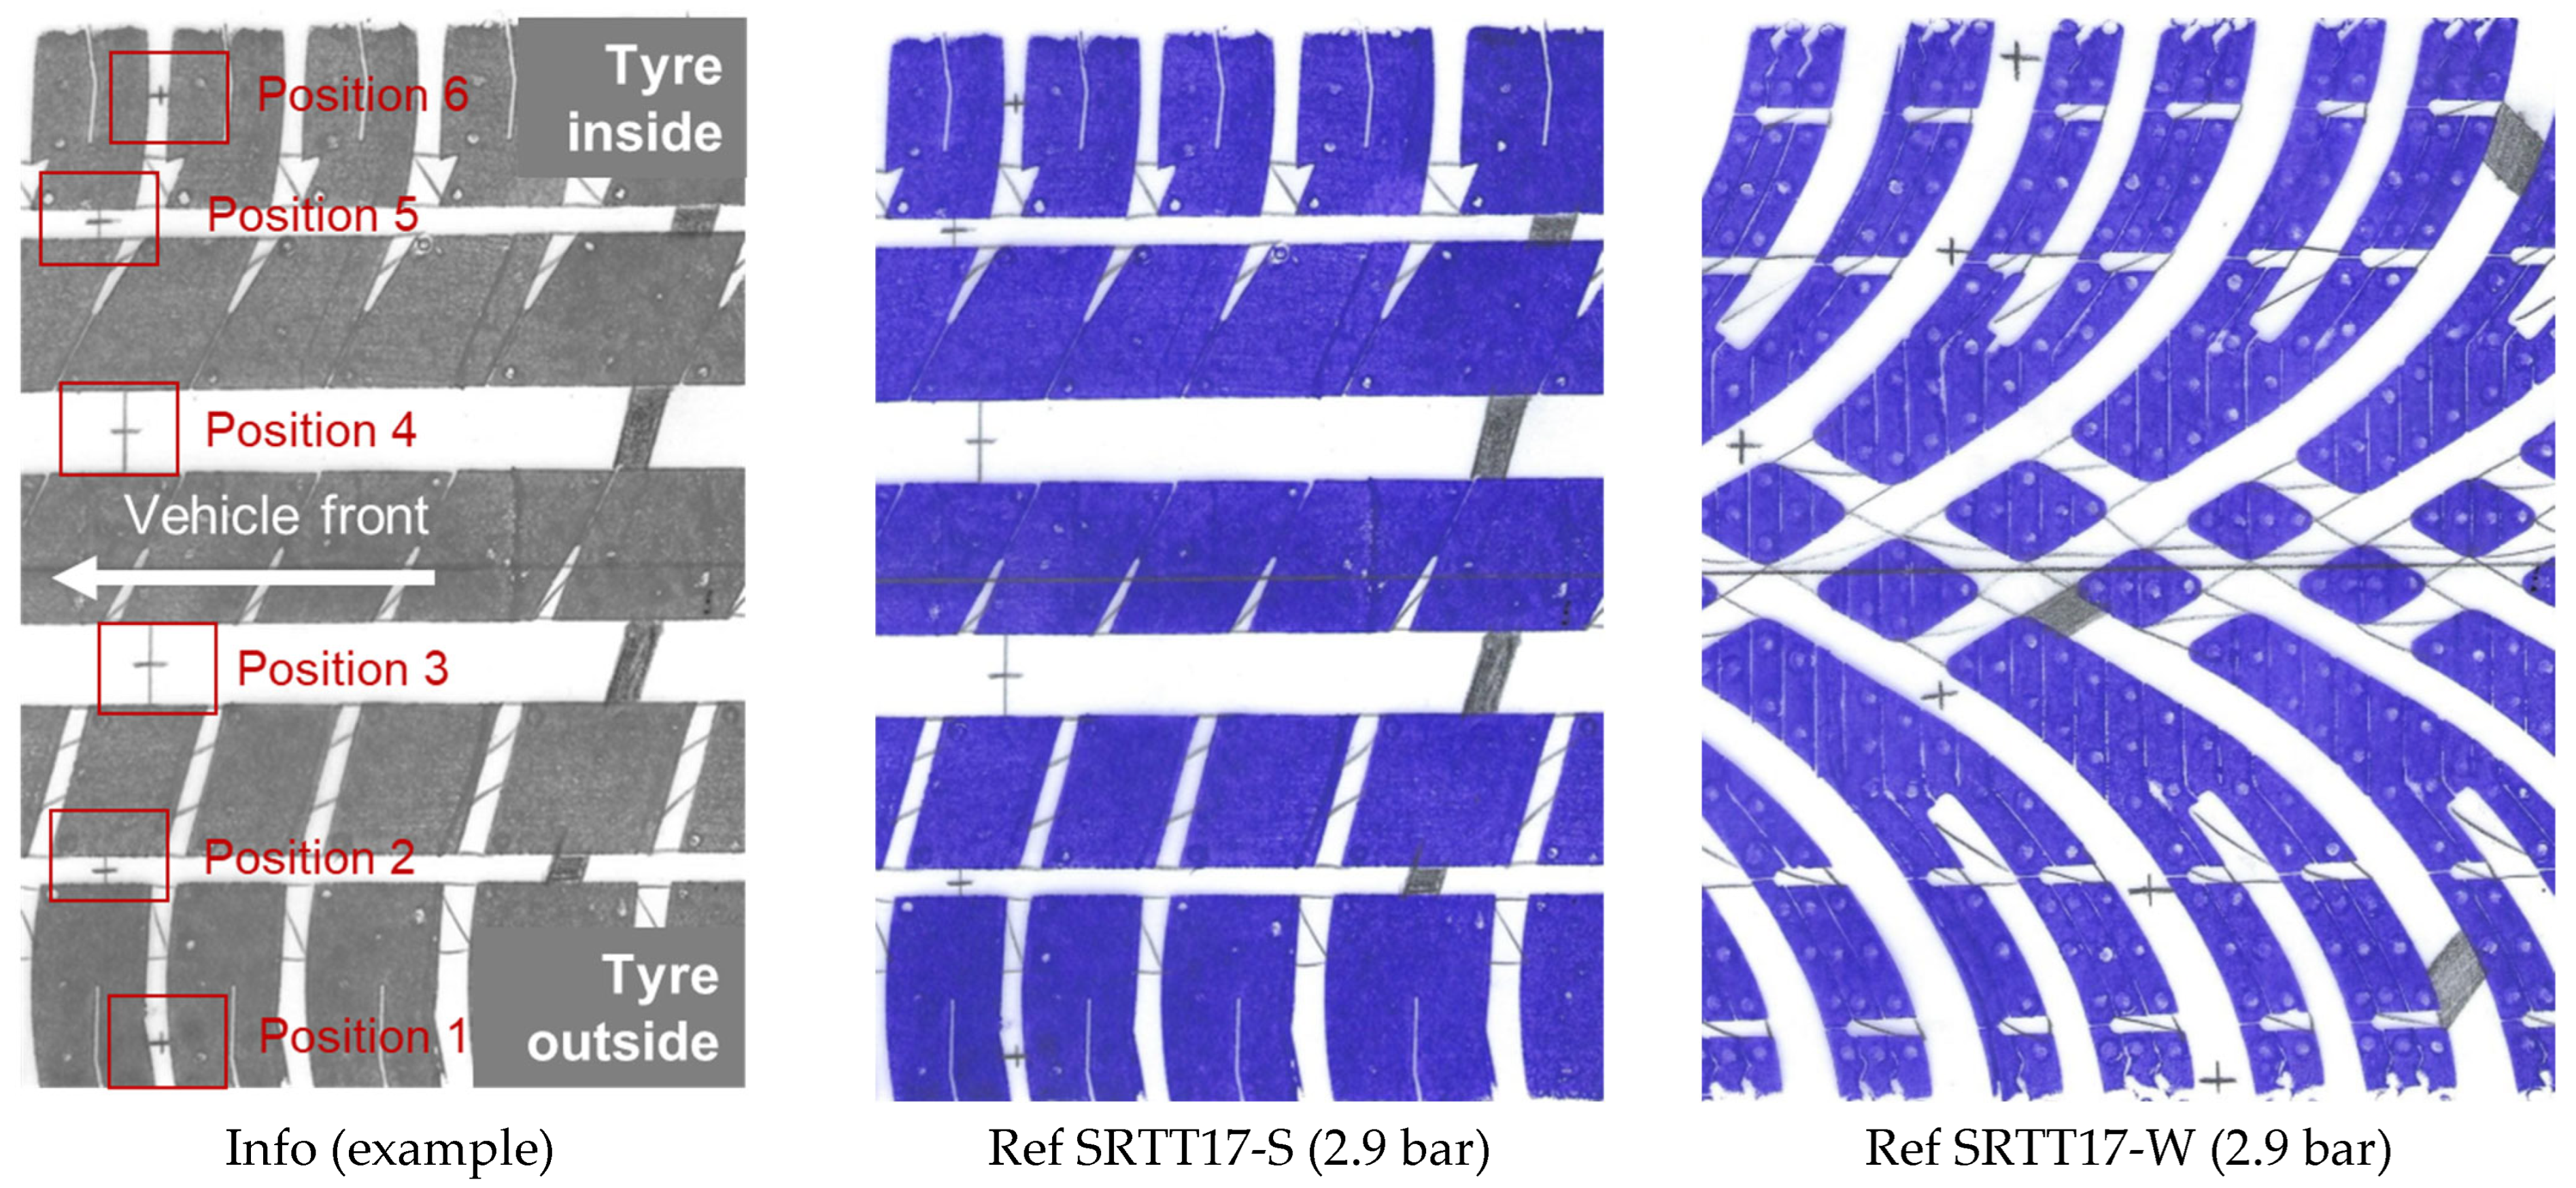
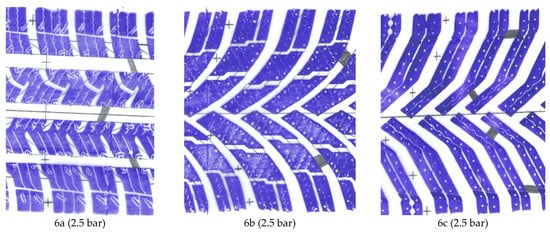
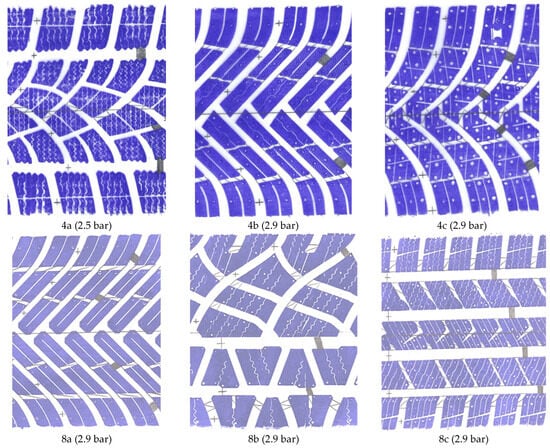
Figure A2.
Winter 3PMSF tyres: 195/65 R15 (convoy 6, upper); 205/55 R16 (convoy 4, middle); 235/60 R18 (SUV convoy 8, lower). Note that tyre 8b is the only M+S tyre.
Figure A2.
Winter 3PMSF tyres: 195/65 R15 (convoy 6, upper); 205/55 R16 (convoy 4, middle); 235/60 R18 (SUV convoy 8, lower). Note that tyre 8b is the only M+S tyre.
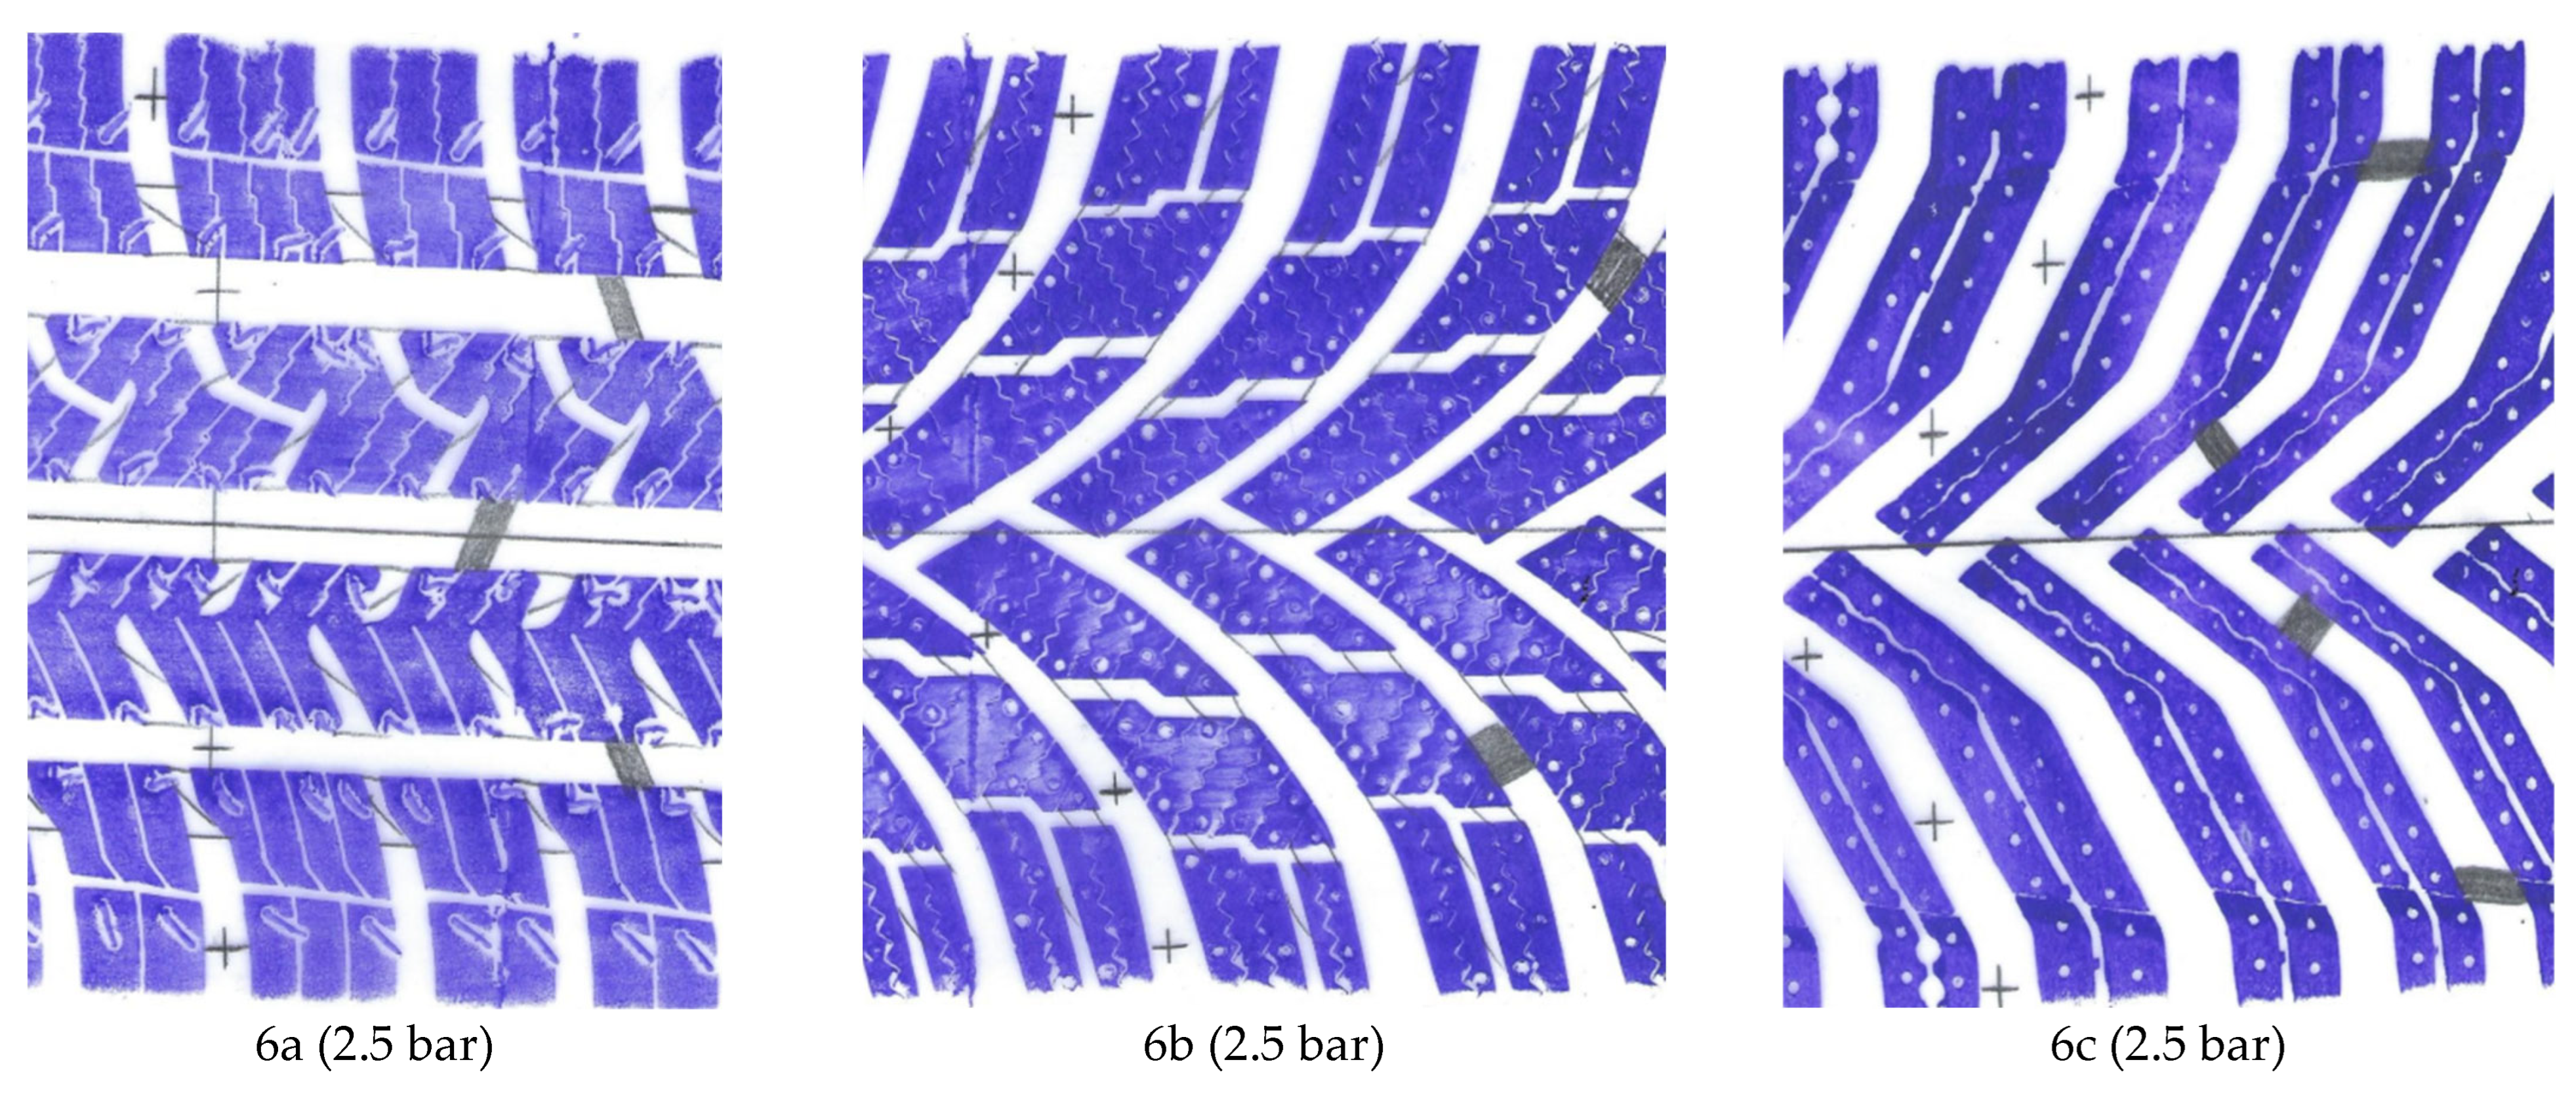
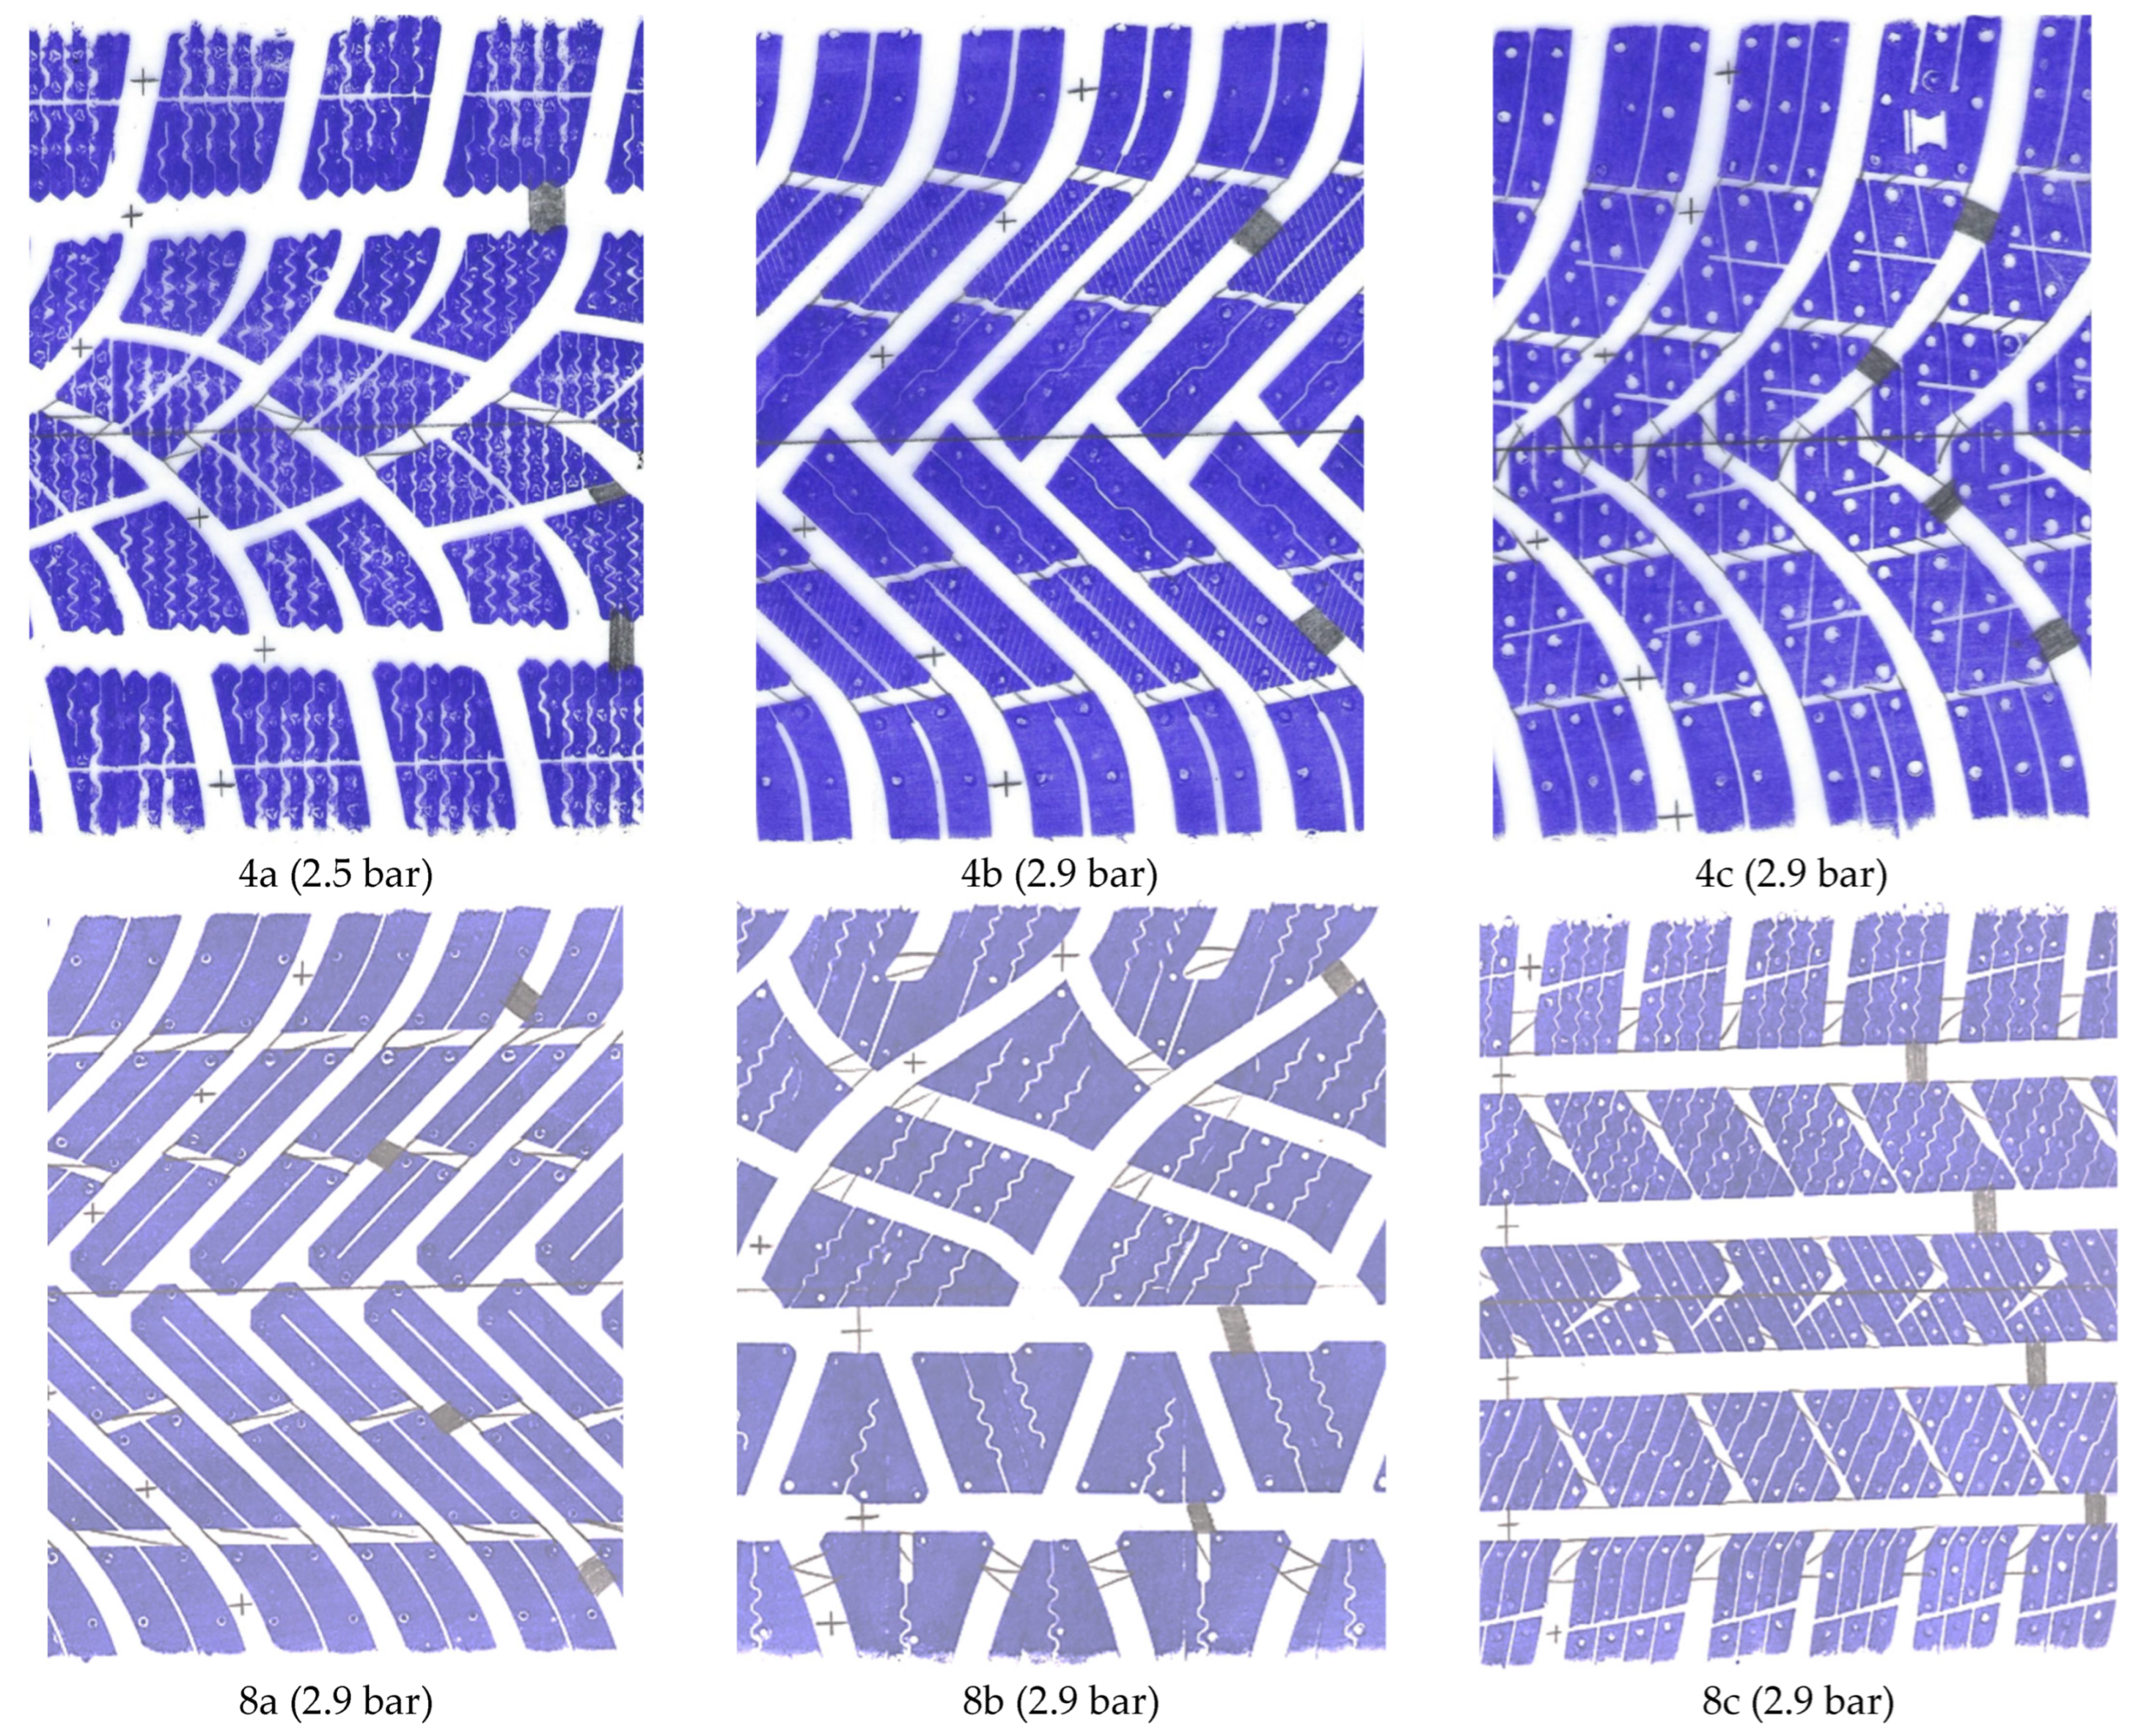
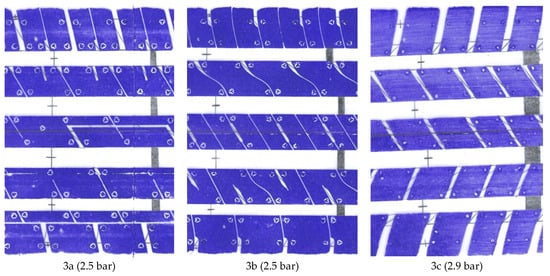
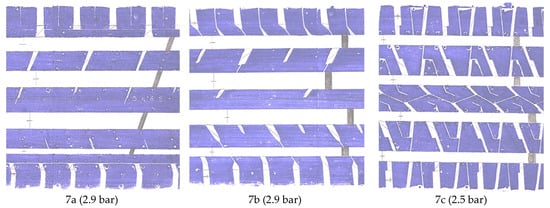
Figure A3.
Summer tyres: 205/55 R16 (convoy 3, upper); 235/60 R18 (SUV convoy 7, lower).
Figure A3.
Summer tyres: 205/55 R16 (convoy 3, upper); 235/60 R18 (SUV convoy 7, lower).
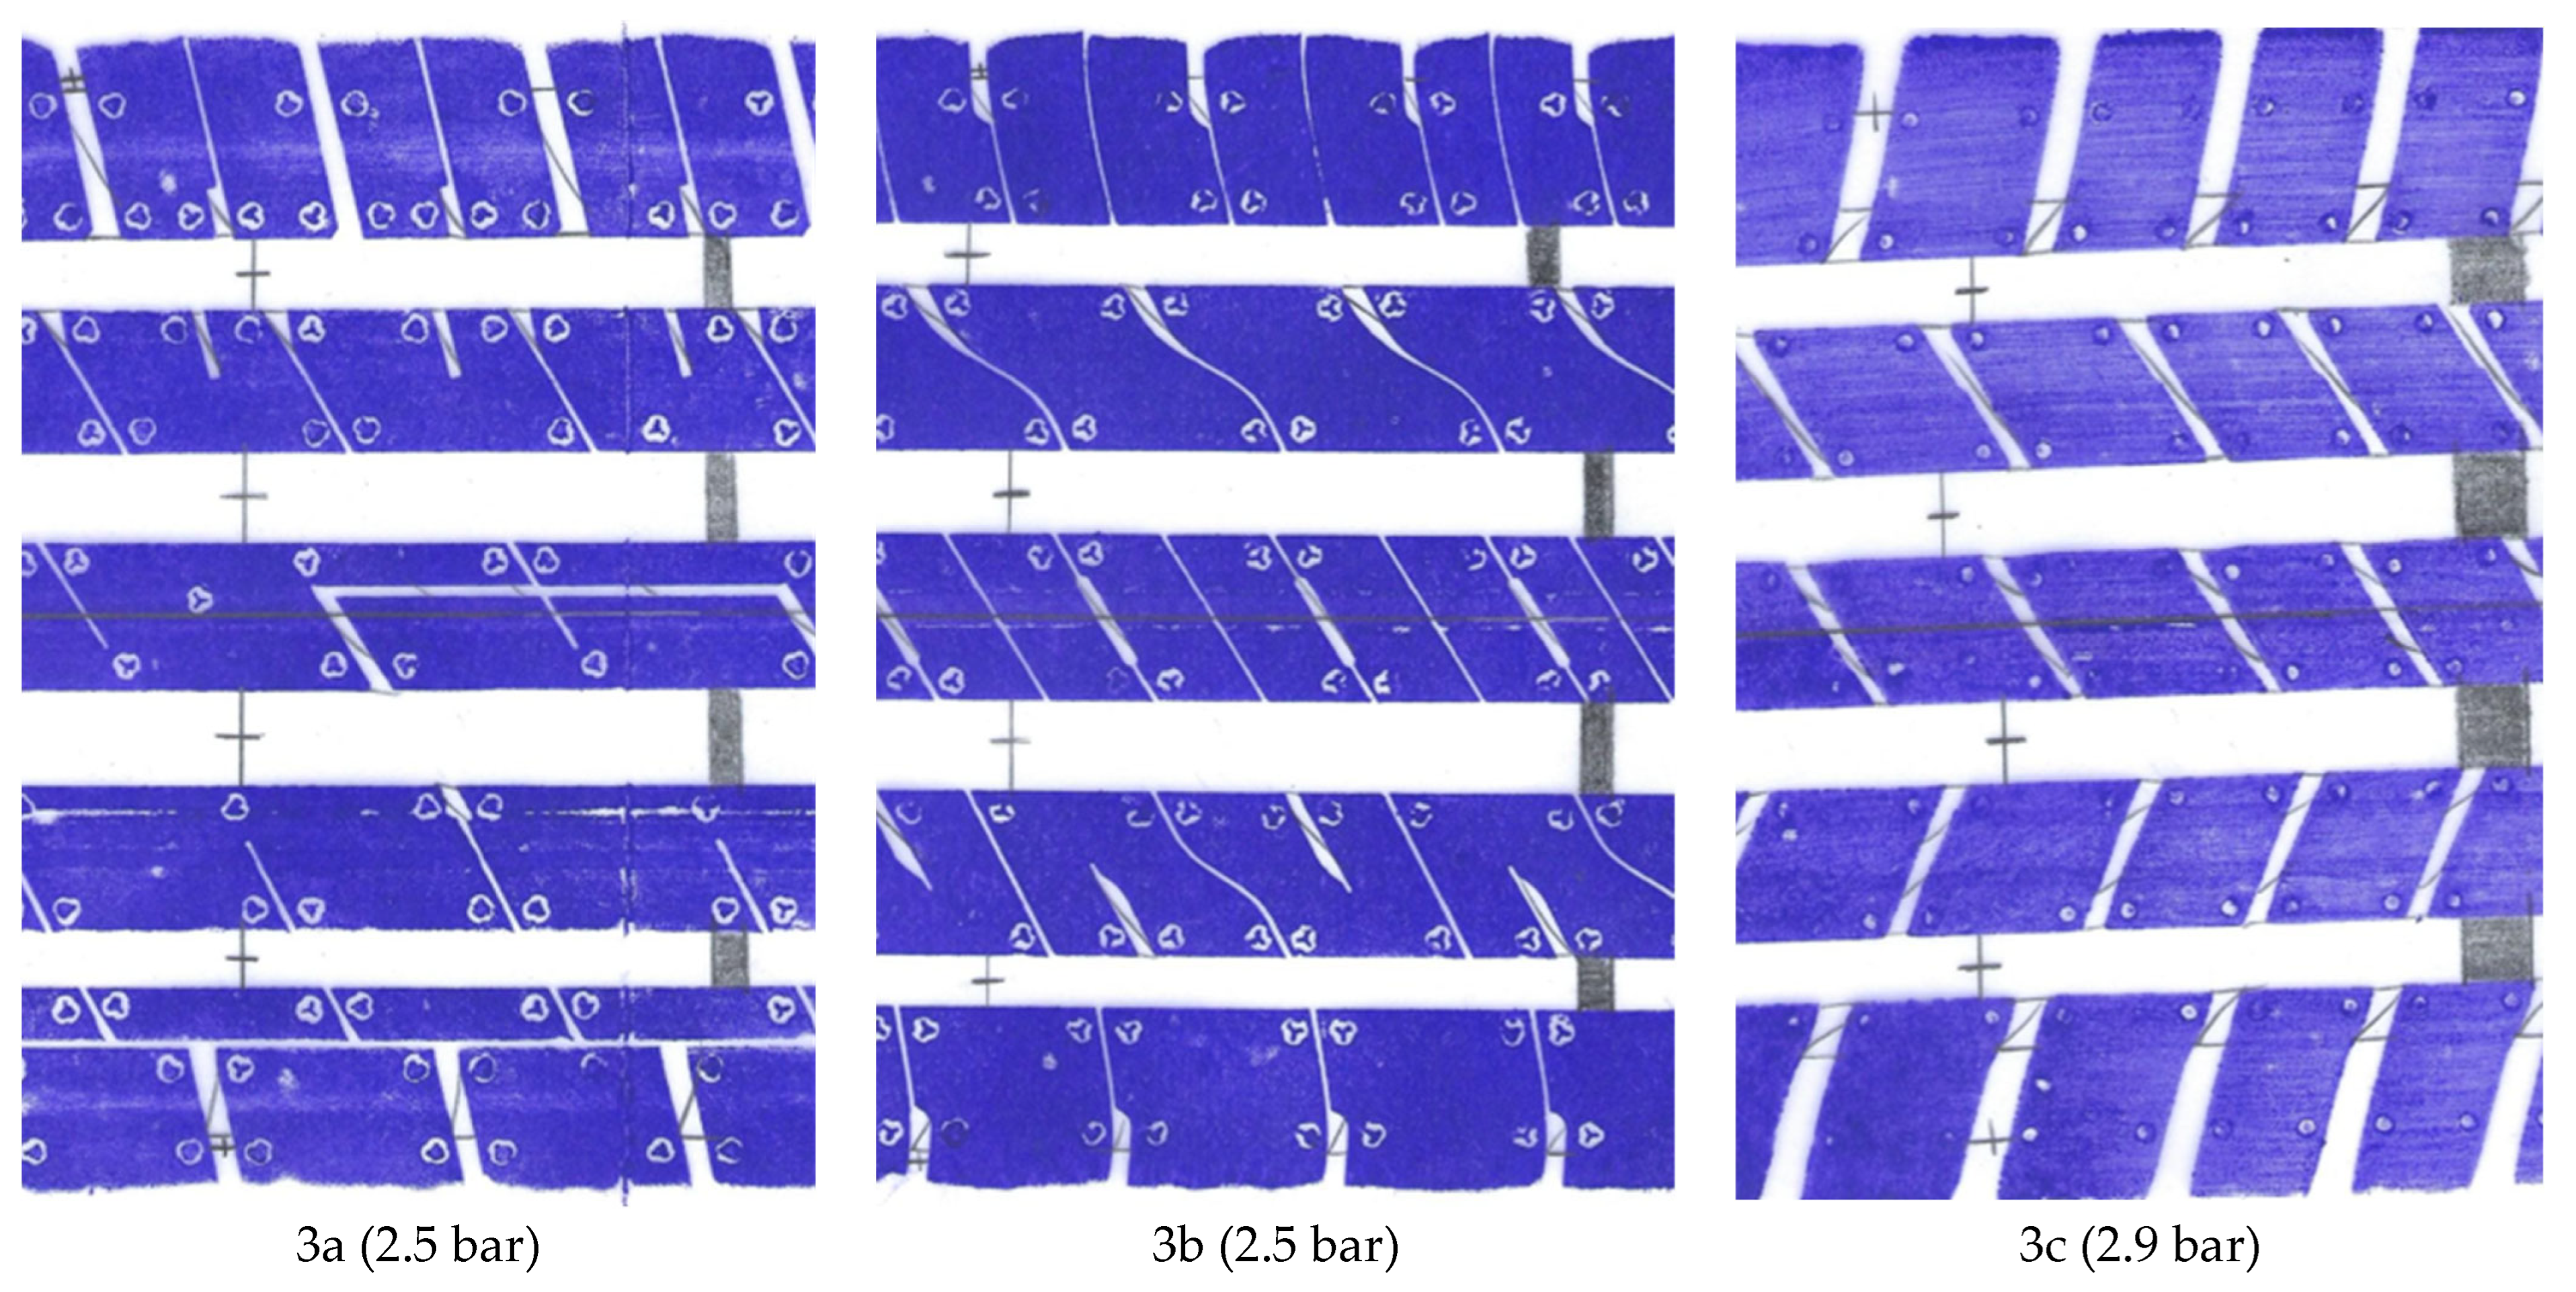
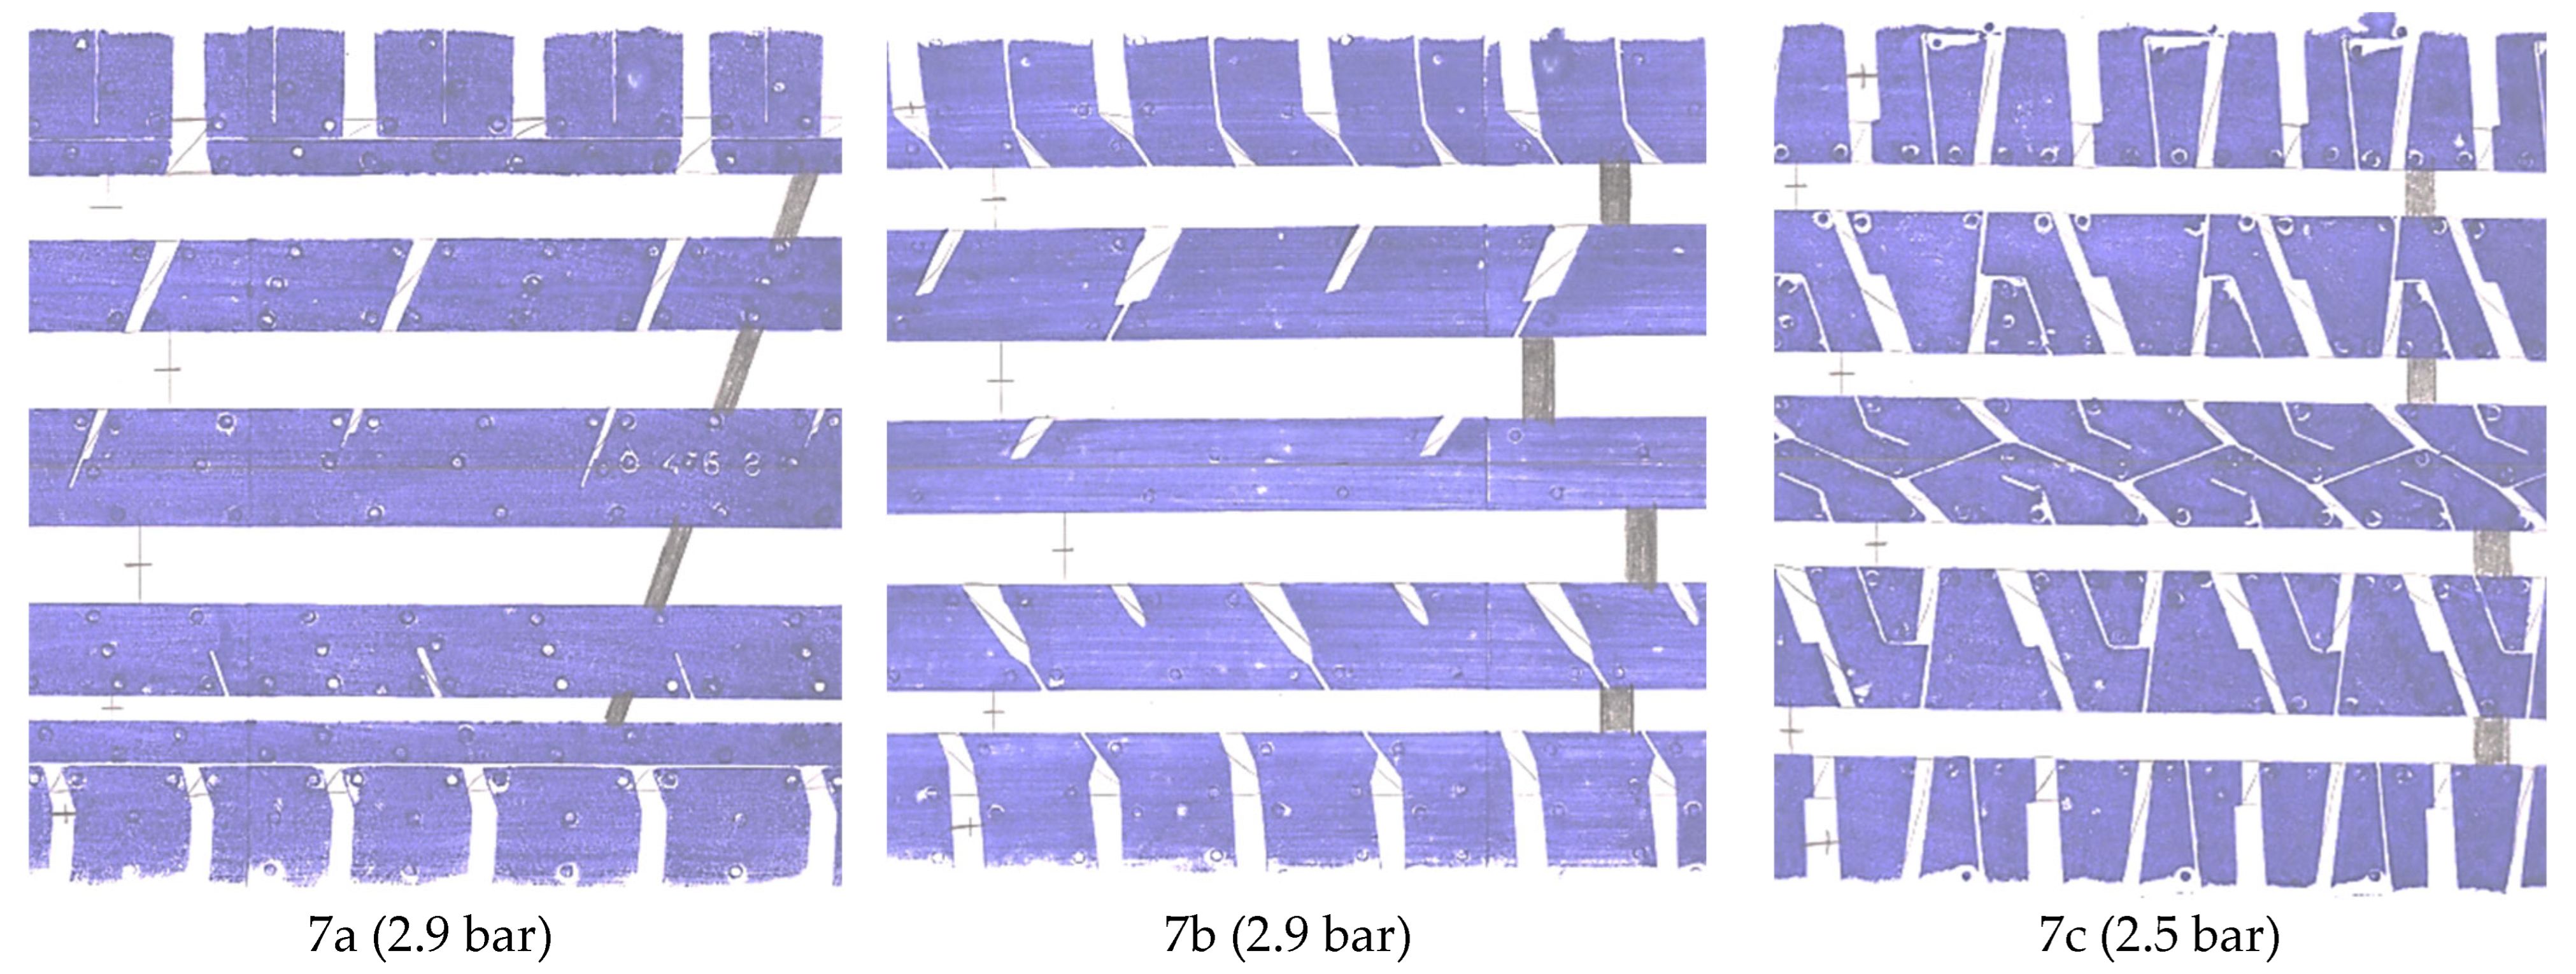
Figure A4 plots the initial tread depth of the tyres of this study at the six measurement locations across the tyre width (see example in Figure A1). In general, the depth is larger in the middle grooves, with an average of 7.5 mm for summer tyres and 7.7 for winter tyres. The differences of shoulder and middle grooves are 1.8 (0.9–2.6) mm for summer tyres and 1.0 (0.5–1.5) for 3PMSF tyres. The only M+S tyre had differences in the height of the groove of around 0.9 mm.
Figure A5 plots the tread depth loss of the front wheels after 8000 km of driving. The average reduction was 1.2 mm (0.75–1.59) for the summer tyres and 1.4 (0.93–1.80) for 3PMSF tyres. The only M+S tyre had a tread loss of 1.36 mm.

Figure A4.
Initial tread depth: (a) summer tyres; (b) winter tyres. Numbers and letters in the graph give the tyre identification code. Note that tyre 8b is only M+S.
Figure A4.
Initial tread depth: (a) summer tyres; (b) winter tyres. Numbers and letters in the graph give the tyre identification code. Note that tyre 8b is only M+S.


Figure A5.
Tread depth reduction after 8000 km (front tyre): (a) summer tyres; (b) winter tyres. Numbers and letters in the graph give the tyre identification code. Note that tyre 8b is only M+S.
Figure A5.
Tread depth reduction after 8000 km (front tyre): (a) summer tyres; (b) winter tyres. Numbers and letters in the graph give the tyre identification code. Note that tyre 8b is only M+S.

Appendix A.2. Contact Width and Void Surface from Tyre Footprints
In order to support the interpretation of the wear data collected during the convoy tests, an image-based analysis was conducted to quantify the contact width and void surface area from the tyre footprints. We applied digital image processing using Python and the OpenCV library version 4.12 to the footprint images acquired under standardised pressure (2.5 or 2.9 bar) and vehicle loading conditions (62% or 67% of tyre load index).
First, the image of the tyre footprint was read and converted into a greyscale format. To distinguish between the contact area (black) and the voids (white), Otsu’s automatic thresholding method was applied. This algorithm analysed the histogram of greyscale values in the image to find a threshold that minimises the intra-class variance, effectively separating the darker and lighter regions in a statistically optimal way. As a result, the image was converted into a binary map where black pixels represent the regions of the tyre that were in contact with the surface, and white pixels represent areas with no contact. A vertical line was drawn across the footprint at a specified horizontal position to quantify the distribution of contact along the tyre width.
The image was scaled according to the real width of the footprint (in mm) to translate pixel counts into physical measurements. Each pixel was assumed to represent a square with an area computed from the image resolution and real width. The total number of white (empty) and black (contact) pixels were counted, allowing the computation of the percentage of void surface in the analysed region.
Furthermore, the contact length along the vertical line was estimated by counting the number of black pixels intercepted by that line. This provided an estimate of the actual line of contact between the tyre and the road.
Table A2 summarises the results. The void surface was on average 37.5% for winter tyres and 34.8% for summer tyres. We measured a contact width of 73.4% of the design section width for winter tyres and 75% for summer tyres. Theoretically estimated values were 77.9% and 79.2% for winter and summer tyres, respectively [44].

Table A2.
Void surface (%), measured contact width (Cm), and theoretical (Cth) (as % of the design section width). E, F, and R give the mass loss per mm of tread depth loss theoretically estimated and as measured for front and rear tyres, respectively.
Table A2.
Void surface (%), measured contact width (Cm), and theoretical (Cth) (as % of the design section width). E, F, and R give the mass loss per mm of tread depth loss theoretically estimated and as measured for front and rear tyres, respectively.
| Tyre | Cth 1 | Cm | Void | E | F | R |
|---|---|---|---|---|---|---|
| % | % | % | g/mm | g/mm | g/mm | |
| Reference tyres | ||||||
| 5 (SRTT17-S) | 85.5 | 76.3 | 30.1 | 307 | 282 | 227 |
| - (SRTT17-W) | 85.5 | 71.8 | 40.1 | 265 | 215 | 140 |
| Winter tyres | ||||||
| 6a | 75.4 | 74.7 | 41.8 | 196 | 210 | 155 |
| 6b | 75.4 | 71.7 | 37.3 | 211 | 214 | 184 |
| 6c | 75.4 | 68.3 | 42.8 | 192 | 191 | 132 |
| 4a | 80.4 | 77.8 | 40.1 | 225 | 192 | 115 |
| 4b | 80.4 | 77.8 | 34.8 | 244 | 238 | 184 |
| 4c | 80.4 | 73.9 | 34.6 | 245 | 250 | 165 |
| 8a | 77.9 | 73.6 | 32.4 | 330 | 300 | 264 |
| 8b (M+S) | 77.9 | 70.2 | 37.9 | 303 | 282 | 244 |
| 8c | 77.9 | 72.8 | 35.6 | 314 | 282 | 238 |
| Summer tyres | ||||||
| 3a | 80.4 | 74.2 | 35.2 | 243 | 261 | 204 |
| 3b | 80.4 | 77.2 | 30.7 | 260 | 259 | 185 |
| 3c | 80.4 | 77.2 | 34.8 | 244 | 266 | 240 |
| 7a | 77.9 | 77.4 | 34.5 | 319 | 359 | 380 |
| 7b | 77.9 | 71.9 | 37.5 | 305 | 329 | 328 |
| 7c | 77.9 | 72.3 | 36.2 | 311 | 305 | 278 |
1 The theoretical value was calculated as in ref. [14,44].
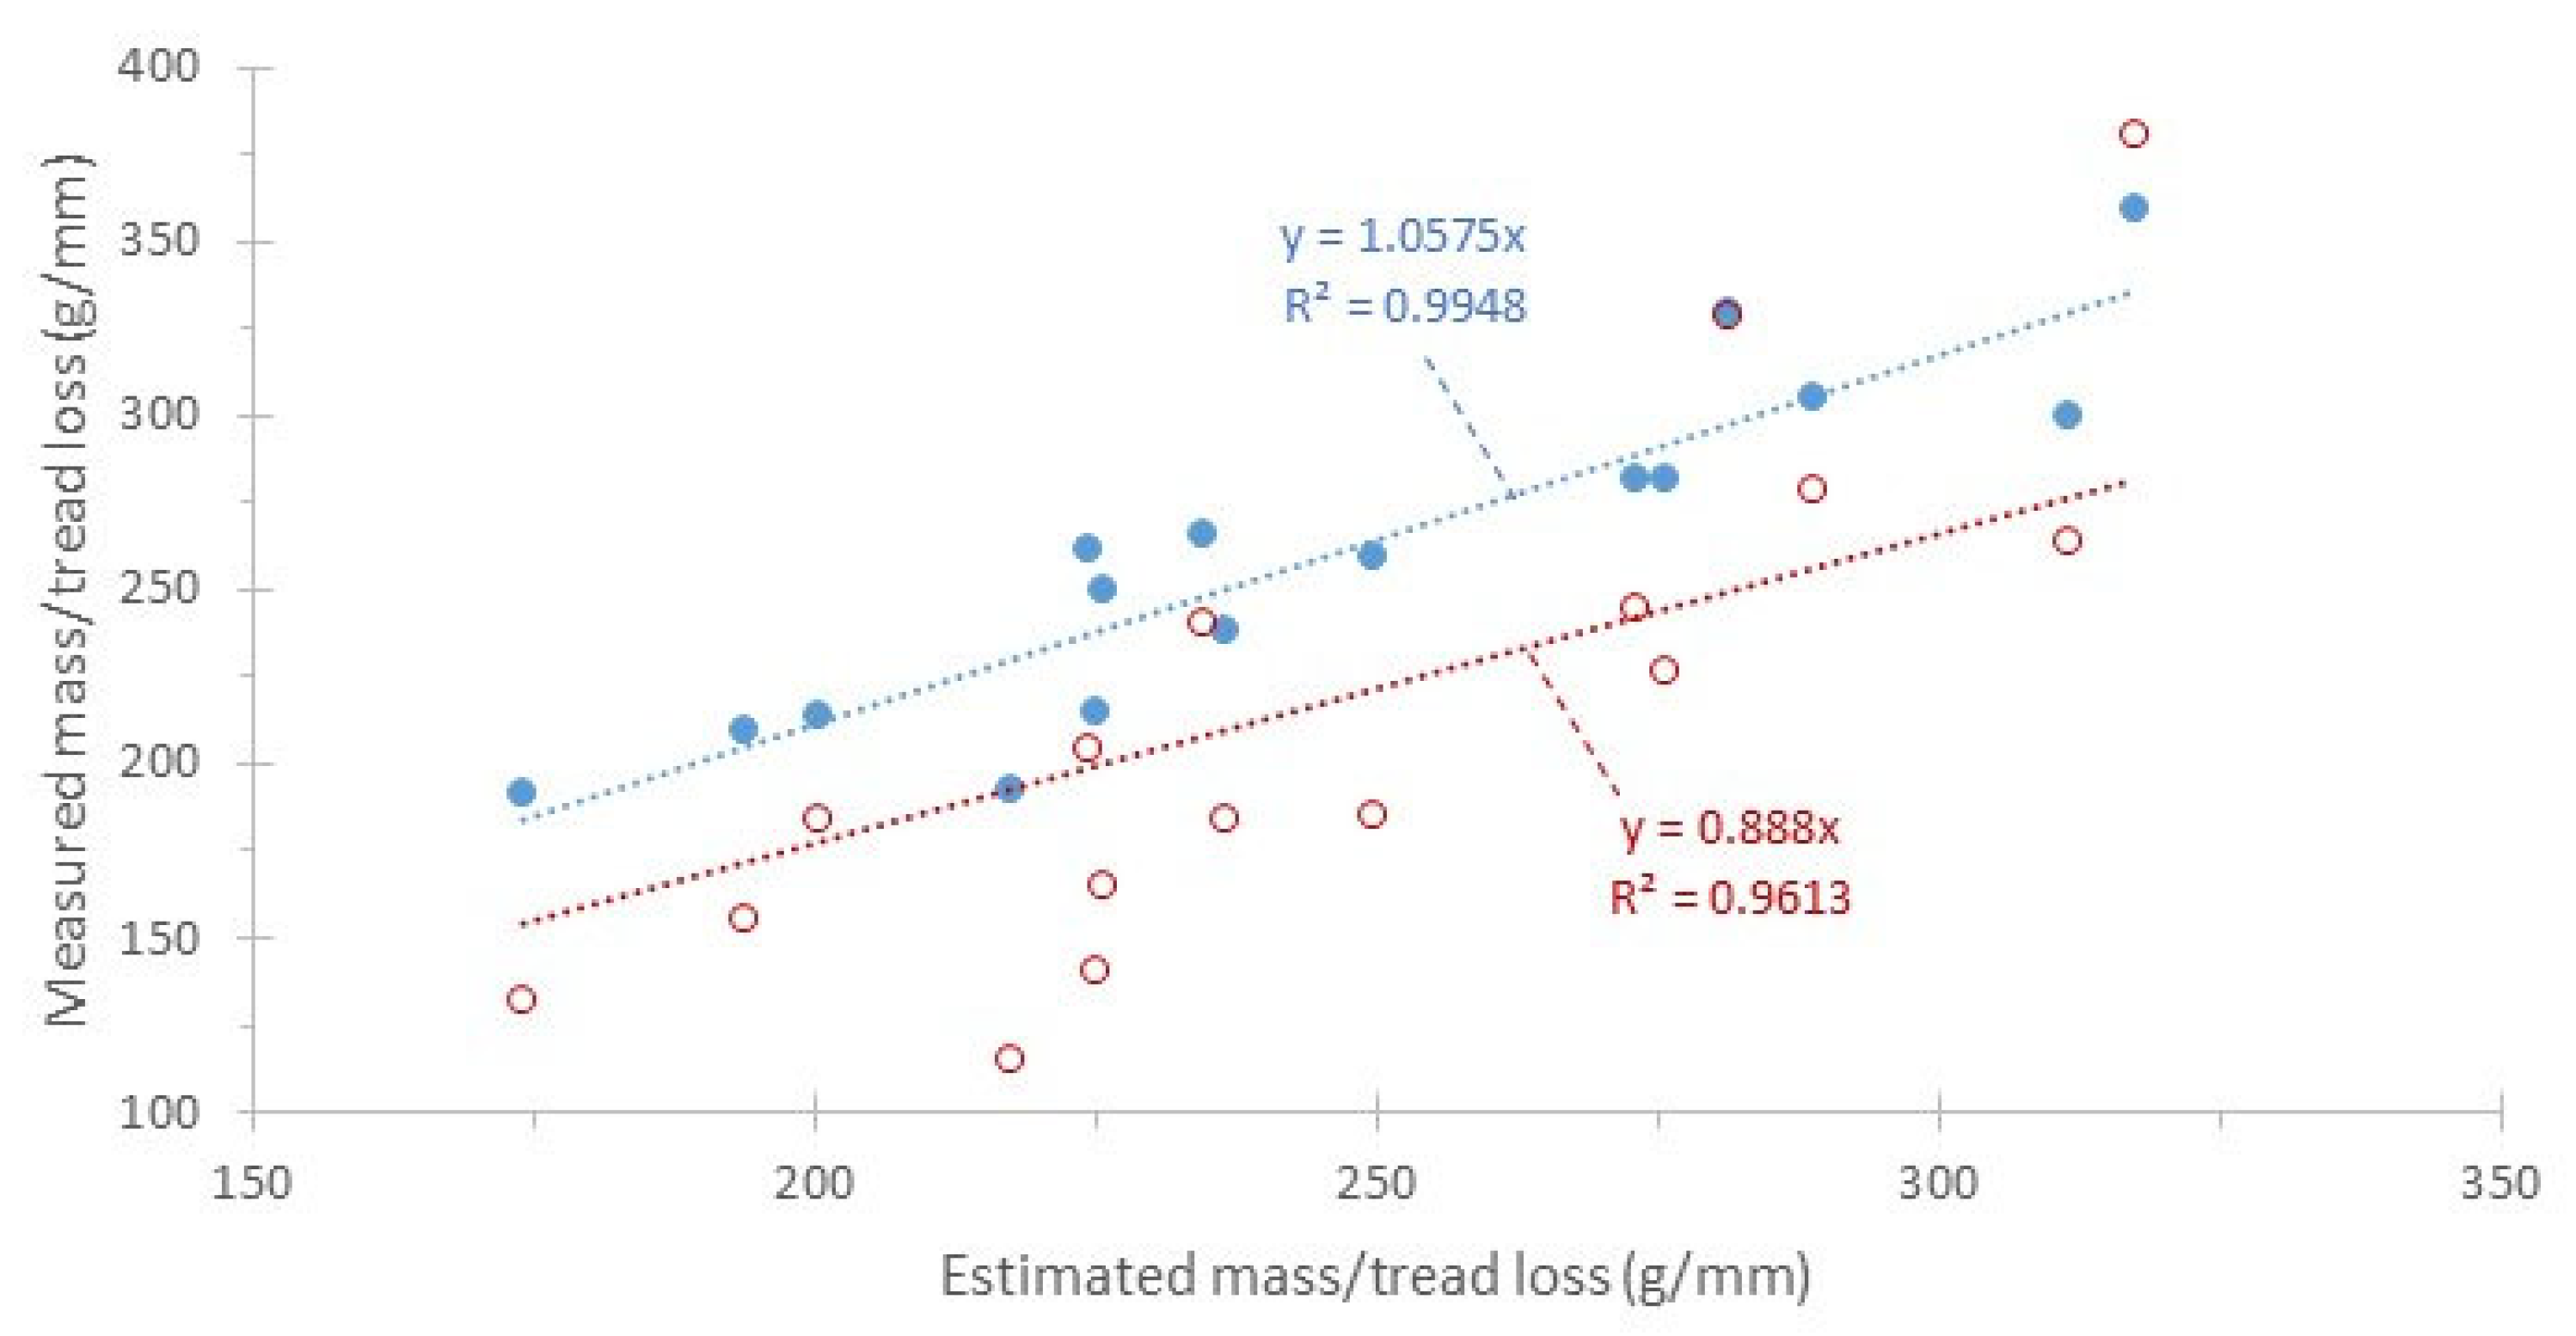
The comparison of measured and estimated mass loss per mm of tread depth reduction gave a slope of 1.06 for the front tyres and 0.89 for the rear tyres (Figure A6). These values were based on the estimated contact width from the footprints (Figure A1, Figure A2 and Figure A3). The theoretical contact width [14,44] would give slopes around 6% less, and consequently the measured and estimated values for front tyres would have a slope closer to unity, but the rear tyres have a slope of 0.83. We have no explanation for the different slopes for front and rear tyres, but we assume that it has to do with experimental uncertainties (lower mass loss and less tread depth reduction) for the rear tyres.
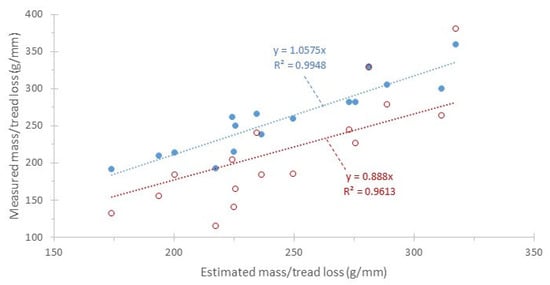
Figure A6.
Comparison of measured and estimated mass loss per mm of tread depth reduction for front and rear tyres.
Figure A6.
Comparison of measured and estimated mass loss per mm of tread depth reduction for front and rear tyres.
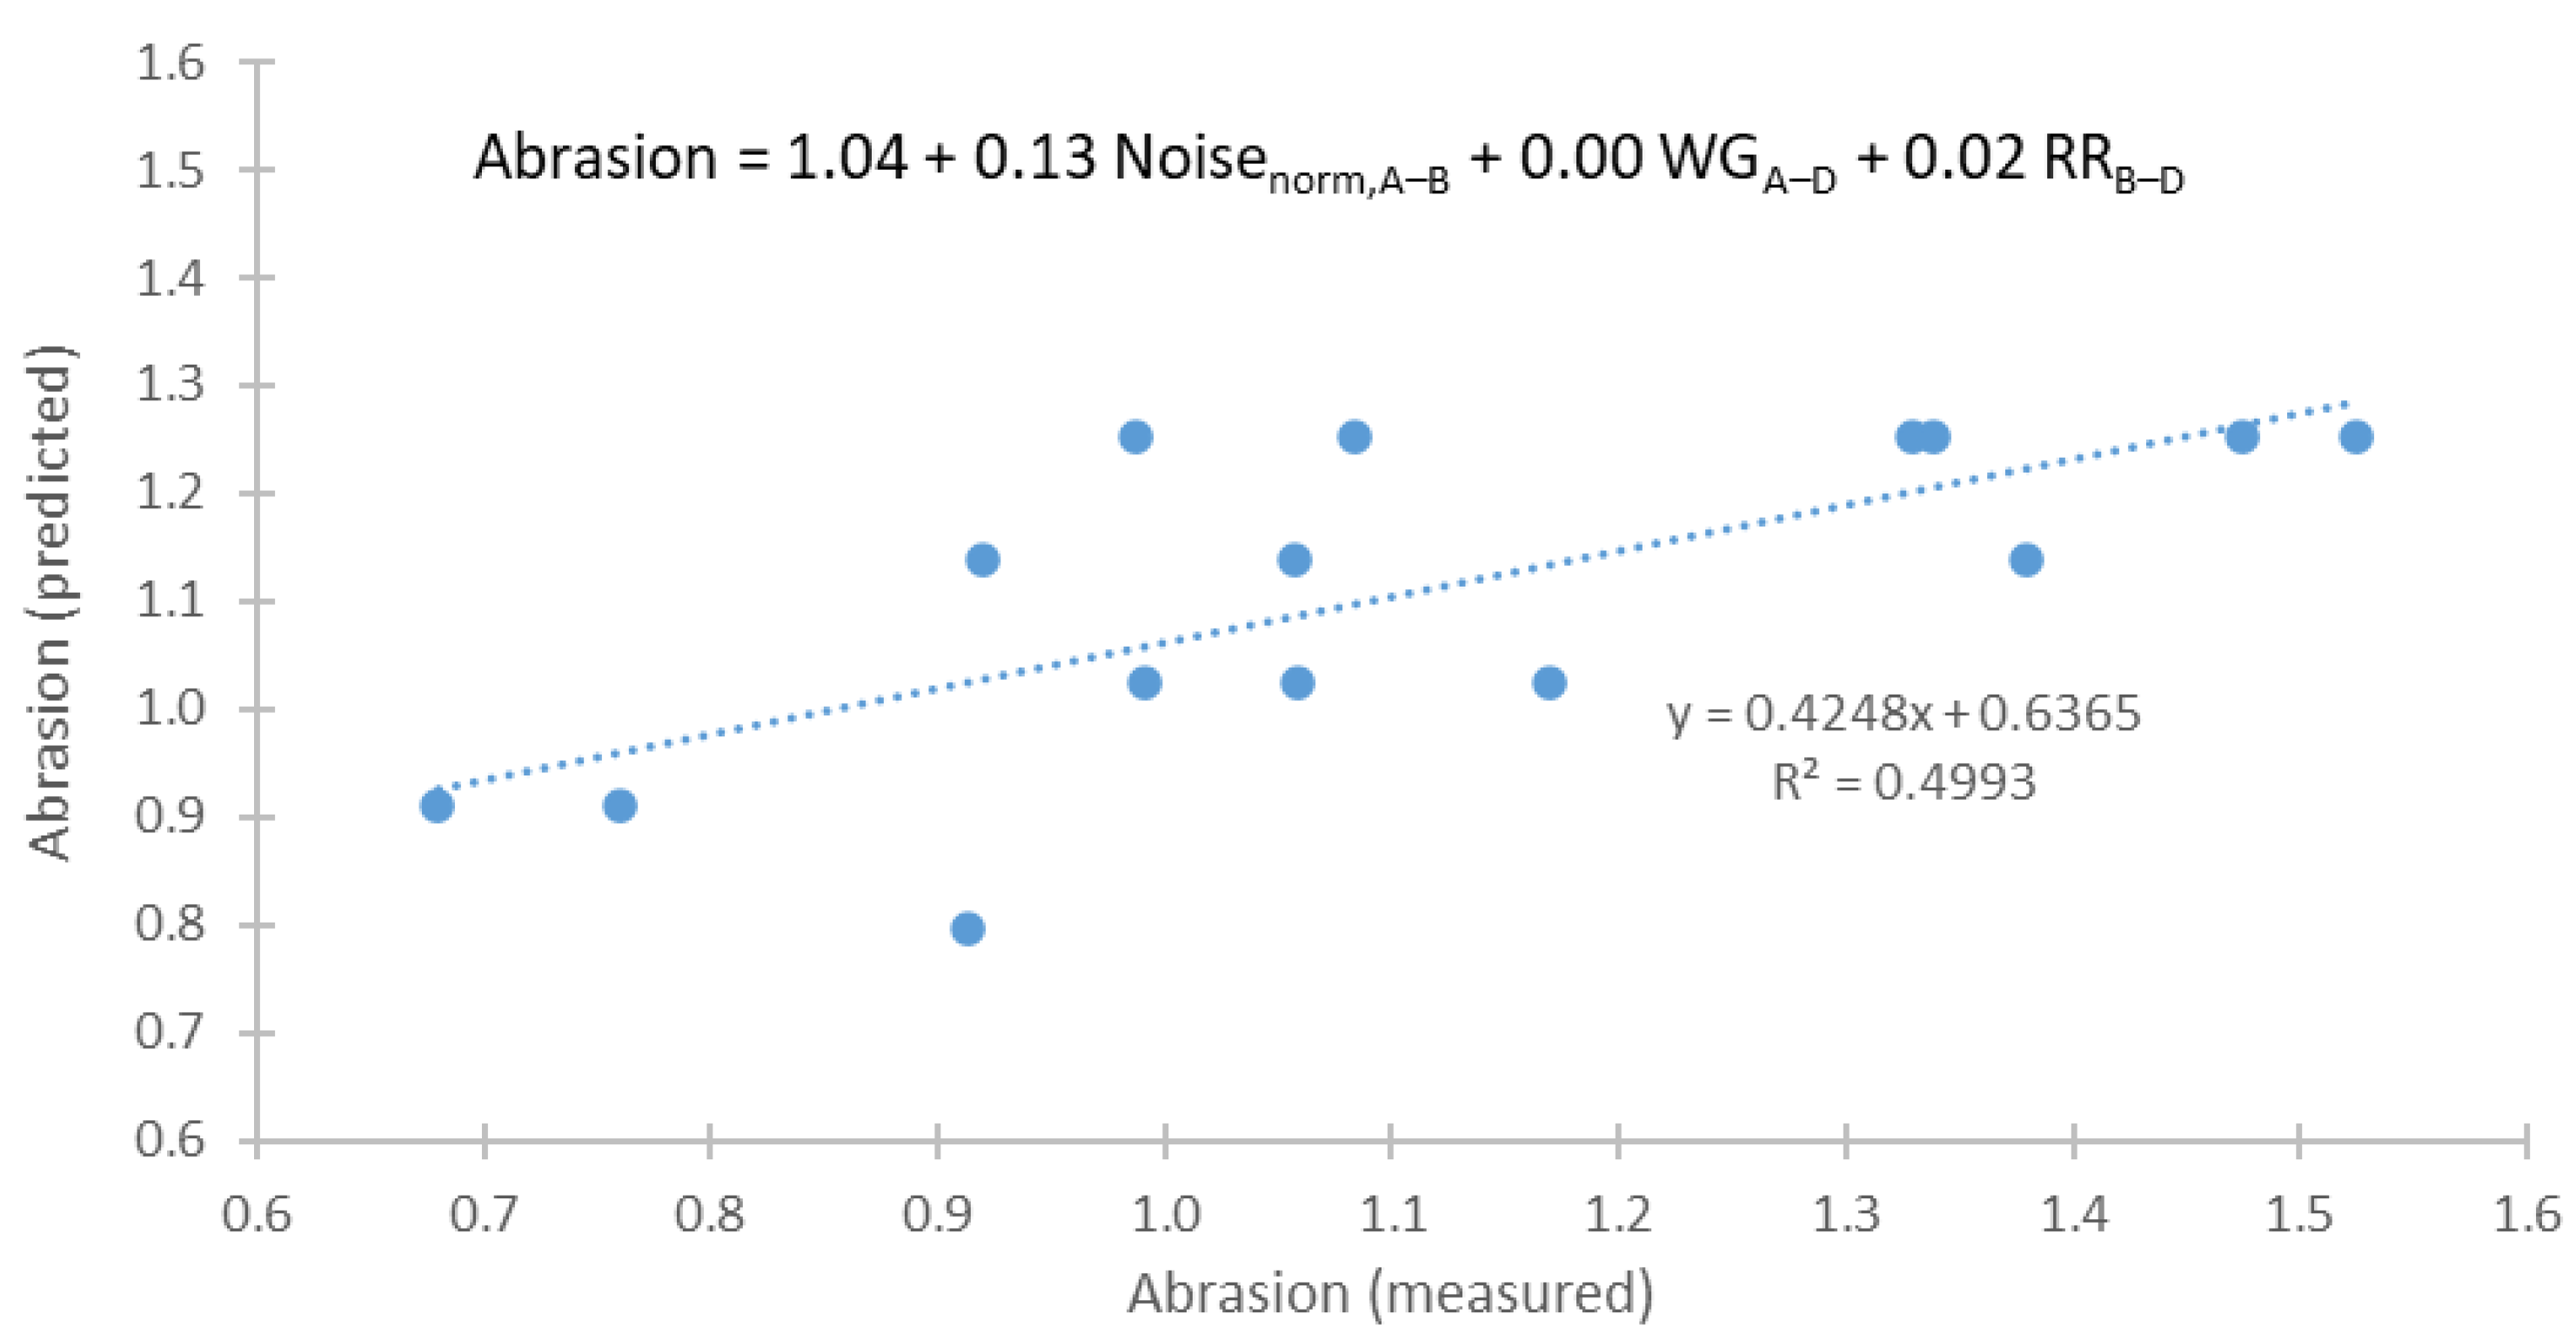
In order to find whether low-abrasion tyres have better or worse noise, wet grip, and rolling resistance characteristics, a simple linear model was developed. The A to E characteristics of wet grip and rolling resistance were set to integral values of 1 to 5. For noise, the numerical values of each tyre were compared to the mean value of all tyres. The best-fit coefficients were 0.13 for noise, 0 for wet grip, and 0.02 for rolling resistance (Figure A7). Analysis of subsets (e.g., only summer or winter or SUV tyres) gave similar coefficients. This means that increased noise also has higher abrasion, while no effect of wet grip or rolling resistance could be found. The message of the analysis is that low-abrasion tyres do not have worse important parameters such as noise, wet grip, and rolling resistance (actually a positive correlation was found). It should be highlighted that the majority of the tyres were noise class B and rolling resistance class C, so extrapolating the conclusions to better classes might not be applicable. For example, there are concerns for wet grip (and rolling resistance) of lower abrasion tyres [29]. Furthermore, the R2 of our linear model is only 0.50, indicating that there are more parameters that should be considered for predicting abrasion.
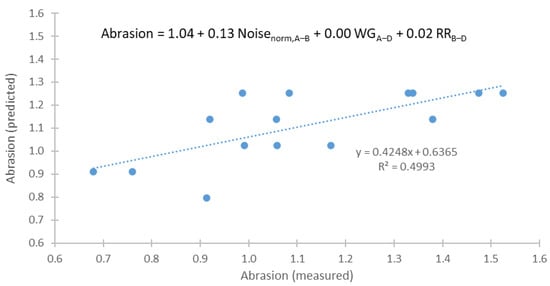
Figure A7.
Prediction of abrasion level index with noise, wet grip (WG), and rolling resistance (RR) parameters.
Figure A7.
Prediction of abrasion level index with noise, wet grip (WG), and rolling resistance (RR) parameters.
References
- Giechaskiel, B.; Grigoratos, T.; Dilara, P.; Karageorgiou, T.; Ntziachristos, L.; Samaras, Z. Light-Duty Vehicle Brake Emission Factors. Atmosphere 2024, 15, 97. [Google Scholar] [CrossRef]
- Feißel, T.; Büchner, F.; Kunze, M.; Rost, J.; Ivanov, V.; Augsburg, K.; Hesse, D.; Gramstat, S. Methodology for Virtual Prediction of Vehicle-Related Particle Emissions and Their Influence on Ambient PM10 in an Urban Environment. Atmosphere 2022, 13, 1924. [Google Scholar] [CrossRef]
- Fukahori, Y.; Gabriel, P.; Liang, H.; Busfield, J.J.C. A New Generalized Philosophy and Theory for Rubber Friction and Wear. Wear 2020, 446–447, 203166. [Google Scholar] [CrossRef]
- Park, I.; Lee, J.; Lee, S. Laboratory Study of the Generation of Nanoparticles from Tire Tread. Aerosol Sci. Technol. 2017, 51, 188–197. [Google Scholar] [CrossRef]
- Miech, J.A.; Aker, S.; Zhang, Z.; Ozer, H.; Fraser, M.P.; Herckes, P. Tire Wear Emissions by Highways: Impact of Season and Surface Type. Atmosphere 2024, 15, 1122. [Google Scholar] [CrossRef]
- Giechaskiel, B.; Grigoratos, T.; Mathissen, M.; Quik, J.; Tromp, P.; Gustafsson, M.; Franco, V.; Dilara, P. Contribution of Road Vehicle Tyre Wear to Microplastics and Ambient Air Pollution. Sustainability 2024, 16, 522. [Google Scholar] [CrossRef]
- Giechaskiel, B.; Grigoratos, T.; Dilara, P.; Franco, V. Environmental and Health Benefits of Reducing Tyre Wear Emissions in Preparation for the New Euro 7 Standard. Sustainability 2024, 16, 10919. [Google Scholar] [CrossRef]
- Christou, A.; Giechaskiel, B.; Olofsson, U.; Grigoratos, T. Review of Health Effects of Automotive Brake and Tyre Wear Particles. Toxics 2025, 13, 301. [Google Scholar] [CrossRef] [PubMed]
- European Commission. Communication from the Commission to the European Parliament, the Council, the European Economic and Social Committee and the Committee of the Regions Pathway to a Healthy Planet for All EU Action Plan: “Towards Zero Pollution for Air, Water and Soil”. COM/2021/400 Final. Available online: https://eur-lex.europa.eu/legal-content/EN/TXT/?uri=CELEX:52021DC0400 (accessed on 5 July 2025).
- European Commission. Regulation (EU) 2024/1257 of the European Parliament and of the Council on Type-Approval of Motor Vehicles and Engines and of Systems, Components and Separate Technical Units Intended for Such Vehicles, with Respect to Their Emissions and Battery Durability (Euro 7), Amending Regulation (EU) 2018/858 of the European Parliament and of the Council and Repealing Regulations (EC) No 715/2007 and (EC) No 595/2009 of the European Parliament and of the Council, Commission Regulation (EU) No 582/2011, Commission Regulation (EU) 2017/1151, Commission Regulation (EU) 2017/2400 and Commission Implementing Regulation (EU) 2022/1362. Off. J. Eur. Comm. 2024, 1257, 1–49. [Google Scholar]
- van Giesen, R.; van den Akker, K.; Else, M. Study Assessing Consumer Understanding of Tyre Labels. Available online: https://www.website.lisspanel.nl/app/uploads/sites/2/2021/06/tyre-label_final-report.pdf (accessed on 5 July 2025).
- Leon-T. Policy Recommendations. Deliverable 6.4. Annex A. Available online: https://www.leont-project.eu/wp-content/uploads/2025/01/D6.4_public.pdf (accessed on 5 July 2025).
- European Commission. Council Directive 89/459/EEC of 18 July 1989 on the Approximation of the Laws of the Member States Relating to the Tread Depth of Tyres of Certain Categories of Motor Vehicles and Their Trailers. Off. J. Eur. Comm. 1989, L226, 4. [Google Scholar]
- Giechaskiel, B.; Ferrarese, C.; Grigoratos, T. Tire Wear, Tread Depth Reduction, and Service Life. Vehicles 2025, 7, 29. [Google Scholar] [CrossRef]
- DOT HS 813 585 2024; Uniform Tire Quality Grading. NHTSA: Washington, DC, USA, 2024.
- Zhong, C.; Sun, J.; Zhang, J.; Liu, Z.; Fang, T.; Liang, X.; Yin, J.; Peng, J.; Wu, L.; Zhang, Q.; et al. Characteristics of Vehicle Tire and Road Wear Particles’ Size Distribution and Influencing Factors Examined via Laboratory Test. Atmosphere 2024, 15, 423. [Google Scholar] [CrossRef]
- Giechaskiel, B.; Grigoratos, T.; Li, L.; Zang, S.; Lu, B.; Lopez, D.; García, J.J. Tyre Wear under Urban, Rural, and Motorway Driving Conditions at Two Locations in Spain and China. Lubricants 2024, 12, 338. [Google Scholar] [CrossRef]
- Matsuzaki, R.; Todoroki, A. Wireless Monitoring of Automobile Tires for Intelligent Tires. Sensors 2008, 8, 8123–8138. [Google Scholar] [CrossRef] [PubMed]
- Chang, W.-H.; Juang, R.-T.; Huang, M.-H.; Sung, M.-F. Estimation of Tire Mileage and Wear Using Measurement Data. Electronics 2021, 10, 2531. [Google Scholar] [CrossRef]
- Zhang, S.; Liu, Y.; Zhou, H.; Zhang, W.; Chen, Y.; Zhu, H. Analysis of the Effect of Wear on Tire Cornering Characteristics Based on Grounding Characteristics. WEVJ 2023, 14, 166. [Google Scholar] [CrossRef]
- Kim, K.; Park, H.; Kim, T. Comparison of Performance of Predicting the Wear Amount of Tire Tread Depending on Sensing Information. Sensors 2023, 23, 459. [Google Scholar] [CrossRef]
- Park, H.; Seo, J.; Kim, K.; Kim, T. Predicting the Wear Amount of Tire Tread Using 1D−CNN. Sensors 2024, 24, 6901. [Google Scholar] [CrossRef]
- Wang, G.; Li, X.; Jing, Z.; Wang, X.; Zhang, Y. Improvement in and Validation of the Physical Model of an Intelligent Tire Considering the Wear. Sensors 2025, 25, 2490. [Google Scholar] [CrossRef]
- TFTA Proposal for a New UN Regulation on the Uniform Provisions Concerning the Approval of Tyres with Regard to Abrasion Performance. Document ECE-TRANS-WP29-GRBP-2025-27e. Available online: https://unece.org/transport/documents/2025/06/working-documents/tf-ta-proposal-new-un-regulation-uniform-provisions (accessed on 5 July 2025).
- Jekel, M. Scientific Report on Tyre and Road Wear Particles, TRWP, in the Aquatic Environment; European TRWP Platform: Berlin, Germany, 2019. [Google Scholar]
- Giechaskiel, B. JRC Work on Tyre Abrasion. Presented at TFTA Session 32 on 22 April 2025. File TA-32-7 TAPP-19-05 Leon-T_Euro7_02c.Pptx. Presented at the TFTA Session 32, Online, 22 April 2025. Available online: https://wiki.unece.org/display/trans/TF+TA+session+32 (accessed on 5 July 2025).
- Yan, H.; Zhang, L.; Liu, L.; Wen, S. Investigation of the External Conditions and Material Compositions Affecting the Formation Mechanism and Size Distribution of Tire Wear Particles. Atmos. Environ. 2021, 244, 118018. [Google Scholar] [CrossRef]
- Schläfle, S.; Unrau, H.-J.; Gauterin, F. Influence of Load Condition, Tire Type, and Ambient Temperature on the Emission of Tire–Road Particulate Matter. Atmosphere 2023, 14, 1095. [Google Scholar] [CrossRef]
- Silvestro, D. ADAC Tyre Study: Abrasion Index Limit. File TAPP-21-01. In Proceedings of the 21st Session of the GRBP/GRPE TFTA Post Processing Group, Online, 28 May 2025. [Google Scholar]
- Li, Y.; Zuo, S.; Lei, L.; Yang, X.; Wu, X. Analysis of Impact Factors of Tire Wear. J. Vib. Control 2012, 18, 833–840. [Google Scholar] [CrossRef]
- Du, X.; Li, H.; Xu, M.; Ge, Y. Research on Ground Contact Characteristics and Influencing Factors of Tires with Complex Tread Patterns Based on Inverse Modeling. Lubricants 2025, 13, 261. [Google Scholar] [CrossRef]
- Schläfle, S.; Zhang, M.; Unrau, H.-J.; Gauterin, F. Influence of Vertical Load, Inflation Pressure, and Driving Speed on the Emission of Tire–Road Particulate Matter and Its Size Distribution. Atmosphere 2024, 15, 502. [Google Scholar] [CrossRef]
- European Commission. Regulation (EU) 2020/740 of the European Parliament and of the Council of 25 May 2020 on the Labelling of Tyres with Respect to Fuel Efficiency and Other Parameters, Amending Regulation (EU) 2017/1369 and Repealing Regulation (EC) No 1222/2009. Off. J. Eur. Comm. 2020, L177, 1–31. [Google Scholar]
- Garcia-Pozuelo, D.; Afshari, F.; Gutierrez-Moizant, R.; Martínez, M.A. ECOTIRE: A New Concept of a Smart and Sustainable Tire Based on a Removable Tread. Appl. Sci. 2025, 15, 3675. [Google Scholar] [CrossRef]
- Araujo-Morera, J.; Hernández Santana, M.; Verdejo, R.; López-Manchado, M.A. Giving a Second Opportunity to Tire Waste: An Alternative Path for the Development of Sustainable Self-Healing Styrene–Butadiene Rubber Compounds Overcoming the Magic Triangle of Tires. Polymers 2019, 11, 2122. [Google Scholar] [CrossRef]
- Ayar, M.; Dalkiran, A.; Kale, U.; Nagy, A.; Karakoc, T.H. Investigation of the Substitutability of Rubber Compounds with Environmentally Friendly Materials. Sustainability 2021, 13, 5251. [Google Scholar] [CrossRef]
- Li, M.; Wang, K.; Xiong, Y. Multiple Intermolecular Interaction to Improve the Abrasion Resistance and Wet Skid Resistance of Eucommia Ulmoides Gum/Styrene Butadiene Rubber Composite. Materials 2021, 14, 5246. [Google Scholar] [CrossRef]
- Ha, J.U.; Bae, S.H.; Choi, Y.J.; Lee, P.-C.; Jeoung, S.K.; Song, S.; Choi, C.; Lee, J.S.; Kim, J.; Han, I.S. Control of Tire Wear Particulate Matter through Tire Tread Prescription. Polymers 2023, 15, 2795. [Google Scholar] [CrossRef]
- Cheng, Y.; Wang, Q. Enhancement of Green Tires Performance through Ultrasound-Assisted Mixing. Polymers 2022, 14, 418. [Google Scholar] [CrossRef]
- ETRTO. ETRTO Responses on TFTA Co-Chair Key Questions and Limits Proposal. Rev 1. In Proceedings of the TFTA Session 34, Online, 3 June 2025; Available online: https://wiki.unece.org/display/trans/tfta+session+34 (accessed on 5 July 2025).
- Silvestro, D. ADAC Tyre Test: Tyre Abrasion—On Road Tests. In Proceedings of the Task Force on Tyre Abrasion, Online, 11 May 2022; Document: TA-02-02 Study_ADAC_tyre_abrasion_110522. Available online: https://wiki.unece.org/display/trans/TF+TA+session+2 (accessed on 5 July 2025).
- ADAC. ADAC Test. Summer Tyres in the Dimension 205/55 R16 91 V. Document TA-12-05. In Proceedings of the TF TA Session 12th, Online, 28 April 2023; Available online: https://wiki.unece.org/display/trans/TF+TA+session+12 (accessed on 5 July 2025).
- Tyre Reviews. Available online: https://www.tyrereviews.com (accessed on 5 July 2025).
- Biesse, F.; Mahé, J.; Lévy, N. Average Worn Profile of Tires in Europe. Tire Sci. Technol. 2014, 42, 166–184. [Google Scholar] [CrossRef]
Disclaimer/Publisher’s Note: The statements, opinions and data contained in all publications are solely those of the individual author(s) and contributor(s) and not of MDPI and/or the editor(s). MDPI and/or the editor(s) disclaim responsibility for any injury to people or property resulting from any ideas, methods, instructions or products referred to in the content. |
© 2025 by the authors. Licensee MDPI, Basel, Switzerland. This article is an open access article distributed under the terms and conditions of the Creative Commons Attribution (CC BY) license (https://creativecommons.org/licenses/by/4.0/).


