Abstract
The polymorphism of the bovine β-casein gene (CSN2) is of increasing interest due to its relevance for A2 milk production. This study genotyped 2773 Holstein-Friesian cows for five CSN2 alleles (A1, A2, A3, B, I) using both conventional DNA-based PCR and a newly evaluated direct PCR protocol. Eleven genotypes were detected, with A2/A2 (33.9%) and A1/A2 (30.3%) being the most common, resulting in an A2 allele frequency of 59.0%. Genetic diversity indices indicated moderate polymorphism and a significant deviation from Hardy–Weinberg equilibrium, consistent with ongoing selection for the A2 allele. Associations between CSN2 genotype and milk traits (305-day milk, fat, and protein yield; fat% and protein%) were evaluated using linear mixed-effects models including lactation number, age at calving, and calving year as covariates, and cow ID as a random intercept. Several genotype effects reached statistical significance (p < 0.05); however, all effect sizes were very small (partial η2 < 0.01), indicating that any influence of CSN2 on production traits is negligible within this population and management context. These findings suggest that A2-oriented selection is unlikely to compromise productivity. The direct PCR genotyping method achieved 96–100% success and enabled substantially faster and more cost-efficient processing (approximately 80–90% reduction in reagent costs), providing a rapid and scalable approach for large herds.
1. Introduction
Milk is a complex biological fluid composed of numerous organic (fats, proteins, carbohydrates, enzymes, vitamins, and hormones) and inorganic (water, mineral salts, pigments, and gases) components [1]. Among these components, proteins are of particular nutritional and functional importance, as they provide essential amino acids and contribute significantly to human dietary requirements for animal-derived protein [2]. Milk proteins are broadly divided into two groups: caseins, which represent about 80% of total protein content, and whey proteins, which account for the remaining 20% [3]. Caseins include αs1-, αs2-, β-, and κ-casein, while γ-casein is formed by proteolytic cleavage of β-casein [4].
Approximately 90% of total milk proteins are synthesized by alveolar cells of the mammary gland and are encoded by six major structural genes: four casein genes (CSN1S1, CSN2, CSN1S2, and CSN3) located on chromosome 6, and the genes encoding α-lactalbumin and β-lactoglobulin located on chromosome 11 [5]. The β-casein gene (CSN2) exhibits extensive genetic polymorphism, with at least twelve allelic variants identified to date: A1, A2, A3, B, C, D, E, F, G, H1, H2, I and J [3,4].
The ancestral allele A2 gave rise to several other variants through point mutations during cattle domestication and selective breeding. Across global cattle populations, the allelic spectrum is dominated by the A1 and A2 variants [5]. The B variant occurs at lower frequencies, whereas the I variant is considered rare in most breeds [6,7]. The A3 and C variants are uncommon, while the E allele has been detected almost exclusively in the Piedmontese breed [8]. The F allele occurs at extremely low frequencies (≈0.006) in certain Italian cattle populations [7].
At the molecular level, the A1 and A2 variants differ by a single nucleotide polymorphism in exon 7 of the CSN2 gene, resulting in a nonsynonymous substitution at codon 67: CCT (proline) in A2 and CAT (histidine) in A1 [4,9]. This amino acid difference alters the secondary structure of β-casein and has important functional consequences during gastrointestinal digestion. The histidine residue in the A1 isoform facilitates proteolytic cleavage between residues 66 and 67, releasing the bioactive heptapeptide β-casomorphin-7 (BCM-7) [10]. In contrast, the proline residue in A2 β-casein prevents cleavage at this site, thereby limiting BCM-7 formation. Further variants such as I and A3 are derived from A2 (differing at positions 93 and 106), while B and C variants originated from A1 (differing at positions 122 and 37), but these retain the BCM-7 release pattern of their precursor variants [6,11].
The potential physiological significance of BCM-7 has attracted considerable scientific and public attention. BCM-7 exhibits opioid-like activity and has been hypothesized to contribute to several health conditions, including type 1 diabetes, ischemic heart disease, sudden infant death syndrome, and certain neurodevelopmental disorders [12,13,14]. Emerging evidence also suggests that β-casein variants may influence gastrointestinal comfort and milk tolerance. A multicentre randomized controlled trial showed that consumption of milk containing only A2 β-casein significantly reduced digestive symptoms—such as abdominal discomfort, bloating, and stool irregularities—compared with conventional (A1-containing) milk [15].
With growing consumer interest, A2 milk has gained substantial market presence in regions such as Australia, New Zealand, Europe, the United States, and China. Its production is of growing commercial interest due to perceived health benefits and improved digestibility [16,17,18].
Several molecular techniques are used for routine CSN2 genotyping, including PCR–RFLP [19], allele-specific PCR [20,21], high-resolution melting (HRM) analysis [22], and Sanger sequencing as the reference method [6]. However, these methods typically require purified genomic DNA from blood, tissues, or hair follicles, which increases processing time and cost. Extraction-free direct PCR has emerged as a promising alternative, as minimally processed tissues or hair roots can be used directly as amplification templates [23].
Despite extensive global research on β-casein polymorphisms, limited information is available regarding the association between CSN2 genotypes and milk production traits in Central European Holstein populations, particularly when direct PCR-based genotyping is applied. Therefore, the aim of this study was to characterize β-casein (CSN2) genetic variation in a large cohort of high-yielding Holstein-Friesian cows and to evaluate the effects of CSN2 genotypes on milk, fat, and protein yields across multiple lactations. In addition, we assessed the efficiency and reliability of a direct PCR-based genotyping protocol for high-throughput A1/A2 genotyping. These results are intended to support informed breeding decisions aimed at increasing the frequency of the A2 allele without compromising production performance.
2. Materials and Methods
2.1. Sample Collection and Ethical Approval
All cows included in this study originated from a single large-scale commercial Holstein-Friesian herd in Hungary. The herd operates a closed housing and milk-recording system and has applied genomic selection for the A2 β-casein variant since 2021. All animals were managed under uniform feeding, housing, and milking conditions and were kept on a monodietary total mixed ration (TMR).
Samples of ear cartilage, blood, and hair follicles were collected from 2773 cows between 2022 and 2024 following standard commercial dairy procedures. Milk production was evaluated using standardized 305-day lactation yields, with production and lactation records collected and updated through 2025. In total, 2540 lactation records were included in the genotype–phenotype association analyses. The examined traits were 305-day milk yield (kg), fat yield (kg), protein yield (kg), and milk fat percentage (%) and protein percentage (%). Milk yield, fat yield, protein yield, and milk fat and protein percentages were obtained from official monthly test-day milk-recording data provided by Animal Breeding Performance Testing Ltd., in accordance with the guidelines of the International Committee for Animal Recording [24]
Not all genotyped cows had a complete standardized 305-day lactation record within the study window (e.g., heifers that had not yet completed a 305-day lactation or cows with incomplete recording); therefore, only complete lactations were retained for genotype–phenotype association modelling.
Biological samples were collected in multiple routine batches between 2022 and 2024 as part of the farm’s ongoing identification, genetic-testing, and veterinary monitoring workflows. Ethical approval for the use of biological samples and production data for research (issued on 10 July 2024) covered the use of all collected biological materials as well as retrospectively and prospectively obtained production data from the full study period, including routinely collected samples generated prior to the approval date.
Ear cartilage samples were collected using Allflex Tissue Sampling Units (TSU; Allflex Livestock Intelligence, Irving, TX, USA), blood samples were obtained from the jugular vein into EDTA-coated vacutainer tubes, and hair follicles were taken from the tail switch into sterile containers. Samples were kept at 4 °C during transport and processed or stored at −20 °C within 24 h at the Institute of Genetics and Biotechnology, Hungarian University of Agriculture and Life Sciences (Gödöllő, Hungary). All sampling procedures were carried out by licensed veterinarians or trained personnel following standard biosafety and hygiene regulations. The TSU method used for ear cartilage sampling is a minimally invasive technique routinely applied in commercial dairy herd identification and genetic testing. Blood sampling was performed as part of regular veterinary health monitoring.
Animal owners provided informed consent for the use of biological samples and production records for research purposes. Ethical approval for sample collection and data use was obtained from the Institutional Animal Welfare Body of the Hungarian University of Agriculture and Life Sciences, Szent István Campus (Approval: MATE SZIC MÁB, issued on 10 July 2024). According to the official certification, the study is outside the scope of Directive 2010/63/EU and therefore does not require an experimental animal permit.
2.2. Genomic DNA Extraction
Genomic DNA was extracted from ear tissue, hair roots, and whole blood using the MagCore® automated nucleic acid extraction system with the corresponding MagCore® Genomic DNA Tissue Kit or Whole Blood Kit (RBC Bioscience Corp., Taipei, Taiwan), following the manufacturer’s protocols with sample-specific modifications.
For ear tissue, small pieces of hairy skin with attached connective tissue (approximately 9–18 mg) were digested in 400 μL GT buffer with 20 μL Proteinase K (10 mg/mL) at 55 °C for 90 min with agitation. Hair samples (≈25 follicles, 1 cm length) were incubated in 500 μL GT buffer supplemented with 20 μL Proteinase K (10 mg/mL), 20 μL high-concentration Proteinase K (20 mg/mL), and 10 μL DTT (1 M) at 55 °C for 150 min. After centrifugation, cleared lysates (~400 μL) were transferred to T-Rack tubes and processed using the MagCore® Tissue protocol (No. 401). Whole blood (400 μL EDTA) was extracted using the MagCore® Whole Blood protocol (No. 101).
Tissue-derived DNA was eluted in 100 μL and hair-derived DNA in 60 μL nuclease-free water. All extracts were quantified using a NanoDrop™ spectrophotometer, and samples with an A260/A280 ratio of 1.8–2.2 were adjusted to a working concentration of 15 ng/μL for downstream PCR.
2.3. Direct Template Preparation Without DNA Extraction
To simplify and accelerate genotyping, ear cartilage punches and hair-tail samples were processed using a modified direct PCR workflow (based on the manufacturer’s protocol) without prior DNA purification. Three hair strands with intact follicles or one cartilage punch were incubated in 20 μL Dilution Buffer and 0.5 μL DNA Release Solution. Samples were subjected to the manufacturer’s recommended lysis steps—10 min at room temperature, 30 min at 65 °C, and 15 min at 98 °C—followed by brief centrifugation. The resulting lysates were diluted 1:10 with nuclease-free water, and 2 μL of the diluted supernatant was used as PCR template.
A complete, step-by-step description of the modified and optimized direct PCR protocol used in this study, including reagent compositions and thermal parameters, is provided in Supplementary Materials. The direct PCR workflow was evaluated on 48 hair-tail samples and 48 ear-notch samples collected from randomly selected animals. This validation set size was selected as a preliminary technical validation to confirm amplification robustness, reproducibility, and sequencing concordance. No formal power analysis was performed, as the objective of this step was method validation rather than inference on population-level parameters.
2.4. β-Casein (CSN2) Genotyping
Genotyping of the β-casein (CSN2) gene targeted exon 7, which contains the diagnostic SNPs required to discriminate among the A1, A2, A3, B and I alleles. Amplification was performed using the primer pair described by Sebastiani et al. [6] (forward 5′-TTTCCAGGATGAACTCCAGGAT-3′, reverse 5′-CATCAGAAGTTAAACAGGCACAGTTAG-3′), yielding a 547 bp amplicon spanning the entire coding region of exon 7 along with short flanking intronic sequences. Because the 547 bp amplicon spans the full coding region of exon 7, it also covers diagnostic sites for additional CSN2 variants reported in the literature (e.g., G, H1, H2) in addition to A1, A2, A3, B and I; no such additional exon-7 variants were detected in the present population. A summary of key exon-7 diagnostic amino-acid positions covered by the sequenced fragment is provided in Supplementary Table S1.
PCRs were carried out with the Phire™ Animal Tissue Direct PCR Kit (Thermo Fisher Scientific, Waltham, MA, USA) in 20 µL reactions containing 10 µL Phire Tissue Direct Buffer, 0.20 µL Phire Hot Start II DNA Polymerase, 0.40 µL of each primer (10 µM; 0.20 µM final concentration), and 8 µL nuclease-free water. As template, 2 µL of purified DNA (15 ng/µL) or 2 µL of 1:10-diluted crude lysate (Section 2.3) was used. Thermal cycling was performed on a Bioer LifeEco TC-96 thermocycler (Bioer Technology Co., Ltd., Hangzhou, China) under the following conditions: 98 °C for 5 min; 35 cycles of 98 °C for 10 s, 61.1 °C for 25 s and 72 °C for 25 s; followed by 72 °C for 5 min. PCR products were visualised on 1.5% agarose gels. Representative amplification results obtained from the direct PCR workflow are shown in Supplementary Figure S1, demonstrating clear single-band products for both hair follicle and ear cartilage lysates.
Amplicons were purified and Sanger-sequenced either by Microsynth AG (Balgach, Switzerland; Economy Run Plus, KIT 3100) or by Eurofins Biomi Kft. (Gödöllő, Hungary). Chromatograms were analysed in Geneious (Geneious Prime® version 2025.1.3), trimmed at Phred Q ≥ 20, and aligned to the bovine CSN2 reference sequence (GenBank: X14711.1). Alleles were assigned based on the diagnostic exon-7 SNP positions described by Caroli et al. [5] and Kamiński et al. [25]. Heterozygous sites were called at a ≥30% minor-to-major peak-height ratio. Sequencing of 96 paired samples confirmed full concordance between direct PCR and conventional DNA extraction.
2.5. Population Analysis
Allele and genotype frequencies of the β-casein (CSN2) gene were calculated from the genotyping data. Deviations from Hardy–Weinberg equilibrium (HWE) were assessed using the chi-squared (χ2) test. Because exact HWE tests become statistically unreliable when expected genotype counts fall below 5, the extremely rare A3 allele (detected only in three heterozygous carriers) was excluded from equilibrium calculations to avoid sparse-category artefacts. Therefore, the HWE analysis was performed using only the four common alleles (A1, A2, B and I), for which expected counts met the assumptions of the χ2 framework. Genetic diversity was characterised by observed heterozygosity (Hₒ), expected heterozygosity (Hₑ) [26], polymorphism information content (PIC) [27], effective number of alleles (Nₑ), and the inbreeding coefficient (Fᴵˢ) [28], as defined in Equations (1)–(5). For transparency, we additionally report an HWE analysis including all five alleles using an exact test in Supplementary Table S2; conclusions were unchanged (significant deviation consistent with ongoing selection).
2.6. Statistical Analysis
All analyses were performed in R version 4.3.2. Records were screened for completeness and plausibility, and only lactations with complete standardized 305-day milk, fat and protein yields and corresponding fat and protein percentages were analysed. Model specification, diagnostics, and sensitivity checks (including residual diagnostics, collinearity assessment, and alternative random-effect structures) are described in Supplementary Materials and Supplementary Figure S2.
When cows had multiple lactations, all eligible lactations were retained; differences between early and later lactations were controlled statistically by including lactation number (1–8) as a fixed effect, while repeated measurements within cows were accounted for using cow ID as a random intercept.
Because the mixed-model analyses focused on the three major CSN2 genotypes (A1A1, A1A2, A2A2), only these groups were included in LMMs. All other, rare genotypes were used exclusively to classify animals into functional milk-type categories (A1-type, mixed A1/A2-type, A2-type) but were not subjected to statistical comparison. This approach allowed robust inference for the common genotypes while still representing the full population structure in descriptive summaries. Descriptive (unadjusted) genotype comparisons were performed only for initial inspection; all inferential conclusions were based exclusively on the mixed-effects models.
Associations between CSN2 genotype and production traits were analysed using linear mixed-effects models (LMMs) fitted with the lme4 package [29]. For each trait, the general model was:
Where denotes: 305-day milk yield (kg), fat yield (kg), protein yield (kg), fat percentage (%), protein content (%), or fat-to-protein ratio (FPR). Genotype_i was a fixed effect with three levels (A1A1, A1A2, A2A2). Lactation_j was included as a categorical fixed effect (levels 1–8). AgeCalv_k is age at calving (days), standardized (z-score) to improve convergence. Calving Year_l was fitted as a fixed effect to account for temporal management effects. CowID_m was included as a random intercept to model repeated lactations. Because all cows originated from a single herd, no herd effect was fitted. Sire and additional random slopes were not retained due to limited pedigree completeness and negligible improvement in fit (see Supplementary Materials). Collinearity among fixed effects was assessed using the performance package [30]. All predictors showed low variance inflation factors (VIF = 1.12–1.48), well below accepted thresholds (VIF < 5). Model assumptions were evaluated using DHARMa [31], including tests for residual uniformity (Kolmogorov–Smirnov), dispersion and outliers, and visual inspection of residual-versus-fitted and QQ plots. Diagnostic plots for these models are provided in Supplementary Figure S2. All models showed adequate fit, with no significant deviations from distributional assumptions (all p > 0.10). Statistical significance of fixed effects was evaluated using Satterthwaite’s approximation for denominator degrees of freedom, implemented in the lmerTest package [32]. For each trait, the overall Genotype effect was tested using Type III F-tests. When Genotype was significant (p < 0.05), pairwise contrasts were obtained using estimated marginal means (EMMs) via the emmeans package [33]. Tukey’s method was applied to adjust for multiple pairwise comparisons.
To control for multiple testing across the six genotype-related hypotheses (one per trait), Benjamini–Hochberg false discovery rate (FDR) correction was applied [34]. p-values reported in the main text are unadjusted; the corresponding FDR-adjusted q-values for all genotype effects are shown in Supplementary Table S3.
Effect sizes were expressed as partial eta-squared (η2) using the effectsize package [35]. Interpretation followed standard benchmarks (η2 < 0.01 negligible, 0.01–0.06 small, 0.06–0.14 medium, >0.14 large).
The proportion of variance explained by fixed effects (marginal R2) and by the full model (conditional R2, including random effects) was calculated following Nakagawa & Schielzeth [36], implemented in the performance package.
All statistical tests were two-sided, and significance was declared at p < 0.05. Emphasis in interpretation was placed on effect sizes and confidence intervals to highlight biologically negligible effects despite statistical significance when applicable.
A total of 2540 complete 305-day lactation records were included in the mixed-effects analyses. Because individual cows could contribute more than one lactation, the number of observations exceeded the number of unique animals; however, each row of the dataset represented one complete lactation. The distribution of genotypes and parity categories within the analyzed dataset is summarized in Table 1.

Table 1.
Parity distribution by CSN2 genotype within the final mixed-effects analysis dataset (n = 2540 lactation records).
Within the analyzed dataset (n = 2540 records), the distribution of CSN2 genotypes was as follows: A2A2 (n = 1127), A1A2 (n = 1193), and A1A1 (n = 220). Filtering for complete records during model preparation did not disproportionately exclude any genotype category, indicating a minimal risk of genotype-specific selection bias.
These 2540 lactation records were contributed by 1718 unique cows, with some animals contributing more than one complete lactation record. The per-cow distribution of lactation records (median, interquartile range, and range) is reported in Supplementary Table S4. Rare CSN2 genotypes were excluded from inferential modelling due to extreme imbalance and insufficient statistical power, as their inclusion would have resulted in unstable estimates and biologically misleading conclusions.
3. Results
3.1. Allelic and Genotypic Variation in β-Casein (CSN2)
A total of 2773 Holstein-Friesian cows were successfully genotyped for the CSN2 locus. Five alleles (A1, A2, A3, B, and I) and eleven genotypes were identified, including four homozygous (A1A1, A2A2, B/B, I/I) and seven heterozygous variants. The most common genotypes were A1A2 (30.29%) and A2A2 (33.86%), followed by A2/I (17.49%) and A1/I (8.15%). Rare genotypes (<2.5%) included A1/B, A2/B, A2/A3, B/B, I/B, and I/I (Table 2).
Table 2.
Genotype and Allele Frequencies of β-Casein (CSN2) in the Studied Holstein-Friesian Population (n = 2773).
Allele frequencies showed clear dominance of the A2 allele (59.02%), followed by A1 (23.67%) and I (15.27%), whereas B and A3 remained rare (1.98% and 0.05%, respectively). Genotype and allele frequencies are summarized in Table 2. When classified into functional milk types based on the Pro67 (A2-type) versus His67 (A1-type) amino acid variant, 4.90% of cows produced A1-type milk, 41.52% produced mixed A1/A2-type milk, and 53.58% produced A2-type milk. Functional milk-type frequencies are presented in Supplementary Table S5.
3.2. Genetic Diversity and Hardy–Weinberg Equilibrium
Moderate polymorphism was observed at the CSN2 locus (Hₒ = 0.599; Hₑ = 0.572; PIC = 0.514; Nₑ = 2.34). The slightly negative inbreeding coefficient (Fᴵˢ = –0.047) indicated an excess of heterozygotes. Genotype distribution deviated significantly from Hardy–Weinberg equilibrium (χ2 = 23.86, df = 6, p < 0.001). For the HWE test, only the four common alleles (A1, A2, B, I) were included, consistent with the approach described in the Methods. As noted in the Section 2, the extremely rare A3 allele was excluded from HWE calculations because its expected genotype counts were below the minimum threshold (n < 5). Although this deviation is compatible with ongoing selection toward the A2 allele, additional demographic or management-related factors cannot be entirely excluded. Genetic diversity parameters are summarised in Table 3.
Table 3.
Genetic Diversity and Hardy–Weinberg Equilibrium Parameters at the CSN2 Locus.
3.3. Descriptive Statistics of Production Trait
Descriptive statistics for the three major genotypes (A1A1, A1A2, A2A2) are presented in Table 4. Differences among genotypes were small relative to within-genotype variability, indicating limited phenotypic separation prior to modelling. Fat yield showed the only statistically significant difference among genotypes (p = 0.025), while other traits exhibited no significant genotype effects. However, this difference did not persist in the mixed-effects models, where fat yield showed no significant genotype effect after adjusting for lactation number, age at calving, and repeated measurements. Thus, the raw difference observed in Table 4 is not supported by the model-based analysis and is considered biologically negligible.
Table 4.
Descriptive statistics of production traits by CSN2 genotype (mean ± SD). Differences reflect unadjusted raw means and are not maintained after mixed-model correction.
3.4. Mixed-Effects Model Results Overview
Linear mixed-effects models were fitted for all six traits. Model diagnostics confirmed no violations of assumptions. Lactation number and age at calving were consistently strong predictors, whereas calving year contributed minimally. Across all traits, the fixed effect of CSN2 genotype was either non-significant or statistically significant but of negligible magnitude. The significant fat-yield difference observed in the descriptive statistics did not persist in any of the mixed-effects models, confirming that it was driven by unadjusted variation. Partial η2 values were uniformly <0.01, indicating that genotype explained only a trivial proportion of phenotypic variance.
3.5. 305-Day Milk Yield
Genotype had a statistically significant influence on milk yield (F = 3.76, p = 0.0236); however, the effect size was very small (partial η2 = 0.0053). Estimated marginal means differed by <2% across genotypes, indicating no biologically meaningful impact. Lactation number showed the strongest association with yield (p < 0.0001). Estimated marginal means are displayed in Figure 1. Full Type III ANOVA results for all traits are provided in Supplementary Table S6. Tukey-adjusted pairwise comparisons of genotype-specific EMMs are presented in Supplementary Table S7.
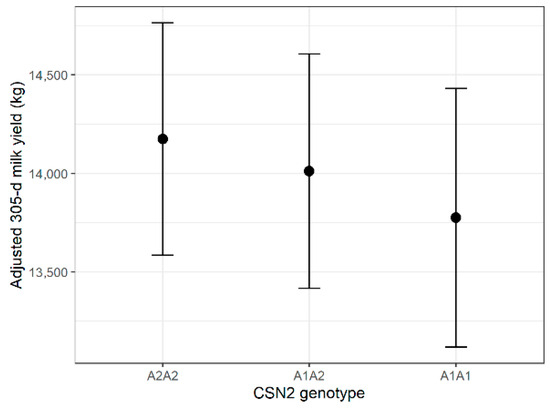
Figure 1.
Estimated marginal means (±95% CI) of 305-day milk yield by CSN2 genotype.
3.6. Fat and Protein Yield
Fat yield showed no association with genotype (p = 0.282). Although fat yield appeared significantly different among genotypes in the descriptive statistics (Table 4), this raw difference did not persist in the mixed-effects model once lactation number, age at calving and repeated measurements were accounted for.
Protein yield showed a statistically significant but biologically negligible effect (F = 3.73, p = 0.0243; partial η2 = 0.0053). In both cases, lactation number remained highly significant (p < 0.0001). Full fixed-effect estimates from all linear mixed-effects models are reported in Supplementary Table S8.
3.7. Milk Composition: Fat % and Protein %
Genotype had a statistically significant but minimal effect on fat percentage (F = 5.34, p = 0.0049; partial η2 = 0.0072). Adjusted mean differences were <0.15 percentage points. Protein percentage was unaffected by genotype (p = 0.420). Estimated marginal means are shown in Figure 2a,b.
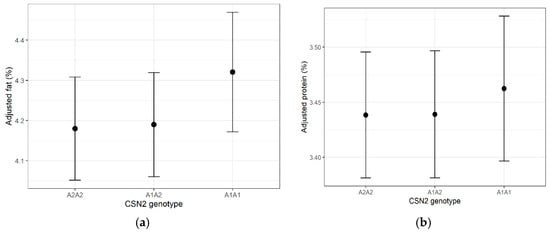
Figure 2.
(a) Estimated marginal means (±95% CI) of milk fat percentage for each CSN2 genotype. (b) Estimated marginal means (±95% CI) of milk protein percentage for each CSN2 genotype. Error bars represent 95% confidence intervals in all figures.
3.8. Fat-to-Protein Ratio (FPR)
FPR exhibited a statistically significant genotype effect (F = 6.57, p = 0.0014), but the effect size was small (partial η2 = 0.0091). Neither lactation number nor calving year contributed meaningfully to the variance. Estimated marginal means are shown in Figure 3.
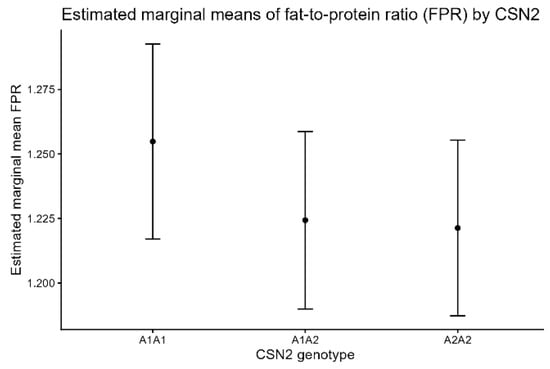
Figure 3.
Estimated marginal means (±95% CI) of fat-to-protein ratio (FPR) by CSN2 genotype.
3.9. Model Explanatory Power
The linear mixed-effects models showed that the fixed-effects component explained a moderate proportion of the total variance in yield traits, as indicated by R2m values ranging from 0.011 to 0.388. However, only a negligible share of this variance was attributable to the CSN2 genotype itself, consistent with the very small partial eta-squared values (<0.01). The conditional R2 values (0.588–0.719) indicated that most of the overall variance was accounted for by the random cow effect (Table 5). These results confirm that genotype-related variation was small relative to the substantial between-cow differences captured by the random intercept.
Table 5.
Marginal and conditional R2 values from linear mixed-effects models assessing milk production and composition traits.
3.10. Rationale and Advantages of the Direct PCR Approach
A comparison of the three DNA preparation workflows—automated magnetic-bead extraction, silica column-based extraction and direct template preparation—is summarised in Table 6. The direct PCR method showed the lowest hands-on time, minimal consumable usage and the lowest reagent cost per sample, while maintaining complete genotype concordance with conventional extraction methods.
Table 6.
Comparison of three DNA preparation workflows for bovine CSN2 genotyping (automated magnetic-bead extraction, silica column-based extraction, and direct template preparation). Where available, hands-on time is indicated separately from total turnaround time.
To further evaluate template quality, direct PCR amplicons from both hair follicles and ear cartilage were subjected to Sanger sequencing. The resulting chromatograms showed sharp, well-resolved peaks and complete concordance with sequences obtained from purified genomic DNA. These results confirm that the modified direct PCR protocol yields sequencing-grade products across all genotypes, including A2A2, A1A1 and A1A2 individuals (see Figure 4). Representative chromatograms for additional alleles detected in this population (B and I) are provided in Supplementary Figure S3.
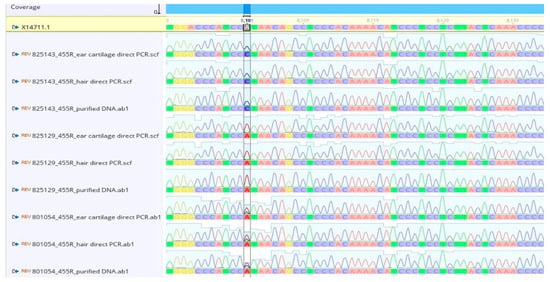
Figure 4.
Representative Sanger chromatograms obtained from direct PCR lysates and purified DNA. Samples 1–3: A2A2 homozygous (1 = ear cartilage direct PCR, 2 = hair direct PCR, 3 = purified DNA). Samples 4–6: A1A1 homozygous. (4 = ear cartilage direct PCR, 5 = hair direct PCR, 6 = purified DNA). Samples 7–9: A1A2 heterozygous. (7 = ear cartilage direct PCR, 8= hair direct PCR, 9 = purified DNA). Direct PCR chromatograms show clear peak resolution and complete agreement with purified DNA.
4. Discussion
This study provides a comprehensive evaluation of β-casein (CSN2) genetic variability and its association with milk production traits in a large, environmentally homogeneous Holstein-Friesian population undergoing sustained selection for the A2 allele. The predominance of the A2 allele observed here (59.0%) is consistent with recent international trends toward A2-focused breeding in Holstein herds across Europe and New Zealand [7,19,37,38,39]. Similar allele distributions reported in Italian, Polish, and Serbian dairy populations [6,24,40] indicate that the Hungarian herd examined here is well aligned with global selection objectives. The observed A2 frequency (0.59) is comparable to recent Holstein reports from Central Italy (≈0.61) and other European Holstein populations undergoing A2-oriented selection [6,7,37,38,39,40], supporting the conclusion that the A2 variant has become the predominant CSN2 allele in this contemporary commercial Holstein population.
Genetic diversity indices demonstrated moderate polymorphism at the CSN2 locus, with higher-than-expected heterozygosity and a negative inbreeding coefficient (FIS = –0.047). The deviation from Hardy–Weinberg equilibrium observed in this population is compatible with early directional selection toward the A2 allele. During rapid allele-frequency shifts, the extensive use of A2 sires can result in a transient excess of A1A2 heterozygotes before equilibrium is re-established, as predicted by population genetic theory [41,42]. Similar departures from Hardy–Weinberg proportions have been observed in dairy cattle populations subjected to contemporary genomic selection pressures [43,44]. Despite this deviation, the observed polymorphism information content and effective allele number values indicate that sufficient genetic variability remains within the population.
Although the descriptive statistics indicated a significant difference in fat yield among genotypes (Table 4), this effect did not persist when appropriate covariates and the random cow effect were incorporated into the mixed-effects models. The disappearance of the raw difference after adjustment for lactation number, age at calving and repeated measurements confirms that the initial signal was driven by uncontrolled variation rather than by the β-casein genotype itself. This is consistent with the uniformly very small effect sizes (partial η2 < 0.01) observed across all traits, indicating that even statistically significant associations detected in the models represent negligible biological impact. Taken together, these results demonstrate that CSN2 variation exerts minimal influence on milk yield or basic milk composition within this population, and that the significant difference observed in the unadjusted means should not be interpreted as a true genotype effect.
Regarding production traits, several genotype effects reached statistical significance; however, all estimated effect sizes were very small (partial η2 < 0.01), and adjusted mean differences were modest. These results are consistent with earlier studies in Dutch, Polish, Slovak, Serbian, and New Zealand Holstein populations, where β-casein variants showed weak or inconsistent associations with milk production traits [11,37,39,40,44,45]. Taken together, the current evidence suggests that CSN2 polymorphism is not a major determinant of production performance under commercial management. The lack of notable genotype-by-parity or genotype-by-year interactions in our exploratory analyses further supports this interpretation.
While CSN2 genotype appears to exert minimal influence on milk yield and composition, β-casein variants are known to affect several technologically relevant properties, including casein micelle structure, heat stability, coagulation behaviour, and cheese-making performance [3,46,47]. Therefore, selection strategies focusing exclusively on the A2 allele may overlook favourable interactions with other milk protein loci. Multilocus approaches incorporating κ-casein (CSN3), β-lactoglobulin (BLG), and additional casein variants have shown positive effects on rennet coagulation and cheese-making traits in Holstein and Nordic dairy breeds [16,48,49,50]. Integrating CSN2 genotype into broader genomic selection frameworks may enhance dairy processing quality without compromising production potential.
In addition to the association analyses, this study validated a direct PCR protocol for ear tissue and hair follicle samples. The direct PCR approach is presented here as a validated, practical workflow rather than as a novel molecular concept. The method showed complete concordance with conventional DNA extraction in the tested subset and produced reliable amplicons suitable for Sanger sequencing. Direct PCR approaches have been widely applied for rapid and cost-effective genotyping in livestock [23], underscoring their suitability for high-throughput CSN2 screening in large herds.
Previous studies have demonstrated that Sanger sequencing of CSN2 exon 7 enables the detection of multiple β-casein alleles beyond A1 and A2. Exon-7-based sequencing has been applied in Holstein and other dairy cattle populations, including European herds and Chinese Holstein populations, to characterize multi-allelic CSN2 variation and allele-frequency distributions [7,51]. These investigations primarily focused on descriptive population genetics and were generally based on smaller datasets, without integration of standardized milk production records.
In contrast, the present study extends exon-7 Sanger sequencing to a large, environmentally homogeneous commercial Holstein herd and integrates multi-allelic CSN2 genotyping with complete 305-day milk production and composition data, enabling genotype–phenotype association analyses under commercial production conditions. This multi-allelic resolution represents a key added value of the present study compared with earlier exon-7 sequencing reports.
Although Sanger sequencing served as a robust reference method and enabled simultaneous detection of multiple exon-7 alleles in this study, it may represent a throughput and cost bottleneck for routine large-scale A1/A2 screening. In practical breeding applications, the validated direct-lysate workflow could be readily combined with higher-throughput genotyping platforms, such as allele-specific PCR/ARMS-PCR, KASP assays, or real-time PCR/TaqMan systems, to reduce per-sample cost and turnaround time when only the A1/A2 SNP is targeted.
A limitation of the present study is its reliance on a single, intensively managed herd. Although this uniformity reduced environmental noise and strengthened the precision of genotype–phenotype inference, the results may not fully represent the diversity of production systems or genetic backgrounds within the wider Holstein population. Therefore, caution is warranted when extrapolating these findings beyond comparable large-scale, intensively managed Holstein herds. Nevertheless, the large sample size, consistent management, and dual-method genotyping add robustness to the conclusions.
In summary, the present study demonstrates that sustained selection for the A2 β-casein allele in a large, intensively managed Holstein–Friesian herd does not result in any biologically meaningful changes in milk yield or composition. Although several genotype effects reached statistical significance, all estimated effect sizes were very small (partial η2 < 0.01), indicating that CSN2 variation explains only a trivial proportion of phenotypic variance compared with major production determinants such as lactation stage, age at calving, and individual cow effects. Given the large sample size, these statistically significant effects are likely to reflect high statistical power rather than biologically meaningful genotype-driven differences. These findings support the conclusion that A2-oriented breeding programs can be implemented without compromising productivity, and that decisions regarding A2 milk production are primarily driven by market demand and consumer preference rather than by expected gains or losses in production performance. Together with the validated, cost-efficient genotyping workflow, this work provides robust empirical evidence to support informed A2 selection strategies in modern dairy cattle breeding.
5. Conclusions
This study provides a comprehensive update on the distribution of β-casein (CSN2) alleles in the Hungarian Holstein-Friesian population and confirms that the A2 variant has become predominant in recent years. Despite this directional shift, the CSN2 locus retained moderate genetic diversity, indicating that further increases in A2 allele frequency can likely be achieved without compromising overall variability.
Although several genotype–trait associations reached statistical significance, all corresponding effect sizes were very small, and the only significant difference detected in the raw descriptive statistics (fat yield) did not persist once mixed-effects modelling was applied. Taken together, these findings indicate that CSN2 variation exerts negligible influence on 305-day milk yield or basic milk composition under the tested herd and management conditions, suggesting that ongoing selection toward A2 milk is unlikely to have adverse consequences for standard production traits.
Finally, the direct PCR approach evaluated in this study proved to be a rapid, reliable, and cost-efficient method for routine CSN2 genotyping, supporting its practical implementation in breeding programs aiming to expand functional milk variants.
Supplementary Materials
The following supporting information can be downloaded at: https://www.mdpi.com/article/10.3390/dairy7010012/s1, Method S1: Modified Direct PCR workflow for ear cartilage samples; Table S1: SNP positions defining CSN2 alleles within exon 7d and their coverage by the sequenced 547 bp fragment; Figure S1: Direct PCR amplification from ear cartilage and hair follicle lysates; Table S2: Hardy–Weinberg equilibrium (HWE) including all five CSN2 alleles based on an exact test; Method S2: Detailed specification and diagnostics of linear mixed-effects models; Figure S2: DHARMa residual diagnostics for linear mixed-effects models; Table S3: FDR-adjusted p-values for genotype effects; Table S4: Distribution of complete 305-day lactation records per cow included in the association analysis; Table S5: Functional milk-type frequencies based on CSN2 genotypes; Table S6: Type III ANOVA results from linear mixed models for all traits; Table S7: Tukey-adjusted pairwise comparisons of estimated marginal means for CSN2 genotype; Table S8: Fixed-effect estimates from linear mixed-effects models evaluating the association between CSN2 genotype and milk production and composition traits; Figure S3: Representative Sanger sequencing chromatograms of rare CSN2 exon 7 alleles detected in the study population.
Author Contributions
Conceptualization, V.S. and G.H.; Methodology, L.S., P.Á.F., K.N. and S.B.; Validation, M.G.S., Á.B. and F.P.; Formal analysis, L.S. and V.S.; Investigation, L.S., V.S., P.Á.F., A.C.A.; K.N. and S.B.; Resources, P.P., S.Á., V.S., G.H. and M.G.S.; Data curation, L.S., M.G.S., V.S., G.H., Á.B. and F.P.; Writing—original draft preparation, L.S.; Writing—review and editing, L.S., V.S. and G.H.; Visualization, L.S. and V.S.; Supervision, P.P., M.G.S. and V.S.; Project administration, S.Á., K.N. and P.Á.F.; Funding acquisition, P.P. and S.Á. All authors have read and agreed to the published version of the manuscript.
Funding
This research was supported by the MATE project 2020-1.1.2-PIACI-KFI-2021-00305 (“The development of technologies supporting the production of industrial milk, which is widely accepted from the point of view of nutritional physiology, with molecular biological tools”).
Institutional Review Board Statement
All procedures involving animals were conducted in accordance with Hungarian national legislation. Ethical approval for the use of biological samples and production data was obtained from the Institutional Animal Welfare Body of the Hungarian University of Agriculture and Life Sciences, Szent István Campus (MATE SZIC MÁB; approval issued 10 July 2024). According to the official certification, the study is outside the scope of EU Directive 2010/63/EU and therefore did not require an experimental animal permit.
Informed Consent Statement
Informed consent was obtained from the farm owners for sample collection and use of production records.
Data Availability Statement
The original contributions presented in this study are included in the article/Supplementary Materials. Further inquiries can be directed to the corresponding author.
Acknowledgments
The authors thank the staff of the cooperating Holstein farms for their assistance with sample collection and data provision. The authors are grateful to Dániel Fodor, farm manager, for his support in organizing the sample collection logistics. The authors also acknowledge the helpful comments received during language editing and statistical review. This work was supported by the National Research, Development and Innovation Office of the Hungarian Government (grant no. RRF-2.3.1-21-2022-00007, Agribiotechnology and Precision Breeding for Food Security National Laboratory) and by the Flagship Research Groups Programme of the Hungarian University of Agriculture and Life Sciences (Flagship Research Groups 2026).
Conflicts of Interest
The authors declare no conflicts of interest. The funders had no role in the design of the study; in the collection, analyses, or interpretation of data; in the writing of the manuscript; or in the decision to publish the results.
References
- Smirnova, A.; Konoplev, G.; Mukhin, N.; Stepanova, O.; Steinmann, U. Milk as a complex multiphase polydisperse system: Approaches for the quantitative and qualitative analysis. J. Compos. Sci. 2020, 4, 151. [Google Scholar] [CrossRef]
- Davoodi, S.H.; Shahbazi, R.; Esmaeili, S.; Sohrabvandi, S.; Mortazavian, A.; Jazayeri, S.; Taslimi, A. Health-related aspects of milk proteins. Iran. J. Pharm. Res. 2016, 15, 573. [Google Scholar] [PubMed] [PubMed Central]
- Farrell, H.M.; Jimenez-Flores, R.; Bleck, G.T.; Brown, E.M.; Butler, J.E.; Creamer, L.K.; Hicks, C.L.; Hollar, C.M.; Ng-Kwai-Hang, K.F.; Swaisgood, H.E. Nomenclature of the proteins of cows’ milk—Sixth revision. J. Dairy Sci. 2004, 87, 1641–1674. [Google Scholar] [CrossRef] [PubMed]
- Kamiński, S.; Cieślińska, A.; Kostyra, E. Polymorphism of bovine beta-casein and its potential effect on human health. J. Appl. Genet. 2007, 48, 189–198. [Google Scholar] [CrossRef] [PubMed]
- Caroli, A.M.; Chessa, S.; Erhardt, G.J. Invited review: Milk protein polymorphisms in cattle: Effect on animal breeding and human nutrition. J. Dairy Sci. 2009, 92, 5335–5352. [Google Scholar] [CrossRef]
- Sebastiani, C.; Arcangeli, C.; Ciullo, M.; Torricelli, M.; Cinti, G.; Fisichella, S.; Biagetti, M. Frequencies evaluation of β-casein gene polymorphisms in dairy cows reared in Central Italy. Animals 2020, 10, 252. [Google Scholar] [CrossRef] [PubMed]
- Masella, E.; Piva, S.; Giacometti, F.; Liuzzo, G.; Serraino, A. Evaluation of bovine β-casein polymorphism in two dairy farms located in northern Italy. Ital. J. Food Saf. 2017, 6, 6904. [Google Scholar] [CrossRef]
- Sacchi, P.; Chessa, S.; Budelli, E.; Bolla, P.; Ceriotti, G.; Soglia, D.; Rasero, R.; Cauvin, E.; Caroli, A.M. Casein haplotype structure in five Italian goat breeds. J. Dairy Sci. 2005, 88, 1561–1568. [Google Scholar] [CrossRef]
- Jinsmaa, Y.; Yoshikawa, M. Enzymatic release of neocasomorphin and β-casomorphin from bovine β-casein. Peptides 1999, 20, 957–962. [Google Scholar] [CrossRef]
- Bell, S.J.; Grochoski, G.T.; Clarke, A.J. Health implications of milk containing β-casein with the A2 genetic variant. Crit. Rev. Food Sci. Nutr. 2006, 46, 93–100. [Google Scholar] [CrossRef]
- Cieślińska, A.; Fiedorowicz, E.; Rozmus, D.; Sienkiewicz-Szłapka, E.; Jarmołowska, B.; Kamiński, S. Does a little difference make a big difference? Bovine β-casein A1 and A2 variants and human health—An update. Int. J. Mol. Sci. 2022, 23, 15493. [Google Scholar] [CrossRef]
- Daniloski, D.; Cunha, N.M.D.; McCarthy, N.A.; O’Callaghan, T.F.; McParland, S.; Vasiljevic, T. Health-related outcomes of genetic polymorphism of bovine β-casein variants. Trends Food Sci. Technol. 2021, 111, 233–248. [Google Scholar] [CrossRef]
- Giribaldi, M.; Lamberti, C.; Cirrincione, S.; Giuffrida, M.G.; Cavallarin, L. A2 milk and BCM7 peptide as emerging parameters of milk quality. Front. Nutr. 2022, 9, 842375. [Google Scholar] [CrossRef] [PubMed]
- Thiruvengadam, M.; Venkidasamy, B.; Thirupathi, P.; Chung, I.; Subramanian, U. β-casomorphin: A complete health perspective. Food Chem. 2021, 337, 127765. [Google Scholar] [CrossRef] [PubMed]
- He, M.; Sun, J.; Jiang, Z.Q.; Yang, Y.X. Effects of cow’s milk beta-casein variants on symptoms of milk intolerance in Chinese adults. Nutr. J. 2017, 16, 72. [Google Scholar] [CrossRef]
- Cendron, F.; Franzoi, M.; Penasa, M.; De Marchi, M.; Cassandro, M. Effects of β- and κ-casein, and β-lactoglobulin genotypes on milk composition and coagulation properties of Italian Holsteins. Ital. J. Anim. Sci. 2021, 20, 2243–2253. [Google Scholar] [CrossRef]
- Priyashantha, H.; Jayathissa, I.S.; Jayarathna, S.; Senaratna, D.; Narayana, N.; Vidanarachchi, J.K. Role of A2 milk in rural transformations. Dairy Sci. Manag. 2025, 2, 11. [Google Scholar] [CrossRef]
- Manuelian, C.L.; Such, X.; Juan, B.; Milán, M.J. Is there a potential market for A2 milk? Consumer perception of dairy production and consumption. Foods 2025, 14, 2567. [Google Scholar] [CrossRef] [PubMed]
- Antonopoulos, D.; Vougiouklaki, D.; Laliotis, G.P.; Tsironi, T.; Valasi, I.; Chatzilazarou, A.; Houhoula, D. Identification of polymorphisms of the CSN2 gene encoding β-casein in Greek local breeds of cattle. Vet. Sci. 2021, 8, 257. [Google Scholar] [CrossRef]
- Safa, M.A.; Mou, M.A.; Hridoy, M.F.A.; Siddiqua, S.A.; Bhuiyan, A.K.F.H.; Bhuiyan, M.S.A. Analysis of β-casein gene for A1 and A2 allelic variants in Holstein–local crossbred cattle using allele-specific PCR. J. Anim. Biotechnol. 2024, 7, 74. [Google Scholar] [CrossRef]
- Pabitra, M.H.; Maruf, T.M.; Mony, S.I.; Ebnat, R.; Hoque, M.R.; Bhuiyan, M.S.A. Molecular characterization and A1/A2 genotyping of casein beta gene in Zebu and crossbred cattle of Bangladesh. Czech J. Anim. Sci. 2022, 67, 318–326. [Google Scholar] [CrossRef]
- Royo, L.J.; Del Cerro, A.; Vicente, F.; Carballal, A.; de la Roza-Delgado, B. An accurate high-resolution melting method to genotype bovine β-casein. Eur. Food Res. Technol. 2014, 238, 295–298. [Google Scholar] [CrossRef]
- Chum, P.Y.; Haimes, J.D.; André, C.P.; Kuusisto, P.K.; Kelley, M.L. Genotyping of plant and animal samples without prior DNA purification. J. Vis. Exp. 2012, 67, e3844. [Google Scholar] [CrossRef]
- International Committee for Animal Recording (ICAR). ICAR Recording Guidelines; ICAR: Rome, Italy, 2018. [Google Scholar]
- Kamiński, S.; Ruść, A.; Cieślińska, A. A note on frequency of A1 and A2 variants of bovine beta-casein locus in Polish Holstein bulls. J. Anim. Feed Sci. 2006, 15, 195–198. [Google Scholar] [CrossRef]
- Nei, M. Analysis of gene diversity in subdivided populations. Proc. Natl. Acad. Sci. USA 1973, 70, 3321–3323. [Google Scholar] [CrossRef]
- Botstein, D.; White, R.L.; Skolnick, M.; Davis, R.W. Construction of a genetic linkage map in man using RFLPs. Am. J. Hum. Genet. 1980, 32, 314–331. [Google Scholar]
- Wright, S. Evolution and the genetics of populations. In Variability Within and Among Natural Populations; University of Chicago Press: Chicago, IL, USA, 1978; Volume 4. [Google Scholar]
- Bates, D.; Mächler, M.; Bolker, B.; Walker, S. Fitting linear mixed-effects models using lme4. J. Stat. Softw. 2015, 67, 48. [Google Scholar] [CrossRef]
- Lüdecke, D.; Ben-Shachar, M.S.; Patil, I.; Waggoner, P.; Makowski, D. Performance: Assessment of Regression Models; R Foundation for Statistical Computing: Vienna, Austria, 2021. [Google Scholar]
- Hartig, F. DHARMa: Residual Diagnostics for Hierarchical (Multi-Level/Mixed) Regression Models, R Package Version 0.4.5; R Foundation for Statistical Computing: Vienna, Austria, 2022. [Google Scholar]
- Kuznetsova, A.; Brockhoff, P.B.; Christensen, R.H.B. lmerTest package: Tests in linear mixed effects models. J. Stat. Softw. 2017, 82, 1–26. [Google Scholar] [CrossRef]
- Lenth, R.V. Emmeans: Estimated Marginal Means, Aka Least-Squares Means, R package version 1.6.3; R Foundation for Statistical Computing: Vienna, Austria, 2021. [Google Scholar]
- Benjamini, Y.; Hochberg, Y. Controlling the false discovery rate: A practical and powerful approach to multiple testing. J. R. Stat. Soc. B 1995, 57, 289–300. [Google Scholar] [CrossRef]
- Ben-Shachar, M.S.; Lüdecke, D.; Makowski, D. effectsize: Estimation of effect size indices and standardized parameters. J. Open Source Softw. 2020, 5, 2815. [Google Scholar] [CrossRef]
- Nakagawa, S.; Schielzeth, H. A general and simple method for obtaining R2 from generalized linear mixed-effects models. Methods Ecol. Evol. 2013, 4, 133–142. [Google Scholar] [CrossRef]
- Miluchová, M.; Gábor, M.; Candrák, J. The effect of the genotypes of the CSN2 gene on test-day milk yields in the Slovak Holstein cow. Agriculture 2023, 13, 154. [Google Scholar] [CrossRef]
- Ardıçlı, S.; Aldevir, O.; Aksu, E.; Gumen, A. The variation in the beta-casein genotypes and its effect on milk yield and genomic values in Holstein-Friesian cows. Anim. Biotechnol. 2023, 34, 4116–4125. [Google Scholar] [CrossRef]
- Morris, C.A.; Hickey, S.M.; Cullen, N.G.; Prosser, C.G.; Anderson, R.M.; Tate, M.L. Associations between β-casein genotype and milk yield and composition in grazing dairy cows. N. Z. J. Agric. Res. 2005, 48, 441–450. [Google Scholar] [CrossRef]
- Ristanić, M.; Glavinić, U.; Vejnović, B.; Maletić, M.; Kirovski, D.; Teodorović, V.; Stanimirović, Z. β-casein polymorphism and milk traits in Serbian Holsteins. Acta Vet. Beogr. 2020, 70, 497–510. [Google Scholar] [CrossRef]
- Crow, J.F.; Kimura, M. An Introduction to Population Genetics Theory; Harper & Row: New York, NY, USA, 1970. [Google Scholar]
- Nielsen, R.; Slatkin, M. An Introduction to Population Genetics; Sinauer Associates: Sunderland, MA, USA, 2017. [Google Scholar]
- Ardıçlı, S.; Samli, H.; Vatansever, B.; Soyudal, B.; Dincel, D.; Balci, F. Candidate genes and performance in Holstein bulls. Arch. Anim. Breed. 2019, 62, 9–32. [Google Scholar] [CrossRef]
- Boichard, D.; Guillaume, F.; Baur, A.; Croiseau, P.; Rossignol, M.N.; Boscher, M.Y.; Fritz, S. Genomic selection in French dairy cattle. Anim. Prod. Sci. 2012, 52, 115–120. [Google Scholar] [CrossRef]
- Oleński, K.; Cieślińska, A.; Suchocki, T.; Szyda, J.; Kamiński, S. Polymorphism in coding and regulatory sequences of beta-casein gene is associated with milk production traits in Holstein-Friesian cattle. Anim. Sci. Pap. Rep. 2012, 30, 5–12. [Google Scholar]
- Fox, P.F.; McSweeney, P.L.H. Dairy Chemistry and Biochemistry; Springer: Cham, Switzerland, 2017. [Google Scholar]
- Hallén, E.; Wedholm, A.; Andrén, A.; Lundén, A. CSN2–CSN3–BLG genotypes and protein variants. J. Anim. Breed. Genet. 2008, 125, 119–129. [Google Scholar] [CrossRef]
- Bisutti, V.; Pegolo, S.; Giannuzzi, D.; Mota, L.F.M.; Vanzin, A.; Toscano, A.; Trevisi, E.; Ajmone Marsan, P.; Brasca, M.; Cecchinato, A. A2 allele: Protein profile and coagulation. J. Dairy Sci. 2022, 105, 3794–3809. [Google Scholar] [CrossRef]
- Gustavsson, F.; Buitenhuis, A.J.; Johansson, M.; Bertelsen, H.P.; Glantz, M.; Poulsen, N.A.; Lindmark Månsson, H.; Stålhammar, H.; Larsen, L.B.; Bendixen, C.; et al. Breed and casein effects on milk protein profile. J. Dairy Sci. 2014, 97, 3864–3877. [Google Scholar] [CrossRef] [PubMed]
- Walstra, P.; Wouters, J.T.M.; Geurts, T.J. Dairy Science and Technology; CRC Press: Boca Raton, FL, USA, 2006. [Google Scholar] [CrossRef]
- Dai, R.; Fang, Y.; Zhao, W.; Liu, S.; Ding, J.; Xu, K.; Yang, L.; He, C.; Ding, F.; Meng, H. Identification of alleles and genotypes of beta-casein with DNA sequencing analysis in Chinese Holstein cow. J. Dairy Res. 2016, 83, 312–316. [Google Scholar] [CrossRef] [PubMed]


Disclaimer/Publisher’s Note: The statements, opinions and data contained in all publications are solely those of the individual author(s) and contributor(s) and not of MDPI and/or the editor(s). MDPI and/or the editor(s) disclaim responsibility for any injury to people or property resulting from any ideas, methods, instructions or products referred to in the content. |
© 2026 by the authors. Licensee MDPI, Basel, Switzerland. This article is an open access article distributed under the terms and conditions of the Creative Commons Attribution (CC BY) license.