Abstract
Kefir grains, originating from the Caucasus, are irregularly shaped, semi-solid granules resembling popcorn or cauliflower (0.3 to 3.5 cm), composed of bacteria and fungi embedded in extracellular polysaccharides such as kefiran. In this study, kefir samples were produced using different ratios of goat’s and cow’s milk (100:0, 75:25, 50:50, 25:75, and 0:100) to examine microbial populations, physicochemical and volatile properties, rheological behaviour, antioxidant capacity, and organic acid content. The type of milk used significantly affected the chemical composition and pH (p < 0.05), although titratable acidity remained stable during storage. Increasing the proportion of goat’s milk decreased viscosity but enhanced the total free amino acid (FAA) content. Goat milk kefir exhibited stronger antioxidant activity than cow milk kefir due to the formation of bioactive peptides and FAAs through proteolysis, with the highest values observed in samples with a higher proportion of goat’s milk and the lowest in 100% cow’s milk kefir. Organic acid levels increased during fermentation and, in 100% goat milk kefir, lactic, acetic, propionic, hippuric, butanoic, and citric acids reached their highest concentrations. The diversity and intensity of volatile compounds also increased proportionally with the goat milk ratio. In conclusion, considering antioxidant activity, volatile aroma components, organic acid content, sensory properties, and viscosity values, sample D, which is 75% goat milk kefir, is recommended for consumers.
1. Introduction
Kefir grains are a traditional starter culture from the Caucasus and Eastern Europe, containing a symbiotic and complex mixture of bacteria and fungi such as lactic acid bacteria, acetic acid bacteria [1,2]. Kefir is a fermented milk drink with a sour taste and slight alcohol content, its name coming from the Turkish word “kef,” meaning “pleasant taste.” It is traditionally made by fermenting cow’s or goat’s milk with kefir grains under mesophilic conditions, producing an acidic, mildly alcoholic beverage [3]. High-quality kefir exhibits a pourable consistency with effervescence due to small gas bubbles. It is a naturally carbonated beverage with a distinctive and pleasant aroma, resulting from a mixture of lactic acid, ethanol, carbon dioxide, acetaldehyde, and acetoin etc. This unique flavor profile arises from the symbiotic metabolic activities of various bacterial and yeast species [4]. Traditional kefir production begins by adding small (0.3–3.5 cm in diameter), irregularly shaped, yellowish-white kefir grains to fresh milk. These grains primarily consist of proteins and polysaccharides and harbor a complex microflora. Lactic acid bacteria (LAB) and yeasts coexist in a symbiotic relationship, being responsible for lactic acid and alcoholic fermentation, respectively [5].
Kefir can be produced using different animal milks, and due to the unique composition and physical properties of each milk, the resulting kefirs vary in both content and sensory qualities. Goat milk has a higher protein content than cow milk, with approximately 71–75% casein, 20–22% serum proteins, and 7% non-protein nitrogen compounds. While both types of milk contain similar amounts of κ-casein (10–24%) and αs2-casein (5–19%), goat milk has a higher proportion of β-casein (42–64%) and a lower proportion of αs1-casein [6]. Because αs1-casein, a key protein in cow’s milk, plays a decisive role in curd formation, the curd formed in goat’s milk exhibits a softer texture than that of cow’s milk, even though it has a similar casein micelle count, due to the weight of αs2-casein. A study examining the impact of these differences in milk composition on kefir fermentation compared lactic acid bacteria and yeast populations in kefirs produced from cow, sheep, and goat milk, and revealed that the type of milk used can affect the development of kefir microflora and product quality [7]. Gürel et al. [8] evaluated the effects of adding skim milk powder, whey powder, and inulin to kefirs produced from goat and cow’s milk, noting that goat’s milk kefirs have lower viscosity than cow’s milk kefirs. It has been reported that cow’s milk with different fat content and varying amounts of kefir grain used significantly affect the rheological properties of kefir, thus affecting the flow and texture of the product [9]. Another study has shown that animal feeding habits and different goat breeds are important parameters determining the functional properties of kefir [10].
Kefir is widely recognized as an excellent source of probiotics with potential health benefits. Most studies on kefir have focused on milk substrates derived from cow, sheep, goat, or other animal sources [11,12,13]. In recent years, goat milk has attracted increasing attention due to its hypoallergenic properties and high digestibility [14]. It is also known for its therapeutic value in medicine and human nutrition. However, compared to cow’s milk, it has been significantly less studied. The use of goat milk in kefir production has significant effects on the product’s quality, nutritional value, and microflora. The combination of different types of milk can enhance the functional properties of kefir and appeal to a broader consumer profile. The use of cow’s and goat’s milk together in kefir production has been shown to increase the antioxidant capacity of the product and improve its rheological properties [8]. The use of a mixture of skimmed cow’s milk and goat’s milk has increased the acidic content of kefir and improved its organoleptic properties [15]. The microbial and chemical characteristics of kefir may vary depending on the fermentation medium and the production methodology in different countries. The antioxidant activities of goat’s milk kefir were evaluated by measuring total phenolic content, DPPH free radical scavenging activity, ferric reducing antioxidant power (FRAP), and ABTS radical scavenging capacity. The results of studies performed by Baniasadi et al. [16] showed that goat milk kefir has a high antioxidant capacity.
In the present study, kefir was produced by fermenting cow’s and goat’s milk with kefir grains, and the effects of the fermentation substrate on the sensory, antioxidant, and flavor properties of the final product were investigated. The aim of this research is to evaluate how the type of milk effects on volatile composition, proteolytic activity, and antioxidant capacity of kefir produced from cow and goat milk using kefir grains.
2. Materials and Methods
2.1. Kefir Grains and Maintenance
Before using for samples production, kefir grains were inoculated into reconstituted skimmed milk, and subsequently incubated at 25 °C. To promote growth, the grains were transferred to fresh medium three times per week.
2.2. Preparation of Kefir Samples
Kefir was prepared by inoculating milk with 2% (w/v) kefir grains. The milk mixtures used for fermentation consisted of goat’s and cow’s milk in ratios of 100:0 (A), 75:25 (B), 50:50 (C), 25:75 (D), and 0:100 (E). Before inoculation, all mixtures were pasteurized at 90 °C for 2 min and cooled to room temperature. Fresh kefir grains (2% w/v) were added and incubated (Sartorius, Sedim Biotech Certomat® IS, Göttingen, Germany) at 23 ± 0.5 °C until the pH reached 4.6 [8,17], measured with a pH meter. Each group reached pH 4.6 at some point during the 20–24 h. After fermentation, kefir grains were separated by sieving and reused for new cultures. Kefir samples were stored at 4 °C for 10 days, with analyses performed on days 1 and 10 in duplicate.
2.3. Gross Chemical Composition and Proteolysis
Total solids were measured by oven-drying at 102 ± 2 °C. Fat content was determined using the Gerber method, protein by the Kjeldahl method, and ash by incineration at 560 °C. pH was measured with a Mettler Toledo Seven Compact pH meter. Proteolytic activity by RP-HPLC and total free amino acid (FAA) content were monitored according to Sahingil et al. [18] and Gümüş and Hayaloğlu [19], respectively.
2.4. Microbiological Counts
Microbial counts (aerobic plate counts, lactobacilli, lactococci, coliforms, yeasts and moulds) were monitored over 10 days. Ten grams of kefir were homogenized in 90 mL of 2% sodium citrate buffer and diluted in 0.1% peptone water. Lactococci were plated on M17 agar (37 °C, 24 h), lactobacilli on MRS agar anaerobically (30 °C, 24–48 h), yeasts and moulds on PDA (25 °C, 5–7 days), aerobic mesophiles on PCA (30–32 °C, 72 h), and coliforms on VRBA according to Mutlu et al. [20].
2.5. Organic Acids
Organic acid concentrations in kefir samples were determined using a modified method from Tekin et al. [21] Five grams of each sample were mixed with 10 mL of 0.05 N H2SO4 (Solvent A) and homogenized at 13,500 rpm for 20 s. The homogenates were centrifuged at 15,000 rpm for 20 min, and 1 mL of the supernatant was filtered through a 0.45 μm membrane into HPLC vials. Each sample was analyzed at least in duplicate. A 10 μL aliquot was injected into an ROA organic acid column (300 × 7.8 mm) at 0.5 mL min−1. Standards were prepared similarly for external calibration, and organic acids were identified by comparing retention times with those of the standards.
2.6. Determination of Antioxidant Capacity
The antioxidant activity of kefir samples was assessed using ABTS (3-ethylbenzothiazoline-6-sulfonic acid) and 2,2-diphenyl-1-picrylhydrazyl (DPPH) assays with the pH 4.6 soluble nitrogen (SN) fraction. For the ABTS assay, 100 μL of extract was mixed with 2400 μL of ABTS•+ solution, incubated for 10 min, and absorbance was measured at 734 nm (Shimadzu UV-1800, Shimadzu Corporation, Kyoto, Japan). For the DPPH assay, absorbance was measured at 517 nm against methanol, with results similarly expressed using Trolox standards (0–80 ppm). Results were expressed as mg Trolox equivalents per 100 mL (mg TE/100 mL), based on a Trolox calibration curve (1–100 ppm).
2.7. Headspace Analysis of Volatiles
Volatiles were analysed by solid-phase microextraction gas chromatography–mass spectrometry (SPME-GC-MS; Shimadzu QP 2010, Shimadzu Corporation, Kyoto, Japan), following Tekin et al. [21] Compounds were identified by matching mass spectra to the Wiley 7 (7th edition; John Wiley & Sons Inc., New York, NY, USA, 2005) and NIST/EPA/NIH databases (http://www.nist.gov), with retention times confirmed by 33 authentic standards (Sigma Chemical Co., St. Louis, MO, USA). Quantification used 2-methyl-3-heptanone as an internal standard (81 ppm in methanol). Results are expressed as μg per 100 g of kefir.
2.8. Rheological Characterization
Rotational test measurements were performed using a plate–plate geometry (25 mm diameter, PP25-SN24214) with a 0.5 mm gap using an Anton Paar MCR 301 rheometer. A logarithmic shear-rate sweep in the range of 0.01–10 s−1 was applied 5 °C temperature, and the viscosity was determined as a function of shear rate. The data to the Herschel–Bulkley model:
where = shear stress, τ0 = yield stress, = consistency coefficient, = shear rate, = flow index.
2.9. Sensory Analysis
A trained panel evaluated kefir samples for foaming, appearance, odour, taste, off-flavours, mouthfeel, viscosity, sourness, sweetness, overall impression, and hedonic score (1–10). Samples stored at 4–5 °C for 1 and 10 days were tested in two sessions for each storage time. Five kefir types were presented, with palate cleansers (water, bread) provided between samples. Seven trained panelists from Inönü University (Malatya, Türkiye) conducted the evaluation. According to the practices of Inönü University, a separate consent form is not required for this type of sensory evaluation. The participants took part voluntarily, and they were informed that they could withdraw from the study at any time without any consequences.
2.10. Statistical Analysis
Data were analyzed with SPSS v9 (SPSS Inc., Chicago, IL, USA) using one-way ANOVA and Duncan’s Multiple range test for significance at p < 0.05. Kefir trials were conducted in duplicate. Volatile compound data underwent heatmap and o-PLSDA component analysis (o-PLSDA) and correlation analysis using a software (MetaboAnalyst6.0) for multivariate evaluation.
3. Results and Discussion
3.1. Gross Chemical Composition and Proteolysis
Kefir produced from goat’s milk exhibited higher total solids, fat, and protein contents compared to cow’s milk counterparts. These values increased proportionally with the increasing proportion of goat milk in the milk mixtures used for kefir production. This trend can be attributed to the inherently higher concentrations of total solids, fat, and protein in goat’s milk relative to cow’s milk. Specifically, goat’s milk contains higher for 3.51 g/100 g (total solids), 2.05 g/100 g (fat), 0.19 g/100 g (protein), and 0.13 g/100 g (ash) than cow’s milk (Table 1). These compositional differences support previous findings indicating that goat milk consistently exhibits higher ash and protein levels compared to cow’s milk [22,23]. Furthermore, kefir samples produced with higher proportions of goat’s milk also showed increased total solids and fat contents. A significant effect of milk type on total solid content was observed (p < 0.05), highlighting the critical role of milk composition in determining the nutritional characteristics of the final product. The pH of goat’s milk was slightly lower and its titratable acidity was higher compared to cow’s milk (Table 1). Similarly, kefir produced from goat’s milk exhibited higher titratable acidity during storage than cow’s milk kefir.

Table 1.
Chemical composition of raw goat’s and cow’s milk and 1 day-old kefir.
As shown in Figure 1a, the use of different milk types significantly affected the pH and titratable acidity of kefir samples after 10 days of storage (p < 0.05). Despite differences in milk type, all kefir samples reached comparable final pH values between 4.3 and 4.4 after 24 h, consistent with previous reports [23,24]. The pH is a critical quality parameter in fermented dairy beverages as it directly influences microbial activity, flavor development and shelf life [25]. In the first day of storage, significant differences were found between the samples in terms of both pH and titratable acidity, and this inter-sample variation continued on the 10th day (p < 0.05). Samples A and B showed higher initial pH values, while samples D and E showed lower pH values. Although a decrease in pH was observed in all samples at the end of storage, this change in samples during the storage period was found to be statistically significant (p < 0.01). When titratable acidity values were examined, it was determined that samples D and E had higher initial acidity levels, while sample A showed a lower value. At the end of the storage period, an increase in titratable acidity occurred in all samples. The t-test analyses show that the changes in kefir samples throughout the storage days are statistically significant at the p < 0.01 level. Similarly, milk type had a significant influence on protein, total solids, fat, and fat-in-dry matter values of the kefir samples. These findings are in agreement with previous studies on kefir [23,26,27].
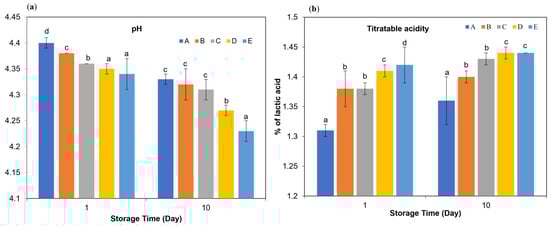
Figure 1.
pH (a) and titratable acidity (b) in kefir made using with cow’s and goat’s milk during storage. A: 100% cow’s milk; B: 75% cow’s milk + 25% goat’s milk; C: 50% cow’s milk + 50% goat’s milk; D: 25% cow’s milk + 75% goat’s milk; E: 100% goat’s milk. a–d Significant difference is present at the p < 0.05 level between groups marked with different superscripts.
Compositional differences between cow’s and goat’s milk, particularly in terms of fat globule size, fatty acid profile, and casein fraction distribution, may underlie the observed differences in both the rheological behavior and volatile compound profiles of kefir produced from these milks. Goat’s milk is rich in medium-chain fatty acids and generally has smaller fat globules. These fat globules undergo enhanced lipolysis after fermentation, producing higher amounts of short- and medium-chain volatile fatty acids and related aroma compounds [28]. Unsaturated fatty acids are precursors of milk aromas. Acetic and lactic acids contribute to the acidic aroma, while butanic, hexanoic, and octanoic acids are responsible for the goat and cheese aromas. It has been reported that fat content can influence ketone concentration [29] and our study found that kefir samples with higher goat’s milk content had higher fat content, and the results confirmed a correspondingly higher total ketone content.
3.2. Microbiological Composition
Table 2 presents the mean changes in microbial counts observed during the fermentation and storage of the five different kefir batches. The total aerobic mesophilic bacterial counts showed a slight decrease by the end of the fermentation process in all samples except sample E. Coliform bacteria were not detected in any of the kefir samples, either fresh or stored, indicating good hygienic quality was maintained throughout production and storage. Statistical analysis revealed that the type of milk used had a significant effect (p < 0.05) on most microbial groups, except lactococci, which remained relatively stable at around 8 log10 cfu/g, consistent with the findings of Wang and Guo et al. [4] and Meral Aktaş et al. [9]. However, a decrease was observed during storage, particularly before day 10, which may be attributed to their sensitivity to low pH environments. Lactobacilli counts declined during storage across all samples, with the most significant reductions (approximately 2.0 log units) observed in samples A and E (p < 0.05). These results align with previous studies reporting similar reductions of around 1 log unit in lactobacilli populations during kefir storage [30]. Yeast populations were generally stable throughout the 10-day storage period, with mean counts around 105 cfu/g. No significant changes were observed between different milk types, except in sample E, which exhibited a minor fluctuation (p > 0.05). Lactobacilli counts in kefir samples ranged from 7.85 to 8.78 log10 cfu/g, total viable counts from 7.20 to 8.39 log10 cfu/g, and yeast counts from 4.61 to 5.56 log10 cfu/g.
Table 2.
Microbial counts (log cfu g−1) in kefir samples during storage.
Our microbial count data align with findings by Meral-Aktaş et al. [4], where kefirs produced from different animal milks exhibited distinct lactic bacteria, cocci, and yeast counts depending on milk origin—with goat milk kefir showing unique microbial dynamics during storage. Also, studies such as those by Ströher et al. [31] report that kefir grain–derived goat milk kefirs have significantly different volatile compound and microbial profiles compared to cow milk kefirs, confirming that milk type is a critical factor shaping kefir microbiota and fermentation outcomes.
3.3. Total Free Amino Acids
Lactic acid bacteria require a complex mixture of nutrients for optimal growth, including various amino acids. Since milk contains only limited amounts of free amino acids, the LAB rely on proteolytic systems to release amino acids and small peptides from milk proteins [32]. In the context of kefir, yeast metabolism may also contribute to this process by producing growth factors– such as amino acids and peptides– that support the growth of LAB [33]. Therefore, the concentration of total free amino acids (FAAs) detected in kefir samples at different time points can be considered the result of combined proteolytic activity from both bacteria and yeast present in the fermentation matrix. Levels of the total FAAs in the D and E kefir samples were significantly higher than in the other kefir samples (Figure 2). All kefir samples showed significantly higher levels of total FAAs after 10 days of ripening. These differences may be related to the varying protein content of the two milk types. In fermented milk products containing goat’s milk, especially kefir, the FAA content increases significantly during the fermentation process due to the breakdown of milk proteins (especially caseins) by microbial enzymes. Goat’s milk is more susceptible to proteolysis compared to cow’s milk due to its smaller casein micelles and different protein fractions [34]. This characteristic, combined with the proteolytic activity of starter cultures (e.g., Lactobacillus and Lactococcus species) in kefir, promotes the formation of more FAAs [35]. These FAAs not only provide nutritional value but also contribute to the antioxidant capacity, flavour profile, and biological activity of the product [34]. Therefore, kefir produced from goat’s milk stands out as a fermented milk product rich in both functional and bioactive components.
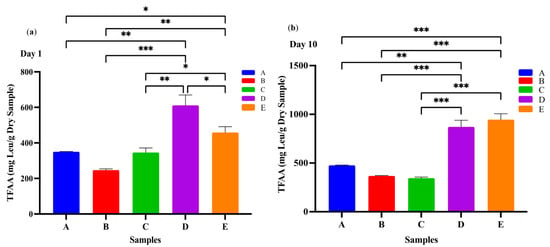
Figure 2.
Total free amino acids in kefir made using with cow and goat milk after day 1 (a) day 10 (b). A: 100% cow’s milk; B: 75% cow’s milk + 25% goat’s milk; C: 50% cow’s milk + 50% goat’s milk; D: 25% cow’s milk + 75% goat’s milk; E: 100% goat’s milk.*: p < 0.05; **: p < 0.01; ***: p < 0.001.
3.4. Peptide Profile by RP-HPLC
The RP-HPLC chromatograms of the water-soluble fractions of kefir samples after 1 and 10 days are shown in Figure 3a,b, respectively. In all kefir groups, four major peaks were identified at retention times of 18, 28, 36, and 68 min, along with four minor peaks at 26, 52, 56, and 58 min. By day 10, the peptide-related peaks became more pronounced, indicating increased proteolytic activity during storage. The chromatograms also showed that peak intensities were generally similar across all samples. However, subtle differences among the profiles may be attributed to variations in the type of milk used for kefir production. Some specific peptides eluting between 24 and 30 min were detected only in kefir containing goat milk, becoming visible in kefir C, D, and E at the end of storage, but not in kefir samples A and B (Figure 3a,b). The peak concentration at a retention time of 36 min increased in kefir D and E (with higher concentrations of goat milk) after 10 days of storage (Figure 3a,b). In general, peptides eluting at earlier retention times are typically characterized by low molecular weight and a hydrophilic nature [35]. In contrast, hydrophobic peptides, which elute later in the chromatogram, are more likely to be hydrolyzed into free amino acids (FAAs) by bacterial enzymatic activity [36,37]. In this study, the highest concentrations of total FAAs were observed in kefir samples D and E (Figure 2a,b), suggesting more extensive proteolysis, likely influenced by the milk type and microbial activity during fermentation and storage. One study found that goat milk kefir had a higher FAA concentration than cow’s milk kefir [38]. This increase results from the proteolysis process, which occurs when microorganisms hydrolyze milk proteins. The protein structure of goat’s milk differs from that of cow’s milk, particularly in its higher β-casein content. This difference makes goat’s milk more easily digestible and allows for the release of more free amino acids [39].
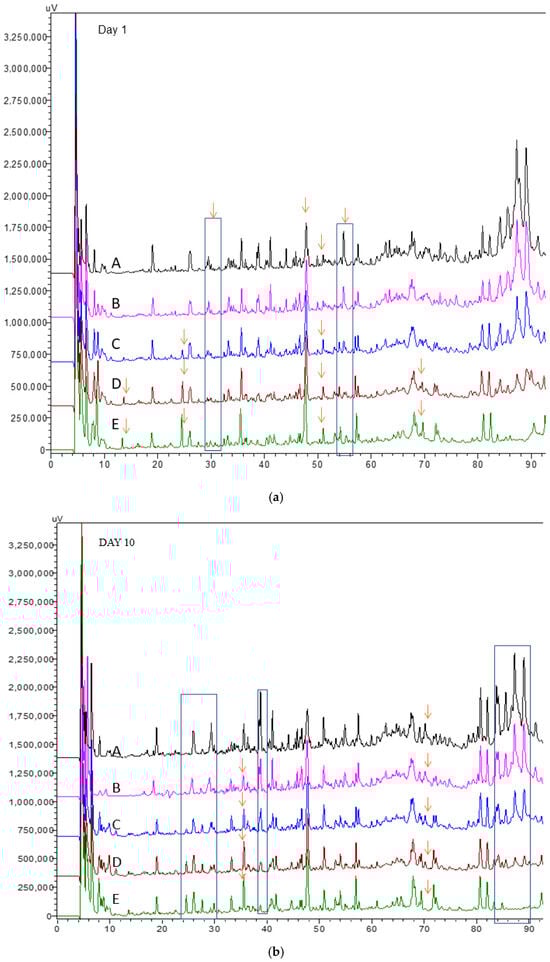
Figure 3.
RP-HPLC peptide profiles in kefir made using with cow’s and goat’s milk after day 1 (a) day10 (b). A: 100% cow milk; B: 75% cow’s milk + 25% goat’s milk; C: 50% cow’s milk + 50% goat’s milk; D: 25% cow’s milk + 75% goat’s milk; E: 100% goat’s milk. The arrows indicate that different samples have different peak heights at their respective retention times.
3.5. Organic Acids
Organic acids in dairy products may arise from the hydrolysis of milk fat (yielding free fatty acids), microbial metabolism, or other biochemical processes [40]. These compounds contribute to the refreshing taste, characteristic aroma, and texture of fermented dairy products, and play a crucial role in inhibiting the growth of spoilage and pathogenic microorganisms [31,41]. The production of organic acids, particularly lactic acid, is mainly associated with the fermentation of lactose through the hydrolysis of milk sugars by lactic acid bacteria present in kefir grains [42,43]. In this study, the highest concentrations of total organic acids were observed at the end of the fermentation process, especially in kefir samples produced with 100% goat milk. Lactic acid content increased significantly throughout the fermentation period, with the highest level detected in sample D after 10 days of storage. Acetic acid was also produced during fermentation, reaching a maximum concentration (Figure 4d). This is noteworthy, as both lactic and acetic acids contribute to the sensory qualities of kefir and help prevent the proliferation of undesirable microorganisms by lowering the pH [44]. Other organic acids, including propionic acid, hippuric acid, butanoic acid (except in sample A on day 10), and citric acid, were also identified in varying concentrations on both the 1st and 10th days of storage. These findings highlight the dynamic changes in organic acid composition during fermentation and underscore their importance in both flavour development and microbial stability of kefir.
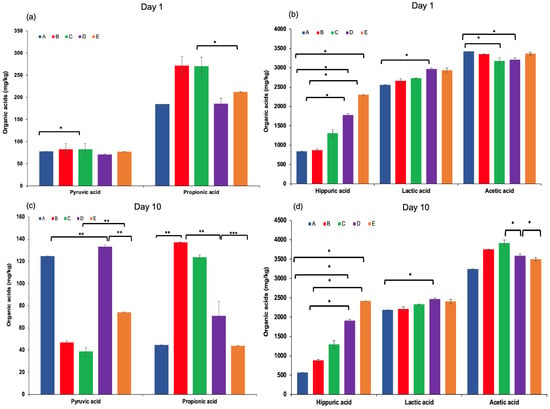
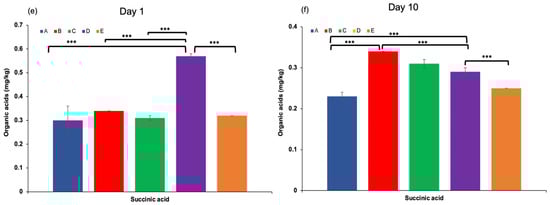
Figure 4.
Pyruvic and propionic acid levels (a,c), hippuric, lactic, and acetic acid levels (b,d), and succinic acid levels (e,f) in kefir samples measured on Day 1 and Day 10. A: 100% cow’s milk; B: 75% cow’s milk + 25% goat’s milk; C: 50% cow’s milk + 50% goat’s milk; D: 25% cow’s milk + 75% goat’s milk; E: 100% goat’s milk.*: p < 0.05; **: p < 0.01; ***: p < 0.001.
3.6. Antioxidant Capacity
The ability to scavenge proton radicals is considered one of the primary mechanisms by which antioxidant compounds exert their protective effects. Similar trends were observed in both methods (inter-sample ranking and time-dependent change). In both the DPPH and ABTS assays, values on day 10 in all samples increased significantly compared to day 1 (p < 0.05). In the kefir samples, ABTS+● scavenging activity increased 1.5-fold compared to the initial activity. Goat’s milk kefir showed a higher antioxidant activity when compared to the cow’s milk kefir, and the levels of antioxidant activity were proportional to the levels of goat’s milk the formulation (Table 3).
Table 3.
Antioxidant capacity (mg TE/100 mL) in kefir samples during storage.
The antioxidant activity observed during fermentation may also be attributed to the proteolysis of milk proteins and the production of organic acids, both resulting from microbial metabolic processes [45]. This is likely related to the release of antioxidant peptides and amino acid compounds through proteolysis. In this study, the ABTS+* radical-scavenging activity of goat’s milk kefir was found to be significantly higher than that of cow’s milk kefir, suggesting that the observed antioxidant activity may be partially attributed to bioactive peptides derived from both goat’s and cow’s milk proteins. Samples E and D had the highest antioxidant activity in both methods, ABTS or DPPH. Sample A had the lowest values, indicating that these kefir samples have lower antioxidant content. In fermented dairy products such as kefir, the enzymatic breakdown of casein and whey proteins leads to the release of free amino acids and short peptides, which are known to possess strong radical-scavenging properties and contribute significantly to the total antioxidant capacity. As shown in Figure 2, kefir samples produced with goat’s milk had significantly higher levels of total FAA, which correlates with their enhanced antioxidant capacity. These findings are consistent with previous studies reporting elevated TFAA levels in fermented milk products made from goat milk [30,46].
Antioxidant activities in kefir samples were determined using the DPPH and ABTS methods on days 1 and 10. The correlations between the main organic acids in kefir and their antioxidant activities are presented in Figure 5b. It was observed that the antioxidant activities of the organic acids in kefir varied depending on the storage time. At the beginning of storage (Day 1), lactic acid and hippuric acid exhibited high positive correlations with DPPH and ABTS, while correlations with other acids showed lower or negative values. By day 10, both lactic acid and hippuric acid demonstrated high positive correlations with all three methods (DPPH and ABTS). Hippuric acid, which is a significant concentration in goat milk, increases with increasing goat milk content (Figure 5a), indicating that its concentration increases antioxidant capacity. Conversely, correlations for succinic acid and pyruvic acid were generally low and variable. These results confirm that compositional differences and microbiological activities, which depend on the type of milk used, increase the antioxidant capacity by enhancing organic acid production.
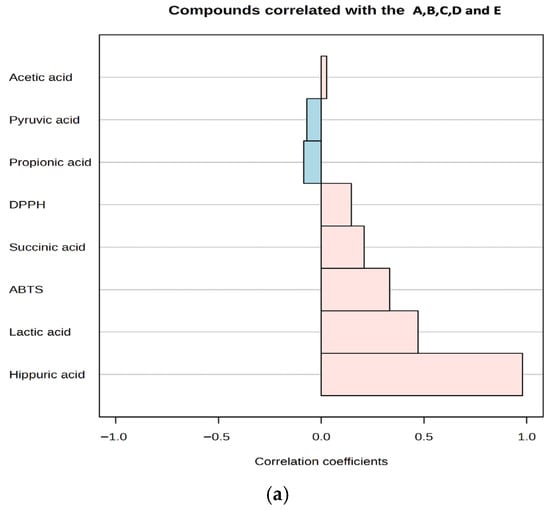
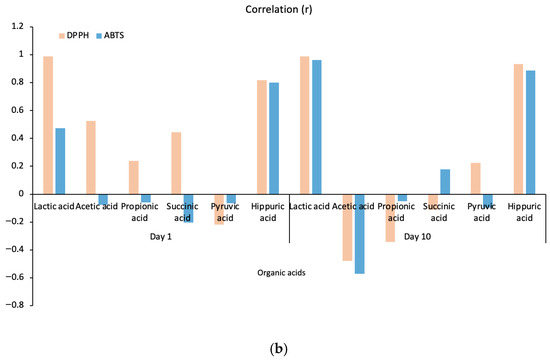
Figure 5.
A plot for organic acids and antioxidant activity correlated with kefir samples (a), A plot for organic acids correlated with antioxidant activity after storage days 1 and 10 (b). A: 100% cow’s milk; B: 75% cow’s milk + 25% goat’s milk; C: 50% cow’s milk + 50% goat’s milk; D: 25% cow’s milk + 75% goat’s milk; E: 100% goat’s milk. Pink and blue bars represent DPPH and ABTS, respectively.
3.7. Volatile Composition
Volatile compounds in the kefir samples were identified after 1st and 10th days of fermentation (Figure 6a–c and Supplementary Tables S1–S5). A total of 43 volatile compounds were identified in the kefir samples, including 7 acids, 10 esters, 7 ketones, 4 aldehydes, 9 alcohols, and 6 miscellaneous compounds. Recent studies have shown that the production of volatile higher alcohols and esters during kefir fermentation is significantly influenced by the composition of the fermentation medium [31]. As the proportion of goat’s milk increased, esters such as ethyl butanoate, ethyl hexanoate, and isoamyl acetate (in sample E), as well as phenylethyl alcohol and 1-hexanol (in samples D and E), increased significantly. Ethyl esters, primarily ethyl acetate, together with alcohols containing three or more carbon atoms, are key contributors to the flavor of fermented beverages [47]. Ethyl acetate significantly influences the flavor profile, imparting a pleasant fruity aroma; however, at concentrations above 150 mg L−1, it can produce sour, spoilage-like notes [48]. Kefir is recognised as a rich source of various aroma compounds, including diacetyl [49], acetic acid, propionic acid, and butanoic acid [50]. Fermentation also produces other compounds such as lactic acid, pyruvic acid, hippuric acid, and acetaldehyde, which further contribute to the flavour and aroma of the product [51,52]. Supplementary Table S1 lists nine carboxylic acids identified in the kefir samples. Total carboxylic acid content increased significantly in samples D and E on day 10 of storage. In these samples, lactic acid reached its highest levels, while the concentrations of isobutyric, octanoic, and hexanoic acids were markedly increased due to the higher proportion of goat milk. Furthermore, isobutyric and isovaleric acids—two branched-chain carboxylic acids—were significantly higher in samples E and C on day 10. Carboxylic acids, which were the most abundant volatile compounds in the kefir samples, likely originate from amino acid catabolism and contribute to the characteristic “sweaty” and “ripe cheese” aromas of kefir [53].
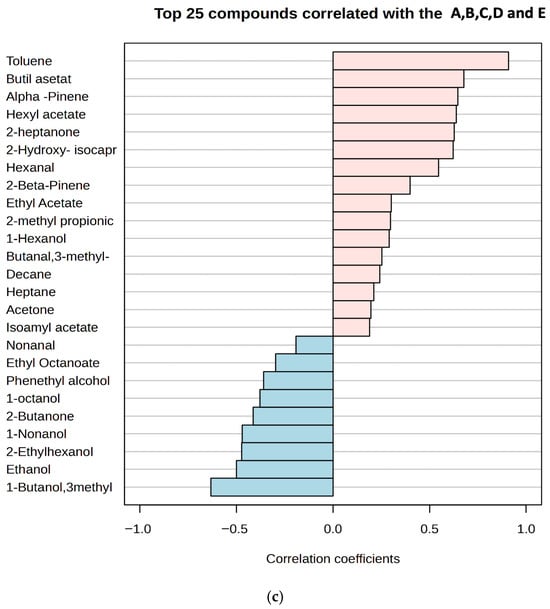
Figure 6.
Heat map clusters (a) of oPLSDA plot (b),(c) Correlation of volatile compounds in kefir made using with cow and goat milk during storage. A: 100% cow’s milk; B: 75% cow’s milk + 25% goat’s milk; C: 50% cow’s milk + 50% goat’s milk; D: 25% cow’s milk + 75% goat’s milk; E: 100% goat’s milk.
In total, nine alcohols were detected, the majority of which were secondary and branched-chain alcohols (Supplementary Table S3). Ethanol and 3-methyl-1-butanol were the most abundant alcohols across all kefir samples. Ethanol levels were lowest in sample A (100% cow’s milk) and increased with higher goat milk content, reaching the highest values in samples D (75% goat milk) and E (100% goat milk). This suggests that adding goat milk supports ethanol production by enhancing microbial activity and carbohydrate metabolism during fermentation. Ethanol imparts the characteristic fermented aroma to kefir, and its higher levels in samples D and E are associated with greater overall aroma intensity. The alcohol content in kefir contributes to its characteristic mild alcoholic aroma, and yeast-derived aromas define the unique profile of this fermented beverage [49]. Yeasts are primarily responsible for alcohol production in kefir, and higher alcohol levels are associated with the distinctive mild yeast aroma typical of authentic kefir. Both ethanol and CO2 play a critical role in creating kefir’s refreshing and distinctive aroma. Alongside ethanol and isoamyl alcohol (3-methyl-1-butanol), other alcohols such as isobutanol (2-methyl-1-propanol) and phenylethyl alcohol were detected in all kefir samples, whereas 1-pentanol, 1-nonanol, 1-octanol, and 1-hexanol were observed only in some samples (Supplementary Table S3). With increasing goat milk proportion, the levels of alcohol compounds, particularly phenethyl alcohol and 1-hexanol (notably in samples D and E), increased significantly.
Four aldehydes were identified in the kefir samples (Supplementary Table S4): 3-methylbutanal, hexanal, benzaldehyde, and nonanal. Aldehydes, as intermediate compounds, can be formed by the enzymolysis of amino acids or lipid oxidation during the fermentation process. However, aldehydes are unstable and can be rapidly oxidized to acids [54]. In our study, only four aldehydes (3-methyl-1-butanal, nonanal, hexanal, and benzaldehyde) were detected, and their amounts in each sample were quite low. Furthermore, these values decreased further in kefir samples on day 10 of storage. Such low aldehyde levels are desirable in kefir, as they indicate an undesirable (mostly aldehydic and bitter) flavor in kefir. Ketone compounds are intermediate products formed by microorganisms in kefir grains during the fermentation process, resulting from the breakdown of fatty acids or proteins [55]. Seven ketones were detected, with acetoin and diacetyl being the most abundant. The highest diacetyl concentration was found in kefir sample E. Some studies have reported high diacetyl levels in kefir [49,56], while others, such as Güzel-Seydim et al. [57], did not detect diacetyl during kefir fermentation. In the present study, diacetyl amounts ranged from 0.25 ± 0.24 to 4.69 ± 1.52 mg/L in the final products. Acetoin is a metabolite produced from citrate metabolism by lactic acid bacteria [56]. During glucose catabolism, diacetyl (2,3-butanedione) acts as an electron acceptor and can be reduced to acetoin [49]. Our study found that the ratio of 2,3-pentanedione, 2.3-butanedione, and 2-heptanone was associated with an increase in kefir containing high amounts of goat milk. Various compounds detected in the kefir samples are listed in Supplementary Table S5. Among these, terpenes were present at low levels in samples A and B, which contained small amounts of goat milk, while higher numbers of terpene compounds were detected in samples C (50%), D (75%), and E (100%). In the analysis of the heatmap, the colour scale shows the distribution of aroma components: blue indicates low, and red indicates high component amounts (Figure 6a). Significant differences were observed between the 1st and 10th day samples of each group, indicating an increase in volatile compounds with fermentation duration. Red hues were particularly dominant in the 10th day samples (e.g., D and E), indicating a higher concentration of aroma compounds. The graph visualises the similarities and differences in aroma profiles between groups. Esters were identified as the group providing the strongest discrimination between classes. Notably, samples distinguished from the sample C (50:50 cow/goat milk mixture) exhibited high concentrations of certain compounds, such as ethyl butanoate and benzaldehyde. α-Pinene and β-pinene were detected in high amounts in sample E, produced with goat milk. Figure 6b presents the oPLSDA (Orthogonal Partial Least Squares Discriminant Analysis) score plot, which visualises the similarities and differences between samples in terms of aroma components. The OPLS-DA score plot demonstrates the separation of five different groups in multivariate data, with Component 1 and Component 2 of the model explaining a significant portion of the variance between the groups. Specifically, kefir samples C and E are clearly distinct from each other, while there is partial overlap between samples A, B, and D. The sample C, located in the centre and coloured blue, are notably different from the others, particularly on the negative side of the PC1 (Component 1) and PC2 (Component 2) axes, indicating a very different aroma component profile. The high values for benzaldehyde and some acidic compounds in the heatmap for this class explain this distinction. Sample E positioned the negative side of the PC1 axis, indicating low levels of aroma components defined by PC1, i.e., low in ester or fruit components but rich in acidic or pungent components. Indeed, sample E, which contains only goat milk, displays a distinct aromatic profile and forms a homogeneous group separated from the others. Consequently, the oPLSDA graph strongly supports the classification based on the aroma components seen in the heatmap. While sample D acts as a transitional group, samples from classes C and E represent the most extreme values. A correlation plot showing the relationship between the concentrations of the 25 most abundant volatile compounds detected in kefir samples and their goat milk content is shown in Figure 6c. The highest positive correlations (between +0.8 and +1.0) were for compounds such as toluene, butyl acetate, and alpha-pinene, suggesting that these compounds constitute the dominant aromatic components unique to goat milk kefir in sample E, which has the highest goat milk content. In contrast, compounds such as 1-butanol, 3-methyl, and ethanol show negative correlations (between approximately -0.4 and -0.6), indicating that the concentrations of these compounds decrease as the goat milk content increases, with sample A (the lowest goat milk content) being richer in these compounds. In summary, the transition from A to E (increasing goat milk content) completely changes the dominant volatile compound profile in kefir, bringing the compounds unique to goat milk to the forefront.
3.8. Rheological Analyses
The viscosity values presented in Figure 7a,b correspond to the apparent viscosity measured as a function of shear rate, reflecting the shear-thinning behavior of kefir. Sample codes A–E represent increasing proportions of goat milk in the formulation; therefore, the curves also compare the rheological effect of the goat milk additive. Sample A (100% cow’s milk) had the highest viscosity and showed a slower decrease in viscosity with increasing shear rate. Viscosity decreased significantly as the proportion of goat milk increased, with pseudoplastic behavior characterized by lower initial viscosity, particularly in samples D and E. Sample E (100% goat’s milk) had the lowest viscosity profile and exhibited a flatter curve across the shear rate.
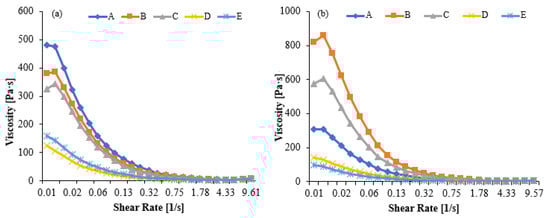
Figure 7.
Viscosity values in kefir made using with cow’s and goat’s milk after day 1 (a) day10 (b). A: 100% cow milk; B: 75% cow’s milk + 25% goat’s milk; C: 50% cow’s milk + 50% goat’s milk; D: 25% cow’s milk + 75% goat’s milk; E: 100% goat’s milk.
The Herschel–Bulkley equations numerically describe the textural and flow behavior of samples and allow for comparative analysis of the viscosity properties of the products. The Herschel–Bulkley model equation for each sample is as follows: τ = τ0 + K⋅n
A: τ = 1.13 + 2.956⋅0.2332; B: τ = 1.02 + 3.048⋅0.2503; C: τ = 0.97 + 3.354⋅0.2281; D: τ = 0.50 + 1.842⋅0.2841; E: τ = 0.66 + 2.216⋅0.3571
A high yield stress (τ0) indicates that the product has high structural stability, is more resistant to particle sedimentation or phase separation during shelf life, and is perceived as darker/denser. A low flow index (n) indicates that the fluid exhibits a sharper decrease in viscosity versus shear rate, meaning it exhibits a stronger pseudoplastic behavior and thins rapidly under dynamic conditions (e.g., in the mouth). In our study, kefir A had the highest yield stress (τ0 = 1.13 Pa) and a low flow index (n = 0.2332), requiring the greatest stress to initiate flow, indicating a strong pseudoplastic (shear-thinning) behavior. Kefir C, despite having the lowest yield stress (τ0 = 0.97 Pa), has the lowest flow index (n = 0.2281) and consistency index (K = 3.354), resulting in a rapid thinning upon flow and a smooth mouthfeel. Kefir B offers intermediate values with balanced flow and textural properties, while kefir D (τ0 = 0.50 Pa, n = 0.2841) and kefir E (τ0 = 0.66 Pa, n = 0.3571) have lower yield stresses and higher n values, resulting in easier flow and a more fluid (easily pourable) and stable viscosity profile. These results suggest that the gel network density decreases and weakens due to the protein structure specific to goat milk (low α-s1 -casein, high β-casein) and smaller fat globules, resulting in a softer and more brittle structure [58,59,60]. At the end of storage, the viscosity in all samples decreased compared to day 1. Due to the maturation process, samples A, B, and C showed a more pronounced decrease in viscosity compared to day 1. Samples D and E maintained low viscosity after storage, indicating that goat milk’s tendency to form a weak gel network becomes more pronounced over time. At the end of Day 10, sample A exhibited the highest viscosity, while sample E exhibited the lowest. Consequently, goat milk kefir tends to develop a more fragile gel structure [8,61,62].
3.9. Sensory Analysis
Sensory evaluation plays a crucial role in consumer acceptance and choice, with aroma and flavor being the most important factors influencing purchase decisions for dairy products. The sensory evaluation results of kefir samples prepared with different cow and goat milk ratios were analyzed separately for day 1 and day 10. Figure 8a,b present the sensory data for five kefir samples during storage. On day 1, most attributes such as colour, foam, normal appearance, and normal kefir taste did not differ significantly among the samples, indicating that initial fermentation did not strongly affect these characteristics. However, some attributes, including mouthfeel, viscosity, foreign taste, normal kefir odour, overall evaluation, and hedonic test, showed statistically significant differences (p < 0.05). In particular, samples with higher goat milk content tended to exhibit higher viscosity and mouth coating scores, whereas the foreign taste was rated lower in cow-dominated samples. Viscosity, closely related to texture, is also a key factor affecting consumer preference [8].
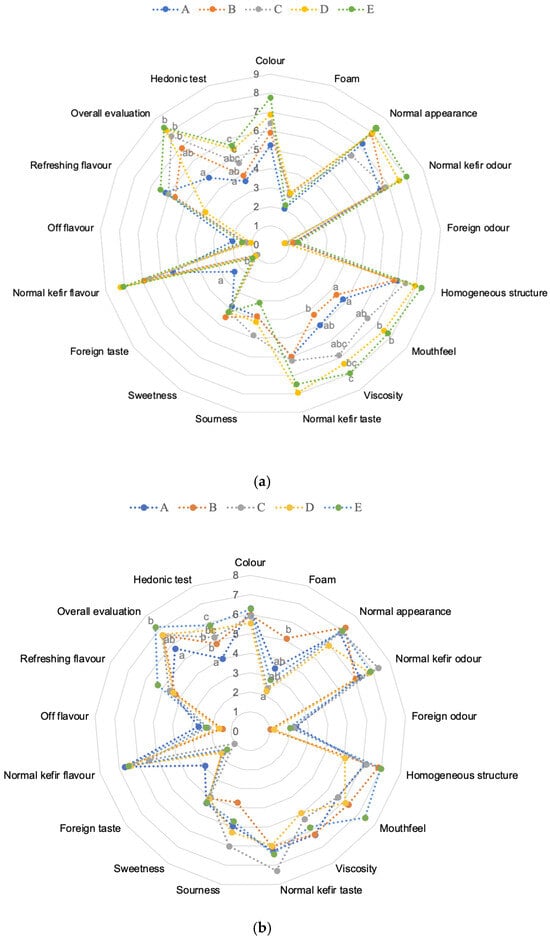
Figure 8.
Sensory scores in kefir made using with cow’s and goat’s milk after day 1 (a) and day 10 (b). A: 100% cow milk; B: 75% cow’s milk + 25% goat’s milk; C: 50% cow’s milk + 50% goat’s milk; D: 25% cow’s milk + 75% goat’s milk; E: 100% goat’s milk. a–c Mean values shown with different lowercase letters for the same sensory characteristics are significantly different across samples (p < 0.05). Numbers 0–9 for (a) and 0–8 for (b) represent the scores of the corresponding sensory attributes.
By day 10, most sensory attributes converged, and fewer significant differences were observed between the milk ratios. Notably, viscosity and hedonic scores remained significantly higher in samples with higher goat milk proportions, suggesting that milk type continues to influence textural and overall acceptability even after extended storage. Kefir samples containing goat’s milk exhibited a more acidic flavor after 10 days of storage. The increased acidity detected in sensory analysis likely reflects underlying physicochemical changes driven by microbial metabolic activity. Foreign taste differences also persisted, but attributes such as colour, foam, normal appearance, and flavour intensity became more uniform across samples. Additionally, kefir made from goat milk was perceived to have less foreign taste and flavor compared to cow’s milk kefir. Variations in the proportion of goat and cow milk significantly influenced the flavour and taste of kefir, with higher goat milk content intensifying the kefir’s characteristic odour. Across all samples, product acceptability improved during storage. These findings are consistent with previous studies on fermented milk products, including those by Kırmaz et al. [63] and Arda et al. [64], indicating that panellists preferred kefir with a distinct sourness, refreshing flavor, and balanced viscosity. Overall, kefirs made from goat’s milk scored higher in sensory evaluations than those from cow’s milk, consistent with observations reported by other researchers [8,65].
These results indicate that while initial sensory properties may be influenced by milk composition, extended fermentation and storage tend to reduce differences in most sensory parameters, except for textural and preference-related attributes. The findings highlight the importance of milk type on the mouthfeel and consumer acceptance of kefir, especially for products intended for longer storage periods.
4. Conclusions
Kefir products were prepared using different ratios of goat and cow milk, resulting in variations in their gross chemical compositions, with goat milk containing approximately twice the fat content of cow milk. All kefir samples exhibited high microbial quality, dominated by lactic acid bacteria and yeasts. Sensory characteristics were mainly influenced by the type of milk used and the storage period, with flavor profiles clearly reflecting either cow’s or goat’s milk. Additionally, kefir viscosity was significantly affected by the milk type. The key finding of this study is that the milk source strongly influences kefir’s sensory and aroma profiles, chemical composition, and rheological properties. Kefir grains effectively reduced lactose levels while generating volatile compounds that enhance the beverage’s quality. GC-MS analysis identified various volatile compounds common to fermented beverages, although their concentrations varied. The most abundant compounds included higher alcohols (mainly isobutyl alcohol), carboxylic acids (primarily acetic acid), ketones (briefly acetoin), and ethyl esters (mainly ethyl acetate), all contributing significantly to the overall aroma. Overall, the study demonstrates that kefir grains can ferment mixtures of goat and cow milk to produce novel beverages with desirable organoleptic properties. Based on these results, the sample containing 75% goat’s milk can be recommended in terms of proteolysis, as well as its favorable sensory and textural properties.
Supplementary Materials
The following supporting information can be downloaded at: https://www.mdpi.com/article/10.3390/dairy7010011/s1, Table S1: Acids in kefir made using with cow and goat milk during ripening (μg/100 g of kefir); Table S2: Esters in kefir made using with cow and goat milk during ripening (μg/100 g of kefir); Table S3: Alcohol in kefir made using with cow and goat milk during ripening (μg/100 g of kefir); Table S4: Aldehydes and ketones in kefir made using with cow and goat milk during ripening (μg/100 g of kefir); Table S5: Miscellaneous compounds in kefir made using with cow and goat milk during ripening (μg/100 g of kefir).
Author Contributions
D.Ş.: Conceptualization, investigation, data curation, formal analysis, methodology, writing—original draft, visualization, validation, methodology. H.G.: Formal analysis, methodology. A.A.H.: Conceptualization, writing—review and editing, funding acquisition, resources, validation, supervision, methodology. All authors have read and agreed to the published version of the manuscript.
Funding
This research received no external funding.
Institutional Review Board Statement
This study involved a sensory evaluation of foods prepared with food-grade ingredients under strict hygiene conditions. All participants were adults, and no information was collected from them other than their sensory impressions of the products. Participants were fully informed about the purpose and procedures of the research, that their anonymous opinions would be included in a scientific publication, and that they were free to withdraw at any time for any reason. No compensation was provided. Verbal informed consent was obtained after this information was explained. The rights and well-being of all participants were safeguarded in accordance with the Declaration of Helsinki. Under Turkish regulations and the policies of the hosting institution, this type of food sensory evaluation does not require formal ethics approval.
Informed Consent Statement
Verbal informed consent was provided by all volunteer participants. Verbal consent was obtained rather than written because food sensory evaluation did not require to include identifying participant information.
Data Availability Statement
The original contributions presented in this study are included in the article/Supplementary Material. Further inquiries can be directed to the corresponding author.
Conflicts of Interest
The authors declare no conflicts of interest.
References
- Dertli, E.; Çon, A.H. Microbial diversity of traditional kefir grains and their role on kefir aroma. LWT-Food Sci. Technol. 2017, 85, 151–157. [Google Scholar] [CrossRef]
- Purutoğlu, K.; İspirli, H.; Yüzer, M.O.; Serencam, H.; Dertli, E. Diversity and functional characteristics of lactic acid bacteria from traditional kefir grains. Int. J. Dairy Technol. 2020, 73, 57–66. [Google Scholar] [CrossRef]
- Verruck, S.; Dantas, A.; Prudencio, E.S. Functionality of the components from goat’s milk, recent advances for functional dairy products development and its implications on human health. J. Funct. Foods 2019, 52, 243–257. [Google Scholar] [CrossRef]
- Li, S.; Bai, Y. Advances in microbial diversity and interactions in kefir. Food Sci. 2024, 45, 272–280. [Google Scholar]
- Arslan, S. A review: Chemical, microbiological and nutritional characteristics of kefir. CyTA-J. Food 2015, 13, 340–345. [Google Scholar] [CrossRef]
- Nayik, G.A.; Jagdale, Y.D.; Gaikwad, S.A.; Devkatte, A.N.; Dar, A.H.; Ansari, M.J. Nutritional profile, processing and potential products: A comparative review of goat milk. Dairy 2022, 3, 622–647. [Google Scholar]
- Meral-Aktaş, H.; Ürkek, B.; Aktaş, H.; Baltacı, C.; Çetin, B.; Şengül, M. Comparison of different animal milks on microbiological, physicochemical, sensory properties, and volatile component profile of Kefir. J. Food Meas. Charact. 2025, 19, 6020–6035. [Google Scholar] [CrossRef]
- Gürel, D.B.; Ildız, M.; Sabancı, S.; Koca, N.; Çağındı, Ö.; İçier, F. The Effect of Using Cow and Goat Milk on Antioxidant, Rheological and Sensory Properties of Kefir. Turk. J. Agric.-Food Sci. Technol. 2021, 9, 7–14. [Google Scholar]
- Magra, T.I.; Antoniou, K.D.; Psomas, E.I. Effect of milk fat, kefir grain inoculum and storage time on the flow properties and microbiological characteristics of kefir. J. Texture Stud. 2012, 43, 299–308. [Google Scholar] [CrossRef]
- Satir, G.; Guzel-Seydim, Z.B. Influence of Kefir fermentation on the bioactive substances of different breed goat milks. LWT-Food Sci. Technol. 2015, 63, 852–858. [Google Scholar] [CrossRef]
- Magalhães, K.T.; Dragone, G.; de Melo Pereira, G.V.; Oliveira, J.M.; Domingues, L.; Teixeira, J.A.; Schwan, R.F. Comparative study of the biochemical changes and volatile compound formations during the production of novel whey-based kefir beverages and traditional milk kefir. Food Chem. 2011, 126, 249–253. [Google Scholar] [CrossRef]
- Garofalo, C.; Osimani, A.; Milanović, V.; Aquilanti, L.; De Filippis, F.; Stellato, G.; Clementi, F. Bacteria and yeast microbiota in milk kefir grains from different Italian regions. Food Microbiol. 2015, 49, 123–133. [Google Scholar] [CrossRef]
- Prado, M.R.; Blandón, L.M.; Vandenberghe, L.P.; Rodrigues, C.; Castro, G.R.; Thomaz-Soccol, V.; Soccol, C.R. Milk kefir: Composition, microbial cultures, biological activities, and related products. Front. Microbiol. 2015, 6, 1177. [Google Scholar] [CrossRef]
- Wang, H.; Guo, M. Microbiological profiles, physiochemical properties and volatile compounds of goat milk kefir fermented by reconstituted kefir grains. LWT 2023, 183, 114943. [Google Scholar] [CrossRef]
- Kurniawati, E.; Suryani, T. Quality of Kefir Combination Between of Goat’s Milk and Skim Milk on Variations of Sugar and Fermentation Duration. In Proceedings of the International Conference on Biology Education, Natural Science, and Technology, Virtual, 17 June 2023; pp. 305–313. [Google Scholar]
- Baniasadi, M.; Azizkhani, M.; Saris, P.E.J.; Tooryan, F. Comparative antioxidant potential of kefir and yogurt of bovine and non-bovine origins. J. Food Sci. Technol. 2022, 59, 1307–1316. [Google Scholar] [CrossRef]
- Uruc, K.; Tekin, A.; Sahingil, D.; Hayaloglu, A.A. An alternative plant-based fermented milk with kefir culture using apricot (Prunus armeniaca L.) seed extract: Changes in texture, volatiles and bioactivity during storage. Innov. Food Sci. Emerg. Technol. 2022, 82, 103189. [Google Scholar] [CrossRef]
- Sahingil, D.; Gokce, Y.; Celikbicak, O.; Hayaloglu, A.A. ACE-inhibitory activities of peptide fractions (<3 kDa) and identification of peptide sequence by MALDI-ToF-MS in model cheeses incorporating different Lactobacillus species. J. Food Comp. Anal. 2022, 110, 104579. [Google Scholar] [CrossRef]
- Gumus, P.; Hayaloglu, A.A. Effects of blends of camel and calf chymosin on proteolysis, residual coagulant activity, microstructure, and sensory characteristics of Beyaz peynir. J. Dairy Sci. 2019, 102, 5945–5956. [Google Scholar] [CrossRef] [PubMed]
- Mutlu, M.D.; Kanmaz, H.; Kaya, B.; Hayaloğlu, A.A. Enrichment in bioactive, techno-functional and health benefits of yogurt fortified with cranberry (Cornus mas L.). Dairy 2025, 6, 12. [Google Scholar] [CrossRef]
- Tekin, A.; Vurmaz, M.; Fidan, Ş.; Dursun, A.; Şekerli, Y.E.; İncili, G.K.; Hayaloğlu, A.A. Water kefir-assisted fermentation improved quality of plant-based cheese alternative comparable with cow’s milk cheese by reducing plant-origin odor and enhancing cheese-like flavours. Innov. Food Sci. Emerg. Technol. 2025, 106, 104270. [Google Scholar] [CrossRef]
- Vulić, A.; Kudumija, N.; Lešić, T.; Tanković, S.; Jelušić, V.; Frizbegović, J.; Pleadin, J. Chemical composition and fatty acid profile of Alpine and Saanen goat milk from Bosnia and Herzegovina. Vet. Stanica 2021, 52, 13–21. [Google Scholar] [CrossRef]
- La Torre, C.; Caputo, P.; Cione, E.; Fazio, A. Comparing nutritional values and Bioactivity of Kefir from different types of animal milk. Molecules 2024, 29, 2710. [Google Scholar] [CrossRef] [PubMed]
- Fan, D.; Stoyanova, L.G.; Netrusov, A.I. Microbiome and metabiotic properties of kefir grains and kefirs based on them. Microbiology 2022, 91, 339–355. [Google Scholar] [CrossRef]
- M’hir, S.; Rtibi, K.; Mejri, A.; Ziadi, M.; Aloui, H.; Hamdi, M.; Ayed, L. Development of a novel whey date beverage fermented with kefir grains using response surface methodology. J. Chem. 2019, 1, 1218058. [Google Scholar] [CrossRef]
- Tomar, O.; Akarca, G.; Çağlar, A.; Beykaya, M.; Gök, V. The effects of kefir grain and starter culture on kefir produced from cow and buffalo milk during storage periods. Food Sci. Technol. 2019, 40, 238–244. [Google Scholar] [CrossRef]
- Aktaş, H.; Meral Aktaş, H.; Ürkek, B.; Şengül, M.; Çetin, B. Evaluation of spreadable kefir produced from different milks in terms of some quality criteria. Probiot. Antimicrob. Proteins 2024, 16, 1734–1743. [Google Scholar] [CrossRef] [PubMed]
- Li, Y.; Wang, D.; Zheng, W.; He, J.; Xiao, M.; Yang, X.; Yu, X.; Zhao, D.; Shi, Y.; Huang, A. Revealing the mechanism of flavor improvement of fermented goat milk based on lipid changes. Food Chem. 2024, 458, 140235. [Google Scholar] [CrossRef]
- de Oliveira, C.D.; Sampaio, A.N.D.C.E.; Cézar, C.K.C.; Caron, E.F.F.; Martins, O.A.; Possebon, F.S.; Pereira, J.G. Kefir: A comprehensive overview of microbiological, physicochemical, and health-promoting properties. Food Sci. Technol. 2025, 45, e00420. [Google Scholar] [CrossRef]
- Szkolnicka, K.; Dmytrów, I.; Mituniewicz-Małek, A.; Bogusławska-Wąs, E. Quality Assessment of Organic Kefirs Made with Kefir Grains and Freeze-Dried Starter Cultures. Appl. Sci. 2024, 14, 11746. [Google Scholar] [CrossRef]
- Ströher, J.A.; Oliveira, W.D.C.; Freitas, A.S.D.; Salazar, M.M.; Flôres, S.H.; Malheiros, P.D.S. Microbial Dynamics and Volatile Compound Profiles in Artisanal Kefir During Storage. Fermentation 2025, 11, 105. [Google Scholar] [CrossRef]
- Ter, Z.Y.; Chang, L.S.; Babji, A.S.; Zaini, N.A.M.; Fazry, S.; Sarbini, S.R.; Lim, S.J. A review on proteolytic fermentation of dietary protein using lactic acid bacteria for the development of novel proteolytically fermented foods. Int. J. Food Sci. Technol. 2024, 59, 1213–1236. [Google Scholar] [CrossRef]
- de Almeida, K.V.; Sant’Ana, C.T.; Wichello, S.P.; Louzada, G.E.; Verruck, S.; Teixeira, L.J.Q. Water Kefir: Review of Microbial Diversity, Potential Health Benefits, and Fermentation Process. Processes 2025, 13, 885. [Google Scholar] [CrossRef]
- Izquierdo-González, J.J.; Amil-Ruiz, F.; Zazzu, S.; Sánchez-Lucas, R.; Fuentes-Almagro, C.A.; Rodríguez-Ortega, M.J. Proteomic analysis of goat milk kefir: Profiling the fermentation-time dependent protein digestion and identification of potential peptides with biological activity. Food Chem. 2019, 295, 456–465. [Google Scholar] [CrossRef]
- Atanasova, J.; Moncheva, P.; Ivanova, I. Proteolytic and antimicrobial activity of lactic acid bacteria grown in goat milk. Biotechnol. Biotechnol. Equip. 2014, 28, 1073–1078. [Google Scholar] [CrossRef] [PubMed]
- Kan, M.; Ter, Z.Y.; Sofian-Seng, N.S.; Chang, L.S.; Wang, S.; Lim, S.J. Recent Advances on Bioactive Peptide Fractionation Methods. Food Bioprocess Technol. 2025, 18, 7032–7059. [Google Scholar] [CrossRef]
- Ciurko, D.; Łaba, W.; Żarowska, B.; Janek, T. Enzymatic hydrolysis using bacterial cultures as a novel method for obtaining antioxidant peptides from brewers’ spent grain. RSC Adv. 2021, 11, 4688–4700. [Google Scholar] [CrossRef] [PubMed]
- M’hir, S.; Ayed, L.; De Pasquale, I.; Fanizza, E.; Tlais, A.Z.A.; Comparelli, R.; Filannino, P. Comparison of Milk Kefirs Obtained from Cow’s, Ewe’s and Goat’s Milk: Antioxidant Role of Microbial-Derived Exopolysaccharides. Antioxidants 2024, 13, 335. [Google Scholar] [CrossRef]
- Biadała, A.; Szablewski, T.; Lasik-Kurdyś, M.; Cegielska-Radziejewska, R. Antimicrobial activity of goat’s milk fermented by single strain of kefir grain microflora. Eur. Food Res. Technol. 2020, 246, 1231–1239. [Google Scholar] [CrossRef]
- Gużewska, G.; Monedeiro-Milanowski, M.; Florkiewicz, A.B.; Arendowska, I.; Walczak-Skierska, J.; Białczak, D.; Pomastowski, P.P. Analysis of the fatty acid profile in cream, buttermilk fractions, and anhydrous Milk fat: Influence of physicochemical and microbiological parameters on the fatty acid profile. Appl. Sci. 2024, 14, 6117. [Google Scholar] [CrossRef]
- McGovern, C.J.; González-Orozco, B.D.; Jiménez-Flores, R. Evaluation of kefir grain microbiota, grain viability, and bioactivity from fermenting dairy processing by-products. J. Dairy Sci. 2024, 107, 4259–4276. [Google Scholar] [CrossRef]
- Alves, E.; Ntungwe, E.N.; Gregório, J.; Rodrigues, L.M.; Pereira-Leite, C.; Caleja, C.; Rijo, P. Characterization of kefir produced in household conditions: Physicochemical and nutritional profile, and storage stability. Foods 2021, 10, 1057. [Google Scholar] [CrossRef] [PubMed]
- Harper, A.R.; Dobson, R.C.; Morris, V.K.; Moggré, G.J. Fermentation of plant-based dairy alternatives by lactic acid bacteria. Microb. Biotechnol. 2022, 15, 1404–1421. [Google Scholar] [CrossRef]
- Sorathiya, K.B.; Melo, A.; Hogg, M.C.; Pintado, M. Organic acids in food preservation: Exploring synergies, molecular insights, and sustainable applications. Sustainability 2025, 17, 3434. [Google Scholar] [CrossRef]
- Yilmaz-Ersan, L.; Ozcan, T.; Akpinar-Bayizit, A.; Sahin, S. Comparison of antioxidant capacity of cow and ewe milk kefirs. J. Dairy Sci. 2018, 101, 3788–3798. [Google Scholar] [CrossRef]
- Dinkçi, N.; Akdeniz, V.; Akalın, A.S. Probiotic whey-based beverages from cow, sheep and goat milk: Antioxidant activity, culture viability, amino acid contents. Foods 2023, 12, 610. [Google Scholar] [CrossRef]
- Apostolopoulou, A.A.; Flouros, A.I.; Demertzis, P.G.; Akrida-Demertzi, K. Differences in concentration of principal volatile constituents in traditional Greek distillates. Food Control 2005, 16, 157–164. [Google Scholar] [CrossRef]
- Falqué, E.; Fernández, E.; Dubourdieu, D. Differentiation of white wines by their aromatic index. Talanta 2001, 54, 271–281. [Google Scholar] [CrossRef] [PubMed]
- Beshkova, D.M.; Simova, E.D.; Frengova, G.I.; Simov, Z.I.; Dimitrov, Z.P. Production of volatile aroma compounds by kefir starter cultures. Int. Dairy J. 2003, 13, 529–535. [Google Scholar] [CrossRef]
- Farag, M.A.; Jomaa, S.A.; Abd El-Wahed, A.; R El-Seedi, H. The many faces of kefir fermented dairy products: Quality characteristics, flavour chemistry, nutritional value, health benefits, and safety. Nutrients 2020, 12, 346. [Google Scholar] [CrossRef]
- Cais-Sokolińska, D.; Wójtowski, J.; Pikul, J.; Danków, R.; Majcher, M.; Teichert, J.; Bagnicka, E. Formation of volatile compounds in kefir made of goat and sheep milk with high polyunsaturated fatty acid content. J. Dairy Sci. 2015, 98, 6692–6705. [Google Scholar] [CrossRef] [PubMed]
- Dağ, İ.Ş.; Güneşer, B.; Yuceer, Y. Assessment of quality and aroma characteristics of kefir produced by using grain and lyophilized culture. J. Adv. Res. Nat. Appl. Sci. 2021, 7, 343–357. [Google Scholar] [CrossRef]
- Panseri, S.; Giani, I.; Mentasti, T.; Bellagamba, F.; Caprino, F.; Moretti, V.M. Determination of flavour compounds in a mountain cheese by headspace sorptive extraction-thermal desorption-capillary gas chromatography-mass spectrometry. LWT-Food Sci. Technol. 2008, 41, 185–192. [Google Scholar] [CrossRef]
- Wang, H.; Sun, X.; Song, X.; Guo, M. Effects of kefir grains from different origins on proteolysis and volatile profile of goat milk kefir. Food Chem. 2021, 339, 128099. [Google Scholar] [CrossRef] [PubMed]
- Gallegos, J.; Garrido-Delgado, R.; Arce, L.; Medina, L.M. Volatile metabolites of goat cheeses determined by ion mobility spectrometry. Potential applications in quality control. Food Anal. Methods 2015, 8, 1699–1709. [Google Scholar] [CrossRef]
- Aghlara, A.; Mustafa, S.; Manap, Y.A.; Mohamad, R. Characterization of headspace volatile flavor compounds formed during kefir production: Application of solid phase microextraction. Int. J. Food Prop. 2009, 12, 808–818. [Google Scholar] [CrossRef]
- Güzel-Seydim, Z.B.; Seydim, A.C.; Greene, A.K.; Bodine, A.B. Determination of organic acids and volatile flavor substances in kefir during fermentation. J. Food Comp. Anal. 2000, 13, 35–43. [Google Scholar] [CrossRef]
- Le Ba, T.; Dam, M.S.; Nguyen, L.L.P.; Baranyai, L.; Kaszab, T. A Review of Processing Techniques and Rheological Properties of Yogurts. J. Texture Stud. 2025, 56, e70006. [Google Scholar] [CrossRef]
- Silanikove, N.; Leitner, G.; Merin, U.; Prosser, C.G. Recent advances in exploiting goat’s milk: Quality, safety and production aspects. Small Rumin. Res. 2010, 89, 110–124. [Google Scholar] [CrossRef]
- Li, J.C.; Guo, M.R. Effects of polymerized whey proteins on consistency and water-holding properties of goat’s milk yogurt. J. Food Sci. 2006, 71, 34–38. [Google Scholar]
- Sarica, E.; Coşkun, H. Assessment of durability and characteristics of changes in kefir made from cow’s and goat’s milk. Ital. J. Food Sci. 2020, 32, 498–516. [Google Scholar]
- Akshit, F.N.U.; Deshwal, G.K.; Sharma, H.; Kumar, P.; Maddipatla, D.K.; Singh, M.P.; Goksen, G. Technological challenges in production of goat milk products strategies to overcome them: A review. Int. J. Food Sci. Technol. 2024, 59, 6–16. [Google Scholar] [CrossRef]
- Kırmaz, C.; Kınık, Ö.; İçier, F. Determination of rheological properties of kefir produced with buffalo milk and other milk mixtures. J. Agric. Fac. Ege Univ. 2023, 60, 37–51. [Google Scholar] [CrossRef]
- Arda, B.; Akdeniz, V.; Kara, H.H.; Akalın, A.S. Fatty acid profile, conjugated linoleic acid (CLA) content, microbiological and sensory properties of kefir produced from sheep milk using kefir grains and starter culture in comparison with the respective kefir from cow milk. Int. Dairy J. 2025, 162, 106157. [Google Scholar] [CrossRef]
- İrkin, R.; Songun, E.G. Improving functional properties of kefir produced with cow and goat milk. KSU J. Agric. Nat. 2022, 25, 556–564. [Google Scholar] [CrossRef]


Disclaimer/Publisher’s Note: The statements, opinions and data contained in all publications are solely those of the individual author(s) and contributor(s) and not of MDPI and/or the editor(s). MDPI and/or the editor(s) disclaim responsibility for any injury to people or property resulting from any ideas, methods, instructions or products referred to in the content. |
© 2026 by the authors. Licensee MDPI, Basel, Switzerland. This article is an open access article distributed under the terms and conditions of the Creative Commons Attribution (CC BY) license.