Abstract
In this study, we present the custom development and implementation of a mobile application designed specifically to experiment with Malus’s law, leveraging the integration of a LEGO EV3 and the light sensor of a mobile device. Unlike previous studies that utilize pre-designed mobile applications, our approach focuses on creating a tailored solution that meets the unique requirements of this optical experiment. Using MIT App Inventor, we developed a customized interface that allows for the rotation of polarizers controlled by motors connected to a LEGO EV3 while simultaneously measuring the light intensity using the mobile’s light sensor. The block-based programming in App Inventor facilitates the application of programming concepts in creating physics experiments in a straightforward manner. This innovative approach not only facilitates the understanding of fundamental optical concepts but also integrates accessible technology to enrich the educational experience in physics, offering a customizable solution adaptable to various educational settings. Preliminary results indicate a significant improvement in students’ comprehension of optical polarization principles, demonstrating the effectiveness of our approach.
1. Introduction
The study of polarized light and its behavior through various optical elements is fundamental in the field of physics. Malus’s law, which describes the relationship between the intensity of polarized light and the angle of polarization, provides a critical understanding of these phenomena [1,2,3]. Traditional experiments demonstrating Malus’s law often rely on pre-designed mobile applications or specialized equipment [4,5], which may limit their adaptability and accessibility in educational settings. This paper aims to bridge that gap by offering a customizable and hands-on approach. It is worth noting that other low-cost alternatives exist. For example, setups involving Arduino microcontrollers (Arduino AG, Ivrea, Italy) [6,7] or Raspberry Pi boards (Raspberry Pi Ltd, UK) and linear photodiode arrays offer flexible platforms for data acquisition and real-time analysis. These systems allow for direct communication between devices and can be programmed to visualize and compare experimental data with theoretical models. However, such configurations often require more advanced programming and electronics skills. Our choice was guided by the goal of minimizing technical barriers while maximizing replicability and engagement in classroom settings, particularly where LEGO EV3 (The LEGO Group, Billund, Denmark) [8,9] kits are already available as part of STEAM programs.
In this paper, we present a novel approach that involves the custom development of a mobile application using MIT App Inventor [10,11]. This application is specifically tailored to meet the requirements of an experiment designed to demonstrate Malus’s law. By leveraging block-based programming, App Inventor simplifies the application of programming concepts in the creation of physics experiments, making the process more accessible to educators and students alike. This approach not only demystifies the concepts of coding for beginners but also provides a seamless integration with practical physics applications.
The proposed experimental setup integrates a LEGO EV3 system to control the rotation of polarizers and the light sensor of a mobile device to measure the intensity of the light beam. The use of LEGO EV3 motors offers a cost-effective and versatile solution for adjusting the polarizer angles, ensuring that even small educational institutions can replicate the experiment without needing high-end equipment, and taking advantage of the fact that some of them have these devices as tools for teaching different subjects. The light sensor from a smartphone will capture real-time intensity data, which is then analyzed to observe the intensity calculated by Malus’s law.
Materials utilized in this study include LEGO EV3 motors, polarizing filters, and a mobile device with an integrated light sensor, and the custom mobile application developed in App Inventor. The combination of these components creates a flexible and educational platform for exploring the principles of polarization and light intensity. By integrating different technological tools, we created a comprehensive learning experience that not only teaches theoretical concepts but also encourages practical, hands-on experimentation.
The block-based programming environment of App Inventor plays a crucial role in this study. It allows users to create complex functionalities through comparably simple drag-and-drop actions, which significantly lowers the barrier to entry for those unfamiliar with coding. This approach not only makes the development process more natural but also helps students understand the logic behind programming and its application in scientific experiments. The ease of use and flexibility of App Inventor make it an ideal choice for educational purposes.
Malus’s law is not only fundamental in understanding optical phenomena but also holds significant importance in the education of physics and engineering. By exploring how the intensity of polarized light changes with the angle, students gain insights into critical concepts that apply to a wide range of technologies. Some applications of Malus’s law include telecommunications [12], where polarized light enhances data transmission in fiber optics, and photography [13], where polarizing filters improve image quality. Additionally, it is crucial in the development of liquid crystal display (LCD) technologies [14], which are essential components of modern electronic devices. By learning and experimenting with Malus’s law, students gain valuable insights into real-world applications that drive technological advancements.
This paper outlines the development and implementation of the custom application, the experimental setup, and the results obtained from the demonstration.
2. Theoretical Background
The phenomenon of light polarization is a fundamental concept in optics, essential for understanding various optical devices, techniques (such as polarization spectroscopy) and technologies. In an unpolarized light source, the electric field vectors oscillate in multiple planes perpendicular to the direction of propagation. When this unpolarized light passes through a polarizer, the light becomes polarized, that is the electric field vector oscillates in a single plane.
As illustrated in Figure 1, when unpolarized light, represented by arrows pointing in various directions, passes through a polarizer (P), only the light oscillating in a specific direction, which is aligned with the angle , is allowed to pass through, resulting in polarized light oscillating in that direction. The electric field of this polarized light can be decomposed into its components, which can be represented by
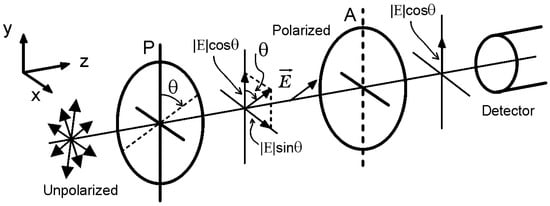
Figure 1.
Typical scheme for the demonstration of Malus’s law. P denotes the polarizer, A the analyzer, and the electric field vector.
Next, this polarized light encounters an analyzer (A), another polarizing filter placed with its transmission axis aligned with the vertical y-axis. The analyzer further filters the light based on its polarization direction. The intensity of the light after passing through the analyzer is then measured by a detector. Since the analyzer is aligned with the vertical axis, it specifically measures the intensity of the vertical component of the electric field of the polarized light. The angle between the direction of polarization of the incident light and the axis of the analyzer determines the intensity of the transmitted light.
Malus’s law quantitatively describes the relationship between the intensity of the transmitted light and the angle between the polarizer and the analyzer. According to Malus’s law, the intensity (measured by the detector) of the light after passing through the analyzer is given by
where is the initial intensity of the polarized light, and is the angle between the polarization direction set by the polarizer and the axis of the analyzer. This is valid as long as the transmission axis of the analyzer is aligned with the vertical y-axis. As the angle changes from 0° to 90°, the intensity decreases from its maximum value to zero, demonstrating how the orientation of polarizing elements can control light transmission.
3. Implementation
The proposal is to verify Malus’s law by measuring the intensity of light passing through a rotating polarizer. A mobile phone’s light sensor is used to capture the intensity values. It is worthy to note that the sensor provides scalar values without specific units (such as lux or lumens). Despite this, the consistency of these scalar values allows for the effective application of Malus’s law.
Although the light sensor in mobile devices does not provide measurements in standardized units such as lux or lumens, the experimental verification of Malus’s law does not require absolute intensity values. Instead, the law predicts a relative variation in intensity as a function of the angle between polarizers. Therefore, as long as the sensor output is consistent and linear with respect to actual light intensity, the relative measurements are sufficient and valid to confirm the theoretical behavior described by the law.
App Inventor is a direct visual programming environment that enables users to create fully functional applications for both Android and iOS devices. This platform is especially beneficial in educational settings, as it allows students and educators to leverage the built-in sensors of mobile devices (Figure 2) to measure various physical parameters such as light intensity, acceleration, and orientation.
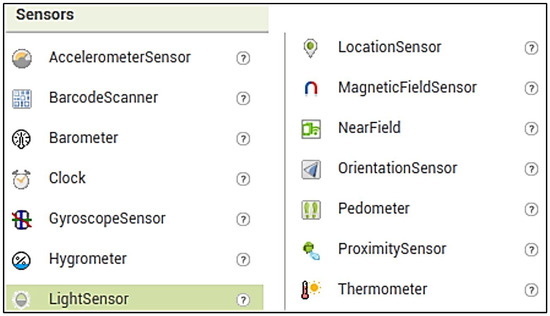
Figure 2.
Mobile phone sensors that can be programmed in App Inventor.
By harnessing the capabilities of App Inventor, educators can develop interactive applications that facilitate a deeper understanding of complex physical concepts. The real-time data visualization on mobile devices enhances the learning experience, making abstract ideas more tangible and accessible. For this particular application, the light sensor will be used to measure the intensity of light, providing a practical demonstration of theoretical principles such as Malus’s law.
Figure 3 shows the front and rear view corresponding to the mechanical turntable implementation in which the polarizer is mounted centrally on gear, driven by a motor design using LEGO EV3 components in Lego Digital Designer version 4.3 (The LEGO Group, Billund, Denmark). This setup, which directs the laser beam to pass through the polarizer while it rotates, is managed via a user-friendly interface developed with App Inventor. This approach not only aids in understanding fundamental optical concepts but also leverages accessible technology to enhance the educational experience in physics, offering a customizable solution suitable for various educational settings.
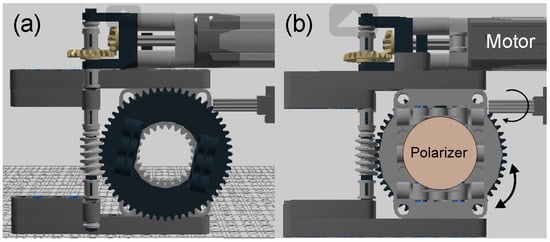
Figure 3.
CAD design of the (a) front and (b) rear views corresponding to the rotating mount for the polarizer.
Figure 4 shows a proposed experimental setup, if it is intended to be implemented using mostly Lego bricks. This proposal can use a Lego LED light and a mount similar to the rotating polarizer (P1), except that in this case it remains fixed (P2). The smartphone is also represented with a Lego brick, that to be replaced with a real one.
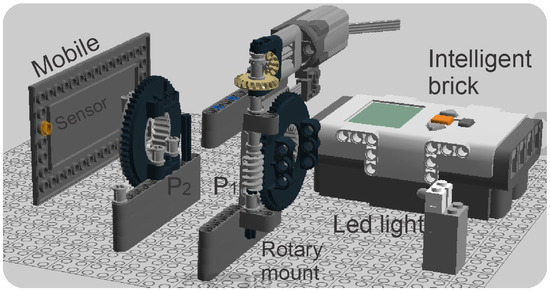
Figure 4.
Design proposal utilizing mostly Lego elements.
The mount shown in Figure 4 will be utilized in the experimental setup, as outlined in Figure 1. This arrangement allows precise control of the polarizer rotations to accurately measure the resulting light intensities. Figure 5 shows the front and back view of the corresponding experimental implementation, using LEGO EV3 components. In Figure 5, the smart brick is highlighted; it controls the motor responsible to rotate the mount. This control is achieved through the custom application developed in App Inventor.
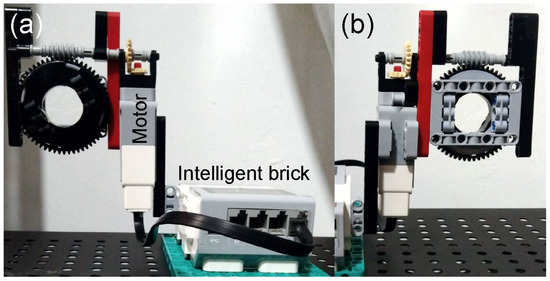
Figure 5.
Front (a) and rear (b) views of the rotary mount made with LEGO EV3 components.
The scheme corresponding to the final experimental arrangement is shown in Figure 6 which illustrates a non-polarized light source described by an electric field . When the light passes through polarizer P1 (with its transmission axis inclined by an angle respecting to the y-axis), it is decomposed into its components and .
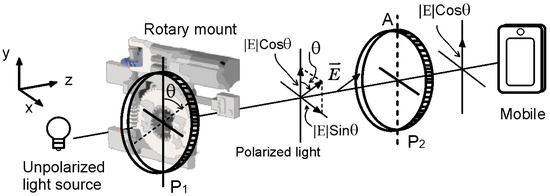
Figure 6.
Schematic arrangement of the experimental setup including the rotating mount and the mobile phone.
A second polarizer (P2) acting as an analyzer (A) to be placed with its transmission axis aligned along the y-axis (represented by a dashed line). This setup allows only the intensity of the component to be measured using a mobile phone, via a user interface designed in App Inventor. Figure 7 shows the user interface design used to measure and save the light intensity data received by the mobile, which is displayed numerically and graphically. In the graph, the x-axis shows the number corresponding to the current measurement; while the y-axis shows the detected light intensity (the area enclosed in a rectangle with dotted lines shows the location where the light sensor is actually located).
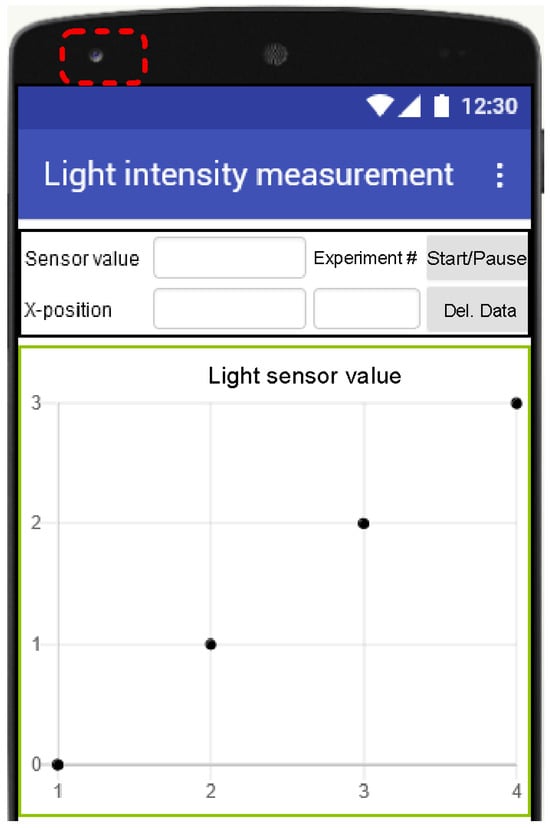
Figure 7.
User interface designed in App Inventor to measure the light intensity.
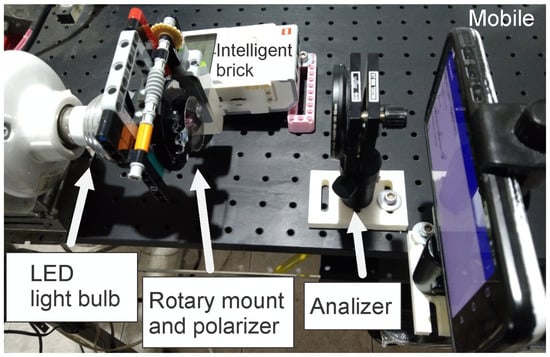
Figure 8.
The experimental setup.
In order to start the experiment, the initial intensity is recorded when the transmission axis of the polarizer is aligned with that of the analyzer along the y-axis. This initial reading serves as the reference point. Subsequent measurements are taken at various angles () as the polarizer is rotated. These scalar intensity values are then compared against the theoretical values predicted by Malus’s law as shown in Equation (2). Although the measurements lack specific units, the relative comparison between the initial intensity and the measured intensities at different angles confirms the law’s validity. For example, with an initial reading of 100 units at , a reading of 75 units at aligns with the expected value calculated as .
4. User Interface
As described above, the user interfaces and device control have been created using the App Inventor tool for Android devices, using a block-based programming language. Figure 9a shows the main menu that allows accessing the options:
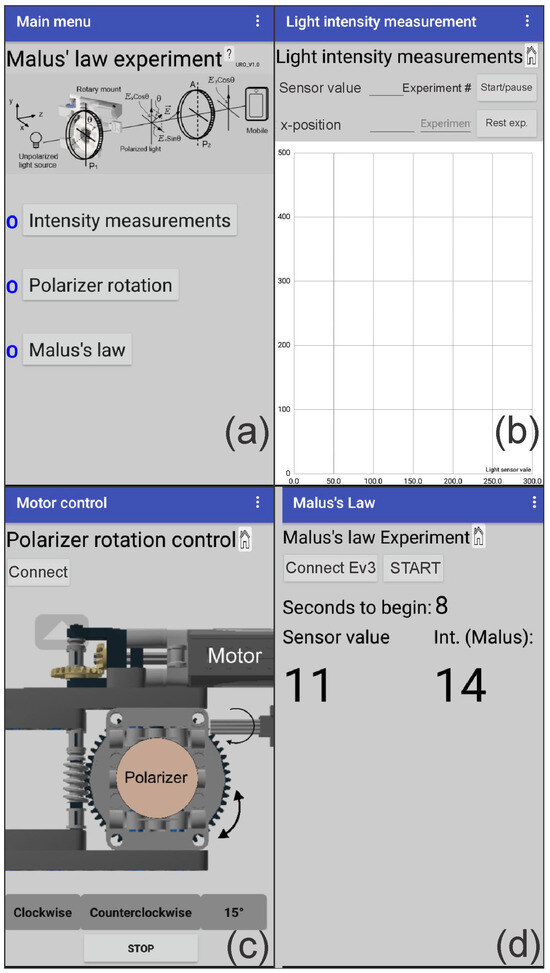
Figure 9.
(a) Main menu, and panels (options) used in the application; (b) measurement graph; (c) rotating control; and (d) Malus’s law check. See text for details.
- -
- Intensity measurements;
- -
- Polarizer rotations;
- -
- Malus’s law.
The first option (Figure 9b) uses the cell phone’s light sensor to measure the intensity of light received. These values to appear on an xy-graph, where the x-axis relates to the current measurement number (Experiment #) and the y-axis to the corresponding intensity (Sensor value). Each pair of values is automatically saved in a Google Sheet. The second option (Figure 9c) controls the rotating mount to which the first polarizer has been attached, giving the option to rotate continuously clockwise or counter-clockwise while the buttons are held down. It also provides the option to rotate in 15° steps when the button for this function is pressed (however, the EV3 Smart Brick allows you to control the motor from its input buttons without using this option). Finally, the demonstration of Malus’s law is carried out in the third option (Figure 9d). Taking into account again the option of Figure 9d, because the light sensor of the mobile phone to be used again, and at the same time, the rotation of the polarizer must be controlled, a button was added that starts a countdown from 9 to 0 (seconds to begin) to give the user time to place the mobile phone in the experimental setup. When the initial count ends, the current intensity value (this is the maximum intensity obtained when the transmission axes of P1 and P2 are placed parallel to each other) is recorded, while the mount containing the polarizer starts to rotate in constant steps of 15° until completing 180°, displaying the values of the light sensor (sensor value) reading as long as a change is detected. At the same time, the intensity calculated with Malus’s law is also displayed (Int. Malus).
5. Experimental Results
To verify Malus’s law, we conducted an experiment where the light intensity was measured at different angles of the rotating polarizer P1, while the transmission axis of P2 is perpendicular to it. The light sensor of a mobile device aligned to the output beam was used to capture the intensity values. The theoretical and experimental intensity values regarding Malus’s law were calculated using Equation (2).
Table 1 presents the theoretical () and experimental () intensities calculated with Malus’s law for constant rotations of , also showing their corresponding relative percentage error.

Table 1.
Theoretical and experimental intensity values and their relative errors at different polarizer angles.
Table 1 presents measurements up to 90° with increments of 15°, as this range effectively demonstrates Malus’s law due to its symmetry around the right angle. The angles beyond 90° reflect the same behavior as those within the range, making this selection both practical and efficient. The chosen increments provide a sufficient number of data points to illustrate the relationship between the intensity of light and the angle of the polarizer, while keeping the experimental setup manageable and straightforward for educational purposes. Figure 10 shows the results of the theoretical and experimental intensities with respect to the polarizer rotation angle. The errors between the two measurements are indicated by vertical bars.
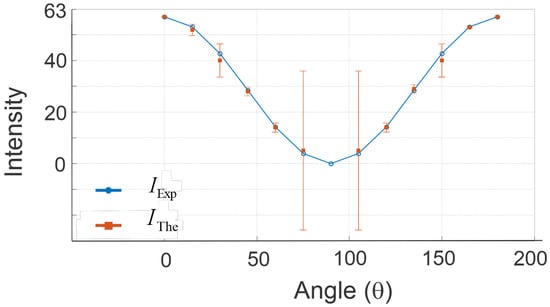
Figure 10.
Experimental intensity versus angle with error bars, compared to Malus’s law prediction.
To ensure the reliability and accuracy of our experimental results, we conducted five repetitions for each angle to verify the consistency of the light intensity readings. Performing these repetitions at every proposed angle helps identify potential experimental errors and enhances the credibility of our findings. By averaging the results from these five repetitions, we minimize the influence of random fluctuations, providing a more precise representation of the light intensity. The consistency observed in these repeated measurements confirms the precision and reliability of our experimental setup, validating the observed agreement with Malus’s law. The standard deviation is crucial as it measures the variability of the data, indicating the consistency and precision of the measurements.
It is worthy to note that the variations observed at higher rotation angles can be reasonably attributed to the mechanical characteristics of the LEGO EV3 system and the accuracy of its motor encoders [15,16]. As in any gear-based mechanism, a certain amount of mechanical play (backlash) exists between gears [17], and in this setup, the worm gear transmission may accumulate relatively small positioning errors (typical backlash values reported in the literature range from 0.5° to 2° angular play). Moreover, the EV3 motor encoders have a nominal angular resolution of about 1°, which may introduce comparably small deviations that become more noticeable at larger angles (for example, at 75° and 90°), where even minor misalignments result in significant intensity variations. These effects are inherent to modular, educational-grade hardware and are consistent with the didactic scope of this study, where accessibility and conceptual understanding are prioritized over metrological precision.
A low standard deviation obtained suggests that the data points are closely clustered around the mean, confirming the reliability of the experimental setup. Table 2 summarizes the repeated measurements, average intensity values, and standard deviations for the angles considered.
Table 2.
Repeatability of experimental intensity measurements (Meas.), the average values (Avg.) and the corresponding standard deviations (Std.Dev.) at different polarizer angles compared to theoretical calculations.
Figure 11 presents the coefficient of variation (CV) as a function of , calculated from repeated measurements in Table 2. This metric normalizes the standard deviation by the average intensity. The CV increases notably at higher angles, particularly near 90°, where the signal is weakest and relatively small fluctuations represent a larger proportion of the measured value. This trend supports the claim that measurement uncertainty grows in regions of minimal transmission and may also reflect increased mechanical sensitivity or alignment limitations at extreme angles.
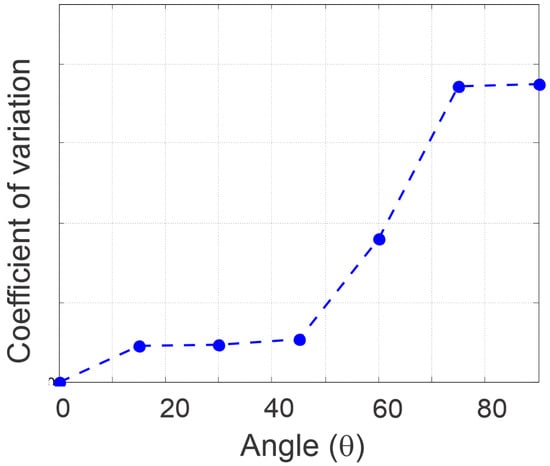
Figure 11.
Coefficient of variation as a function of angle. Higher CV values indicate increased relative uncertainty in lower-intensity regions.
6. Discussion
The results obtained in this study demonstrate the effectiveness of using quite low-cost and accessible technology to validate fundamental optical principles and highlight several relevant implications for both technical and educational contexts. However, some limitations must be acknowledged. The smartphone light sensor records relative rather than absolute intensity values, and its performance depends on the linearity of its response and environmental illumination. In addition, the LEGO EV3 motors possess a nominal angular resolution of approximately one degree, and the use of worm gears introduces mechanical backlash. These small deviations account for the minor discrepancies observed at higher rotation angles but remain acceptable for educational purposes, where the focus is on conceptual understanding rather than precise metrology.
Experiments developed with Arduino or Raspberry Pi platforms can reach higher accuracy by employing calibrated photodiodes and more refined data acquisition modules and mechanical setups; however, the experiments generally require more advanced programming and electronic assembly skills. In contrast, the presented configuration reduces the technical entry barrier and allows instructors to focus on reinforcing physical concepts rather than complex coding or circuit design.
From a pedagogical standpoint, this activity integrates robotics through LEGO devices with visual programming, enabling students to connect abstract optical theory with hands-on experimentation. By controlling the rotation of polarizers through code and directly observing the resulting variations in light intensity, users can experience an immediate relationship between theoretical models and experimental evidence. This resource reinforces conceptual comprehension and supports the development of computational thinking and problem-solving abilities across physics, electronics, and programming. The same framework can be adapted for other optical demonstrations, such as Brewster’s angle, polarization by reflection, or birefringence, aligning the activities with the STEAM educational approach.
To reinforce data interpretation, Figure 10 and Figure 11 compare theoretical and experimental intensities as a function of the polarizer angle with error bars and coefficient of variation, respectively. In order to show the procedure for using the application proposed here, the flow diagram in Figure 12 is included.
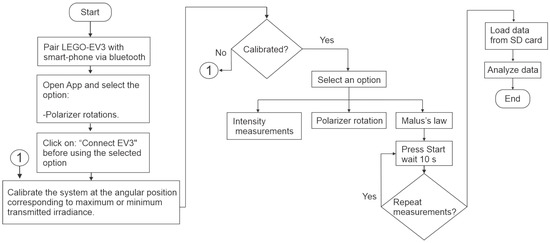
Figure 12.
Flow diagram summarizing the experimental procedure for demonstrating Malus’s law using the LEGO EV3 system and the custom mobile application.
7. Conclusions
In this study, we developed and implemented a custom mobile application to experiment with Malus’s law, integrating a LEGO EV3 system and a mobile device’s light sensor. Unlike other studies using pre-designed mobile applications, our approach focused on creating a tailored solution meeting the unique requirements of this optical experiment. The custom interface developed with MIT App Inventor enabled the rotation of polarizers controlled by motors connected to the LEGO EV3, while simultaneously measuring light intensity using the mobile light sensor. This innovative approach not only facilitated the understanding of fundamental optical concepts but also incorporated accessible technology to enrich the educational experience in physics.
Repeated measurements and the consistency observed in light intensity values confirmed the validity of Malus’s law and the accuracy of the experimental setup. The standard deviation values observed (see Table 2) suggest that the experimental setup is reliable and precise, with minimal variability in the measurements. A low standard deviation, particularly at critical angles, indicates that the data points are quite closely clustered around the mean intensity values. This consistency and reliability highlight the robustness of our experimental approach and further validate the observed adherence to Malus’s law.
In summary, this study underscores the importance of using readily available technology to conduct sophisticated scientific experiments, offering a customizable and adaptable solution for various educational settings. This approach not only aids in the understanding of theoretical concepts like Malus’s law but also promotes the integration of knowledge from physics, electronics, and programming. By leveraging accessible technology and direct programming environments, this setup encourages a holistic educational experience that bridges multiple disciplines, contributing to a more comprehensive and effective education in physics and related fields. Furthermore, the findings of this study lay a firm foundation for future studies, where angular polarization spectroscopy [18,19] may be explored and applied using the same experimental setup to detect adulterations in liquid samples. This potential application not only broadens the scope of the current study but also highlights the versatility and adaptability of the experimental setup for various scientific inquiries.
Author Contributions
Conceptualization, U.R.-O.; methodology, U.R.-O.; software, U.R.-O.; formal analysis, U.R.-O.; investigation, U.R.-O.; writing—original draft preparation, U.R.-O.; supervision, U.R.-O.; project administration, U.R.-O.; validation, U.R.-O., A.B.-P. and G.S.-G.; visualization, U.R.-O. and A.B.-P.; data curation, A.B.-P.; writing—review and editing, U.R.-O. and G.S.-G.; resources, G.S.-G.; funding acquisition, G.S.-G. All authors have read and agreed to the published version of the manuscript.
Funding
This research was funded by Universidad Tecnológica de Puebla, Mexico (institutional support, no specific grant number).
Data Availability Statement
The dataset and source code used in this study are openly available at Zenodo: https://doi.org/10.5281/zenodo.17268611.
Conflicts of Interest
The authors declare no conflicts of interest.
Abbreviations
The following abbreviations are used in this manuscript:
| App | application |
| Avg. | average |
| CAD | computer-aided design |
| CV | coefficient of variation |
| iOS | iPhone Operating System |
| LCD | liquid crystal display |
| LED | light emitting diode |
| Meas. | measurements |
| MIT | Massachustes Institute of Technology |
| P | polarizer |
| St. Dev. | standard deviation |
| STEAM | science, technology, engineering, arts, and mathematics |
References
- Hecht, E. Optics; Pearson Educational Limited: London, UK, 2017; Section 8.2.1. [Google Scholar]
- Pedrotti, F.L.; Pedrotti, L.M.; Pedrotii, L.S. Introduction to Optics; Cambridge University Press: Cambridge, UK, 2017; Section 15.1. [Google Scholar] [CrossRef]
- Cho, H. Optomechatronics: Fusion of Optical and Mechatronic Engineering; CRC Press/Taylor & Francis Group: Boca Raton, FL, USA, 2005; pp. 61–63. [Google Scholar] [CrossRef]
- Amrani, D. Malus’s law of light polarization using a computer-based laboratory. Lat. Am. J. Phys. Educ. 2009, 3, 229–231. Available online: http://www.lajpe.org/index_may09.html (accessed on 25 October 2025).
- Monteiro, M.; Stari, C.; Cabeza, C.; Martí, A.C. The polarization of light and Malus’ law using smartphones. Phys. Teach. 2017, 55, 264–266. [Google Scholar] [CrossRef]
- Önder, E.B.; Önder, F.; Oğur, M. An Arduino based experiment to prove and teach Malus’ law. J. Educ. Sci. Des. 2021, 9, 833–842. [Google Scholar] [CrossRef]
- Freitas, W.P.S.; Cena, C.R.; Alves, D.C.B.; Goncalves, A.M.B. Arduino-based experiment demonstrating Malus’s law. Phys. Educ. 2018, 53, 035034. [Google Scholar] [CrossRef]
- Addido, J.; Borowczak, A.C.; Walwema, G.B. Teaching Newtonian physics with LEGO EV3 robots: An integrated STEM approach. Eurasia J. Math. Sci. Technol. Educ. 2023, 19, em2280. [Google Scholar] [CrossRef] [PubMed]
- Rivera-Ortega, U. Application of computer vision and Lego Mindstorms in measuring Brewster’s angle and refractive index. Appl. Sci. 2024, 14, 9338. [Google Scholar] [CrossRef]
- Patton, E.W.; Tissenbaum, M.; Harunani, F. MIT App Inventor: Objectives, design, and development. In Computational Thinking Education; Kong, S.-C., Abelson, H., Eds.; Springer Nature Singapore Pte. Ltd.: Singapore, 2019; pp. 31–49. [Google Scholar] [CrossRef]
- Kaddipujar, M.; Rajan, J.; Kumbar, B.D. Mobile application development using MIT App Inventor: An experiment at Raman Research Institute Library. Bull. AAS 2022, 54, 21. [Google Scholar] [CrossRef]
- Deng, L.; Deng, J.; Guan, Z.; Tao, J.; Chen, Y.; Yang, Y.; Zhang, D.; Tang, J.; Li, Z.; Li, Z.; et al. Malus-metasurface-assisted polarization multiplexing. Light Sci. Appl. 2020, 9, 101. [Google Scholar] [CrossRef]
- O’Sullivan, R.; Tom, L.M.; Bunya, V.Y.; Nyberg, W.C.; Massaro-Giordano, M.; Daniels, E.; Smith, E.; Brainard, D.H.; Gee, J.; Maguire, M.G.; et al. Use of crossed polarizers to enhance images of the eyelids. Cornea 2017, 36, 631–635. [Google Scholar] [CrossRef] [PubMed]
- Vertchenko, L.; Vertchenko, L. Verification of Malus’s law using a LCD monitor and digital photography. Rev. Bras. Ensino Fis. 2016, 38, e3311. [Google Scholar] [CrossRef]
- Bevrnja, F.; Bevrnja, M.; Petrovic, M. Dynamics analysis, modeling and control of the LEGO EV3 modular mobile platform. Period. Engin. Natur. Sci. (PEN) 2020, 7, 1868–1878. Available online: https://web.archive.org/web/20240729075953/http://pen.ius.edu.ba/index.php/pen/article/view/1084 (accessed on 25 October 2025). [CrossRef]
- Cruz-Martín, A.; Fernández-Madrigal, J.A.; Galindo, C.; González-Jiménez, J.; Stockmans-Daou, C.; Blanco-Claraco, J.L. A LEGO Mindstorms NXT approach for teaching at data acquisition, control systems engineering and real-time systems undergraduate courses. Comput. Educ. 2012, 59, 974–988. [Google Scholar] [CrossRef]
- Admassie Ambaye, G. The performance of gear with backlash: A review. J. Appl. Mech. Engin. 2021, 10, 389. [Google Scholar] [CrossRef]
- Tarasashvili, V.I.; Purtseladze, A.L.; Petrova, S.S.; Shaverdova, V.G.; Tarasashvili, M.V. Qualitative analysis of wine and wine materials by polarized luminescent holography methods. Opt. Spectrosc. 2020, 128, 339–344. [Google Scholar] [CrossRef]
- Kharbach, M.; Alaoui Mansouri, M.; Taabouz, M.; Yu, H. Current application of advancing spectroscopy techniques in food analysis: Data handling with chemometric approaches. Foods 2023, 12, 2753. [Google Scholar] [CrossRef] [PubMed]


Disclaimer/Publisher’s Note: The statements, opinions and data contained in all publications are solely those of the individual author(s) and contributor(s) and not of MDPI and/or the editor(s). MDPI and/or the editor(s) disclaim responsibility for any injury to people or property resulting from any ideas, methods, instructions or products referred to in the content. |
© 2025 by the authors. Licensee MDPI, Basel, Switzerland. This article is an open access article distributed under the terms and conditions of the Creative Commons Attribution (CC BY) license (https://creativecommons.org/licenses/by/4.0/).