Abstract
In the 20th century, several large-magnitude earthquakes (M > 7.0) occurred in Greece and surrounding areas, some of which caused extensive structural damage and significant loss of life. Unfortunately, for these earthquakes, there was no recorded ground motion intensity data to extract information about the macroseismic intensity distribution within the affected areas. A characteristic example of such an earthquake is the M7.2 of 12 August 1953 on Cephalonia island, which led to the almost complete destruction of settlements across the Cephalonia, Zakynthos, and Ithaca islands in western Greece. Although the vulnerability of the buildings affected in 1953 substantially differs from modern structures, the intensity and spatial extent of the shaking indicate that an event of similar magnitude could, even today, place the built environment and critical infrastructure of the region at high seismic risk. This study aims to estimate peak ground acceleration and velocity (PGA–PGV) and macroseismic intensity for the Cephalonia, Zakynthos, and Ithaca islands associated with earthquake scenarios comparable to the 1953 event (M7.2), incorporating seismotectonic information about active faults linked to the historical earthquake and considering associated uncertainties. Ground motion prediction models recently developed for Greece are employed. High PGA values (0.41–0.44 g) are estimated for the M7.2 earthquake, for rock site conditions (Vs30 790 m/s), covering almost the entire island of Cephalonia; these can be considered as the minimum values expected on rock site conditions for a similar earthquake scenario.
1. Introduction
The earthquake that occurred on 12 August 1953 on the island of Cephalonia, in western Greece, has been characterized as one of the most disastrous earthquakes in Greece in the 20th century. This is based on observations and descriptions that refer to the human losses as well as to the building collapses and the full or partial failures of several structures on the Ionian islands of Cephalonia, Zakynthos, and Ithaca [1,2]. Cumulative losses and damages refer to the overall result of a seismic sequence of three major earthquakes with magnitudes Ms 6.4, 6.8 and 7.2 that occurred in this region on 9, 11 and 12 August 1953, respectively [1,3,4].
The available literature related to these three earthquakes mainly refers to the impact on populated areas regarding the effects on the local population (losses, injuries and internal migration) and on infrastructure (collapses, destruction and serious damage to buildings, water supply, electricity network, etc.), per the local and national press and [1,2,3,4,5,6,7,8]. Furthermore, the available literature makes evident the level of destruction through the actions of domestic and international immediate assistance to address the situation of emergency. More specifically, the number of human losses on these three islands amounted to 455, while the number of injured reached 2412, with 21 missing persons [8]. The literature concerning the effects of these three earthquakes, mainly on the inhabited areas of the islands of Cephalonia, Zakynthos and Ithaca, is considered sufficient to describe the significance of this seismic sequence. However, the corresponding literature in relation to the scientific information concerning the seismic faults that caused these strong earthquakes cannot be considered sufficient to provide a rational documentation of their location and geometry. Only almost 40 years later, through the work of [6], a first attempt was made to study this seismic sequence based on scientific data and on the relevant “identification” of the faults that could have been related to the largest earthquake in the sequence, the one with magnitude Ms7.2.
In the present study, we seek to assess the distribution of macroseismic intensities in the broader area of the Cephalonia, Zakynthos and Ithaca islands, corresponding to the Ms7.2 earthquake that occurred on 12 August 1953. For the site effect factor, a proxy of the shear wave velocity of the uppermost 30 m (Vs30) was considered. By this proxy, all the relative site effect factors that resulted in site amplifications were taken into account. Additionally, distribution of peak ground acceleration (PGA) and velocity (PGV) on surface rock conditions (Vs30 = 790 m/s) are also provided. These values could be adapted based on future, site-specific microzonation studies to provide a more realistic approach of the expected PGA and PGV values. The goal of this study is to understand the possible cause of the extended and extremely high intensities reported for the 12 August 1953 earthquake. For this purpose, a simplified methodology is proposed and implemented in this study. A regional ground motion model is tested before it is adopted in estimating ground motion intensity (PGA and PGV) on engineering bedrock by REDAS software (Rapid Earthquake Damage Assessment System-REDAS [9,10,11]). Finally, a comparison of estimated macroseismic intensities with those reported throughout the examined area is attempted and discussed accordingly.
The macroseismic intensities estimated in this study are based on ground motion intensity conversion equations (GMICEs), correlating them with the PGA and/or the PGV values [12]. These intensities refer to the direct damages due to strong earthquake ground motion, and not to the indirect phenomena such as landslides, tsunamis, or post-earthquake fires, which could also affect the structures. Thus, the comparison between macroseismic intensity estimated in this study can be compared to the observed and reported ones related to effects due to seismic motion, ensuring that they are compatible with each other [13].
An effort precedes to document the selection of potential groups of seismic faults and of their geometry (e.g., length and rupture surface, type of fault, dip angle, and surface rupture projection), seeking correspondence to the causative fault, considering all available seismotectonic information. The main criterion for the proper selection of these faults is that their geometry should match, as close as possible, all direct or indirect available information provided by other studies.
In summary, this selection was based on a series of data concerning magnitude, location of the epicenter, focal mechanism, observed surface permanent displacements, and reported seismic intensities in Modified Mercalli scale in populated areas of Cephalonia, Zakynthos and Ithaca [5,6,13,14]. In addition, the selection of potential seismic faults was also based on the fault zone tracing in the wider study area based on modern works carried out after the recent two earthquakes of magnitude Mw6.1 and 6.0 on Cephalonia island in 2014 (e.g., [15,16,17,18]) and the one with magnitude 6.8 on Zakynthos island in 2018 (e.g., [19,20,21,22]). It is worth noting that fault trace geometry proposed by [6], utilizing observed coastal uplifts, is used here as the “backbone” in deciding potential fault trace, and especially its extension, according to recently available information.
The macroseismic intensity, as well as the PGAs and PGVs assessment in the broader Ionian islands, for the Ms7.2 Cephalonia earthquake of 12 August 1953 is based on the use of the Rapid Earthquake Damage Assessment System (REDAS) [9,10,11]. This tool operates in two modes: (i) in near real time and (ii) in earthquake-based scenarios. In this study, the latter option is implemented. It is worth noting that PGA and PGV values estimated in this study for engineering rock-site conditions cannot be validated against observed recordings, which introduces an undefined uncertainty into the results of this study. Regarding the estimated macroseismic intensities in this study, although we attempt to compare them with the reported ones, a fundamental uncertainty remains for the following reasons. The reported macroseismic intensity values of the 12 August 1953 Ms7.2 event may reflect cumulative effects from all three events (Ms6.4, 6.8 and 7.2) that occurred close to Cephalonia island on 9, 11 and 12 August 1953, respectively. It is noteworthy that the maximum macroseismic intensities reported on Cephalonia island for the 11 August, Ms6.8 event reached values up to 9, and up to 9+ in the southern part of the island, according to the isoseismal map of [3,4]. In contrast, the corresponding maximum values one day later for the Ms7.2 event range between 9 and 10+. Considering this, the maximum macroseismic intensities attributed to the Ms7.2 event on Cephalonia island, may be slightly overestimated in some cases.
A similar consideration applies to the macroseismic intensities reported to Zakynthos island. Specifically for the 11 August Ms6.8 event, macroseismic intensity values of 9+ and 9 are reported on the isoseismal map of [3,4] for the northern and southern parts of the island, respectively. In contrast, one day later during the Ms7.2 event, the corresponding values decrease to 7+ and 6+, respectively [3], indicating that Zakynthos island was affected to a lesser extent.
2. Seismotectonic and Geological Setting of the Study Area
The examined area of the Ionian islands (Figure 1), and especially Cephalonia, is one of the most seismically active regions in Europe. Several large-magnitude earthquakes have occurred in this area, as documented in various earthquake catalogues [23,24,25]. The seismotectonic processes in this region are mainly related to the collision between the Eurasian tectonic plate and the African one [26,27]. Two main seismotectonic regimes dominate this area of the southern Ionian islands. The first is related to the Cephalonia Transform Fault Zone (CTFZ [28]), which is mainly located along the western part of Cephalonia island and extends northward toward the western part of Lefkada island [29,30] (Figure 1). During the last 25 years four earthquakes with moment magnitudes ≥ 6.0 have been associated with this dextral strike-slip fault motion of the CTFZ. Two of these events, with moment magnitude 6.1 and 6.0, occurred on 26 January and 3 February 2014, respectively, on Cephalonia island (among others [18,31]).
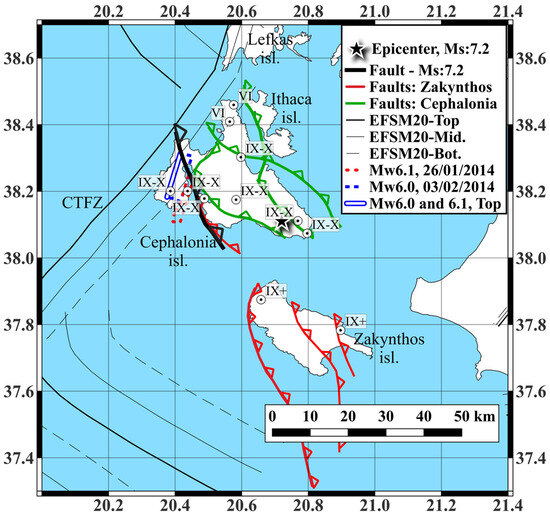
Figure 1.
A map of the area of interest in western Greece (light blue for the sea and white for the land). In the black bold line, the examined thrust fault related to the Ms7.2 earthquake on 12 August 1953, based on [6], is depicted. In green bold lines, other main thrust faults on Cephalonia island are depicted, based on [6,17]. In red bold lines, thrust faults on the broader region are depicted, based on [32]. In red and blue dashed lines, the fault plane projections of the Mw6.1 and 6.0 events that occurred in Cephalonia in 2014 are depicted, based on [33], while in the blue–white solid line, the fault surface trace of the fault of the Mw6.1 event is also depicted, based on the same study. Fault zones of the European Fault-Source Model of 2020 (EFSM20 [34]) and in Latin numbers, observed macroseismic intensities in (Modified Mercalli scale) of the Ms7.2 earthquake [1], are also depicted; the symbol “+” is considered to indicate plus 0.5 degrees of macroseismic intensity.
The second seismic regime is associated with a reverse faulting zone, primarily driven by horizontal compressional strain [2,35,36] corresponding to the upper part of the SW Hellenic Arc subduction. A characteristic recent event related to this regime occurred on 28 October 2018, approximately 30 km southwest (SW) of Zakynthos island, near the subducting slab of the NW Hellenic Arc, with a moment magnitude of 6.8 [22]. A vertical component of seismic slip is also directly related to earthquakes that occurred on Cephalonia island. For example, the 6.0 earthquake on 3 February 2014 exhibited a vertical component of seismic slip [33], while the large-magnitude (7.0) earthquake of 17 January 1983, approximately 20 km SW of Cephalonia, also induced a minor thrust component [37].
With regard to the surface geology of the three Ionian islands (Cephalonia, Ithaca and Zakynthos), it can be stated that they consist of two main groups of geological formations, according to the geological map (scale 1:500,000, Figure 2) produced by the Hellenic Geological and Mining Research Authority (EAGME, https://eagme.gr/site/services, accessed on 12 February 2026). The first group refers to “rock-type” geological layers, mainly represented by limestones of different geological ages (Upper Triassic to Late Cretaceous epoch). The second category consists primarily of post-tectonic and late-tectonic sediments of the Plio–Pleistocene, as well as of Holocene alluvial deposits occurring in valleys, plains and coastal deposits (Figure 2). Regarding the surface geological structure of the western Greece area, close to the three Ionian islands, more extensive sedimentary basins and plains are observed (Figure 2). These areas consist of Holocene alluvial deposits, or marine deposits of the Pliocene, or Pleistocene lacustrine and continental deposits. Extended outcrops of Flysch are also observed, while Pelagic limestones of Pindos Zone from the Upper Cretaceous are presented in the eastern part of the examined mainland of Greece.
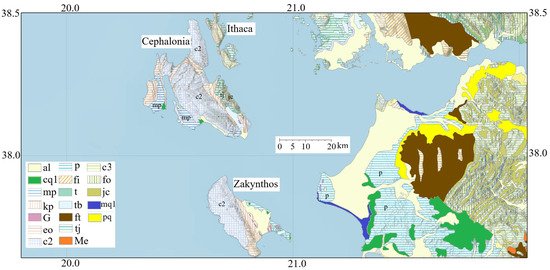
Figure 2.
The geological map (1:500,000) of the wider area around of Cephalonia island (modified by the Hellenic Geological and Mining Research Authority, EAGME: https://eagme.gr/site/services, accessed on 17 February 2026) (in light blue the sea is depicted). Legend of map: “a1”: Alluvial deposits in valleys, plains and coastal deposits; Holocene, “cq1”: Lacustrine and continental deposits clay, loam, sand, conglomerates, red clayey; Pleistocene, “mp”: Marine deposits, Upper Miocene—Pliocene; “kp”: Cryptoflysch, Miocene, “G”: Triassic gypsum; “eo”: Limestones, Eocene—Oligocene; “c2”: Limestones, Cenomanian—Maestrichtian; “p”: Marine deposits, Pliocene; “fi”: Flysch; “t”: Limestones with “Cardita”, Middle-Upper Triassic; “tb”: Triassic breccias, Triassic (Lower); “ft”: Flysch; “tj”: Limestones of the “Pantocrator” facies, Upper Triassic—Lias; “Me”: Limestones and dolomites, Mesozoic—Eocene; “c3”: Pelagic limestones, Upper Cretaceous; “fo”: Flysch; “jc”: The “first flysch” as well as the series of pelites and radiolarites, Jurassic and Cretaceous; “mq1”: Marine deposits, marls, clays, sand, conglomerates, coastal terraces and “porous” of Cyclades islands, Pleistocene; “pq”: Post-tectonic and late-tectonic sediments, Plio—Pleistocene.
Regarding the Ms7.2 earthquake of 12 August 1953 examined in this study, a clear thrust fault is indicated based on the focal mechanism provided by [14]. Nodal Plane-1 has a strike of 163° and a dip of 34° toward the east, while Nodal Plane-2 has a strike of 150° and a dip of 56° toward the west. Based on multiple sources of information, ref. [6] suggested a fault trace related to this thrust mechanism (Figure 1), for Nodal Plane-1. Some of this information refers to the coastal uplifts of the island (Figure 3), derived either from in situ observations, or from reports referenced in [5,13]. Other information pertains to intensity measurements (Figure 1, circles with dot) associated with the entire seismic sequence of the Ms7.2 Cephalonia earthquake, including the two preceding mainshocks of 6.4 and 6.8, which occurred on 9 and 11 August 1953, respectively, around Cephalonia [1].
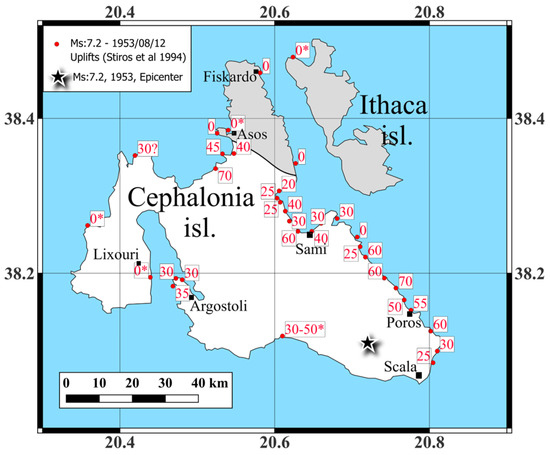
Figure 3.
A modified map based on [6], showing uplift observations in cm (red colored numbers) after the 1953 Ms7.2 seismic sequence. Numbers with an “*” correspond to estimations provided by [5,13], while the rest of the numbers correspond to observations by [6], or to information extracted by various reports. The grey areas correspond to no-uplift of a part of the Cephalonia and Ithaca islands. In light blue the sea is depicted, while with black boxes, several locations on Cephalonia island are also presented.
3. Methodology
The Deterministic Seismic Hazard Assessment (DHSA) applied in this study for the Ionian island and western Greece, with respect to the 12 August 1953 earthquake (Ms7.2), is based on the REDAS software (version: 1.5H) [9,10]. This application followed two parallel procedures, as illustrated in the flowchart in Figure 4: (i) The designation and documentation of six approaches of the most probable seismic fault scenarios, considering multiple constraints and using the fault trace proposed by [6] as the “backbone”. (ii) The selection and validation of the appropriate ground motion model (GMM) used for the reliable estimation of ground motion intensity measures (i.e., PGA, PGV) in the examined area.
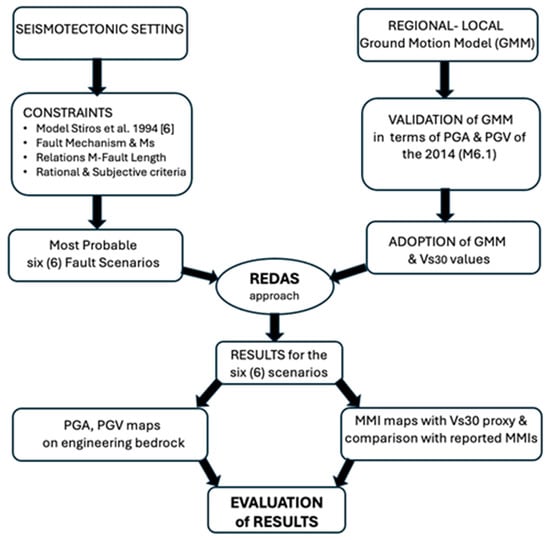
Figure 4.
Flowchart of the steps followed in this study to apply deterministic seismic hazard assessment in the southern Ionian islands and western Greece, based on the 12 August 1953 earthquake with Ms7.2 [6].
The latter is performed through the application of REDAS, for the Mw6.1 earthquake that occurred on 26 January 2014. The estimated PGA values are compared with the corresponding recorded ones at certain locations close to the seismic source, at distances less than 100 km. These locations correspond to the accelerometer stations of the Institute of Engineering Seismology and Earthquake Engineering (ITSAK, https://www.itsak.gr/, accessed on 17 February 2026) and the Geodynamic institute of the National observatory of Athens (NOA-GI) (https://www.noa.gr/en/institutes/gein/, accessed on 17 February 2026).
Finally, the DSHA results of the macroseismic intensities of all six examined seismic faults were evaluated with respect to the reported values, in order to identify the most suitable seismic fault scenario. Consequently, the characteristic PGA and PGV values on engineering rock site conditions for Vs30 = 790 m/s, at specific sites of interest in Cephalonia, Ithaca and Zakynthos islands, can be provided.
3.1. REDAS Description
The Rapid Earthquake Damage System (REDAS) is a tool for estimating deterministic seismic hazard and risk. It operates in two modes (i) real time and (ii) offline, scenario-based [9,10].
In the real-time mode (i), an earthquake alert, including hypocenter, location and magnitude, is automatically sent to the system, which then is activated. REDAS uses ground motion models (GMMs) to estimate ground shaking at a dense grid of predefined points in the examined area, accounting for local site conditions, through the Vs30 proxy. Observed ground motion intensity measures (e.g., PGA, PGV, response spectra values) from accelerometers in the examined area are also incorporated to correct the GMM estimates. Finally, a map of ground motion intensity distribution is generated. By providing geolocated fragility curves of the built environment, REDAS can also estimates the spatial distribution of damage levels. This entire process occurs automatically and typically takes less than a few minutes (<5 min) after the earthquake triggering alert.
In the offline scenario-based mode, an earthquake scenario is implemented a priori, either based on the assumed earthquake hypocenter, location and magnitude, or using a predefined seismic fault geometry. The subsequent procedure is the same as in the real-time mode, except that recorded ground motion intensity measures are not available, and only GMMs are used. This mode of REDAS is applied for preventive planning and the accuracy of the causative faults is critical. Regarding the computation of the macroseismic intensity (in Modified Mercalli, MMI scale), the ground motion intensity conversion equation (GMICE), relating PGA to MMI determined by [12], is used.
3.2. Evaluation of GMMs for the Examined Area
On 26 January 2014, at 13:55 GMT, an earthquake with seismic moment magnitude of 6.1 occurred on the island of Cephalonia. Eight days later, on 3 February 2014, at 03:08 GMT, a second event of moment magnitude 6.0 occurred close to the same area [15,16,18] (Figure 5). Both earthquakes were felt across the wider Ionian islands region and western Greece. According to [15], based on the distribution of hypocenters and the Coulomb stresses analysis, the causative faults of both events were approximately NNE–SSW in orientation, adjacent to each other, and their projections are located on the Paliki peninsula. Both earthquakes have a significant dextral strike-slip component of motion.
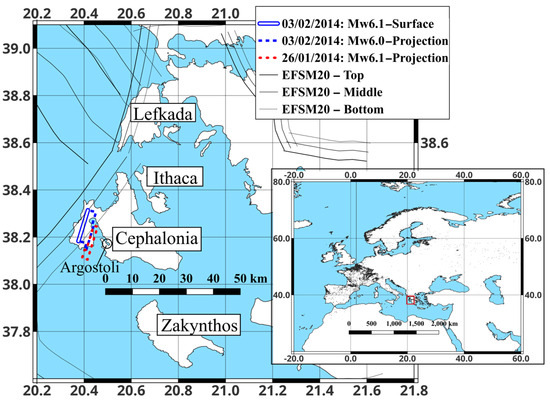
Figure 5.
Maps depicting the study area of western Greece and Ionian islands (in light blue and white, the sea and the land are depicted, respectively), as well as the main seismic fault zones of the corresponding model of the European Fault-Source Model of 2020 (EFSM20 [34]). The top fault extension on the surface of the Mw6.1 (white–blue line) and fault projections of the doublet-earthquake Mw6.1 and 6.0 (red and blue dashed lines, respectively), as provided by [33], are also depicted.
Seismic parameters from different literature vary slightly for both events: according to the Global Centroid Moment Tensor solutions (GCMT), the first earthquake had a seismic moment magnitude 6.15, strike 20°, and dip 65° to the east; the Seismological Station of Aristotle University of Thessaloniki reported seismic moment corresponding to 6.06, strike 16°, and dip 85° to the east, and the Geodynamic Institute of the National Observatory of Athens reported 6.0, with a strike 21° and dip 85° to the east. The focal mechanism is directly related to the corresponding stresses of the neighboring Cephalonia Transform Fault Zone (CTFZ [28,29]).
The fact that both mainshocks occurred on adjacent faults and in close temporal proximity makes it difficult to study and identify the absolute fault planes responsible for the corresponding ruptures. This difficulty arises from the mixed distribution of hypocenters and the insufficiency of data concerning the surface displacements separately for each earthquake measured via satellites. Ref. [33] utilized such surface displacement data to identify the cumulative surface displacement of both events but could not separate the contribution of each earthquake due to the lack of satellite observation in the intervening days. Nevertheless, they resulted in a relatively accurate determination of the total energy release of both earthquakes. Then, by combining this result with the energy release of each earthquake separately, based on their seismic moments and the average fault orientations inferred from focal mechanisms, they proposed that both seismic events resulted from ruptures along the same fault at different depths and with different dip angles.
More specifically, according to [33], the rupture of the first earthquake on 26 January 2014 occurred on a fault approximately 16 ± 2 km long, with a strike of 14° and a dip of 70°, at a depth ranging from 4 to 8.5 km. These fault characteristics are consistent with those calculated by [31] (strike: 15–30° and dip: 70–85°), based on the analysis of teleseismic recordings, although the estimated depth is slightly greater, ranging from 8 to 12 km. The fault characteristics also show good agreement with the most recent study by [17], which suggested that the rupture occurred along a dextral strike-slip fault at a depth of 11 km.
Regarding the implementation of REDAS in this study for the earthquake on 26 January 2014, the fault geometry from [33] (strike 14° and dip 70°) was adopted as a representative seismic source, as it aligns well with the strike and dip estimates from [15,17,31] and the focal mechanism analyses discussed above. The moment magnitude of 6.07 was selected as a representative average (geometric mean) of the magnitudes reported by different seismological centers (GCMT: 6.15, S.S.—A.U.Th.: 6.06 and G.I.—N.O.A.: 6.00), in good agreement with the magnitude range proposed by [17] (6.02–6.06).
Regarding the depth of the rupture, a value of 9 km was selected as a representative average, taking into account the ranges reported by [33] (4–8.5 km), [31] (8–12 km), and [17] (11 km). Considering this average depth along with the average dip of 70°, the average width is estimated to be approximately 14 km, while the minimum rupture depth reaches 4 km. These fault geometry parameters for the first earthquake were used as input for the source model in REDAS for the deterministic seismic hazard assessment, as described below. It is worth noting that the rupture characteristics of the second earthquake, which occurred on the same fault according to [33], are also provided as they are linked to the first earthquake. The second rupture was shallower, with a dip of 30° and a length of 15 ± 2 km. In Figure 5, the traces of both faults, as well as their projection on the surface, are depicted.
For the application of REDAS to the 26 January earthquake, site effects were incorporated using soil conditions. Specifically, the estimated values of the shear wave velocity of the uppermost 30 m (Vs30), for each cell of a 0.005 × 0.005 degrees grid (Figure 6), were used. These per-cell Vs30 values are based on a combination of geology, slope and geomorphological data [38]. For the 13 examined locations, corresponding to recording stations that provided ground motion data (Table 1), the measured Vs30 values [39] were used.
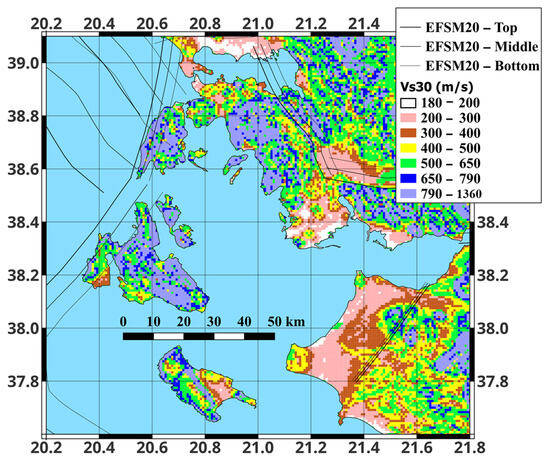
Figure 6.
Distribution of estimated Vs30 values per grid-cell of 0.005 × 0.005 degrees in the examined area of western Greece and southern Ionian islands (Figure 5), based on [38]. In light blue, the sea is depicted.

Table 1.
The values of the observed peak ground acceleration and velocity (PGA, PGV-observed) of the first earthquake (M6.1) as recorded at 13 accelerometer stations (R < 100 km), belonging to the accelerometric networks of the Institute of Engineering Seismology and Earthquake Engineering of Thessaloniki (ITSAK) (HI) and to the Geodynamic Institute of the National Observatory of Athens (NOA-GI) (HL). The values of the shear wave velocity for the uppermost 30 m (Vs30) for each station are given [39]. The Joyner–Boore Distance () and estimated values of PGA and PGV are also provided.
Regarding ground motion models (GMMs), the one recently developed for Greece by [40], with bias, and another, without bias, were used. Both cases were considered, and an average approximation was adopted. More specifically, when calculating the values corresponding to PGA and PGV, both cases of GMM were considered with equal weights, that is, each with a weight of 0.5.
Figure 7 shows the distribution of peak ground acceleration (PGA) for the first earthquake (6.1) using REDAS, taking into account the factor of local soil conditions through the Vs30 proxy (Figure 6). The map in Figure 7 indicates that the maximum values are presented near to and above the projection of the selected fault, mainly at the western part of Cephalonia on the Paliki peninsula, as well as in places near the town of Argostoli and in the northern region. The recorded PGA at the “ARG2” accelerometer station in Argostoli is 404.9 cm/s2, while the corresponding estimated value is ~15% higher (468.2 cm/s2), which falls within one standard deviation of the GMM.
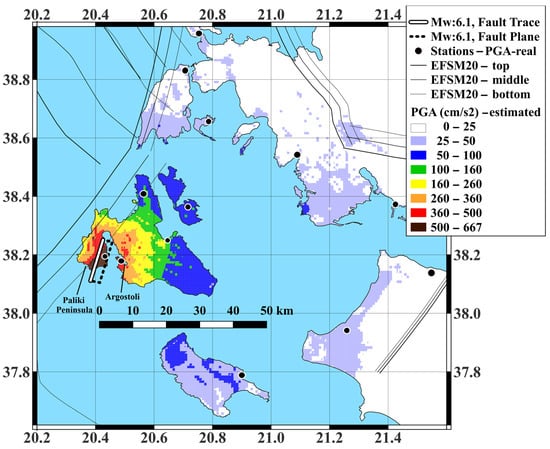
Figure 7.
Illustration of the distribution of estimated PGA values of the earthquake with Mw6.1, which occurred on Cephalonia island (26 January 2014), taking into account the distribution of Vs30 values (Figure 6) per grid-cell of 0.005 × 0.005 degrees (in light blue and white the sea and the land are depicted, respectively). A total of 13 station sites are depicted with black circles, and their (Vs30 values are provided in Table 1. The black dashed line depicts the fault projection corresponding to the examined earthquake [33].
Figure 8a shows the comparison between the recorded PGA values (PGA-real) and the estimated ones (PGA-sim) at the 13 accelerometer stations (Table 1) located at distances less than 100 km from the examined fault projection (Figure 7). The recorded and estimated PGA values are in satisfactory agreement, supporting the choice of the GMM in combination with the use of Vs30 values provided for each station in Table 1. This agreement is also confirmed by the comparison of estimated and observed PGV values in Figure 8d, taking also into account a 44% standard deviation on the estimated values.
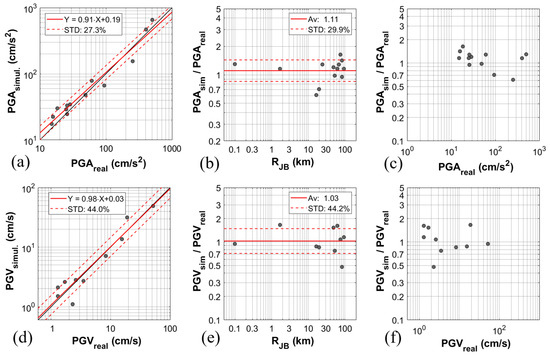
Figure 8.
(a) Comparison of the observed values of the peak ground acceleration (PGA-real) recorded at the 13 accelerometer stations (Table 1) with the assessed values (PGA-simul) in this study (in black line the bisector, and in red solid and dashed lines the least square model, in log-log scale, and its ± 1 standard deviation, are presented). (b) Comparison of the PGA-sim/PGA-real ratio with distance, . The solid and dashed red lines show the geometric mean of the ratio as well as the corresponding standard deviation (in %), respectively. (c) Comparison of the PGA-sim/PGA-real ratio, with the corresponding observed, PGA-real values. (d–f) Corresponding to a, b and c figures, but for peak ground velocity (PGV) values.
In Figure 8b the ratio of the two quantities (PGA simulated over PGA observed) is presented, indicating that, on average, PGA-sim deviate by approximately 30% from the PGA-real. The average ratio (PGA-sim/PGA-real) shows a slight overestimation of 10% of the assessed PGAs, which, however, falls within a range of one standard deviation. This deviation between recorded and simulated PGA values is consistent with the GMM standard error (~88%). A similar agreement is observed for PGV values in Figure 8e, where the simulated values align with the observed ones, within 44% variations around the bisector.
From Figure 8b,c, as well as from Figure 8e,f, it can be concluded that the ratios PGA-sim/PGA-real, and PGV-sim/PGV-real are independent of the distance from the fault projection and are not strongly dependent on the level of the maximum recorded values. Based on these observations, it is concluded that the REDAS can be safely applied to the wider area of Cephalonia island for various earthquake scenarios.
3.3. Seismic Fault Scenarios of the 1953 Earthquake (Ms7.2)
As mentioned in the Introduction, the causative seismic fault of the 12 August 1953 earthquake 7.2) in Cephalonia has not been clearly identified. Only nearly 40 years later an effort has been made by [6] to determine the possible surface fault trace and its geometry. Here, an effort is made to redetermine this fault and its geometry based on the work of [6]. Firstly, the surface wave magnitude () reported by [14] was converted to moment magnitude () using empirical relations between these two magnitude scales. According to the relevantly recent global conversion relations proposed by [41], an earthquake of = 7.2 corresponds to = 7.25, with a standard deviation of 0.16. Subsequently, the estimated was related to fault geometry parameters (length, width) using appropriate scaling relations. Therefore, rather than examining a single fault plane corresponding to the = 7.2, a set of possible fault planes, with varying lengths and widths based on the = 7.25 and its one standard deviation range (i.e., = 7.09 and 7.41), was considered as seismic source input in REDAS.
Table 2 presents the corresponding surface length () and width () for the three examined cases ( = 7.09, 7.25 and 7.41), based on the global scaling relations between - and - for thrust faults, proposed by [42]. Using these fault-length estimates, the next step was to determine the corresponding surface fault traces. This was carried out by adopting the thrust fault trace proposed by [6], which lies close to the coastline of Cephalonia island between the towns of Argostoli and Lixouri (Figure 1, black line). Finally, two groups (Group I and II), each one consisting of three fault planes corresponding to the three possible moment magnitudes ( = 7.09, 7.25 and 7.41), were examined separately in order to represent two alternative groups of potential seismic faults. Following certain criteria, the investigated faults were reshaped into different geometries. These criteria include the estimated length and width of the faults, the requirement that the earthquake epicenter lies within the surface projection of the fault, and the existing knowledge about the geometry of other adjacent faults. The geometry of each reshaped fault follows the surface fault trace proposed by [6], attempting to satisfy observational constraints from coastal uplift field evidence (Figure 3), as well as the macroseismic intensities distribution in Cephalonia, Zakynthos and Ithaca islands reported by [1].
Table 2.
The corresponding length and width to , based on relations proposed by [42] for the thrust fault.
3.3.1. Group I—Potential Fault Geometry of the 1953 Earthquake (Ms7.2)
Taking into account all three different estimated (Table 2), the first attempt was to set the fault trace corresponding to the lower possible magnitude (average minus one standard deviation, 7.09; Table 2). This was done to ensure that the fault projection geometry encompasses the redefined earthquake epicenter estimated by [14] (lat: 38.11, long: 20.72; Figure 1). It is worth noting that this relocated epicenter lies very close to the one computed first by [43] (lat: 38.21, long: 20.7367). To satisfy this criterion, considering the possible fault projection based on the corresponding examined length and width (40.5 km and 19.8 km; Table 2) and the dip angle (34°) [14], the fault trace determined by [6] was slightly extended to the southeast and restricted toward the northwest (Figure 9a) by 5 km. This modification respects the orientation of the southwestern coastline of Cephalonia and is consistent with the offshore fault trace depicted by [20] (Figure 1, red line), who kept a longer offshore trace than the one presented by [6]. Furthermore, the adopted geometry aims to align with the geometry of the offshore thrust fault zones in the western part of Zakynthos island as defined by the European Fault-Source Model of 2020 (EFSM20 [34]; Figure 9a, thick black lines), as well as with the thrust fault zone east of Cephalonia, and southwest of Ithaca island, as reported by [6,17] (green lines in Figure 1).
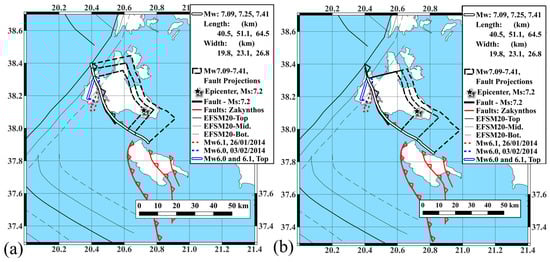
Figure 9.
(a) In white lines and black dashed lines, surface traces and projections of the three cases (Mw7.09, 7.25 and 7.41) of Group I possible fault scenarios geometry (see text) suggested in this study, for the Ms7.2 Cephalonia earthquake in 12 August 1953, are presented. The length and width of each potential fault are provided as inset in the figure. In red bold lines, the main thrust faults on Zakynthos island are depicted, based on [14]. In red and blue dashed lines, the fault plane projections (in difference depths) of the Mw6.1 and 6.0 events that occurred in Cephalonia island in 2014 are depicted, based on [33]. In the blue–white solid line, the fault surface trace of the common fault of the Mw6.1 and 6.0 events is also depicted, based on the same study. Fault zones of the European Fault-Source Model of 2020 (EFSM20 [34]) depicted in Figure 1 are also presented. In light blue and white, the sea and land are depicted, respectively. (b) Corresponding to (a) potential fault geometries of Group II (see text), suggested in this study.
The next step was to determine the corresponding fault trace for the average 7.25 (length: 51.1 km and width: 23.1 km; Table 2) which corresponds to the 7.2 [14] earthquake of 12 August 1953 in Cephalonia. Taking into account the aforementioned shorter fault trace defined for the average minus one standard deviation, (7.09; Table 2, Figure 9a), as well as the fault trace proposed by [6] (Figure 9a), which was used as the “backbone” for fault-retracing, the new fault trace was obtained by extending the 7.09 fault trace, almost symmetrically at both ends, toward the north and south. More specifically toward the north, the fault trace was extended by 5.6 km along the fault trace suggested by [6] (Figure 9a), seeking to ensure that the northern upper corner of the fault was reached. Toward the south, the fault trace was extended by the remaining 5.0 km, respecting the direction of the strike of the fault (163° [14]), related to the examined low dip plane thrust (Plane-1: strike: 163°, dip: 34° [6]).
Finally, the fault trace corresponding to the average magnitude plus one standard deviation case (7.41, length: 64.5 km and width: 26.8 km; Table 2, Figure 9a) was determined. Following the fault trace determined directly above for the average case (7.25) (Figure 9a), the length of the 7.41 should be equally extended to both ends by 6.7 km. However, considering that the extension to the north will intersect the surface fault trace of the Cephalonia Transform Fault Zone (CTFZ [28]), as provided by the European Fault-Source Model of 2020 (EFSM20 [34], Figure 1), the extension of the examined fault trace for the 7.41 earthquake was restricted to this direction, and its length was accordingly increased towards south. Consequently, the fault trace was extended by 3.4 km to the north, up to its intersection with the CTFZ, and by 10 km to the southeast (Figure 9a).
3.3.2. Group II—Potential Fault Geometry of the 1953 Earthquake (Ms7.2)
The reshaping process of the fault geometry for the Ms7.2, 1953 Cephalonia earthquake for the Group II approach followed the same methodology applied to Group I with a fundamental difference. In this case, all three examined fault planes are restricted at their northern end to the same fixed location and are extended exclusively toward the south. The point where the three examined faults are anchored to the north is actually a reasonable natural boundary, defined by the presence of the end edge of the surface trace of the strike-slip fault related to the 2014 doublet earthquake event of 6.0 and 6.1, as it is depicted in Figure 1 (blue–white line). It is worth noting that this constraint constitutes a new condition with respect to those adopted by [6], as this information was not available at the time of their study.
The first fault examined within Group II corresponds to the shorter fault length associated with the lower possible magnitude (average minus standard deviation, 7.09; Table 2). It is declared that this fault (Figure 9b) is almost identical to the corresponding one of Group I (Figure 9a), which already satisfies the criterion that its northern upper edge coincides with the eastern edge of the strike-slip fault of the 6.0 and 6.1 double event. For this reason, this fault geometry is not presented in the current section. Regarding the second examined fault of Group II, i.e., the one for the average potential magnitude (7.25; Table 2), with length 51.1 km and width 23.1 km, it lies on the first fault trace (Figure 9b), being extended for 10.6 km toward the south, following the same trace as the third fault of 7.41 of Group I (Figure 9b). Finally, regarding the reshaping of the third fault geometry of Group II, i.e., the one for the average plus one standard deviation potential magnitude (7.41; Table 2), with length 64.5 km and width 26.8 km, it lies on the second fault trace of the current examined Group II (Figure 9b). However, it is extended for extra 13.4 km towards the south (Figure 9b). This extension was oriented toward Zakynthos island; however, the selection of its exact trace is necessarily approximate, as no direct geomorphological evidence of fault continuation is available due to submarine conditions. Thus, considering the three principal fault traces identified on Zakynthos island, as presented by [20], the extension of the fault trace for 7.41 was directed toward the easternmost fault trace of Zakynthos.
This choice was based on two criteria. First, no surface fault ruptures were reported on Zakynthos during the August 1953 seismic sequence; therefore, extending the fault toward the central Zakynthos fault was rejected, as the examined 7.41 rupture should be related to uplift phenomena. Second, although the western Zakynthos fault could geometrically represent a plausible continuation of the examined fault of 7.41, this option was also discarded because the fault projection of the corresponding 7.09 and 7.25 (a, b) for the average minus standard deviation and average magnitude scenarios, respectively, of Group II cannot not include the projection of the epicenter of the examined earthquake, which is an essential constraint adopted in this study for defining acceptable fault geometries.
4. Results
A deterministic seismic hazard assessment (DSHA) was implemented in this study for the two groups of the examined faults (Group I (Figure 9a) and Group II (Figure 9b)), based on the Rapid Earthquake Damage Assessment System (REDAS). The attenuation model used for the DSHA was the one recently calculated and proposed for the Greek area by [40], taking into account both GMMs with and without bias. This model was validated earlier in this study (Figure 6 and Figure 7) for its appropriate application to high-magnitude earthquakes in western Greece, after being applied to the 25 January 2014 Cephalonia earthquake of 6.1. The first step was to apply the REDAS in order to compute the seismic intensity (Modified Mercalli) in the area of interest, and to compare the results with the reported values [1,4] of the 12 August 1953 event near Cephalonia island (Figure 1). For the needs of these computations, the site effect parameter of Vs30 (Figure 6), which affects ground motion intensity, was considered.
4.1. DSHA for Group I—Causative Faults Scenarios of the 1953 Earthquake (Ms7.2)
In Figure 10a–c, the computed seismic intensities (Modified Mercalli) for the area of interest are presented based on the Group I potential fault geometries (Figure 9a) for = 7.09, 7.25 and 7.41, respectively. For case (a), corresponding to the average minus one standard deviation moment magnitude (7.09) (Figure 10a), almost the entirety of Cephalonia island appears to be dominated by seismic intensities between 7.5 and 8.5. At a few sites very close to the seismic fault projections (<5 km), where the Vs30 values are relatively low (200–430 m/s), the seismic intensities may reach up to 9. These values seem to be approximately 1.5 intensity degrees lower than the relatively high reported macroseismic intensities for the several locations on Cephalonia island, as provided by [1,3]. In a small area in the north of the island and along its southeastern coastline, seismic intensity ranges between 7 and 7.5. These values are overestimated with respect to the reported ones for the northern part of the island, by about 1–1.5 intensity degrees, while for the southern part, these values are underestimated by approximately 1.5–3 degrees. A similar pattern is observed for a small area in the western part of the island on Paliki peninsula (Figure 10a). On Ithaca island, the estimated seismic intensities are lower, mainly ranging between 6.5 and 7.5, as the island is located farther from the examined fault projection. These values are underestimated with respect to the reported intensity of 9 by at least 2.5 degrees. In the northern part of Zakynthos, the seismic intensities mainly range between 6.5 and 7.5, reaching the reported values (Figure 10a), whereas in the rest of the island the intensities decrease from 6.5 to 4.5 towards the south, where the distance from the fault projection is greater (>25 km). For Zakynthos city, the estimated seismic intensity ranges between 5.5 and 6.5, also matching the reported macroseismic intensities (Figure 10a). For Lefkada island, as well as for western Greece, the intensities are lower (6.5–4.5), reflecting the even greater distances from the fault projection (35–80 km). In summary, the selection of this fault scenario for 7.09 does not satisfactorily reproduce the reported macroseismic values, underestimating them near the fault projection for the mainland of Cephalonia and Ithaca islands by approximately 1–2 intensity degrees. In some cases, the differences reach up to 3 degrees, while in northern and southern Zakynthos, the estimated macroseismic intensities are in good agreement with the reported values.
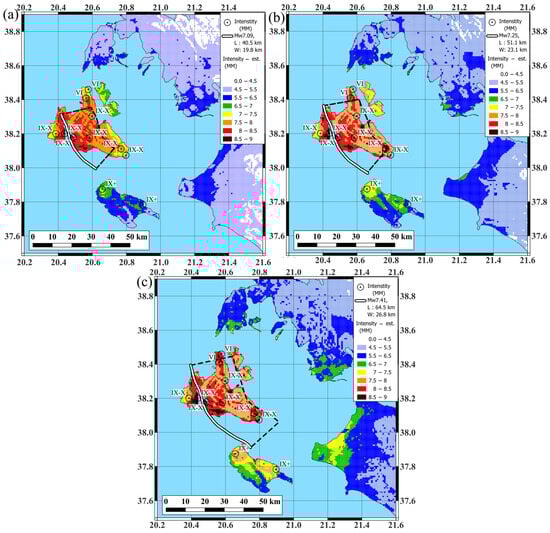
Figure 10.
(a–c) The three maps of the intensity (Modified Mercalli) distribution as computed by the use of the Rapid Earthquake Damage Assessment System (REDAS), based on the three faults of Group I, which correspond to the Mw7.09, 7.25 and 7.41 events, as depicted in Figure 8a–c, respectively. The “+” symbol is considered to indicate 0.5-degree macroseismic intensity higher than the corresponding Latin number. In light blue the sea is depicted, respectively.
Regarding fault case (b) of Group I faults, corresponding to the examined average moment magnitude (7.25) (Figure 10b), it appears that, as in case (a) (Figure 10b), almost the entirety of Cephalonia island is dominated by seismic intensities between 7.5 and 8.5. These values are approximately 1.5 intensity degrees lower than the reported ones [1,3], and this underestimation now also characterizes the northern part and the southeastern parts of the island. In addition, in a small area in the western part of the island, on the Paliki peninsula, seismic intensities are slightly lower, ranging between 6.5 and 7.5, which is about 2.5 degrees lower than the reported values (Figure 10b). On Ithaca island, the corresponding seismic intensities range between 7 and 8, and are underestimated by about 1–2 degrees relative to the reported values of 9 (Figure 10b). Regarding Zakynthos island, the estimated intensities generally agree with the reported ones in the northern part, in the Volimes village area, although at some sites they may be overestimated by 0.5 degrees. A similar agreement is observed for the southern part of the island in the city of Zakynthos (Figure 10a).
For the remaining areas of Zakynthos island, seismic intensities decrease from 7 to 5.5 toward the southern part of the island, where the distance from the fault projection increases (>15 km). These values are slightly higher than those obtained for case (a) (Figure 10a). For Lefkada island, as well as for western Greece, the estimated seismic intensities range between 4.5 and 6.5, reflecting the greater distances from the fault projection (35–80 km). In this scenario, even at larger distance (80–110 km), the calculated seismic intensities remain relatively high, ranging between 4 and 5.5.
Overall, the fault scenario corresponding to case (b) of Group I for 7.25 provides a better fit to the reported macroseismic observations than the case (a) with 7.09. Nevertheless, seismic intensities near the fault projection for the mainland areas of Cephalonia and Ithaca islands remain underestimated by approximately 1–2 intensity degrees, with local discrepancies reaching up to 2.5 degrees. In contrast, in the northern part of Cephalonia, an overestimation of about 1.5–2 degrees is observed, indicating that the fault trace should not be extended towards north. For both the northern and southern parts of Zakynthos island, the estimated macroseismic intensities are generally consistent with the reported values.
Finally, the examination of fault case (c) of Group I for the examined average moment magnitude plus one standard deviation (7.41) (Figure 10c) indicates that almost the entirety of Cephalonia and Ithaca islands presents seismic intensities between 7.5 and 8.5. In some locations the intensities reach up to 9 when Vs30 is lower than 400 m/s. For the mainland areas of Cephalonia and Ithaca, these estimated intensities are approximately 0.5–2.5 intensity degrees lower than the reported ones (9–10), similarly to the fault case (b) fault (Figure 10a,b), and approximately 2.5 degrees higher than the corresponding values for the northern part of Cephalonia (Figure 10c).
In a limited area in the west part of Cephalonia, within the Paliki peninsula, seismic intensities range between 6.5 and 7.5 (Figure 10c), comparable to those obtained for fault cases (a) and (b), with 7.09 and 7.25, respectively. Based on the examined fault corresponding to 7.41, the estimated seismic intensities in the northern part of Zakynthos are higher than the those of case (b), deviating from the reported values by approximately 0.5–1 degree. A similar overestimation is also observed for the city of Zakynthos in the southern part of the island.
In summary, the fault scenario corresponding to case (c) of Group I (7.41) does not fully reproduce the reported macroseismic observations. It underestimates seismic intensities near the fault projection for the mainland areas of Cephalonia and Ithaca islands by approximately 0.5–2.0 degrees and overestimates them for the northern part of Cephalonia. The latter observation indicates that the fault trace should not be extended towards the north, consistent with the conclusions drawn for fault case (b) of Group I. For both the northern and southern parts of Zakynthos island, the estimated macroseismic intensities appear to be slightly overestimated with respect to the reported values.
Taking into account the results obtained from the examination of all three Group I fault scenarios (Figure 10a–c), the following can be observed: (i) the seismic intensities computed for the main Cephalonia island generally approach the reported macroseismic intensities [1,3,4], particularly as increases from 7.09 to 7.41; however, they remain underestimated by approximately 0.5–2 intensity degrees. (ii) For the northern part of Cephalonia island, as well as for Ithaca island, the reported macroseismic intensities [1,3,4] are best reproduced by the estimated values only for the 7.09 scenario. (iii) The reported seismic intensities for the northern part of Zakynthos island, in Volimes village (7.5) and for Zakynthos city (6.5), are satisfactorily matched when is equal to 7.09 and 7.25, being slightly overestimated for the 7.41 scenario by 0.5 degrees. Figure 10, Figure 11 and Figure 12 present the results of the deterministic seismic hazard assessment (DSHA) of the three examined faults of Group I (Figure 9a) for the magnitude scenarios of 7.09, 7.25 and 7.41, respectively, considering rock-site conditions for Vs30 = 790 m/s. For case (a), which represents the lower bound of the examined moment magnitudes (7.09) and corresponds to the smaller fault plane (length: 40.5 km, width: 19.8 km), the peak ground acceleration (PGA) is higher than 0.36 g and reaches up to 0.42 g for approximately 70% of Cephalonia island (Figure 11a), including the two main urban centers of Argostoli and Lixouri (Figure 3). The corresponding peak ground velocity (PGV) ranges between 30 and 34 m/s (Figure 11b).
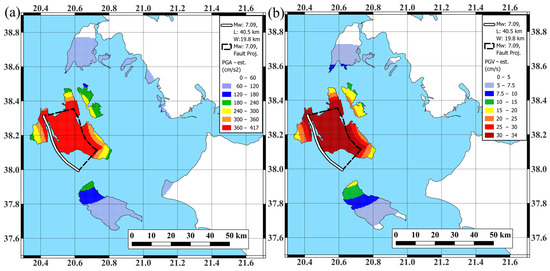
Figure 11.
(a,b) Peak ground acceleration and velocity (PGA and PGV) distribution maps based on Group I, seismic fault for the lower statistical limit of moment magnitude (average − standard deviation, Mw7.09) corresponding to the 12 August 1953, Cephalonia earthquake of surface magnitude Ms7.2. The PGA and PGV have been computed based on REDAS for site conditions based on Vs30: 790 m/s. Length and width of the fault plane are given in the legend of the figure. In light blue the sea is depicted, respectively.
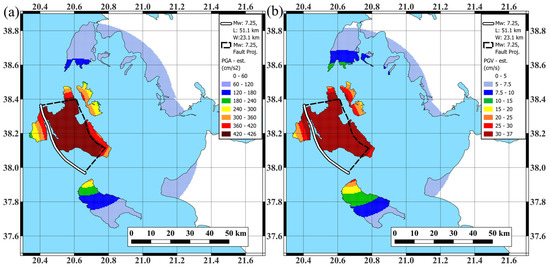
Figure 12.
(a,b) Peak ground acceleration and velocity (PGA and PGV) distribution maps based on Group I, seismic fault for the statistical average moment magnitude (Mw7.25) corresponding to the 12 August 1953 Cephalonia earthquake of surface magnitude Ms7.2. The PGA and PGV have been computed based on REDAS for site conditions based on Vs30: 790 m/s. Length and width of the fault plane are given in the legend of the figure. In light blue the sea is depicted, respectively.
Across the remaining areas of Cephalonia island, the PGA values range between 0.2 and 0.36 g, while PGV values vary between 16 and 30 m/s. On the adjacent island of Ithaca, the corresponding PGA and PGV values range between 0.15 and 0.29 g and between 12 and 22 m/s, respectively. The PGA values in the northern part of Zakynthos island reach up to 0.21 g and decrease southward to approximately 0.07 g, with the corresponding PGV values decreasing from about 16 m/s to 4 m/s. On Lefkada island, PGA values decrease from the south to the north from 0.12 g to 0.04 g, while the corresponding PGV values decrease from 8 m/s to 2 m/s.
For fault case (b) of Group I, corresponding to the average moment magnitude (7.25) and the mean fault plane geometry (length: 51.1 km, width: 23.1 km), PGA values exceed 0.42 g, and locally reach up to 0.426 g, over approximately 70% of Cephalonia (Figure 12a), including the town of Argostoli (Figure 3). In the area of Lixouri town, PGA values reach approximately 0.4 g. The corresponding PGV ranges between 30 and 37 m/s (Figure 12b). In the remaining areas of Cephalonia island, PGA ranges between 0.21 and 0.36 g, while PGV ranges between 18 and 30 m/s. On the adjacent island of Ithaca, the corresponding PGA and PGV values range between 0.23 and 0.40 g and between 19 and 31 m/s, respectively. In the northern part of Zakynthos, PGA values reach up to 0.3 g and decrease southwards to approximately 0.08 g, with the corresponding PGV values decreasing from about 25 m/s to 6.5 m/s. On Lefkada island the PGA and PGV values decrease from the south to the north, from 0.14 g to 0.06 g, and from 11 m/s to 4 m/s, respectively.
For case (c) of Group I faults, corresponding to the upper bound of the examined moment magnitude (7.41) and the larger fault plane (length: 64.5 km, width: 26.8 km), PGA is higher than 0.42 g, reaching up to 0.434 g, over approximately 85% of Cephalonia island (Figure 13a), including Argostoli town (Figure 3). In the area of Lixouri town, PGA values reach approximately 0.41 g. The corresponding PGV values range between 30 and 39 m/s (Figure 13b). In the remaining areas of Cephalonia island, PGA values range between 0.23 and 0.36 g, while PGV values vary between 20 and 30 m/s. On the adjacent island of Ithaca, PGA and PGV values range between 0.35 and 0.434 g and between 26 and 39 m/s, respectively. The PGA values in the northern part of Zakynthos reach up to 0.4 g and decrease southward to approximately 0.11 g, with corresponding PGV values decreasing from approximately 35 m/s to 8.5 m/s. On Lefkada island, the PGA values decrease from approximately 0.2 g in the south to 0.08 g in the north, while the corresponding PGV decreases from about 16 m/s to 6 m/s.
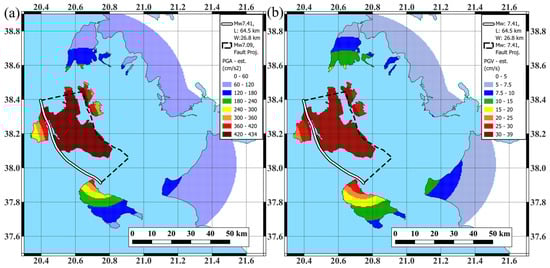
Figure 13.
(a,b) Peak ground acceleration and velocity (PGA and PGV) distribution maps based on Group I seismic fault for the upper statistical limit of moment magnitude (average + standard deviation, Mw7.41) corresponding to the 12 August 1953 Cephalonia earthquake of surface magnitude Ms7.2. The PGA and PGV have been computed based on REDAS for site conditions based on Vs30: 790 m/s. Length and width of the fault plane are given in the legend of the figure. In light blue the sea is depicted, respectively.
4.2. DSHA for Group II—Causative Faults Scenarios of the 1953 Earthquake (Ms7.2)
In Figure 14a,b, the computed seismic intensities (Modified Mercalli) are presented for the area of interest based on Group II faults for 7.25 and 7.41, respectively. The DSHA of the first fault case of Group II, which corresponds to the average minus one standard deviation moment magnitude (7.09), is identical to the corresponding fault of Group I, which is presented in Figure 10a. For this reason, the observation of the intensity distribution is not presented in this chapter.
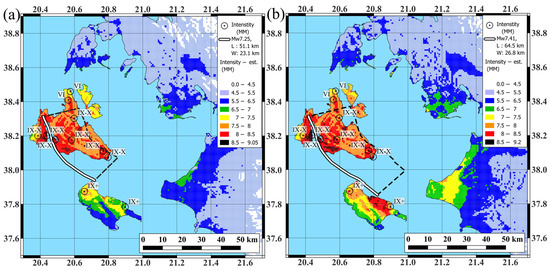
Figure 14.
(a,b) The two maps of the intensity (Modified Mercalli) distribution as computed by the use of the Rapid Earthquake Damage Assessment System (REDAS) based on the two faults of Group II, which correspond to the Mw7.25 and 7.41 events, as depicted in Figure 8b, respectively. For the case of Mw7.09 of Group II, the corresponding map is the same as the one for Group I, as the fault is common. In light blue the sea is depicted, respectively.
Regarding the case of Group II faults, for the examined average moment magnitude (7.25) (Figure 14a), almost the entirety of Cephalonia island is characterized by seismic intensities ranging between 7.5 and 9.0. Only in a small area in the western part of the island, within the Paliki peninsula, the seismic intensities are presented slightly lower, ranging between 7.0 and 7.5 (Figure 14a). These values are similar to the those obtained for the corresponding case of Group I faults (Figure 10b) and are in relatively good agreement with the corresponding reported values (9–10) by [1,3,4], underestimated by 0.5 to 2 degrees. In the northern part of Cephalonia, the estimated seismic intensities range between 7 and 7.5, slightly overestimated compared to the reported ones (6), while for Ithaca island the values are underestimated by approximately 1.5 degrees with respect to those reported on (9). In the northern part of Zakynthos, seismic intensities range between 7 and 8, in agreement with the reported ones (7.5), and for the southern part of the island, in the city of Zakynthos, the values range between 6.5 and 7, also in agreement with the reported ones (6.5). Across the remaining areas of Zakynthos island, seismic intensities decrease from 7.5 to 5.5 toward the south, reflecting the increasing distance from the fault projection (>15 km). In locations with locally low Vs30 values, seismic intensities may reach up to 8.5.
For Lefkada island, as well as for western Greece, the seismic intensities range between 4.5 and 6.5, related to the longer distances from the fault projection (35–80 km). In this case, even at greater distances (80–110 km), the seismic intensities are relatively high (4.5–5.5). Similarly to case (a) for the fault with 7.09 (Figure 10a), the seismic intensities computed based on the case for 7.25 (Figure 14a) over the mainland of Cephalonia (7.5–9) are almost one intensity degree lower than the reported ones (9–10). For the northern part of Lefkada the computed values (7.5–8.5) are higher than the reported ones (6). Regarding Zakynthos island, the seismic intensities at the northern part (7–8) are nearly two intensity degrees lower than the reported ones (9.5), while in the vicinity of Zakynthos town, the computed values (5.5–6.5) are approximately 3–4 degrees lower than the reported ones (9.5). Briefly, the selection of this Group II fault scenario for 7.25 appears to satisfactorily reproduce the reported macroseismic values, similarly to the corresponding case of Group I faults for 7.25. In this case, better agreement with the reported macroseismic intensity values for the northern part of Cephalonia is also provided, while the estimated intensity values close to the fault projection for the mainland of Cephalonia and Ithaca islands are underestimated by 1 to 2 intensity degrees. In those cases where the Vs30 is relatively low (<400 km), the estimated intensities are similar to the reported ones. For northern and southern Zakynthos, the estimated macroseismic values generally agree with the reported values.
Finally, examining the Group II fault case, for the examined average moment magnitude plus one standard deviation (7.41) (Figure 14b), it seems that almost the entirety of Cephalonia island is characterized by seismic intensities between 7.5 and 9.5, similar to the corresponding cases with 7.25 and 7.41 of Group I faults. For Ithaca island, the seismic intensities range between 7 and 8, while in some cells, where the Vs30 is relatively low, the intensities reach up to 8.5. For the mainland of Cephalonia and Ithaca islands, these values are approximately 0.5 to 1.5 intensity degrees lower than the reported ones (9–10), while in the northern part of Cephalonia island they are about 1.5 intensity degrees higher than the reported values (6) (Figure 14b).
In the western part of Cephalonia, within the Paliki peninsula, the seismic intensities range between 7 and 8 (Figure 14b), slightly higher than the those estimated for the fault scenarios for 7.09 and 7.25, respectively. Based on the examined fault with 7.41, the seismic intensities in the northern part of Zakynthos are slightly higher than those of the Group II fault case with 7.25, reaching 7.5–8.5 in some areas, which is approximately one intensity degree higher than the reported values for this region (7.5). For the remainder of Zakynthos island, the seismic intensities are higher than those estimated for the Group I fault scenarios with 7.09 and 7.25. It is worth noting that for the Zakynthos valley, where the Vs30 are quite low, the seismic intensities reach up to 9. For the city of Zakynthos, the values range between 7.5 and 8, which is approximately 1.5 intensity degrees higher than the reported values (6.5). Taking into account the reported seismic intensities [1,3] for selected locations in Cephalonia, Zakynthos and Ithaca islands (Figure 14a,b) as well as their classification as estimated by [6] (Figure 3) for both examined Group II fault cases, the following observations can be made: (i) The seismic intensities computed for the mainland of Cephalonia island are generally 0.5–2 intensity degrees lower (8–9) than the corresponding reported ones (9–10). However, in areas where Vs30 is relatively low (<400 m/s), the estimated intensities can reach up to 9, comparable to the reported ones. (ii) The seismic intensities computed for the north part of Cephalonia island remain relatively stable, between 7 and 7.5, and are slightly higher than the reported values (6). This is related to the fact that the distance from the fault projection remains relatively constant, as the upper corners of the fault traces of the two examined fault scenarios of Group II are common. (iii) The seismic intensities computed for Ithaca island approach the reported values (9–10) [3] as the magnitude increases. For the fault scenario with 7.41, the estimated intensities generally reach up to 8.5, which is still approximately one degree lower than the reported values, similarly to the case of the mainland of Cephalonia. (iv) The reported seismic intensities for the northern part of Zakynthos (7.5) are in relatively good agreement with the estimated values for the fault case with 7.25; however, they tend to be overestimated when the moment magnitude, , of the examined fault is increased to 7.41. (v) The reported seismic intensities for the city of Zakynthos (6.5) are in agreement with the estimated values for the Group II fault scenario with 7.25, while they are overestimated for the fault case for 7.41, as the fault trace tends to approach the city.
In Figure 14 and Figure 15, the DSHA results for the two examined Group II faults (Figure 8b) with 7.25 and 7.41, respectively, are presented, considering rock-site conditions with Vs30 = 790 m/s. It should be noted that the fault case with 7.09 is not presented in this section as the examined fault is common to both Group I and Group II, and its DSHA results are presented in Figure 11. For the Group II fault scenario with the average moment (7.25) corresponding to the mean fault plane (length: 51.1 km, width: 23.1 km), PGA values exceed 0.42 g, reaching up to 0.426 g, over nearly 65% of Cephalonia island (Figure 15a), including Argostoli (Figure 3), while in the area of Lixouri the PGA reaches up to approximately 0.40 g. The corresponding PGV values range between 30 and 39 m/s (Figure 15b). Over the remaining part of Cephalonia, PGA values range between 0.18 and 0.40 g, while PGV values range between 15 and 30 m/s. On the adjacent island of Ithaca, the corresponding PGA and PGV values range between 0.18 and 0.36 g and between 15 and 28 m/s, respectively. The PGA values in the northern part of Zakynthos reach up to 0.40 g and decrease to approximately 0.11 g toward the southern part of the island, while the corresponding PGV values decrease from about 35 m/s to 7 m/s. In Lefkada island, PGA values are reduced from the south to the north, ranging from approximately 0.15 g to 0.05 g, while the corresponding PGV values decrease from about 10 m/s to 4 m/s.
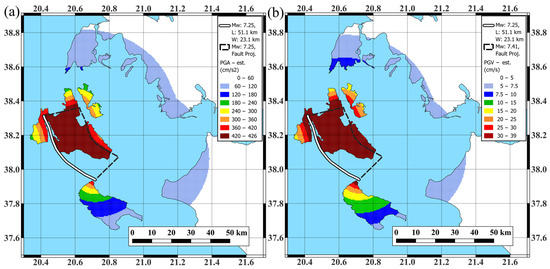
Figure 15.
(a,b) PGA and PGV distribution based on Group II seismic fault for the average statistical limit of moment magnitude (Mw7.25) corresponding to the 12 August 1953 Cephalonia earthquake of surface magnitude Ms7.2. The PGA and PGV have been computed based on REDAS for site conditions based on Vs30: 790 m/s. In light blue the sea is depicted, respectively.
For the Group II fault scenario corresponding to the upper limit of the moment magnitude (7.41), which is associated with the larger fault plane (length: 64.5 km, width: 26.8 km), PGA values exceed 0.42 g, reaching up to 0.434 g, over nearly 65% of Cephalonia island (Figure 16a), including Argostoli (Figure 3). In Lixouri town the PGA reaches approximately 0.40 g. The corresponding PGV ranges between 30 and 39 m/s (Figure 16b). Over the remaining part of Cephalonia, PGA values range between 0.22 and 0.36 g, while PGV values range between 19 and 30 m/s. On Ithaca island, the corresponding PGA and PGV values range between 0.22 and 0.40 g and between 19 and 39 m/s, respectively. The PGA values in the northern part of Zakynthos reach up to 0.4 g and decrease to approximately 0.16 g toward the southern part of the island. The corresponding PGV values decrease from about 39 m/s to 13 m/s. In Lefkada island, PGA values decrease from the south to the north, ranging from approximately 0.16 g to 0.06 g, while the corresponding PGV values decrease from about 14 m/s to 5 m/s. The average (±one standard deviation) estimated PGA values of 10 selected sites in Cephalonia, Ithaca and Zakynthos islands, which correspond to rock site conditions for Vs30 = 790, are presented in Figure 17a (Table 3). These values have been computed by the application of REDAS for the three faults of Group I (Figure 10a, Figure 11a and Figure 12a) and the three faults of Group II (Figure 10a, Figure 14a and Figure 15a; the first fault is common in Group I and II), corresponding to moment magnitudes 7.09, 7.25 and 7.41, respectively. The corresponding average PGV values are presented in Figure 17b.
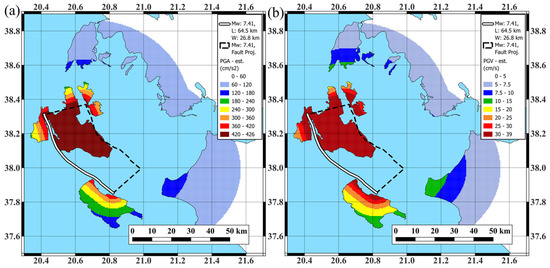
Figure 16.
(a,b) PGA and PGV distribution maps based on Group II seismic fault for the upper statistical limit of moment magnitude (Mw7.41) corresponding to the 12 August 1953 Cephalonia earthquake of surface magnitude Ms7.2. The PGA and PGV have been computed based on REDAS for site conditions based on Vs30: 790 m/s. In light blue the sea is depicted, respectively.
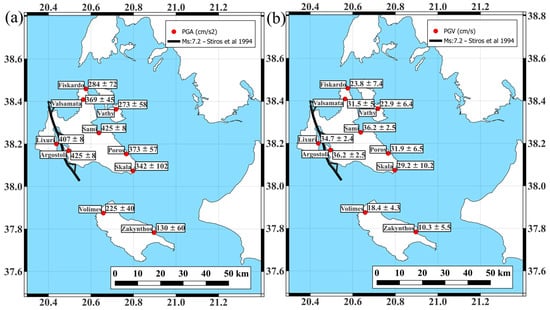
Figure 17.
The average ± one standard deviation of the PGA (a) and PGV (b) values corresponding to rock site conditions (Vs30 = 790) of 10 selected sites in Cephalonia, Ithaca and Zakynthos islands, considering the three faults of Group I (Figure 10, Figure 11 and Figure 12, Table 3) and the three faults of Group II (Figure 10, Figure 14 and Figure 15, Table 3) for the moment magnitudes 7.09, 7.25 and 7.41, respectively (in light blue and in white, the sea and land are depicted) [6].
Table 3.
The PGA and PGV values determined by the application of REDAS in this study considering the three faults of Group I (Figure 10, Figure 11 and Figure 12) and the three faults of Group II (Figure 10, Figure 14 and Figure 15) for the moment magnitudes 7.09, 7.25 and 7.41, respectively. The average values of all PGA and PGV for each selected site location are provided.
5. Discussion
In this study, a methodology is proposed (see flowchart in Figure 4) to estimate ground motion intensity measurements (i.e., macroseismic intensity: MMI, PGA and PGV) of the 12 August 1953 earthquake (Ms7.2) in Cephalonia, Ithaca and Zakynthos islands, Greece. Due to the lack of instrumental data during that period, the geometry of the causative fault is not known. In this study, the model of [6] was used as the core of the proposed fault scenarios. Based on several constraints (e.g., surface-to-moment magnitude conversion and related uncertainties, magnitude-dependent length/width, fault mechanism, epicenter location, and reported damage distribution), two groups (Groups I and II), each consisting of three fault scenarios, are proposed. Each of the two groups corresponds to one of two alternative seismotectonic approaches suggested (Figure 8). The three faults per group correspond to different fault lengths and widths (Table 2), based on three different moment magnitudes, 7.09, 7.25 and 7.41. These magnitudes correspond to the average value of the Ms7.2 magnitude and to its standard deviation range after its conversion to . The scenario corresponding to 7.09 is common to both groups, such that the final examined scenarios are five in number. Although this approach may appear simplistic, in terms of ground motion intensity it can satisfactorily represent reported damage distribution. As for the ground motion model (GMM), the most recently defined one for the area of Greece [40] was selected, and its performance was tested for the specific study area using recordings from the 26 January 2014 (M6.1) earthquake (Figure 7). Based on the geometry of the five fault scenarios and the adopted regional GMM, the REDAS software was implemented for ground motion estimation in terms of PGA, PGV and macroseismic intensity (Modified Mercalli, MMI).
From almost all scenarios applied in this study, an overestimation of reported macroseismic intensity was observed, and in certain cases it exceeded one intensity unit. In fact, macroseismic intensity estimates (MMI) based on historical sources (documents, testimonies, archives) with varying degrees of detail and quality may affect the estimation of the actual intensity. This subjectivity in descriptions can often lead to overestimation of intensities, especially when only the most destructive reports are selected. Macroseismic intensity determination for the Cephalonia 1953 seismic sequence is based mainly on testimonies of disaster and damage rather than on systematically measured data, given that in that period there were not enough modern seismometers or/and accelerometers as well as standardized macroseismic records throughout the region.
Although there is no strong evidence that the MMI values for the 1953 earthquake in Cephalonia, Ithaca and Zakynthos islands are falsely high according to historical estimation, due to the methodology and source of data, the X + MMI values represent more the result of the major disaster than a fully measured physical intensity. In summary, it can be assumed that there is a tendency to overestimate macroseismic intensities because of the following:
- Sources only report mainly strong intensities.
- Absence of detailed data can lead to generalization of the strongest descriptions.
Testimonies are selectively focused on the most intense effects, and higher MMI values are reported to accommodate those testimonies. For a more recent earthquake in 1978 (M6.5) that hit the city of Thessaloniki, an interesting comparison with respect to observed macroseismic intensities on the city’s built environment was presented by [44]. Specifically, for a sample of structures built before the first Greek seismic code of 1959, macroseismic intensity was assessed both by a questionnaire distributed to citizens (questionnaire damage: QD), i.e., non-experts, and by expert structural engineers after an in situ survey and investigation (engineering damage: ED). The extracted macroseismic intensities from both approaches were converted to the ESM98 scale and compared. Interestingly, the comparison showed that the non-expert had overestimated macroseismic intensity by up to 1.5 degrees in the ESM98 scale, especially at high values (>3), indicating that systematic engineering survey, which can be used as a reliable reference assessment, provides lower macroseismic intensities values.
Macroseismic intensities appear to be saturated for the examined faults of 7.25 and 7.41 over most of Cephalonia island, close to the projection of the fault, except for its northern and western parts. The intensities range between 7.5 and 8.5 and can reach up to 9, where Vs30 values are relatively low (e.g., <400 m/s) due to site amplification. Such values are in satisfactory agreement with the reported ones [1].
For the case of 7.09, macroseismic intensities for Cephalonia island are like those for 7.25 and 7.41; however, in the southeastern part they decrease down to 7–8. In some cases, these values drop to 6.5–7.0, related to higher Vs30 values (650–790 m/s), and are significantly underestimated compared to the reported ones [1].
Reported macroseismic intensities equal to 6.0 near Fiskardo in northern Cephalonia are only satisfied by two fault scenarios. The first is the 7.09 scenario (Figure 10), which is common for Groups I and II, with values ranging between 7.0 and 7.5. The second is the 7.25 scenario of Group II (Figure 14), which is extended only toward the south, to Zakynthos, and shows comparable values.
Regarding Zakynthos island, and more specifically its northern part, it appears that all the fault scenarios can more or less satisfy the reported macroseismic intensities of 7.5. For the southern part of the island, and more specifically for the city of Zakynthos, it seems that all fault scenarios except the Group II case for 7.41 can satisfy the reported macroseismic intensities of 6.5. For the lower-magnitudes cases (7.09, 7.25), the estimated values are equal or slightly underestimated, while for the higher magnitude case (7.41) of Group I, the values are equal or slightly overestimated.
Regarding Ithaca island, it seems that the high reported macroseismic intensity values of 9–10 [3,4] are mainly captured only by fault scenarios of 7.41, for which the projections of the fault lie on the island. However, even in this case, the estimated intensities range between 7.5 and 8.5, which is approximately 1 to 2 degrees lower than the reported values and reach up to 9 only when Vs30 values are relatively low (<400 m/s) and close to the fault projection. Considering the above, it is noteworthy that a parametric investigation involving a greater fault width, instead of the average width used in this study for the 7.09 and 7.25 cases, could lead to higher macroseismic intensity values on Ithaca island, as the fault projection would approach it, without affecting the estimated values in northern Cephalonia and Zakynthos. Similar increases in the intensity could also be achieved in the southeastern part of Cephalonia island for the 7.09 case by using a greater width for the examined fault.
In addition, to alleviate the deviation between estimated and reported macroseismic intensities, it should be noted that the reported overestimation of macroseismic intensities for the 12 August 1953 (M7.2) earthquake may also be due to the two preceding earthquakes in Cephalonia on 9 August (M6.8) and 11 August (M6.4) 1953, as damage caused by the mainshock cannot be clearly discriminated from the cumulative damage of all preceding ones.
6. Conclusions
The results of this study, although not exhaustive in terms of all possible fault scenarios, can be considered a first approach for the deterministic estimation of ground motion intensity distribution over the three studied islands (Cephalonia, Ithaca and Zakynthos). Under this assumption, and considering the discussion presented in previous section, the following conclusions can be drawn:
- The fault scenarios with 7.41 for both Group I and II, as well as the 7.25 scenario of Group I, cannot satisfactorily reproduce the reported macroseismic intensity values.
- The fault scenarios with 7.09 and 7.25 of Group II provide satisfactory agreement with the reported macroseismic intensities, indicating, however, that the higher reported intensities on Ithaca island can be better approached by assuming a larger fault width than the average one used here.
- For these two scenarios, the average PGA values on engineering rock conditions (Vs30 = 790 m/s) at selected sites on Cephalonia island range from 0.42 to 0.44 g in Argostoli and Sami, 0.40 to 0.42 g in Lixouri, 0.31 to 0.39 g in Poros, 0.23 to 0.44 g in Skala, 0.33 to 0.35 g in Valsamata and 0.23 to 0.26 g in Fiskardo. In Vathy town on Ithaca island, the corresponding average PGA values range between 0.21 and 0.27 g, although the use of a larger fault width (i.e., the average width plus one standard deviation, based on relations [42]) could increase the estimated values to levels comparable to those in eastern Cephalonia. In Volimes village in northern Zakynthos and in the city of Zakynthos, the corresponding PGA values range between 0.17 and 0.26 g and between 0.08 and 0.13 g, respectively.
It should be noted that the seismic fault plane scenarios adopted in this study represent only a subset of all possible cases. To capture a broader range of potential scenarios, additional approaches are required, including logic-tree strategy, error propagation analyses, and more refined seismotectonic modeling. Such future efforts may benefit from this preliminary study.
Author Contributions
Conceptualization, N.T.; methodology, N.T. and I.G.; implementation, I.G.; writing—original draft preparation, I.G. and N.T.; writing—review and editing, N.T. and I.G.; supervision, N.T.; project administration, N.T.; funding acquisition, N.T. All authors have read and agreed to the published version of the manuscript.
Funding
This work was partly funded by the ECHO.B-Disaster Preparedness and Prevention Program, Directorate-General for Europe on Civil Protection and Humanitarian Aid Operations (ECHO) under the B.2-Prevention and Disaster Risk Management, grant agreement no. 101101206.
Data Availability Statement
The raw data supporting the conclusions of this article will be made available by the authors on request.
Acknowledgments
The authors express their gratitude to the Regional Authority of Ionian Islands and especially to the Regional Unit of Cephalonia & Ithaca for their support and encouragement.
Conflicts of Interest
The authors declare no conflicts of interest. The funders had no role in the design of the study; in the collection, analyses, or interpretation of data; in the writing of the manuscript; and in the decision to publish the results.
Abbreviations
The following abbreviations are used in this manuscript:
| CTFZ | Cephalonia Transform Fault Zone |
| DSHA | Deterministic Seismic Hazard Assessment |
| GMM | Ground Motion Model |
| PGA | Peak Ground Acceleration |
| PGV | Peak Ground Velocity |
| REDAS | Rapid Earthquake Damage Assessment System |
| Vs30 | Shear wave velocity of the uppermost 30 m |
References
- Papazachos, B.; Papazachou, C. The Earthquakes of Greece; Ziti: Thessaloniki, Greece, 1997. [Google Scholar]
- Papazachos, B.C.; Papaioannou, C.A.; Papazachos, C.B.; Savvaidis, A.S. Rupture zones in the Aegean region. Tectonophysics 1999, 308, 205–221. [Google Scholar] [CrossRef]
- Papazachos, B.C.; Papaioannou, C.A.; Papazachos, C.B.; Savvaidis, A.S. Atlas of Isoseismal Maps for Strong Shallow Earthquakes in Greece and Surrounding Area (426BC-1995); P.ZITI & Co, Technical Books Editions: Thessaloniki, Greece, 1997. [Google Scholar]
- Grandazzi, M. Le tremblement de terre des Iles Ioniennes (aout 1953). Ann. Georgr. 1954, 63, 431–453. [Google Scholar] [CrossRef]
- Galanopoulos, A. The seismic geography of Greece. Ann. Geol. Pays Hell. 1955, 6, 83–121. [Google Scholar]
- Stiros, S.C.; Pirazzoli, P.A.; Laborel, J.; Laborel-Deguen, F. The 1953 earthquake in Cephalonia (Western Hellenic Arc): Coastal uplift and halotectonic faulting. Geophys. J. Int. 1994, 117, 834–849. [Google Scholar] [CrossRef]
- Mavroulis, S.; Lekkas, E. Revisiting the most destructive earthquake sequence in the recent history of greece: Environmental effects induced by the 9, 11 and 12 august 1953 ionian sea earthquakes. Appl. Sci. 2021, 11, 8429. [Google Scholar] [CrossRef]
- Moschopoulos, G.; Maravegia, K. Argostoli, Earthquakes 1953. The End and the Beginning of a City; Korgialeneio Idryma: Argostoli, Greece, 2007; p. 313. (In Greek) [Google Scholar]
- Papatheodorou, K.; Theodoulidis, N.; Klimis, N.; Zulfikar, C.; Vintila, D.; Cardanet, V.; Kirtas, E.; Toma-Danila, D.; Margaris, B.; Fahjan, Y.; et al. Rapid earthquake damage assessment and education to improve earthquake response efficiency and community resilience. Sustainability 2023, 15, 16603. [Google Scholar] [CrossRef]
- Theodoulidis, N.; Margaris, B.; Sotiriadis, D.; Zulfikar, C.; Okuyan Akcan, S.; Cioflan, C.O.; Manea, E.F.; Toma-Danila, D. Rapid Earthquake Damage Assessment System in the Black Sea Basin: Selection/Adoption of Ground Motion Prediction Equations with Emphasis in the Cross-Border Areas. GeoHazards 2024, 5, 255–270. [Google Scholar] [CrossRef]
- Theodoulidis, N.; Grendas, I. Strong motion estimation of large magnitude earthquakes in Greece: The case of the disastrous earthquake (M7.2) in Kefalonia. In Proceedings of the 6th PanHellenic Conference on Earthquake Engineering and Engineering Seismology, Athens, Greece, 30 October–1 November 2025. (In Greek) [Google Scholar]
- Wald, D.J.; Quitoriano, V.; Heaton, T.H.; Kanamori, H. Relationships between peak ground acceleration, peak ground velocity, and modified Mercalli intensity in California. Earthq. Spectra 1999, 15, 557–564. [Google Scholar] [CrossRef]
- Mueller-Miny, H. Beitrage zur morphologie der mittleren jonischen Inseln. Ann. Géol. Pays Hellén 1957, 8, 1–28. [Google Scholar]
- McKenzie, D. Active Tectonics of the Mediterranean Region. Geophys. J. R. Astron. Soc. 1972, 30, 109–185. [Google Scholar] [CrossRef]
- Karakostas, V.; Papadimitriou, E.; Mesimeri, M.; Gkarlaouni, C.; Paradisopoulou, P. The 2014 Kefalonia Doublet (Mw6.1 and Mw6.0), central Ionian Islands, Greece: Seismotectonic implications along the Kefalonia transform fault zone. Acta Geophys. 2015, 63, 1–16. [Google Scholar] [CrossRef]
- Papadopoulos, G.A.; Karastathis, V.K.; Koukouvelas, I.; Sachpazi, M.; Baskoutas, I.; Chouliaras, G.; Agalos, A.; Daskalaki, E.; Minadakis, G.; Moshou, A.; et al. The Cephalonia, Ionian Sea (Greece), sequence of strong earthquakes of January-February 2014: A first report. Res. Geophys. 2014, 3, 3–5. [Google Scholar] [CrossRef][Green Version]
- Saltogianni, V.; Moschas, F.; Stiros, S. The 2014 Cephalonia Earthquakes: Finite Fault Modeling, Fault Segmentation, Shear and Thrusting at the NW Aegean Arc (Greece). Pure Appl. Geophys. 2018, 175, 4145–4164. [Google Scholar] [CrossRef]
- Theodoulidis, N.; Karakostas, C.; Lekidis, V.; Makra, K.; Margaris, B.; Morfidis, K.; Papaioannou, C.; Rovithis, E.; Salonikios, T.; Savvaidis, A. The Cephalonia, Greece, January 26 (M6.1) and February 3, 2014 (M6.0) earthquakes: Near-fault ground motion and effects on soil and structures. Bull. Earthq. Eng. 2016, 14, 1–38. [Google Scholar] [CrossRef]
- Chousianitis, K.; Konca, A.O. Intraslab Deformation and Rupture of the Entire Subducting Crust During the 25 October 2018 Mw 6.8 Zakynthos Earthquake. Geophys. Res. Lett. 2019, 46, 14358–14367. [Google Scholar] [CrossRef]
- Ganas, A.; Briole, P.; Bozionelos, G.; Barberopoulou, A.; Elias, P.; Tsironi, V.; Valkaniotis, S.; Moshou, A.; Mintourakis, I. The 25 October 2018 Mw = 6.7 Zakynthos earthquake (Ionian Sea, Greece): A low-angle fault model based on GNSS data, relocated seismicity, small tsunami and implications for the seismic hazard in the west Hellenic Arc. J. Geodyn. 2020, 137, 101731. [Google Scholar] [CrossRef]
- Mouslopoulou, V.; Bocchini, G.M.; Cesca, S.; Saltogianni, V.; Bedford, J.; Petersen, G.; Gianniou, M.; Oncken, O. Earthquake Swarms, Slow Slip and Fault Interactions at the Western-End of the Hellenic Subduction System Precede the Mw 6.9 Zakynthos Earthquake, Greece. Geochem. Geophys. Geosyst. 2020, 21, e2020GC009243. [Google Scholar] [CrossRef]
- Sokos, E.; Gallovič, F.; Evangelidis, C.P.; Serpetsidaki, A.; Plicka, V.; Kostelecký, J.; Zahradník, J. The 2018 Mw 6.8 Zakynthos, Greece, Earthquake: Dominant Strike-Slip Faulting near Subducting Slab. Seismol. Res. Lett. 2020, 91, 721–732. [Google Scholar] [CrossRef]
- Papazachos, B.C.; Comninakis, P.E.; Karakaisis, G.F.; Karakostas, B.G.; Papaioannou, C.A.; Papazachos, C.B.; Scordilis, E.M. A Catalogue of Earthquakes in Greece and Surrounding Area for the Period 550BC-1999; Laboratory of Geopgysics, University of Thessaloniki: Thessaloniki, Greece, 2000. [Google Scholar]
- Burton, P.W.; Xu, Y.; Qin, C.; Tselentis, G.A.; Sokos, E. A catalogue of seismicity in Greece and the adjacent areas for the twentieth century. Tectonophysics 2004, 390, 117–127. [Google Scholar] [CrossRef]
- Makropoulos, K.; Kaviris, G.; Kouskouna, V. An updated and extended earthquake catalogue for Greece and adjacent areas since 1900. Nat. Hazards Earth Syst. Sci. 2012, 12, 1425–1430. [Google Scholar] [CrossRef]
- Papazachos, B.C.; Papadimitriou, E.E.; Kiratzi, A.A.; Papazachos, C.B.; Louvari, E.K. Fault plane solutions in the Aegean Sea and the surrounding area and their tectonic implication. Boll. Geofis. Teor. Appl. 1998, 39, 199–218. [Google Scholar]
- Sachpazi, M.; Hirn, A.; Clément, C.; Haslinger, F.; Laigle, M.; Kissling, E.; Charvis, P.; Hello, Y.; Lépine, J.C.; Sapin, M.; et al. Western Hellenic subduction and Cephalonia Transform: Local earthquakes and plate transport and strain. Tectonophysics 2000, 319, 301–319. [Google Scholar] [CrossRef]
- Scordilis, E.M.; Karakaisis, G.F.; Karacostas, B.G.; Panagiotopoulos, D.G.; Comninakis, P.E.; Papazachos, B.C. Evidence for transform faulting in the Ionian sea: The Cephalonia island earthquake sequence of 1983. Pure Appl. Geophys. 1985, 123, 388–397. [Google Scholar] [CrossRef]
- Louvari, E.; Kiratzi, A.A.; Papazachos, B.C. The Cephalonia Transform Fault and its extension to western Lefkada Island (Greece). Tectonophysics 1999, 308, 223–236. [Google Scholar] [CrossRef]
- Svigkas, N.; Atzori, S.; Kiratzi, A.; Tolomei, C.; Antonioli, A.; Papoutsis, I.; Salvi, S.; Kontoes, C. On the segmentation of the Cephalonia-Lefkada Transform Fault Zone (Greece) from an InSAR multi-mode dataset of the Lefkada 2015 sequence. Remote Sens. 2019, 11, 1848. [Google Scholar] [CrossRef]
- Sokos, E.; Kiratzi, A.; Gallovič, F.; Zahradník, J.; Serpetsidaki, A.; Plicka, V.; Janský, J.; Kostelecký, J.; Tselentis, G.A. Rupture process of the 2014 Cephalonia, Greece, earthquake doublet (Mw6) as inferred from regional and local seismic data. Tectonophysics 2015, 656, 131–141. [Google Scholar] [CrossRef]
- Cirella, A.; Romano, F.; Avallone, A.; Piatanesi, A.; Briole, P.; Ganas, A.; Theodoulidis, N.; Chousianitis, K.; Volpe, M.; Bozionellos, G.; et al. The 2018 Mw 6.8 Zakynthos (Ionian Sea, Greece) earthquake: Seismic source and local tsunami characterization. Geophys. J. Int. 2020, 221, 1043–1054. [Google Scholar] [CrossRef]
- Briole, P.; Elias, P.; Parcharidis, I.; Bignami, C.; Benekos, G.; Samsonov, S.; Kyriakopoulos, C.; Stramondo, S.; Chamot-Rooke, N.; Drakatou, M.L.; et al. The seismic sequence of January-February 2014 at Cephalonia Island (Greece): Constraints from SAR interferometry and GPS. Geophys. J. Int. 2015, 203, 1528–1540. [Google Scholar] [CrossRef][Green Version]
- Basili, R.; Danciu, L.; Beauval, C.; Sesetyan, K.; Vilanova, S.P.; Adamia, S.; Arroucau, P.; Atanackov, J.; Baize, S.; Canora, C.; et al. European Fault-Source Model 2020 (EFSM20): Online Data on Fault Geometry and Activity Parameters; Istituto Nazionale di Geofisica e Vulcanologia: Rome, Italy, 2022. [Google Scholar]
- Hatzfeld, D.; Kassaras, I.; Panagiotopoulos, D.; Amorese, D.; Makropoulos, K.; Karakaisis, G.; Coutant, O. Microseimicity and strain pattern in northwestern Greece. Tectonics 1995, 14, 773–785. [Google Scholar] [CrossRef]
- Tselentis, G.A.; Sokos, E.; Martakis, N.; Serpetsidaki, A. Seismicity and seismotectonics in Epirus, western Greece: Results from a microearthquake survey. Bull. Seismol. Soc. Am. 2006, 96, 1706–1717. [Google Scholar] [CrossRef]
- Kiratzi, A.; Langston, C. Moment tensor inversion of the 1983 January 17 Kefallinia event of Ionian islands (Greece). Geophys. J. Int. 1991, 105, 529–535. [Google Scholar] [CrossRef]
- Stewart, J.P.; Klimis, N.; Savvaidis, A.; Theodoulidis, N.; Zargli, E.; Athanasopoulos, G.; Pelekis, P.; Mylonakis, G.; Margaris, B. Compilation of a local Vs profile database and its application for inference of Vs30 from geologic- and terrain-based proxies. Bull. Seismol. Soc. Am. 2014, 104, 2827–2841. [Google Scholar] [CrossRef]
- Margaris, B.; Scordilis, E.M.; Stewart, J.P.; Boore, D.M.; Theodoulidis, N.; Kalogeras, I.; Melis, N.S.; Skarlatoudis, A.A.; Klimis, N.; Seyhan, E. Hellenic Strong-Motion Database with Uniformly Assigned Source and Site Metadata for the Period 1972–2015. Seismol. Res. Lett. 2021, 92, 2065–2080. [Google Scholar] [CrossRef]
- Boore, D.M.; Stewart, J.P.; Skarlatoudis, A.A.; Seyhan, E.; Margaris, B.; Theodoulidis, N.; Scordilis, E.; Kalogeras, I.; Klimis, N.; Melis, N.S. A ground-motion prediction model for shallow crustal earthquakes in greece. Bull. Seismol. Soc. Am. 2021, 111, 857–874. [Google Scholar] [CrossRef]
- Das, R.; Wason, H.R.; Sharma, M.L. Global regression relations for conversion of surface wave and body wave magnitudes to moment magnitude. Nat. Hazards 2011, 59, 801–810. [Google Scholar] [CrossRef]
- Wells, D.L.; Coppersmith, K.J. New empirical relationships among magnitude, rupture length, rupture width, rupture area, and surface displacement. Bull. Seismol. Soc. Am. 1994, 84, 974–1002. [Google Scholar] [CrossRef]
- Di Filippo, D.; Marcelli, L. Uno Studio Sul Terremoto di Cefalonia (del 1953 Augosto 12) con Particolare. Ann. Geophys. 1954, 7, 547–561. [Google Scholar]
- Panou, A.A.; Hatzidimitriou, P.M.; Theodoulidis, N.; Stylianidis, K.C.; Triantafyllidis, P.; Zacharopoulos, S. Comparison of damage data from questionnaires and field survey: The case of the June 20, 1978 Thessaloniki (northern Greece) M6.5 earthquake. Bull. Earthq. Eng. 2014, 12, 2821–2841. [Google Scholar] [CrossRef]


Disclaimer/Publisher’s Note: The statements, opinions and data contained in all publications are solely those of the individual author(s) and contributor(s) and not of MDPI and/or the editor(s). MDPI and/or the editor(s) disclaim responsibility for any injury to people or property resulting from any ideas, methods, instructions or products referred to in the content. |
© 2026 by the authors. Licensee MDPI, Basel, Switzerland. This article is an open access article distributed under the terms and conditions of the Creative Commons Attribution (CC BY) license.