Abstract
Monitoring the stability of hydraulic structures such as dams and reservoirs in seismically active regions is essential for ensuring their safety and operational reliability. This study presents a comprehensive geospatial approach combining lineament analysis and geodynamic zoning to assess the structural stability of the Voroshilov and Priyut reservoirs located in the Almaty region, Kazakhstan. A regional lineament map was generated using ASTER GDEM data, while ALOS PALSAR data were used for detailed local analysis. Lineaments were extracted and analyzed through automated processing in PCI Geomatica. Lineament density maps and azimuthal rose diagrams were constructed to identify zones of tectonic weakness and assess regional structural patterns. Integration of lineament density, GPS velocity fields, InSAR deformation data, and probabilistic seismic hazard maps enabled the development of a detailed geodynamic zoning model. Results show that the studied sites are located within zones of low local geodynamic activity, with lineament densities of 0.8–1.2 km/km2, significantly lower than regional averages of 3–4 km/km2. GPS velocities in the area do not exceed 4 mm/year, and InSAR analysis indicates minimal surface deformation (<5 mm/year). Despite this apparent local stability, the 2024 Voroshilov Dam failure highlights the cumulative effect of regional seismic stresses (PGA up to 0.9 g) and localized filtration along fracture zones as critical risk factors. The proposed geodynamic zoning correctly identified the site as structurally stable under normal conditions but indicates that even low-activity zones are vulnerable under cumulative seismic loading. This demonstrates that an integrated approach combining remote sensing, geodetic, and seismic data can provide quantitative assessments for dam safety, predict potential high-risk zones, and support preventive monitoring in tectonically active regions.
1. Introduction
Monitoring the stability of hydraulic structures such as dams and reservoirs in seismically active regions is one of the key tasks of engineering geology and natural-technological safety. Among the effective remote sensing methods applied for the assessment of geological risks and the identification of potentially hazardous zones, lineament analysis plays a particularly important role.
The lineament method is a geological and geomorphological approach based on the interpretation of aerial and satellite imagery as well as digital elevation models. It allows for the detection of linear or arcuate morphostructures on the Earth’s surface that reflect deep-seated tectonic features such as faults, fracture zones, tectonic sutures, and block boundaries [1]. Surface landforms, vegetation cover, hydrographic networks, and even anthropogenic structures are often controlled by the underlying structure of bedrock. On images, these systematic linear features appear as straight or slightly curved lines extending for tens to hundreds of kilometers.
Systematic lineament analysis makes it possible to identify geologically weakened zones that may significantly influence groundwater filtration processes, slope stability, and the development of deformations [2,3,4,5,6,7]. Essentially, the lineament method represents a form of structural–geological interpretation of the Earth’s surface based on its morphological and landscape characteristics, thereby enabling the identification of hidden tectonics and the prediction of geological processes. This is especially important under conditions of high seismicity, where lineament analysis helps to identify active structures that may be reactivated during earthquakes and pose risks to engineering facilities.
When analyzing the territories of hydraulic structures, spatial correlations between lineaments and dam locations allow for the delineation of high-risk zones and the improvement of engineering monitoring. Lineaments, as indicators of tectonic disturbances and zones of enhanced fracturing, are commonly associated with areas of increased rock permeability that can serve as natural pathways for groundwater filtration. Accounting for these factors not only enables the prediction of potential filtration flows and leakages through the foundation and dam body but also provides a basis for designing more reliable hydrogeological monitoring schemes and anti-filtration measures.
Lineament analysis remains a widely used tool in structural geology and engineering studies, enabling the identification of concealed faults, zones of weakness, and tectonic blocks based on remote sensing data and digital elevation models. In their review paper, Gabrielsen and Olesen (2024) [8], four main approaches to lineament studies were outlined: the general approach (for constructing the regional structural framework), the statistical approach (quantitative assessment of orientation and density), the focused approach (detailed investigation of individual faults), and the dynamic approach (tracing the evolution of structures over time). The authors emphasize that the reliability of interpretations can only be achieved through the integration of satellite and geophysical data with field observations and geochronology, as well as through the combined use of automated and manual methods. Case studies from Norway demonstrate that such a comprehensive approach allows for refinement of the architecture of fault zones, their multiphase development, and their potential present-day activity.
In another study [9], the authors addressed the challenge of distinguishing hydraulically significant lineaments—those that play a key role in groundwater flow—from the general lineament population. To achieve this, they proposed a set-theory-based approach in which the entire lineament dataset was considered as a universal set, and operations on subsets (intersection, union, etc.) were applied to filter out features not meeting hydrogeological significance criteria. The filtering criteria included spatial coincidence with watershed boundaries, orientation, correlation with drainage channels, and geomorphological indicators. The results showed that the filtered subset of lineaments exhibited a stronger correlation with hydrogeological data (direct or indirect) and could serve as a basis for delineating zones of enhanced permeability and potential groundwater flow pathways in crystalline or metamorphic rocks.
The authors [10] present a methodology for lineament mapping in complex hard-rock environments using geospatial data, including GIS, satellite imagery, and digital elevation models. They emphasize the selection of the most significant lineaments that may influence hydrogeological processes through the application of spatial, morphological, and thematic filters, combined with the integration of multiple data sources. The extracted lineaments are analyzed in terms of orientation and density, and correlated with the drainage network and topography, which makes it possible to identify structurally weakened zones and potential pathways of groundwater filtration. By applying such an integrative approach, the accuracy of delineating linear elements with hydrogeological significance can be improved, thereby enhancing the planning of water flow monitoring and the assessment of potential filtration zones.
In another study [11], the authors propose a simplified yet effective geospatial approach to remote lineament mapping and terrain attribute analysis in a basement complex terrain. As a case study, they examine the Idanre Hills region in southwestern Nigeria, employing a combination of datasets: stream network segmentation, multi-azimuth hillshading derived from DSM/DEM, terrain roughness index calculations, and high-resolution Google Earth imagery for structural interpretation. The results demonstrate that high terrain roughness values coincide with weathered zones and lineament distributions, indicating a relationship between structural fracturing and surface morphological heterogeneity. Furthermore, certain segments of the river network partially coincide with lineaments, suggesting the structural control of water drainage directions. The authors highlight that the proposed method is particularly useful as a reconnaissance and preliminary mapping tool in remote and inaccessible areas. However, they also note that Google Earth DSM data cannot be used in isolation and must be validated through field investigations and integrated with more accurate DEM/DSM sources.
The aim of the present study is a structural-geological analysis of the Voroshilov Reservoir area, where in March 2024 the dam failed, leading to an emergency release of the entire water volume. The relevance of this study is driven by the increasing risks associated with the operation of hydraulic structures in seismically active regions, particularly considering the physical aging of dams constructed in the early to mid-20th century and the insufficient instrumental monitoring systems. This situation necessitates the application of additional methods to assess the structural stability of hydraulic facilities, focusing on the identification of hidden geological preconditions for potential failures. For comparative analysis, the Priyut Reservoir is also considered, given the similar conditions of their placement: both hydraulic structures were commissioned in the early 20th century and are located in a seismically active region.
To address the task of a comprehensive assessment of dam stability, this study proposes an integrated geospatial approach based on the combination of multi-level lineament analysis and geodynamic zoning. The main scientific results and contributions of the study include: (i) the construction of regional and local lineament maps using ASTER GDEM and high-resolution ALOS PALSAR data; (ii) the integration of lineament density and orientation with contemporary surface displacement velocities from GPS, deformations identified from InSAR, and probabilistic seismic hazard assessment into a single geodynamic zoning model; (iii) the testing of the proposed approach on real hydraulic structures, demonstrating that cumulative seismic effects and filtration processes along fracture zones can critically impact dam stability even under conditions of reduced local geodynamic activity.
It should be noted, however, that the integration of lineament analysis with geodynamic zoning is not a direct method for hazard assessment and does not replace traditional monitoring techniques. Instead, this combined approach is considered a preliminary step that allows for the identification of priority areas for more detailed engineering and hydrogeological monitoring, directing resources to the most potentially vulnerable elements of the dam–reservoir system.
2. Materials and Methods
2.1. Study Area
The Voroshilov Reservoir is located on the Zharmukhamet and Boraldai rivers within the village of Baykent, Almaty Region, Kazakhstan. Commissioned in 1910, it was originally designed to irrigate 580 ha of agricultural land. The dam is an earth-fill structure, 180 m long and 8.5 m high, with a reinforced concrete facing on the upstream slope installed during reconstruction works in the 1970s, and a dry earth downstream slope. The total reservoir capacity at the normal retention level is 1.36 million m3. According to the Almaty Region Water Resources and Irrigation Authority, immediately prior to the accident, the actual filling was about 50% of the design capacity. On 30 March 2024, at 15:50 local time (Astana), the dam failed, resulting in the sudden release of water into the Zharmukhamet River channel. The flood wave propagated through a cascade of ponds with open spillways, causing the rapid filling of downstream reservoirs, including two lakes of the Zharmukhamet River. As a result, flooding threatened more than 12,000 residents of two settlements, necessitating the emergency evacuation of part of the population [12,13].
For comparative analysis, the Priyut Reservoir, which has similar characteristics, is also considered. Located about 10 km southeast of the Voroshilov Reservoir, upstream of the village of Tyumebaeva on the Terencara River, it was likewise commissioned in 1910. Designed for the irrigation of 289 ha, it operates within a cascade system. The total design capacity of the Priyut Reservoir is 2.94 million m3. The earth-fill dam is 364 m long, 13 m high, and 6 m wide at the crest. During reconstruction works in the 1970s, the upstream slope was reinforced with concrete slabs. A location map of the reservoirs is shown in Figure 1.
Detailed comparative characteristics of the Voroshilov and Priyut reservoirs, including dimensions, capacity, and reconstruction history, are presented in a previously published study [14], where the engineering and geological surveys, as well as the map of the ‘Geological and lithological section of the Voroshilov reservoir dam’, are described. Engineering and geological surveys conducted in 2020 determined that the Voroshilov dam body consists of loams ranging from solid to fluid-plastic consistency, underlain by coarse sands with gravel and pebbles. The Priyut reservoir dam exhibits a similar composition and stratigraphy, as it was constructed nearby in the same year using comparable materials and design principles.
2.2. Lineament Extraction Algorithm
For the lineament analysis, remote sensing data with varying spatial resolutions were employed. At the regional scale, the ASTER GDEM V3 digital elevation model with a spatial resolution of 30 m was used, providing a general overview of the morphostructural features of the study area. The ASTER data were obtained through the EarthExplorer portal [15].
For more detailed local analysis in the vicinity of hydraulic structures, the ALOS PALSAR DEM with a spatial resolution of 12.5 m was utilized. The ALOS DEM was provided in the ALOS-PALSAR FBS format (Fine Beam Single polarization mode, HH) with radiometric and terrain correction (RTC1—Radiometric Terrain Corrected). These data are freely available via the Alaska Satellite Facility portal [16].

Figure 1.
(a) Overview map of the study area; (b) Voroshilov Reservoir; (c) Priyut Reservoir.
The extraction of lineaments (linear morphostructural features) was carried out using image and DEM processing tools in PCI Geomatica, which provides flexible algorithms for spatial analysis and the delineation of structural elements of the landscape.
The algorithm is based on the analysis of tonal characteristics (texture) of raster images of the Earth’s surface, i.e., fractures on images are represented by straight-line boundaries between areas of different brightness [17,18]. By “fractures” we refer to small-scale linear features identifiable at the image scale, which in reality correspond to minor disjunctive structures, segments of larger faults, less frequently anthropogenic objects, and in rare cases “false” features (e.g., shadows, clouds) [19].
The methodology for lineament extraction included four main stages:
- Preprocessing of the digital elevation model (creation of hillshade images);
- Automatic lineament extraction;
- Post-processing of results—manual filtering and removal of anthropogenic objects;
- Calculation of quantitative parameters—generation of rose diagrams and a lineament density map.
Hillshade models were generated to enhance the visual expression of linear morphostructures (faults and other lineaments). Following previously published studies [20,21,22], eight hillshade images were created with different illumination azimuths: 0°, 45°, 90°, 135°, 180°, 225°, 270°, and 315°. The illumination height was set to 45° in all cases, providing optimal representation of linear landforms in the study area. Processing and visualization of hillshade images were carried out in ArcMap using the 3D Analyst tool.
At the next stage, lineaments were automatically extracted in the PCI Geomatica software environment (version 2016) using the LINE module. The LINE algorithm consists of three stages: edge detection, thresholding, and curve extraction (Figure 2). In the first stage, the Canny edge detection algorithm is applied to create an edge strength image. In the second stage, a threshold value is set for the edge strength image to obtain a binary image. Each pixel included in the binary image represents an edge element. In the third stage, curves are extracted from the binary edge image. This step consists of several sub-steps. First, a thinning algorithm is applied to the binary edge image to obtain skeletonized curves with a width of one pixel. Then, a sequence of pixels is extracted for each curve. Any curve with a number of pixels smaller than the parameter LTHR is excluded from further processing. The extracted pixel curve is converted into vector form by fitting piecewise-linear segments.
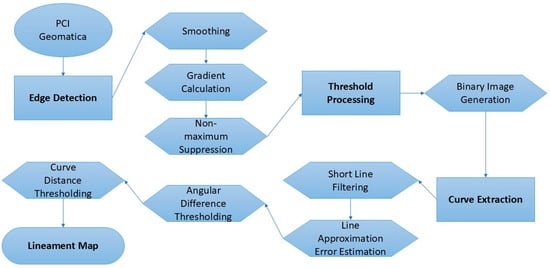
Figure 2.
Flowchart of automatic lineament analysis using Geomatica v 2016 software.
The resulting polyline approximates the original pixel curve, where the maximum approximation error (distance between them) is defined by the FTHR parameter. Finally, the algorithm links pairs of polylines that satisfy the following criteria:
- The two end segments of the polylines are facing each other and have similar orientation (the angle between the two segments is less than the ATHR parameter);
- The two end segments are located close to each other (the distance between endpoints is less than the DTHR parameter).
The algorithm is controlled by six adjustable parameters [23,24,25]. The optimal parameter values were determined through a combined analysis of experimental calibration and literature review [20,21,22,23,24], taking into account terrain characteristics, image resolution, and the geological and tectonic features specific to the study area (Table 1).

Table 1.
Parameters of lineament analysis applied in the PCI Geomatica software environment using the LINE module.
The threshold values of RADI and GTHR were selected empirically depending on the resolution and topography of the study area. The LTHR parameter was chosen based on tectonic characteristics and landform structure, while the remaining parameters were set according to methodological recommendations presented in previous studies [25,26,27].
Following the automatic extraction of lineaments, manual filtering was carried out. Anthropogenic linear features such as roads, railways, buildings, and other infrastructure were excluded. Although automatic filtering by length and shape is possible, visual verification against topographic and infrastructure maps ensures the highest reliability.
To analyze the orientation of the extracted structures, rose diagrams were generated using RockWorks v. 2025.4.23 software, which made it possible to identify the predominant lineament directions. In addition, a lineament density map was constructed in ArcMap using the Density tool, which calculates density as the ratio of the total length of linear features to the cell area (expressed in km/km2).
2.3. Development of a Geodynamic Zoning Map of the Study Area
The assessment of geodynamic (neotectonic) activity is based on a number of calculated indicators. One of the key indicators is the density of faults, major fractures, and other lineaments, expressed as the total length of these features per unit area. The ranking of geodynamic activity according to this indicator is performed using a classification scheme based on statistical distribution values. Typically, six gradations are distinguished, taking into account the arithmetic mean and the standard deviation of their intensity (Table 2) [1].
Table 2.
Ranking of geodynamic activity.
The standard deviation (an estimate of the root mean square deviation of a random variable x from its expected value, based on the unbiased estimate of its variance) is used as the statistical measure:
where is the variance; is the i-th sample element; n is the sample size; is the arithmetic mean of the sample:
To generate a numerical dataset on the total length of lineaments per unit area, the corresponding file was processed, followed by calculations using Formulas (1) and (2). As a result, the standard deviations and arithmetic mean values of the total lineament lengths per unit area were obtained, and the required distributions corresponding to the established six gradations were derived (Table 2).
3. Results
3.1. Lineament Mapping and Analysis
For the regional analysis, the Almaty Region was selected, with a total area of 206,228 km2 (Figure 3). As a result of automatic and subsequent manual extraction, 1057 lineaments of varying lengths were identified. The length of the detected linear structures ranges from 4800 to 30,000 m, indicating the presence of both local and regional tectonic dislocations. Spatial analysis revealed that the lineaments are distributed unevenly, forming clusters associated with tectonically active zones. The constructed rose diagram of azimuthal distribution demonstrates a predominant southwest–northeast orientation, which correlates well with regional structural trends. This dominant orientation may indicate the presence of active deep-seated faults and potentially unstable zones.
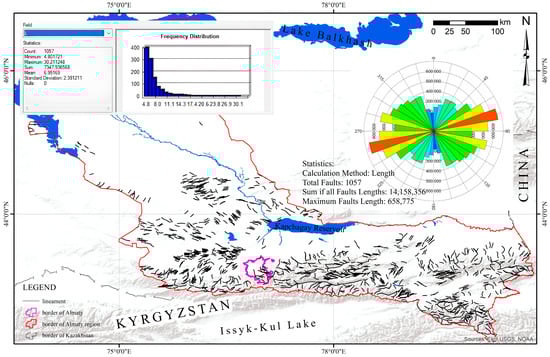
Figure 3.
Lineament tectonics map of the Almaty Regio with statistical data and rose diagram of lineament orientations.
A lineament density map was constructed based on the results of lineament extraction using the Line Density tool in the ArcGIS v. 10.8 software environment. The density was calculated as the ratio of the total lineament length to the grid cell area (expressed in km/km2), which allowed the distribution of structural intensity across the entire study area to be represented (Figure 4).
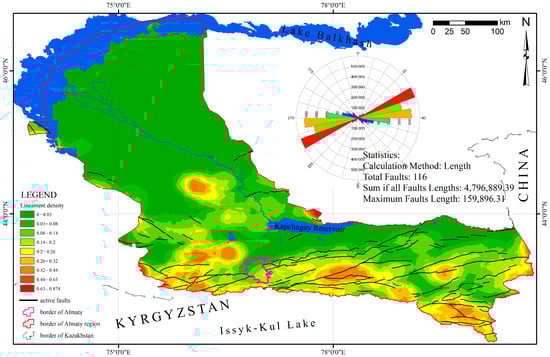
Figure 4.
Lineament density map of the Almaty Region, showing major regional faults and rose diagram of fault orientations.
The resulting map visualizes zones with varying intensities of linear structures. Areas of high lineament density are primarily localized along tectonically active lines and near the intersections of structural trends. These areas may indicate a high degree of tectonic dislocation, which is critical to consider when selecting sites for the construction and monitoring of hydraulic structures, particularly in seismically active regions.
Conversely, regions with low lineament density correspond to structurally stable blocks that are less affected by tectonic processes. The lineament density map, thus, represents an important tool for regional assessments of tectonic activity and can be used to identify potentially hazardous zones prone to surface deformation.
A comparative analysis of lineament orientations and major known faults in the Almaty Region (Figure 3 and Figure 4) demonstrates a generally good agreement between the two datasets. The rose diagrams of regional lineaments closely correspond to the orientation of mapped regional faults, confirming the structural control of the area. In particular, the dominant orientations identified in the lineament analysis align with the principal tectonic trends, indicating that the extracted lineaments effectively capture the direction of priority structures.
A local-scale lineament density map was constructed for an area of 808 km2 encompassing the zone of hydraulic structures. The analysis identified 611 lineaments with lengths ranging from 1000 to 6500 m (Figure 5).
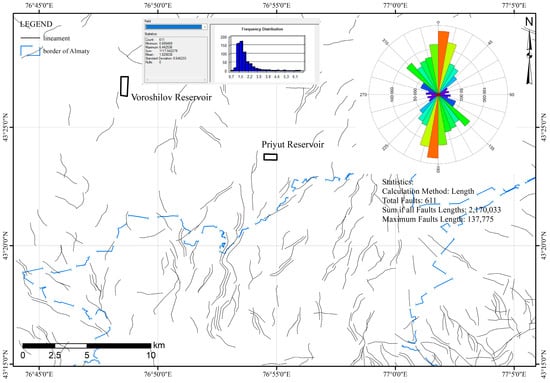
Figure 5.
Lineament tectonics map of the hydraulic structures area with statistical data and rose diagram of lineament orientations.
The analysis of the resulting map showed that the highest concentration of lineaments is observed within the urbanized area, whereas in the immediate vicinity of the hydraulic structures the density of linear features is significantly lower. This may indicate either the relative tectonic stability of the dam site or geomorphological conditions that complicate the automatic detection of lineaments in this zone.
The dominant orientation of lineaments is north–south, reflecting the structural alignment of local tectonic faults. The obtained data can be applied to assess potential geological hazards and to improve the reliability of hydraulic structure operation in seismically active regions.
The results of the density analysis showed that, overall, the map is characterized by a low density of linear structures, with the exception of several local zones within the urbanized area where increased density is observed (Figure 6). In contrast, in the areas of the Voroshilov and Priyut reservoirs, the lineament density is relatively low.
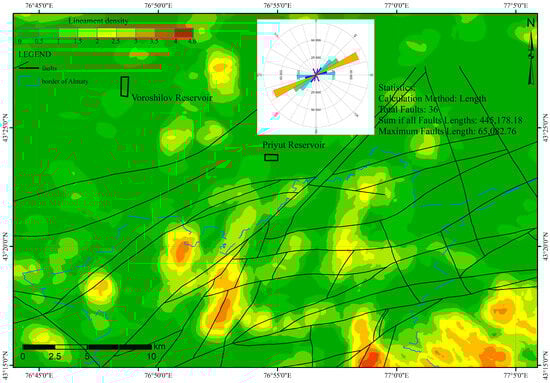
Figure 6.
Lineament density map of the hydraulic structures area, showing local faults in the Almaty city vicinity and a rose diagram of fault orientations.
For the local study area (Figure 5 and Figure 6), the rose diagram analysis did not show such agreement with mapped faults. This discrepancy is attributed to several factors, including anthropogenic modifications (construction, roads, and urban infrastructure), vegetation and land cover effects, limited bedrock exposure, and the fact that lineaments extracted from DEM or satellite imagery may represent smaller or superficial features not captured in geological fault maps.
3.2. Geodynamic Zoning Results
According to the described methodology, standard deviations and arithmetic mean values of the total lineament lengths per unit area were obtained, and the resulting distributions were classified into six gradations (Table 2), which were then visualized in the form of a map (Figure 7).
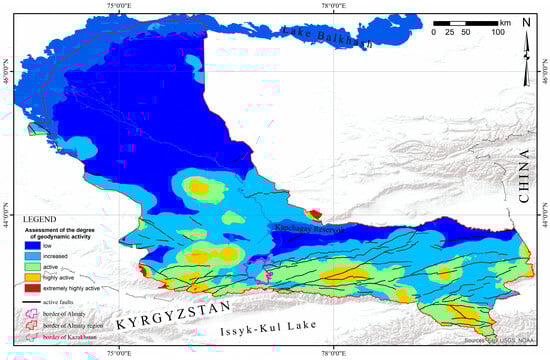
Figure 7.
Map of Geodynamic Activity Assessment of the Almaty Region.
The geodynamic activity map, based on a combination of morphostructural and seismotectonic data, indicates that the study region as a whole is characterized by high to moderately high geodynamic activity. This is reflected in the presence of active faults, tectonically controlled lineaments, and seismic activity. Quantitatively, at the regional scale, lineament density values between 0 and 0.017 correspond to low geodynamic activity, 0.018–0.15 to moderate activity, 0.151–0.29 to high activity, 0.291–0.42 to very high activity, and values above 0.42 indicate extreme geodynamic activity.
However, the areas of the Voroshilov and Priyut reservoirs are located within zones of relatively low geodynamic activity.
The geodynamic activity assessment map constructed for the local-scale analysis demonstrated that the study area is characterized by low geodynamic activity. For the local object, lineament density values of 0–0.03 correspond to low activity, 0.031–1 to moderate activity, 1.01–2.15 to high activity, 2.16–3.21 to very high activity, and values above 3.21 indicate extreme geodynamic activity. This indicates the absence of significant tectonic deformations and a high degree of crustal stability in the vicinity of the hydraulic structures (Figure 8).
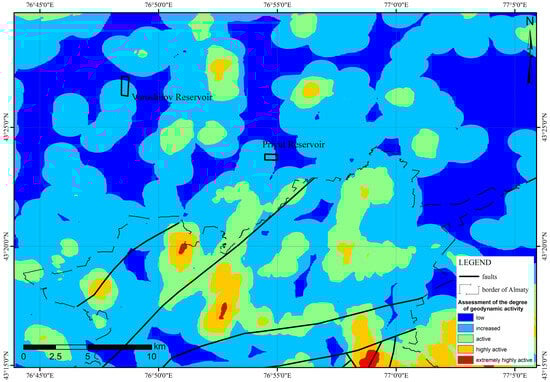
Figure 8.
Geodynamic Activity Assessment Map (Local Scale).
4. Discussion
4.1. Seismic Regime Analysis in the Dam Area
According to the data of the Institute of Seismology of the Ministry of Emergency Situations of the Republic of Kazakhstan, the Almaty Region is among the most seismically hazardous areas of Kazakhstan. This is determined by its geological position within the northern margin of the Tien Shan, which is characterized by high tectonic activity. Detailed seismic zoning indicates that a significant portion of the region is characterized by calculated peak ground accelerations (PGA) ranging from 0.4 to 0.9 g, with a 2% probability of exceedance in 50 years (return period of 2475 years).
The most hazardous zones are concentrated in the southern and southeastern parts of the region along the ranges of the Northern Tien Shan, including the areas of Almaty, Esik, Talgar, Tekeli, Kegen, and Narynkol, where the expected PGA values reach 0.8–0.9 g. This corresponds to seismic intensities of 9–10 on the MSK-64 scale. These areas host major settlements, as well as transportation, energy, and hydraulic infrastructure (e.g., the Kapshagay Reservoir).
In the central part of the region (Taldykorgan, Kapshagay area), seismic hazard is assessed as moderate, with PGA values of 0.3–0.5 g. Meanwhile, the northern territories (Bakanas, the Pri-Balkhash area) are situated within zones of relatively low seismic activity, where PGA does not exceed 0.05–0.1 g, corresponding to intensities of 6–7 on the MSK-64 scale.
Thus, regional seismic zoning shows that the study area lies within a zone with calculated peak ground acceleration values ranging from 0.4 to 0.9 g. Such values correspond to a high level of seismic hazard, which must be considered in the design, operation, and monitoring of hydraulic structures.
According to recent data [28,29], the probability of exceeding a peak ground acceleration (PGA) of 0.28 g at the site is estimated at 10% in 50 years (return period of 475 years) (see Figure 9). According to the Water Resources and Irrigation Department of the Almaty Region, during the design of the Voroshilov dam, a horizontal acceleration coefficient of 0.22 g was adopted, based on soil conditions. This corresponds to 79% of the currently expected accelerations. We, therefore, conclude that the structural characteristics of the dam do not meet modern seismic safety standards.
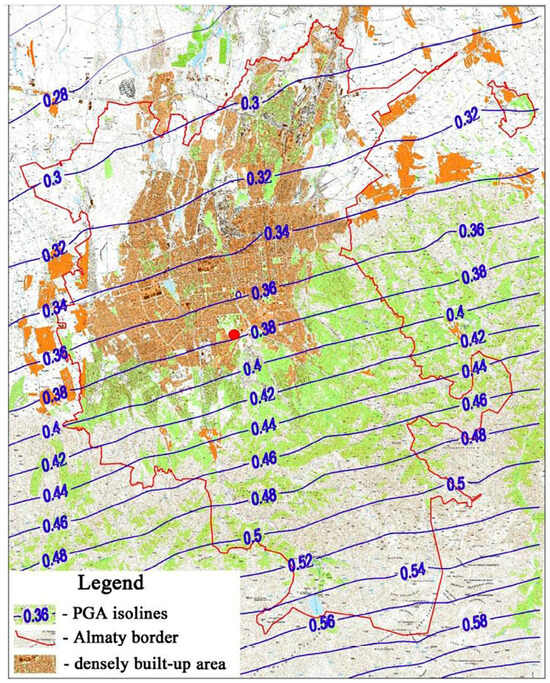
Figure 9.
Seismic hazard map of the Almaty area for a 10% probability of exceedance in 50 years based on PGA (return period 475 years). The location of the Central Seismological Observatory station is marked with a red circle.
As part of this study, a detailed analysis of the seismic regime in the vicinity of the dam was carried out for the period 2017–2024. Monitoring showed that within a 30 km radius of the structure, 57 minor earthquakes were recorded, with maximum magnitudes not exceeding M = 2.0. Notably, the majority of these events (77%) had hypocenters at depths of 5–10 km, which is typical of crustal earthquakes.
In addition to local microseismicity, more significant seismic events were also observed. During the analyzed period, three earthquakes with magnitudes ranging from M = 4.7 to M = 7.0 occurred within the radius of the zone where tectonic precursory deformations are manifested [30] (see Table 3: 26 March 2018, 22 January 2024, and 4 March 2024). One of these events (Akkol, 22 January 2024, M = 7.0), although located approximately 320 km from Almaty, was felt in the city with an intensity of up to 5 on the Modified Mercalli Intensity (MMI) scale.
Table 3.
Earthquake catalog within a 30 km radius of the dam for the period since 2017.
Given the linear dimensions of the Voroshilov dam, the seismic effects of all recorded earthquakes (both local and distant) can be approximately considered as uniformly distributed across its sections. This assumption makes it possible to analyze the overall structural response of the dam to seismic loads without focusing on localized impacts.
The cumulative impact of previous strong earthquakes (M = 7.0, 22 January 2024, 320 km; M = 5.4, 4 March 2024, 57 km) may have significantly aggravated pre-existing deformations of the dam and ultimately contributed to its subsequent failure. It is important to note that the combined peak ground acceleration (PGA) from these events did not exceed 0.10 g. On the one hand, this value is considerably lower than the critical design threshold for the dam structure (0.22 g), indicating its initial resistance to such impacts. On the other hand, to test the hypothesis of a direct causal relationship between cyclic seismic loading and failure, we constructed a time series of peak accelerations within the dam body, calculated according to formulas [31], and presented in Figure 10.
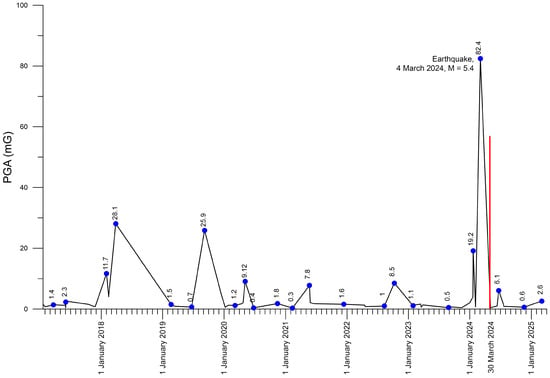
Figure 10.
PGA Ground Acceleration Time Series for the Dam (mG).
The graph clearly demonstrates that the dam failure occurred 25 days after the structure experienced its maximum accelerations during the entire observation period, caused solely by the most recent earthquake. These accelerations reached 37% (0.083 g) of the dam’s design seismic resistance. This suggests that the M = 5.4 earthquake of 4 March 2024, which occurred only 57 km away, may have triggered accelerated soil loosening, as detected by the InSAR method [14] and, thus, became the critical factor leading to the subsequent failure.
The geodynamic setting of the study area reflects the superposition of regional (far-field) and local (near-field) stress regimes. Regional tectonic stress in the Northern Tien Shan is controlled by the long-term convergence between the Indian and Eurasian plates and is expressed as crustal shortening with low deformation rates (≤4 mm/yr), as consistently revealed by GPS measurements. These data characterize the background accumulation of elastic strain at the lithospheric scale and explain the generally elevated seismic hazard of the Almaty Region. In contrast, local stress variations are associated with fault-controlled deformation, structural heterogeneities, and changes in the mechanical state of near-surface materials. In this context, InSAR observations capture localized ground displacements that reflect not only tectonic motion but also the structural response of the dam body and its foundation, including soil loosening and progressive settlement.
Although none of the recorded earthquakes exceeded the design peak ground acceleration (0.22 g), nearby and regional seismic events likely played a critical role through cumulative and cyclic loading. Numerical models have shown that seismic excitation can induce significant internal stresses and displacements within the body of an earth dam even when peak ground accelerations do not surpass traditional design values, due to the nonlinear response of materials and complex wave interactions near fault zones [32]. Strong distant earthquakes (e.g., M = 7.0 on 22 January 2024) may have initiated micro-damage and reduced the effective stiffness of the dam–foundation system, while the closer M = 5.4 event of 4 March 2024 (57 km) acted as a seismic trigger. This earthquake generated the maximum accelerations observed during the monitoring period (0.083 g, ~37% of the design threshold), followed by dam failure after a delay of approximately 25 days. Such a temporal lag rules out instantaneous collapse and instead indicates seismically induced progressive degradation driven by cyclic loading. InSAR data independently confirm an acceleration of local deformations after this event, consistent with intensified soil loosening and possible pore-pressure changes. Therefore, the failure is best explained not by exceedance of a single seismic threshold but by the cumulative effect of cyclic seismic loading that transformed regional tectonic stress into critical local instability of the dam foundation.
Although the seven-year seismic catalog (2017–2024) is statistically limited and does not cover the complete seismic cycle of the region, our conclusions on the Voroshilov dam failure remain robust. InSAR and GPS data demonstrate that the M = 5.4 earthquake (57 km) triggered accelerated soil loosening at the dam foundation, with a 25-day lag between peak seismic loading and failure, confirming a mechanism of seismically induced progressive degradation. While long-term monitoring is necessary to fully assess future seismic hazard, direct geodetic observations provide a reliable basis for understanding the structural response of the dam.
4.2. Generalized Characteristics of the Geodynamic Regime Based on GPS Data
Geodynamic GPS monitoring of surface displacements has been conducted since 2009 at the Almaty Prognostic Test Site and within the city of Almaty, covering 11 continuous observation stations (see Figure 11). This network of GPS observations was established under the Republican Budget Program 002 “Applied Scientific Research in the Field of Space Activities.”
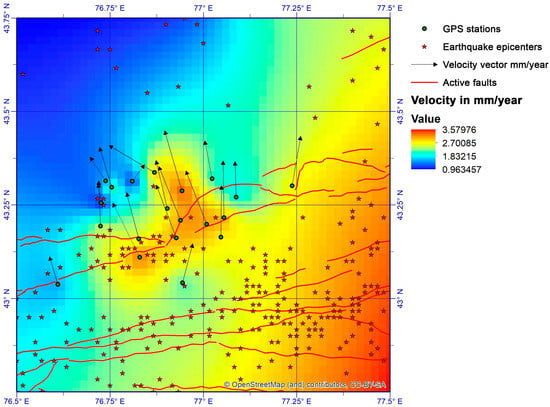
Figure 11.
Regional Map of Contemporary Crustal Velocity Fields with Earthquake Epicenters (see Table 3).
The obtained velocity vectors predominantly show meridional and northwestward orientations, with amplitudes not exceeding 4 mm/year. This indicates the ongoing crustal shortening of the Northern Tien Shan, caused by the continued convergence of the Indian and Eurasian plates. Notably, the northwestern part of the study area remains practically immobile, suggesting the absence of significant internal deformations in this zone.
At the same time, the deviatoric (orthogonal) extension is oriented sublatitudinally, coinciding with the directions of major tectonic faults. This creates favorable conditions for strike-slip displacements along these faults.
4.3. Comprehensive Geodynamic Analysis
At the final stage, a comprehensive geodynamic analysis was conducted, resulting in the construction of a geodynamic zoning map of the local study area (Figure 12). This map was derived from the integration of the following normalized and combined datasets:
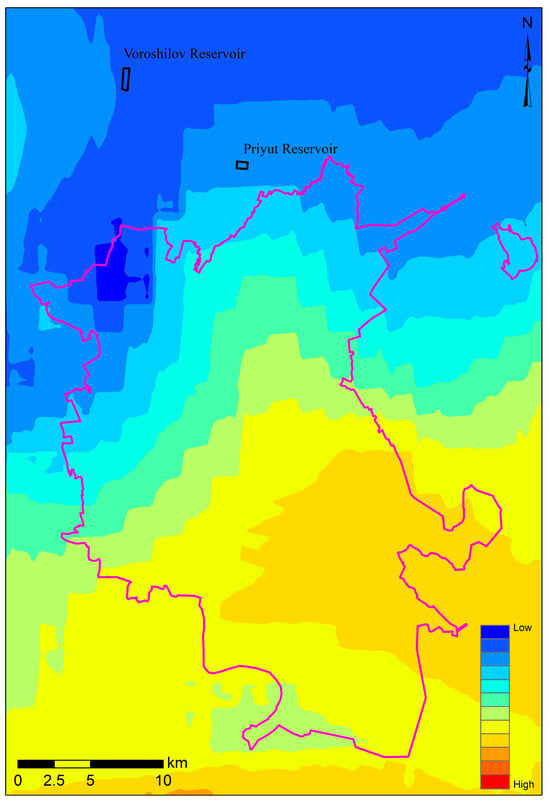
Figure 12.
Geodynamic Zoning of the Study Area.
- Lineament density map;
- Map of present-day surface displacement velocities;
- InSAR analysis results from Sentinel-1 satellite data, enabling the detection of ongoing deformations;
- Detailed seismic zoning map.
The integration of these datasets provides a more reliable and multidimensional assessment of geodynamic conditions compared to the use of individual methods. Such a combined approach makes it possible to identify both stable and potentially hazardous zones, trace the correspondence between structural features and recent deformation processes, and improve the accuracy of seismic risk assessments for hydraulic structures.
Normalization of all maps was performed on a unified scale of values, after which they were combined using weighted summation. The weights for the four integrated data layers (lineament density, GPS, InSAR, seismic zoning) were assigned equally, reflecting the fact that all layers represent the same geodynamic phenomenon through different observational methods. The resulting map made it possible to delineate areas with different levels of geodynamic activity, ranging from highly active to stable. The results show that the area of the hydraulic structures (Voroshilov and Priyut reservoirs) belongs to a zone of low geodynamic activity, despite the fact that the study region as a whole is characterized by moderate to high activity. This confirms the relative stability of the examined site but emphasizes the necessity of regular monitoring due to the overall seismic context of the region.
5. Conclusions
The conducted lineament analysis and geodynamic zoning revealed that, despite the overall location of the Almaty Region within a high seismic hazard zone (PGA 0.4–0.9 g), the areas of the Voroshilov and Priyut reservoirs are characterized by reduced local geodynamic activity and comparatively low lineament density. Quantitatively, regional lineament density within the Almaty seismic zone ranges between approximately 0.00–0.08 lineaments per km2, whereas local analysis in the immediate vicinity of the reservoirs shows slightly elevated but still low values of 0.0–1.0 lineaments per km2 (normalized on a 1 km2 sliding window).
Despite this comparatively low structural expression, the failure of the Voroshilov dam in 2024 demonstrates that low visible lineament density does not preclude significant seismic risk, especially when considering hidden or deep-seated tectonic fractures and cumulative seismic loading that are not fully captured by surface linear features alone. This highlights that reduced local geodynamic activity should not lead to complacency, as geodynamic zoning is directly related to lineament density, which represents structural discontinuities and potential weak zones. Consequently, even areas with low local geodynamic activity in seismically active regions may be vulnerable to cumulative seismic effects, hidden fracture pathways, and progressive degradation of hydraulic structures, as demonstrated in a recent multi-criteria GIS assessment of geohazards around the Charvak reservoir in Uzbekistan by Fazilova et al. (2025), where lineament density was identified as a dominant hazard indicator [33]. Continuous monitoring of such areas is, therefore, essential, integrating lineament analysis, GPS/InSAR surface displacement data, and detailed seismic zoning.
However, it is important to note the limitations of lineament and GPS/InSAR analyses. Lineament analysis primarily identifies surface-visible linear features and may miss deep or hidden fractures, while GPS and InSAR capture surface deformations but may not detect rapid or highly localized subsurface changes. Environmental factors, resolution limits, and non-unique interpretations can reduce predictive power. Observed displacements indicate stress accumulation but do not directly predict failure. Therefore, these methods should be used as part of a comprehensive monitoring framework that includes geological, geotechnical, hydrological, and seismic data to account for cumulative processes such as soil loosening, pore-pressure changes, and repeated seismic loading that may ultimately lead to dam failure.
The results of this study confirm the effectiveness of an integrated multi-criteria approach combining lineament analysis, mapping of linear structure density, assessment of present-day surface displacements from GPS and InSAR data, and detailed seismic zoning. This approach allows identification of potential high-risk zones, forecasting of subsurface filtration pathways, and refinement of the overall stability assessment of hydraulic structures.
The proposed methodology can be recommended for use in the monitoring and safety assessment of water management facilities in seismically active regions of Central Asia, as well as for the development of preventive control systems and risk management strategies for dam failures.
Author Contributions
Conceptualization, D.T. and A.V.; methodology, D.T. and A.V.; validation, D.T. and A.V.; formal analysis, O.K. and A.M.; writing—original draft preparation, D.T., T.D., L.B., O.K. and A.M.; writing—review and editing, D.T. and A.V.; visualization, D.T., T.D., L.B., O.K. and A.M.; supervision, A.V. All authors have read and agreed to the published version of the manuscript.
Funding
This research was funded by the Committee of Science of the Ministry of Science and Higher Education of the Republic of Kazakhstan, grant number BR21882365.
Data Availability Statement
The original contributions presented in this study are included in the article. Further inquiries can be directed to the corresponding authors.
Conflicts of Interest
The authors declare no conflicts of interest.
References
- Ahmadi, H.; Pekkan, E. Fault-Based Geological Lineaments Extraction Using Remote Sensing and Gis—A Review. Geosciences 2021, 11, 183. [Google Scholar] [CrossRef]
- Terzaghi, K. Theoretical Soil Mechanics; Johnwiley & Sons: New York, NY, USA, 1943. [Google Scholar]
- Casagrande, A. Classification and Identification of Soils. Trans. Am. Soc. Civ. Eng. 1948, 113, 901–930. [Google Scholar] [CrossRef]
- Skempton, A.W.; Hutchinson, J. Stability of Natural Slopes and Embankment Foundations. In Proceedings of the State of the art report, Seventh International Conference on Soil Mechanics and Foundation Engineering, Mexico City, Mexico, 22–30 August 1969. [Google Scholar]
- ICOLD. ICOLD Bulletin 164: Internal Erosion of Existing Dams, Levees, and Dikes, and Their Foundations; CRC Press: Boca Raton, FL, USA, 2015; Volume 1. [Google Scholar]
- U.S. Army Corps of Engineers (USACE). Engineering and Design SEEPAGE ANALYSIS AND CONTROL FOR DAMS Distribution Restriction Statement; Department of the Army, Corps of Engineers: Washington, DC, USA, 1986. [Google Scholar]
- U.S. Army Corps of Engineers (USACE). Slope Stability ENGINEER MANUAL; Department of the Army, Corps of Engineers: Washington, DC, USA, 2003. [Google Scholar]
- Gabrielsen, R.H.; Olesen, O. The Concept of Lineaments in Geological Structural Analysis; Principles and Methods: A Review Based on Examples from Norway. Geomatics 2024, 4, 189–212. [Google Scholar] [CrossRef]
- Sur, T.; Acharya, T. Filtering of Hydraulically Significant Lineaments from Lineament Map of Precambrian Metamorphic Terrain in NE India Using Set Theory. Groundw. Sustain. Dev. 2020, 11, 100469. [Google Scholar] [CrossRef]
- Jonathan, M.; Mjemah, I.C.; Kimambo, O.N.; Hamad, A.A. A Geospatial Approach to Delineate Lineaments on the Granite Gneissic Terrain of Mpwapwa District, Dodoma, Central Tanzania. Heliyon 2024, 10, e38346. [Google Scholar] [CrossRef]
- Lawal, M.A.; Oshomoji, A.O.; Akinlalu, A.A.; Omosanya, K.O.; Ndukwe, O.S.; Adiat, K.A.N.; Mosuro, G.O. A Simplified GIS and Google-Earth-Based Approach for Lineaments and Terrain Attributes Mapping in a Basement Complex Terrain. Sci. Rep. 2022, 12, 15801. [Google Scholar] [CrossRef] [PubMed]
- About the Opening of the Voroshilov Reservoir Dam. Available online: https://www.gov.kz/memleket/entities/almobl/press/article/details/163689?lang=en (accessed on 22 September 2025).
- Dzhangulova, G.K.; Dedova, T.V.; Kuznetsova, O.P.; Bashirova, N.Z.; Kalybekova, A.A. Dam break flooding simulation using a dem constructed from lidar data. News Natl. Acad. Sci. Repub. Kazakhstan Ser. Geol. Tech. Sci. 2025, 2025, 92–108. [Google Scholar] [CrossRef]
- Talgarbayeva, D.; Vilyaev, A.; Dedova, T.; Kuznetsova, O.; Jangulova, G. InSAR Monitoring of Dam Deformations in a Seismically Active Region of Kazakhstan for Identifying Precursors of Failure. Front. Earth Sci. 2025, 13, 1638088. [Google Scholar] [CrossRef]
- EarthExplorer. Available online: https://earthexplorer.usgs.gov/ (accessed on 25 September 2025).
- Alaska Satellite Facility. Available online: https://asf.alaska.edu/ (accessed on 25 September 2025).
- Pandey, P.; Sharma, L.N. Image Processing Techniques Applied to Satellite Data for Extracting Lineaments Using PCI Geomatica and Their Morphotectonic Interpretation in the Parts of Northwestern Himalayan Frontal Thrust. J. Indian Soc. Remote Sens. 2019, 47, 809–820. [Google Scholar] [CrossRef]
- Zhantayev, Z.; Bibossinov, A.; Fremd, A.; Talgarbayeva, D.; Kikkarina, A. Automated Lineament Analysis to Assess the Geodynamic Activity Areas. Procedia Comput. Sci. 2017, 121, 699–706. [Google Scholar] [CrossRef]
- Program LESSA—Lineament Extraction and Stripe Statistical Analysis. Available online: http://www.lineament.ru/indexe.htm (accessed on 25 September 2025).
- Ahmadi, H.; Pekkan, E.; Seyitoğlu, G. Automatic Lineaments Detection Using Radar and Optical Data with an Emphasis on Geologic and Tectonic Implications: A Case Study of Kabul Block, Eastern Afghanistan. Geocarto Int. 2023, 38, 2231400. [Google Scholar] [CrossRef]
- Sichugova, L.; Fazilova, D.S.; Mukhtorov, N.M. Density analysis of lineaments using remote sensing data. EPRA Int. J. Econ. Growth Environ. Issues 2020, 4. [Google Scholar] [CrossRef]
- Shebl, A.; Csámer, Á. Reappraisal of DEMs, Radar and Optical Datasets in Lineaments Extraction with Emphasis on the Spatial Context. Remote Sens. Appl. 2021, 24, 100617. [Google Scholar] [CrossRef]
- Ustinov, S.; Ostapchuk, A.; Svecherevskiy, A.; Usachev, A.; Gridin, G.; Grigor’eva, A.; Nafigin, I. Prospects of Geoinformatics in Analyzing Spatial Heterogeneities of Microstructural Properties of a Tectonic Fault. Appl. Sci. 2022, 12, 2864. [Google Scholar] [CrossRef]
- Salui, C.L. Methodological Validation for Automated Lineament Extraction by LINE Method in PCI Geomatica and MATLAB Based Hough Transformation. J. Geol. Soc. India 2018, 92, 321–328. [Google Scholar] [CrossRef]
- Abdelouhed, F.; Ahmed, A.; Abdellah, A.; Mohammed, I.; Zouhair, O. Extraction and Analysis of Geological Lineaments by Combining ASTER-GDEM and Landsat 8 Image Data in the Central High Atlas of Morocco. Nat. Hazards 2022, 111, 1907–1929. [Google Scholar] [CrossRef]
- Mavoungou, Y.B.; Nkodia, H.M.D.V.; Watha-Ndoudy, N.; Bolarinwa, A.T. Lineament Extraction and Paleostress Analysis in the Bikélélé Iron Deposit (the Chaillu Massif, Republic of Congo): Integration of ALOS-PALSAR DEM and Field Investigation Data. Model. Earth Syst. Environ. 2024, 10, 1993–2009. [Google Scholar] [CrossRef]
- Morelli, M.; Piana, F. Comparison between Remote Sensed Lineaments and Geological Structures in Intensively Cultivated Hills (Monferrato and Langhe Domains, NW Italy). Int. J. Remote Sens. 2006, 27, 4471–4493. [Google Scholar] [CrossRef]
- Silacheva, N.V.; Kulbayeva, U.K.; Kravchenko, N.A. Probabilistic Seismic Hazard Assessment of Kazakhstan and Almaty City in Peak Ground Accelerations. Geod. Geodyn. 2018, 9, 131–141. [Google Scholar] [CrossRef]
- Sadykova, A.B.; Sydykov, A.; Stiharnaya, G.G.; Danabayeva, A.M. Probabilistic Assessment of the Initial Seismicity of Almaty City Due to Microzoning of Its Territory. News Natl. Acad. Sci. Repub. Kazakhstan Ser. Geol. Tech. Sci. 2017, 5, 79–92. [Google Scholar]
- Dobrovolsky, I. Mathematical Theory of Preparation and Prediction of Tectonic Earthquakes; Publishing Company “Physical and Mathematical Literature”: Moscow, Russia, 2016. [Google Scholar]
- Youngs, R.R.; Chiou, S.J.; Silva, W.J.; Humphrey, J.R. Strong Ground Motion Attenuation Relationships for Subduction Zone Earthquakes. Seismol. Res. Lett. 1997, 68, 58–73. [Google Scholar] [CrossRef]
- Sica, S.; Dello Russo, A. Seismic Response of Large Earth Dams in Near-Source Areas. Comput. Geotech. 2021, 132, 103807. [Google Scholar] [CrossRef]
- Fazilova, D.; Magdiev, K.; Makhmudov, M.; Fazilov, A. A Multi-Criteria GIS Model for Geohazard Assessment in the Charvak Reservoir Area, Uzbekistan. Egypt. J. Remote Sens. Space Sci. 2025, 28, 587–596. [Google Scholar] [CrossRef]
Disclaimer/Publisher’s Note: The statements, opinions and data contained in all publications are solely those of the individual author(s) and contributor(s) and not of MDPI and/or the editor(s). MDPI and/or the editor(s) disclaim responsibility for any injury to people or property resulting from any ideas, methods, instructions or products referred to in the content. |
© 2026 by the authors. Licensee MDPI, Basel, Switzerland. This article is an open access article distributed under the terms and conditions of the Creative Commons Attribution (CC BY) license.