Abstract
This research addresses the increasing vulnerability of coastal urban areas to climate change, with a particular focus on the increased risk of overtopping and coastal flooding events in Praia da Vitória, Azores. This study, conducted within the LIFE-GARACHICO project, aims to develop a holistic and flexible management approach to coastal flood risk. The methodology included a comprehensive risk assessment that combined a vulnerability analysis (considering factors such as population, land use, and infrastructure) with the probability of coastal inundation events (using oceanographic data and models). Public risk perception was assessed through surveys to understand residents’ awareness and preferences. A response protocol for overtopping events was developed with civil protection officials, and the HIDRALERTA early warning system was implemented. The risk assessment showed a mostly acceptable risk with some undesirable areas, resulting from a mostly low probability and medium vulnerability. Public surveys indicated that residents had experienced flooding but felt unprepared and preferred softer management measures such as access restrictions and early warning systems. The response protocol developed and integrated into HIDRALERTA responds to these preferences. This study concludes that this integrated framework improves coastal risk management, increases public awareness and confidence, and provides a flexible and sustainable model for coastal risk management.
1. Introduction
Environmental governance began in the 1970s, marked by the first United Nations conference focused on human interaction with the environment—the Stockholm Conference in 1972 []. Since then, environmental management (EM) has become a global concern.
Although studies on climate change and its connection to human-induced greenhouse gas emissions began in the late 19th century, it was only between the 1980s and 1990s that scientific consensus increased. A global commitment to limit the rise in global temperature was not established until the Paris Agreement in 2015 (COP21) [].
Studies on climate change (CC) have especially drawn government attention to coastal urban areas. The predictive models presented in the Fifth Assessment Report (AR5) by the Intergovernmental Panel on Climate Change (IPCC) project a global rise in temperatures and sea levels throughout this century. An increase in the intensity and frequency of extreme weather events is also expected, with once-in-a-century catastrophic events potentially occurring on an annual basis [].
In this context, coastal urban areas are particularly vulnerable to climate change, which increases the occurrence of overtopping and coastal flooding events. Therefore, these areas face challenges in preventing or minimizing the impacts of such extreme events, as they strive to adapt to an uncertain future.
The risk of coastal flooding is heightened by the population’s exposure to these vulnerable areas. In fact, 60% of the world’s largest cities are located along coastlines. Approximately 11% of the global population, around 896 million people, live in coastal zones, and nearly 40% live within 100 km from the coast []. By 2050, it is projected that over 1 billion people will be living in flood-prone coastal areas worldwide [], as follows:
“By 2050, more than a billion people located in low-lying cities and settlements will be at risk from coast-specific climate hazards, influenced by coastal geomorphology, geographical location and adaptation action”.
By 2100, the value of global assets located within areas exposed to 1-in-100-year coastal flood events is projected to range between US$7.9 and US$12.7 trillion []. In countries like Portugal and Spain, losses related to coastal flooding have already reached nearly 40 billion euros over the past 20 years. Specifically, the Canary Islands alone have experienced estimated losses of 250 million euros [].
Coastal urban communities are becoming increasingly vulnerable and exposed to the risks posed by extreme coastal events. Although this is a global issue, each locality presents its specific challenges in coastal management. Environmental management in coastal municipalities requires multicriteria analysis and must contend with numerous uncertainties and natural variables that are often difficult to predict.
The LIFE-GARACHICO Project (LIFE20 CCA/ES/001641, 2021–2026)—visit the LIFE-GARACHICO Project website (https://lifegarachico.eu, accessed on 31 March 2025) for more information—titled ‘Coastal Flooding Adaptation to Climate Change through Flexible Strategies in Macaronesian Urban Areas’, is partially funded (55%) by the EU LIFE Programme. The project aims to develop a Flexible Adaptation Strategic Framework for coastal municipalities in Macaronesia, to enhance their resilience to current and future extreme coastal events resulting from climate change.
The project is mainly based on the principle of adaptive environmental assessment and management (AEAM), first introduced by the author of []. This approach emphasizes continuous monitoring and flexible implementation, allowing environmental policies and management strategies to evolve in response to new scientific knowledge and technological advancements [].
This paper aims to demonstrate how the AEAM principle, as applied in Praia da Vitória (Azores)—one of the study sites within the LIFE-GARACHICO Project—incorporated a holistic approach to investigate and manage recurrent coastal overtopping events.
Praia da Vitória is located on Terceira Island, specifically in the parish of Santa Cruz, on the island’s eastern coast. The prevailing wave regime in the Azores typically follows a W-E or NW-SE direction. However, storms generating E-W wave patterns can occur and, although sporadic, these events particularly impact Praia da Vitória, leading to coastal overtopping along the seafront. According to the 2021 Portuguese Census [], approximately 2000 inhabitants in the study area may be directly or indirectly affected by coastal flooding.
The study conducted in Praia da Vitória integrated a comprehensive risk assessment (Section 2.1), which combined an estimate of the probability of coastal overtopping (Section 2.1.1) events with a detailed vulnerability analysis (Section 2.1.2). It also included an assessment of public risk perception (Section 2.2), the development of a response protocol for coastal overtopping situations (Section 2.3), and the implementation of an early warning and alert system to predict such events (Section 2.4).
The approach presented in the following sections—grounded in fundamental Environmental Assessment and Management principles, such as AEAM and public participation—was developed within the scope of the LIFE-GARACHICO Project in Praia da Vitória. It has proven effective in enhancing the resilience of a coastal community in the face of coastal flooding.
2. Materials and Methods
The management of coastal flooding risk in Praia da Vitória was achieved through the integration of four study frontlines (Figure 1), namely: the risk assessment (Section 2.1), which combined a detailed vulnerability assessment (Section 2.1.2) with an estimate of the probability of coastal overtopping (Section 2.1.1) events; the assessment of public risk perception (Section 2.2); the development of a response protocol for coastal overtopping situations (Section 2.3); and the implementation of an early warning and alert system (Section 2.4) to predict such events.
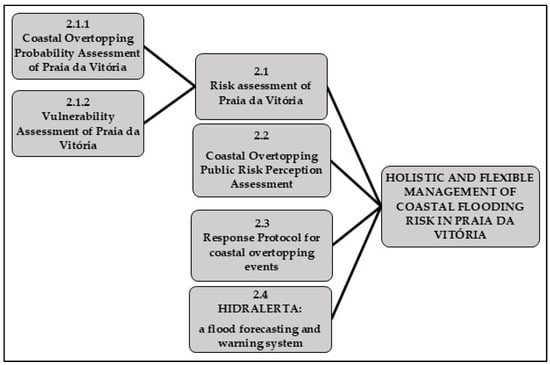
Figure 1.
Chart of methodological approach.
2.1. Praia da Vitória’s Coastal Overtopping Risk Assessment
“Risk management is, in reality, a way of managing uncertainties and expectations inherent to our (human) condition […] but it is also an attempt at an organized response to the anguish(s) and revolt(s) due to our finitude and the feeling of inevitable ’loss’” [].
Taking the observation taken by the author of [] regarding risk management as a starting point, there is this philosophical perspective that society’s relationship with risk can assume completely antagonistic values: in a positive connotation, risk is associated with courage, confrontation, and overcoming obstacles; and in a negative connotation, risk personifies that which must be completely avoided. Therefore, risk management is capable of balancing both perspectives, avoiding approaches that exceed both boldness and caution.
In [], the author states that quantifying risk is quantifying uncertainties and, making a brief retrospective, remembers Huygens, who introduced the concept of “mathematical expectation”, in 1656: “the estimated value of the damage is reduced, depending on the degree of uncertainty, by multiplying it by the respective probability of occurrence”. After Huygens, Moivre [] summarized in his book “De Mensura Sortis”: “The measure of the risk of losing a sum is the product of the amount put at stake by the probability of loss” [].
From these first mathematical concepts, the equations so expressly used as a basis for risk analysis resulted as we know them today, as follows:
Risk = probability of occurrence × estimated value of damage
Risk = uncertainties × consequences
Risk = probability × vulnerability
IPCC defined risk as the result of the interaction between hazard, exposure, and vulnerability, offering a comprehensive view that captures the physical, social, and environmental dimensions of climate-related threats [].
Risk = hazard × exposure × vulnerability
However, while the IPCC’s approach is better suited for policy and adaptation planning, the simplified Formula (3) can serve as an alternative in quantitative modeling. For the IPCC, hazard is not simply a “probability”, but rather the occurrence or tendency of extreme events. In general, the simplified approach often merges exposure into the concept of vulnerability, potentially overlooking important distinctions. Nonetheless, both approaches may yield similar results in certain cases, especially when exposure is implicitly accounted for, as in Praia da Vitória; however, they can also lead to different conclusions depending on how each component is defined and measured. In this context, the study of Praia da Vitória within the LIFE-GARACHICO project follows the same methodology applied in Garachico, the project’s pilot locality [,].
Integrating the mathematical concept of risk with the development of Geographic Information Systems (GIS) technologies made it possible to perform spatial and quantitative vulnerability analyses, based on multicriteria and hierarchical analyses (AHP—analytic hierarchy process). The author of [] introduced the concept of “map algebra” in his book “Geographic Information System and Cartographic Modeling” []. The authors of [] proposed the integration of physical and anthropic environmental conditions, in a GIS environment, to characterize the environmental vulnerability of a region, assigning scores and weights to the classes of mapped variables, thus differentiating the different levels of vulnerability of a region []. In [], the author presented an AHP + GIS methodology to quantify and spatialize the risk of overtopping occurrence in Praia da Vitória.
Following the methodology of [], the risk level (Table 1) was defined by multiplying the probability level by the level of consequences (vulnerability), which can be classified as insignificant (pale red, 1–3), acceptable (salmon, 4–10), undesirable (red, 15–30), or unacceptable (dark red, 40–125).

Table 1.
Risk levels of hazardous overtopping/flooding events (adapted from []). Risk is classified as insignificant (pale red, 1–3), acceptable (salmon, 4–10), undesirable (red, 15–30), or unacceptable (dark red, 40–125).
Note that the scale adopted for the levels of consequences (vulnerability) is not linear, unlike the one adopted for the probability levels. The author of [] explains that “it is important to distinguish between an event with a high probability of occurrence, but with low consequences, from an event with a low probability of occurrence, but with very high consequences”, which justifies his choice for applying different scales for the variables.
In the following sub-sections, the methodologies used to calculate each of the risk variables, probability (Section 2.1.1) and vulnerability (Section 2.1.2), will be presented.
2.1.1. Probability of Coastal Overtopping Events
The estimation of the probability of occurring coastal overtopping events followed the methodologies of [], which describe a downscaling process (Figure 2) of oceanographic data from a regional to a local scale.
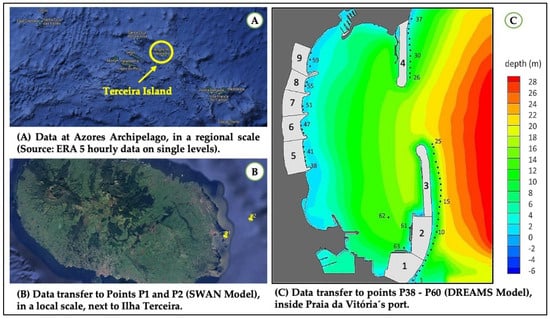
Figure 2.
Downscaling process of oceanographic data. (A) Regional-scale, Azores Archipelago, where data was obtained from ERA5; the yellow circle indicates the location of Terceira Island within the archipelago. (B) Points P1 and P2 (yellow markers), located near Terceira Island to where the data was transferred using the SWAN wave model. (C) Location of points P38 to P60 inside Praia da Vitória’s port, whose wave characteristics were obtained using the DREAMS model; these correspond to coastal zones 5 to 9, as indicated on the depth map (depths in meters shown by the color scale).
ERA5 hourly reanalysis data on single levels (such as wave period, wave direction, and significant wave height), from the European Centre for Medium-Range Weather Forecasts (ECMWF), were used to reunite more than 35 years of oceanographic data—from 1 January 1989 at 00 h, to 1 April 2024 at 08 h, on a regional scale, with time spacing of 1 h.
Those data were then downscaled with the SWAN model [] to points in the vicinity of Praia da Vitória’s port (1 and 2). Finally, the results from SWAN allowed a further transfer into the port’s basin using the DREAMS model [], namely, to points P1 to P60 all over the bay. Finally, the neuronal network tool NN_Overtopping2 [] was applied to each point (P38 to P60), to evaluate, together with cross-section characteristics of the coastal structures, an estimate of the mean overtopping discharge, q (l/s/m), at each cross-section.
Time series of wave characteristics and corresponding mean overtopping discharge were obtained over a 35-year period, from 1 January 1989, at 00 h to 1 April 2024, at 08 h, resulting in a dataset of over 308,000 hourly records. The graph below (Figure 3) presents the frequency of overtopping events over time at point P43 in zone 5, highlighting temporal trends in occurrence.
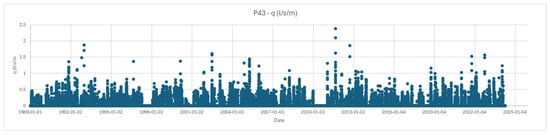
Figure 3.
Overtopping discharges (q, in l/s/m) over time at point P43 (zone 5). Discharges exceeding 0.01 l/s/m may be harmful to people and vehicles, while discharges above 0.2 l/s/m can affect building structures. Thresholds correspond to warning level 1.
The probability of coastal overtopping events was calculated based on the number of overtopping occurrences, with discharges exceeding the minimum threshold for warning level 1 at points near the seafront zones 5 to 9 (P38 to P60), expressed as a percentage.
Although the dataset covers a period of approximately 35 years, which is slightly above the minimum recommended by the World Meteorological Organization for estimating climate extremes (typically 30 years; see []), we acknowledge that this limitation introduces uncertainties, particularly in the estimation of low-probability events, such as those with a 1% annual exceedance probability. However, the purpose of this analysis is to support HIDRALERTA [,,], a short-term forecasting system operating on a 72-h time scale. In this context, the focus is on anticipating hazardous overtopping events rather than on long-term climate projections. Therefore, the use of a high-resolution dataset (over 308,000 hourly records) enhances statistical robustness for the intended operational use, and the slight shortfall in the temporal extent may not significantly affect the system’s performance. Nonetheless, as noted by the authors of [], extreme values derived from shorter records may deviate from long-term reality, and caution is advised when using such estimates to inform broader planning decisions. Alternative methods that better accommodate limited datasets may also be considered in future studies (e.g., []).
The probability classification is provided in Table 2 and includes the following categories: improbable (green, <1%), remote (light green, 1–10%), occasional (light yellow, 10–25%), probable (orange, 25–50%), and frequent (red, >50%).
Table 2.
Probability Levels classification (adapted from Poseiro []): improbable (green, <1%), remote (light green, 1–10%), occasional (light yellow, 10–25%), probable (orange, 25–50%), and frequent (red, >50%).
2.1.2. Vulnerability Assessment
The methodology developed for the analysis of exposure and vulnerability applied in the LIFE-GARACHICO Project’s study locations [] was based on the conceptual framework developed by the IPCC (2012) for the analysis of risks associated with climate change and on the methodology developed in the Coastal Risk Analysis Report on Climate Change in the Canary Islands [], as part of the PIMA ADAPTA COSTAS project.
In Praia da Vitória, the vulnerability was analyzed based on information on population (Factor P), land use (Factor L), buildings (Factor B), cultural (Factor C) and natural (Factor N) heritage, and altimetry (Factor A). Data were obtained from existing spatial data sources, with no field data collected. The information inventoried for all vulnerability factors by GIS methodology was transformed into polygonal shapefiles (.shp) within the boundaries of the study area.
The authors of [] proposed a scale from 0 to 1 to classify vulnerability, where 0 is an element that is not vulnerable (when there is no damage) and 1 is a vulnerable element (when total loss occurs). With the vulnerability indices established for each of the attributes of the analyzed layers (for each of the vulnerability factors), the shapefile (.shp) should be converted into a raster file (.tif), in a vector-to-raster conversion process, assigning classes to the vulnerability (very low, low, medium, high, or very high).
After obtaining the individual vulnerability indices for each of the factors (population, buildings, land use, altimetry, and cultural and natural heritage), the vulnerability index (V) was calculated through a multicriteria assessment that performs a weighted linear sum of all the values assigned. The weights applied were 25% for the population (Factor P), 25% for buildings (Factor B), 10% for land use and occupation (Factor L), 5% for natural heritage (Factor N), 10% for cultural heritage (Factor C), and 25% for altimetry (Factor A) [], as follows:
V = (A × 0.25) + (B × 0.25) + (C × 0.10) + (L × 0.10) + (N × 0.05) + (P × 0.25),
(adapted from []).
The vulnerability classes, as defined in the methodology of [], were reclassified according to the methodology in [] to estimate risk levels. The vulnerability classes from both methods are compared in Table 3, which shows the following reclassification: very low/insignificant (pale red, <0.2/1), low/marginal (salmon, 0.2–0.4/2), medium/relevant (light red, 0.4–0.6/5), high/serious (red, 0.6–0.8/10), and very high/catastrophic (dark red, 0.8–1.0/25).
Table 3.
Vulnerability classification (adapted from [,]). The classification compares the vulnerability levels proposed by the authors of [] and the corresponding consequence levels according to the author of []. Color gradients represent increasing severity—from light shades (very low/insignificant) to dark red (very high/catastrophic)—highlighting the alignment between vulnerability scores and their associated impact levels.
The methodology for the vulnerability assessment in Praia da Vitória, within the scope of the LIFE-GARACHICO Project, was detailly reported in a report from the Portuguese Civil Engineering National Laboratory (LNEC—Laboratório Nacional de Engenharia Civil) [].
2.2. Public Risk Perception
The principle of public participation is also an important recommendation in EM. It was brought to life as a corner-stone principle with the creation of the US Environmental Protection Agency (EPA), in 1970 [], and it was included as one of the 27 universal principles in the Rio Declaration document, elaborated at the Rio Summit in 1992 as follows:
“Environmental issues are best handled with participation of all concerned citizens, at the relevant level. At the national level, each individual shall have appropriate access to information concerning the environment that is held by public authorities, including information on hazardous materials and activities in their communities, and the opportunity to participate in decision-making processes. States shall facilitate and encourage public awareness and participation by making information widely available. Effective access to judicial and administrative proceedings, including redress and remedy, shall be provided” [].
To correspond to that principle, surveys on coastal flooding risk perception were developed for the LIFE-GARACHICO Project []. The methodology for the development and conduction of the surveys was then adapted to Praia da Vitória [,,]. The main goals of the surveys were to assess the population’s awareness and understanding of their exposure, as well as their ability to identify the hazard and its consequences, but also to measure their trust toward the public authorities’ risk management in the context of coastal flooding. In addition, the surveys were crucial to identify the population’s management preferences concerning coastal overtopping risk.
Based on [], the surveys conducted in Praia da Vitória were structured drowning a timeline around coastal flooding. They were organized into 73 questions divided into 4 thematic areas: (1) sociodemographic information; (2) previous experiences with coastal flooding; (3) coastal flooding in daily life; and (4) resilience to cope with future flooding [,,].
The surveys conducted in Praia da Vitória were live interviews and online questionnaires. The authors of [] explain that a survey by interview (live approach) is directly influenced by the interviewer, producing more detailed and descriptive data, which is important in qualitative studies. Also, according to these authors, the survey by questionnaire (online approach) allows them to reach a greater range of representativeness, since the interviewees usually answer the inquiry as volunteers. Therefore, the choice for conducting both survey modalities in Praia da Vitória was intentional: the live approach was important for deeply understanding the population’s feelings, allowing researchers to have their first impressions so that they could make any necessary adjustments to the structure/method; and the online approach enabled the team to obtain greater representativeness.
In total, 120 answers were obtained, corresponding to a representativeness of 6% of the local population and a margin of error of 8.67% [,,].
A quantitative analysis (QA) was performed to estimate a simple statistical/percentual for each question, as follows:
where (V) is the number of votes and (SS) is the total sample size.
QA = (V/SS) × 100%,
Complementarily, an importance–performance analysis (IPA) revealed the community’s preferences concerning the preventive measures to be implemented. The importance–performance matrix, originally proposed in [], is a tool initially designed to support the development of effective marketing. However, the authors of [] applied this tool to promote sustainable coastal development on tourist beaches in the Algarve (Portugal), to identify the preferable actions for improving beach management. Following those last authors, in Praia da Vitória, the matrix was used to synthesize public opinion obtained with the questionnaires on the coastal overtopping risk perception. The results shown in the importance–performance matrix especially leads to more democratic coastal risk management, as environmental public authorities considered the community preferences in the decision-making processes of managing the coastal overtopping risk [,,].
2.3. Response Protocol for Coastal Overtopping Events
With the risk assessment and the study of the public risk perception completed, data collected from both studies were used to support the development of a protocol matrix for responding to coastal overtopping. The response protocol to coastal overtopping was written collaboratively with the municipal civil protection agents.
This protocol matrix then counted with the knowledge about the probability of coastal overtopping occurrence at each zone of the seafront, as well as the most vulnerable localities of the study area, indicating locations with a higher risk of coastal overtopping. The classification of the risk itself supported the type of approach which would be more adequate in terms of risk management (drastic mobilizations of public security agents do not fit into locations of insignificant to acceptable risk, for example). Also, the public perception assessment showed the population’s preferences about management measures to be implemented, and how different measures would affect their quality of life and their relationship with the sea.
For overtopping events, there are four warning levels (from 0 to 3, where 0 corresponds to no warning and 3 to the highest level of warning). The warning level evaluation is carried out by dividing the study area into zones. The zones are defined based on structural characteristics and the presence of exposed elements either on the crest or lee side of the structure (Figure 4A). Mean overtopping discharges are then compared against pre-established thresholds to determine the corresponding warning level (Figure 4C). The exposed elements considered include people and vehicles, ships, buildings, equipment, and port infrastructure. Each exposed element is represented by a symbol inside a warning triangle sign whose color changes according to the four warning levels defined above (green for level 0, yellow for level 1, orange for level 2, and red for level 3). An example of a register where some yellow warnings occurred is presented in Figure 4B.
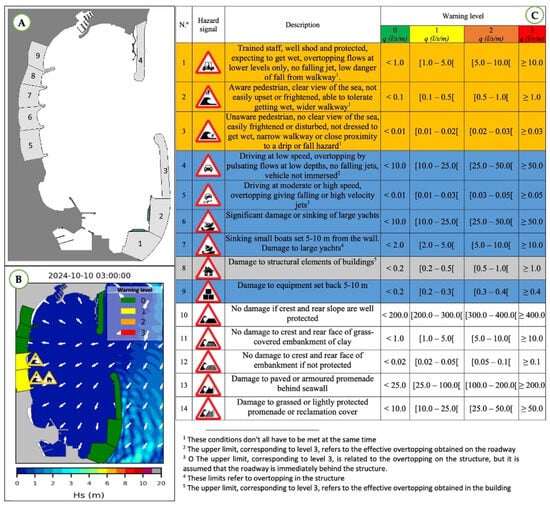
Figure 4.
(A) Zones where overtopping is estimated in Praia da Vitória; (B) HIDRALERTA register for a yellow warning level overtopping prediction in zones 5 and 6 (adapted from [,,]); and (C) the 14 types of hazards descriptive framework. The colors in the table lines represent different receptors: people (orange), vehicles, ships or equipment (blue), structure elements (grey), and maritime structure itself (white).
It is important to note that the warning levels are defined based on estimated mean overtopping discharges (q, in l/s/m), and not directly on wave or water level parameters (e.g., significant wave height, wave period, direction, or tidal level). This is because the system estimates specific parameters (in this case, overtopping discharges) to better assess the consequences associated with the oceanographic forcings. As each structure responds differently to the same oceanographic conditions, the overtopping discharge offers a more reliable and localized basis for risk assessment.
The response protocol to coastal overtopping includes the measures that should be taken in each seafront zone (zones 5 to 9, Figure 4A) for each alert level (yellow, orange, or red), for each one of the applicable exposed elements (people, vehicles, buildings, ships, and maritime structures). The response protocol matrix was implemented as a new module for the HIDRALERTA system.
2.4. HIDRALERTA: A Flood Forecasting and Warning System for Coastal and Port Areas
HIDRALERTA is a flood forecasting and warning system for coastal and port areas. It was developed for forecasting, warning, and the assessment of risks associated with overtopping and flooding in coastal and port areas, supported by measurements and forecasts of sea waves in these areas [,,].
It has been applied in Praia da Vitória since the development of the system [,], as an important tool for Portos dos Açores, SA, which were facing many disturbs with severe overtopping occurrences in zones 1 to 4, Figure 4A. Within the context of the LIFE-GARACHICO Project, the HIDRALERTA system in Praia da Vitória had its use extended to the municipality and the Municipal Civil Protection to support the coastal risk management at the seafront of Praia da Vitória (zones 5 to 9, Figure 4A).
The main goal of including the HIDRALERTA system as an important tool in this holistic approach to manage coastal overtopping risk—within the context of the LIFE-GARACHICO Project in Praia da Vitória—is to anticipate hazardous events, support emergency actions, and inform planning decisions that reduce risk exposure. The system operates based on 72 h forecasts of sea agitation, enabling municipal authorities to implement preventive risk management measures. To ensure its reliability, HIDRALERTA has undergone a multi-faceted validation process. This includes the following: (i) validation against wave buoy data; (ii) comparison with hindcast datasets; (iii) real-time feedback from local authorities (the Civil Protection of Praia da Vitória reports when the warnings are not compatible with what was observed) and project collaborators; (iv) physical model testing; (v) numerical model testing; and (vi) video-monitoring, although the latter is less developed. These methods collectively contribute to calibrating and verifying the system’s accuracy in predicting overtopping risks under varying oceanographic and structural conditions [,,].
3. Results
3.1. Coastal Overtopping Risk Assessment of the Seafront in Praia da Vitória
The “Coastal Overtopping Risk Map” of Praia da Vitória (Figure 5) is the result of the multiplication of the “Coastal Overtopping Probability Map” (Section 3.1.1) by the “Vulnerability Map” (Section 3.1.2) delimited by zones 5 to 9, from the coastline to the 20 meters contour line.
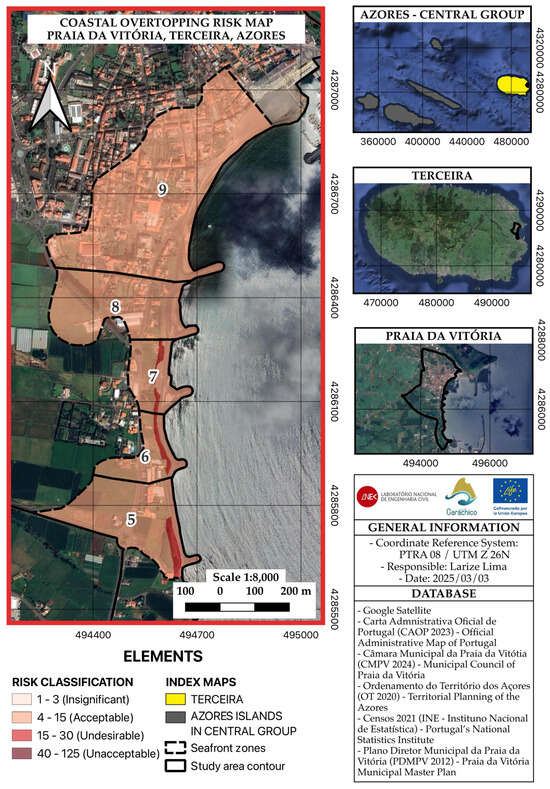
Figure 5.
Coastal Overtopping Risk Map of Praia da Vitória, Terceira, Azores.
The map indicates that the risk is mostly acceptable in Praia da Vitória, with some small areas of zones 5 to 7, where overtopping occurs more frequently, with undesirable risk. This is the result of the combination of a predominantly remote probability (Section 3.1.1) and a medium vulnerability (Section 3.1.2).
3.1.1. Coastal Overtopping Probability Assessment
The probability of coastal overtopping occurrence at each of zones 5 to 9, measured according to the methodology presented in Section 2.1.1, for the main hazard groups (people, vehicles, and buildings), is presented in Table 4. These probabilities differ among the groups because each type of hazard is associated with a distinct threshold of mean overtopping discharge (q, in l/s/m), as shown in Figure 4B. That is, the minimum discharge required to pose a risk varies depending on the exposed element: people are affected by lower discharge rates than vehicles, and buildings require higher discharge rates to be significantly impacted. Therefore, the overtopping time series was assessed separately for each hazard group based on its specific critical discharge threshold, resulting in different probabilities of occurrence.
Table 4.
Coastal Overtopping Probability for the main hazards’ groups, in zones 5 to 9. The color gradient follows the classification used in Figure 6: improbable (green, <1%), remote (light green, 1–10%).
In general, the probability of coastal overtopping occurrence in Praia da Vitória is mainly remote, especially the one capable of affecting people and vehicles, and it becomes mostly improbable when affecting buildings. Zone 9 has the lowest probability percentages, and zones 5 to 7 are the most affected ones explaining the undesirable risk classification within these zones.
The “Coastal Overtopping Probability Map” (Figure 6) is the result of the percentages shown in Table 4.
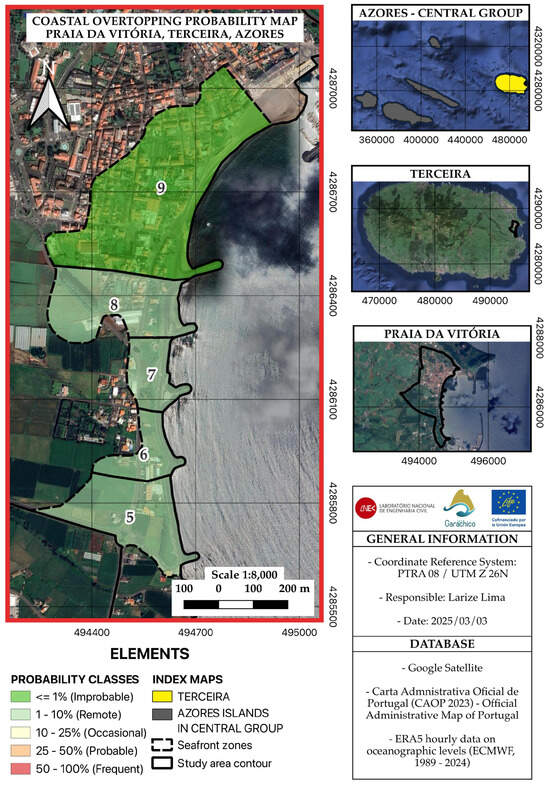
Figure 6.
Coastal Overtopping Probability Map of Praia da Vitória, Terceira, Azores.
3.1.2. Praia da Vitória Vulnerability Assessment
Remembering the methodology presented in Section 2.1.2, the total vulnerability (V) was calculated through a multicriteria assessment that performs a weighted linear sum, namely: 25% for the population (Factor P), 25% for buildings (Factor B), 10% for land use and occupation (Factor L), 5% for natural heritage (Factor N), 10% for cultural heritage (Factor C), and 25% for altimetry (Factor A) (adapted from []). This resulted in the “Vulnerability Map of Praia da Vitória” (Figure 7).
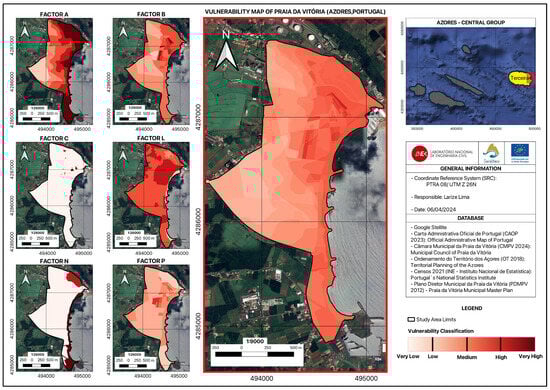
Figure 7.
Vulnerability Map of Praia da Vitória, Terceira, Azores.
The total vulnerability map of Praia da Vitória exposes an average vulnerability of 0.43 (medium vulnerability). The map histogram shows a higher rate of indices between 0.4 and 0.6, while indices between 0.3 and 0.4 occur more frequently (low vulnerability) (Figure 8).
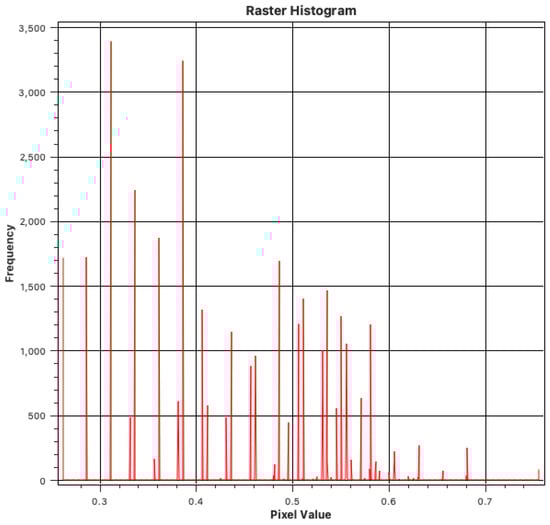
Figure 8.
Histogram of the Vulnerability Map of Praia da Vitória.
The zonal statistics of the Total Vulnerability Map of Praia da Vitória, for each altimetric zone of the study area, expresses a medium classification vulnerability index (0.54, from 0 to 10 m and 0.49, from 10 to 20 m) for the zones up to 20 m altitude (closer to the coast) (in italic in Table 5).
Table 5.
Classification of the average vulnerability index of Praia da Vitória for each altimetric zone. Characters in italic represent the zones up to 20 m altitude.
This information indicates that Praia da Vitória has a medium vulnerability classification, which is repeated in the coastal zone (with medium vulnerability rates slightly higher than the vulnerability in the entire study area).
3.2. Assessment of Public Risk Perception in Praia da Vitória
Some of the results of the assessment of public perception in Praia da Vitória are summarized in Figure 9.
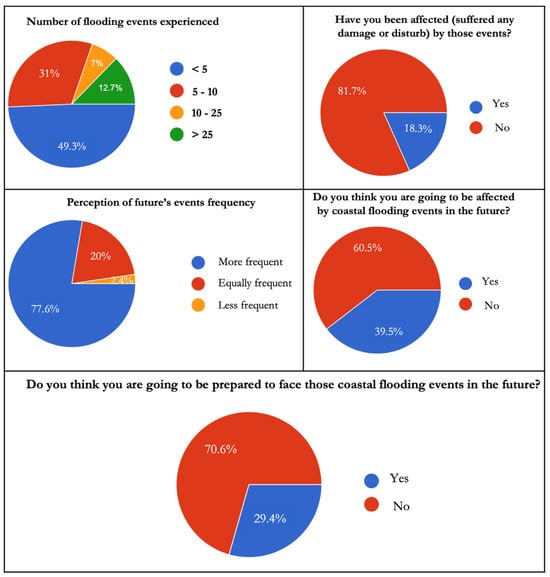
Figure 9.
Summary of the Coastal Overtopping Public Risk Perception of Praia da Vitória (adapted from [,,]).
There was a significant percentage of the interviewees who had experienced more than five overtopping events, indicating the recurrence of these events in this community’s daily life. Additionally, although the number of people affected by those events is not high, their perception is that the frequency is likely to increase in the future. Finally, although they believe they will not be affected by such events in the future, they do not feel prepared to face them [,,].
Another important piece of information extracted from the assessment was the population’s preferences concerning the coastal risk management measures that should be implemented (Figure 10).
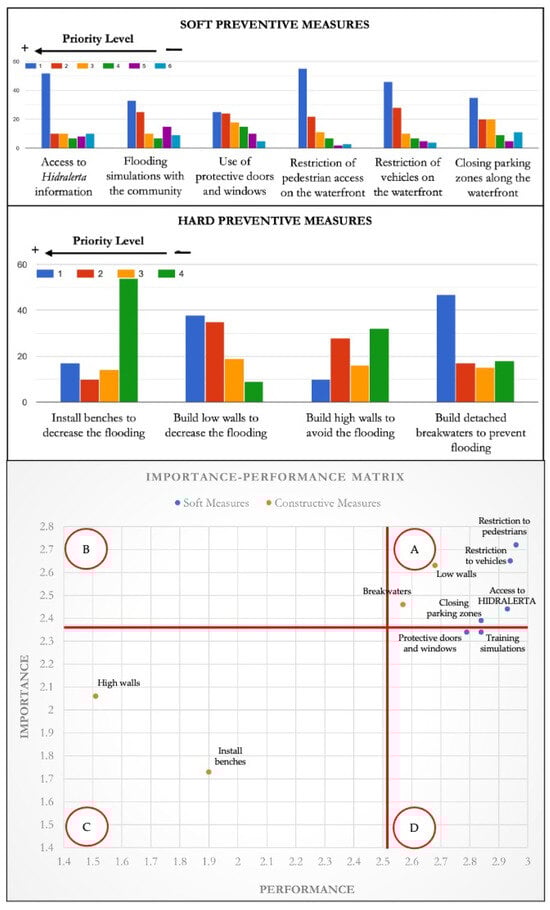
Figure 10.
Population Preferences and Importance-Performance Matrix for Coastal Risk Management Measures—Praia da Vitória, Terceira, Azores. The red lines at the matrix represent the average values of importance and performance indices, dividing the Importance-Performance Matrix into four quadrants: (A) appropriate actions (high importance and high performance); (B) urgent actions (high importance and low performance); (C) low-priority actions (low importance and low performance); and (D) overemphasized actions (low importance and high performance (adapted from [,,]).
In general, the population equally agrees with the implementation of both soft adaptive measures (in order of preference: restriction of pedestrian access; use of an early warning and prediction system; restriction of vehicle access; closure of parking areas along the coast; flood simulacrums with the population; and use of protective doors and window equipment) or constructive adaptive measures (in order of preference: construction of breakwaters; construction of low-level walls; installation of benches along the promenade; and construction of high-level walls) [,,].
The importance–performance analysis [,,] revealed that the community of Praia da Vitória ranked the measures as follows:
- Least priority preventive measures: installing benches and constructing high-level walls along the seafront;
- Least effective measures: flood training simulations with the population and using doors and windows protection;
- Most rejected measure: the construction of high-level walls because they restricted the sea view, which was unacceptable for most interviewees;
- Most appropriate measures: restricting the circulation of people and vehicles along the coast when necessary and using an early warning and prediction system for floods.
3.3. Development of a Response Protocol for Coastal Overtopping Events
The results presented in Section 3.1 and Section 3.2 substantiated the creation of the response protocol for coastal overtopping events (Table 6), later implemented into the HIDRALERTA system, to support Municipal Civil Protection when facing flooding occurrences.
Table 6.
Example of the response protocol for Zone 5, specifically addressing people’s exposure to coastal overtopping risk. The colors in the table represent the warning level color: green for level 0, yellow for level 1, orange for level 2, and red for level 3.
As coastal overtopping risk is mostly acceptable and the population considers soft measures such as restricting the circulation of people and vehicles along the coast and using an early warning and prediction system as their preferable measures, the response protocol follows a softer approach, with non-invasive and more cautious actions.
4. Conclusions
Together, the methodologies applied in each of the steps that compose this study formed a robust framework to support decision-making by municipal authorities. This approach enhanced the efficiency of coastal risk management while increasing public awareness and trust in municipal authorities and civil protection efforts. The holistic and adaptive nature of the strategy contributes to a flexible and sustainable model of managing coastal risk—particularly suited to contexts like Praia da Vitória, where the overtopping risk is considered acceptable to slightly undesirable and does not necessitate frequent emergency responses.
This coastal risk management framework, guided by the AEAM principle, guarantees the continuity of this project, which should follow census updates, changes in natural (oceanographic) conditions, scientific findings, and new technological advances, making coastal risk management as suitable as possible to the local reality.
Public participation also plays an important role in this framework. Seeking the public perception about how climate change can affect their lives and understanding the population’s needs and preferences to face coastal hazardous events, eases the decision-making process for the municipal agents and elevates the population’s social engagement, which ensures democratic risk governance and enhances the community resilience.
Technological tools such as the HIDRALERTA system provide more stability in risk management, reducing human mistake rates during the decision-making process, and avoiding economic, environmental, social, and cultural heritage losses.
Author Contributions
Conceptualization, investigation, resources, and data curation, L.L.; methodology, L.L., C.J.E.M.F., A.C.Z. and L.V.P.; HIDRALERTA software and validation, L.V.P., C.J.E.M.F. and A.C.Z.; formal analysis, L.L. and C.J.E.M.F.; writing—original draft preparation, L.L.; and writing—review and editing, C.J.E.M.F., A.C.Z. and L.V.P. All authors have read and agreed to the published version of the manuscript.
Funding
This research is partially funded (55%) by the EU LIFE Programme, through LIFE-GARACHICO Project—‘Coastal Flooding Adaptation to Climate Change through Flexible Strategies in Macaronesian Urban Areas’ (LIFE20 CCA/ES/001641, 2021–2026).
Data Availability Statement
The original contributions presented in this study are included in the article. Further inquiries can be directed to the corresponding author.
Acknowledgments
The authors gratefully acknowledge the City Hall of Praia da Vitória (Câmara Municipal da Praia da Vitória—CMPV) and the Civil Protection Agency of Praia da Vitória for their valuable support in the development of the response protocol for coastal overtopping events and for the dissemination of coastal flooding alerts through their official website. The authors also extend their appreciation to CMPV for providing administrative and technical assistance during the data collection campaigns. Acknowledgment is further due to the Azores Port Authority, the University of the Azores, and the Azores Environmental Observatory for their contributions to the development of the HIDRALERTA system. Finally, the authors express their sincere thanks to all members of the public who participated in the surveys.
Conflicts of Interest
The authors declare no conflicts of interest.
Abbreviations
The following abbreviations are used in this manuscript:
| CC | Climate Change |
| AEAM | Adaptive Environmental Assessment and Management |
| AMN | National Maritime Authority (Autoridade Marítima Nacional) |
| CMPV | City Hall of Praia da Vitória (Câmara Municipal da Praia da Vitória) |
| COP21 | United Nations 21st Conference of Parties |
| IPCC | International Panel for Climate Change |
| EM | Environmental Management |
| AR5 | IPCC Fifth Assessment Report |
| UN | United Nations |
References
- United Nations General Assembly. Report of the United Nations Conference on the Human Environment, Stockholm, 5–16 June 1972. UN. 1972. Available online: https://docs.un.org/en/A/CONF.48/14/Rev.1 (accessed on 14 May 2025).
- United Nations—UN. Paris Agreement (COP 21), December 2015. UN. 2015. Available online: https://unfccc.int/files/essential_background/convention/application/pdf/english_paris_agreement.pdf (accessed on 14 May 2025).
- Intergovernmental Panel on Climate Change—IPCC. Climate Change 2014: Impacts, Adaptation and Vulnerability. Contribution of Working Group II to the Fifth Assessment Report of the Intergovernmental Panel on Climate Change; Cambridge University Press: Cambridge, UK; IPCC: New York, NY, USA, 2014. [Google Scholar]
- Gouveia, J.V. Cap. 1: O território costeiro de Portugal Continental. In Manifestações de Riscos na Zona Costeira de Portugal Continental: As Capacidades de Antecipação (Prevenção) e de Resposta (Socorro), 1st ed.; RISCOS—Associação Portuguesa de Riscos, Prevenção e Segurança: Lousã, Portugal, 2022; Available online: https://www.riscos.pt/wp-content/uploads/2018/Outras_Pub/outros_livros/RZC/eBook_Riscos-Zona-Costeira.pdf (accessed on 14 May 2025). (In Portuguese)
- Intergovernmental Panel on Climate Change—IPCC. Climate Change 2023: Synthesis Report, Summary for Policymakers. Contribution of Working Groups I, II and III to the Sixth Assessment Report of the Intergovernmental Panel on Climate Change; Lee, H., Romero, J., Eds.; IPCC: Geneva, Switzerland, 2023. [Google Scholar]
- López, A.; Dorta, P.; Romero, C.; Díaz, J. Movimientos de Ladera en Canarias. El Caso del Macizo de Anaga en el Temporal de Febrero de 2010. Análisis Espacial y Representación Geográfica: Innovación y Aplicación; Universidad de Zaragoza: Zaragoza, Spain, 2015; pp. 1725–1734. (In Spanish) [Google Scholar]
- Holling, C.S. Adaptive Environmental Assessment and Management, revised edition, 1980; Wiley: New York, NY, USA, 1978. [Google Scholar]
- Barrow, C. Environmental Management for Sustainable Development, 2nd ed.; Routledge: London, UK, 2006. [Google Scholar]
- Instituto Nacional de Estatística—INE. Censos 2021. XVI Recenseamento Geral da População. VI Recenseamento Geral da Habitação: Resultados Definitivos; INE: Lisboa, Portugal, 2022; ISSN 0872-6493. ISBN 978-989-25-0619-7. Available online: https://www.ine.pt/xurl/pub/65586079 (accessed on 14 May 2025). (In Portuguese)
- Almeida, A.B. Risco e Gestão do Risco. Questões Filosóficas Subjacentes ao Modelo Técnico Conceptual. Territorium 2011, 18, 23–31. Available online: https://impactum-journals.uc.pt/territorium/article/view/1647-7723_18_2/2351 (accessed on 30 April 2025). (In Portuguese). [CrossRef] [PubMed][Green Version]
- Moivre, A.D. De Mensura Sortis, seu, de Probabilitate Eventuum in Ludis a Casu Fortuito Pendentibus. Philos. Trans. R. Soc. Lond. 1711, 27, 213–264. Available online: https://royalsocietypublishing.org/doi/pdf/10.1098/rstl.1710.0018 (accessed on 14 May 2025). (In Latin).
- GRAFCAN. Análisis de Riesgos Costeros Ante el Cambio Climático en las Islas Canarias; Proyecto PIMA Adapta Costas; GRAFCAN: Santa Cruz de Tenerife, Spain, 2021. (In Spanish) [Google Scholar]
- Alpeñes, C.B.; González, J.C.; Lamo, G.H. Metodologías Para la Caracterización Cualitativa de la Exposición y Vulnerabilidad Derivada del Cambio Climático por Fenómenos de Inundación Costera y Para el Desarrollo de una Base de Datos y un Visor gis Web; A.1 Acción. LIFE20 CCA/ES/001641; LIFE Garachico: Santa Cruz de Tenerife, Spain, 2023. (In Spanish) [Google Scholar]
- Tomlin, D. Geographic Information Systems and Cartographic Modeling; Prentice Hall: New York, NY, USA, 1990. [Google Scholar]
- Cordeiro, J.P.; Barbosa, C.C.F.; Camara, G. Álgebra de Campos e Objetos. Análise Espacial de Dados Geográficos. 2004. Available online: https://www.faed.udesc.br/arquivos/id_submenu/1414/cap8_algebra.pdf (accessed on 30 April 2025). (In Portuguese).
- Nascimento, D.M.C.; Dominguez, J.M.L. Avaliação da vulnerabilidade ambiental como instrumento de gestão costeira nos municípios de Belmonte e Canavieiras, Bahia. Rev. Bras. Geociências 2009, 39, 395–408. (In Portuguese) [Google Scholar] [CrossRef]
- Santos, M.F.S. Geoprocessamento Aplicado ao Estudo da Vulnerabilidade Ambiental da Serra da Calçada-MG. 2014. Available online: https://repositorio.ufmg.br/bitstream/1843/IGCM-9UXP66/1/m_rcia_fel_cia.pdf (accessed on 30 April 2025). (In Portuguese).
- Poseiro, P. Forecast and Early Warning System for Wave Overtopping and Flooding in Coastal and Port Areas: Development of a Model and Risk Assessment; Universidade de Lisboa: Lisboa, Portugal, 2019. [Google Scholar]
- Fortes, C. Nonlinear Wave Transformations in Harbors. A Finite Element Analysis. Ph.D. Thesis, Mechanical Engineering, IST, Lisbon, Portugal, 2002; 457p. [Google Scholar]
- Coeveld, E.M.; van Gent, M.R.A.; Pozueta, B. Neural Network: Manual NN_OVERTOPPING2; CLASH WP8; Deltares: Delft, The Netherlands, 2005. [Google Scholar]
- Bender, J.; Bürger, G.; Sillmann, J.; Fischer, E.M. Extreme value estimation under short time series. Hydrol. Earth Syst. Sci. 2024, 28, 2969–2985. [Google Scholar] [CrossRef]
- Fortes, C.; Reis, M.T.; Poseiro, P. O projeto HIDRALERTA: Sistema de previsão e alerta de galgamentos em zonas costeiras e portuárias. In Proceedings of the 8as Jornadas Portuguesas de Engenharia Costeira e Portuária, AIPCN/PIANC, Lisboa, Portugal, 10–11 October 2013; LNEC: Lisbon, Portugal (In Portuguese). [Google Scholar]
- Fortes, C.J.E.M.; Reis, M.T.; Poseiro, P.; Santos, J.A.; Garcia, T.; Capitão, R.; Pinheiro, L.V.; Reis, R.; Craveiro, J.; Lourenço, I.; et al. Ferramenta de apoio à gestão costeira e portuária: O sistema HIDRALERTA. In Proceedings of the VIII Congresso Sobre Planeamento e Gestão das Zonas Costeiras dos Países de Expressão Portuguesa e 1a Conferencia Internacional “Turismo em Zonas Costeiras—Oportunidades e Desafios”, Aveiro, Portugal, 14–16 October 2015; ISBN 978-989-8509-12-3. (In Portuguese). [Google Scholar]
- Bürger, G.; Sillmann, J.; van Aalst, M. A global database of climate extremes indicators. Clim. Change 2023, 176, 62. [Google Scholar] [CrossRef]
- Lima, L.; Fortes, C.J.E.M.; Zózimo, A.C.; Pinheiro, L.V. Avaliação da Vulnerabilidade da Praia da Vitória (Terceira, Açores—Portugal) por Metodologia SIG e Análise da Exposição ao Risco de Inundação Costeira; Report 021/2025—DHA/NPE; Laboratório Nacional de Engenharia Civil: Lisboa, Portugal, 2025. (In Portuguese) [Google Scholar]
- United Nations—UN. Rio Declaration on Environment and Development. 1992. Available online: https://docs.un.org/en/A/CONF.151/26/Rev.1(vol.I) (accessed on 30 April 2025).
- Gutiérrez-Barroso, J.; De la Cruz-Modino, R. Informe Sobre la Percepción del Riesgo por Inundación en el Sitio Piloto (Garachico); A.2 Acción Report. LIFE20 CCA/ES/001641-LIFE; LIFE Garachico: Santa Cruz de Tenerife, Spain, 2023. (In Spanish) [Google Scholar]
- Lima, L.; Fortes, C.J.E.M.; Zózimo, A.C.; Pinheiro, L. LIFE-GARACHICO: Study of the Overtopping Risk Perception in Praia da Vitória, Terceira, Azores; Report 259/2024—DHA/NPE; Laboratório Nacional de Engenharia Civil: Lisboa, Portugal, 2024. [Google Scholar]
- Lima, L.; Fortes, C.; Zózimo, A.C.; Pinheiro, L.; Cruz-Modino, R. Risk perception of coastal flooding in Praia da Vitória, Azores. In Riscos, Proteção Civil e Cultura de Segurança: Discursos e Práticas no Portugal Democrático (Série Estudos Cindínicos); Fernandes, J.L., Castro, F.V., Vieira, A., Nunes (Coords), A., Eds.; Chapter 13; RISCOS—Associação Portuguesa de Riscos, Prevenção e Segurança: Coimbra, Portugal, 2025; Volume 15, pp. 263–279. ISBN 978-989-9053-27-4. [Google Scholar] [CrossRef]
- Lima, L.; Fortes, C.; Zózimo, A.C.; Pinheiro, L.; Cruz-Modino, R. Are urban coastal localities in Macaronesia aware of their exposure to coastal flooding? In Riscos, Proteção Civil e Cultura de Segurança: Discursos e Práticas no Portugal Democrático (Série Estudos Cindínicos); Fernandes, J.L., Castro, F.V., Vieira, A., Nunes (Coords), A., Eds.; Chapter 14; RISCOS—Associação Portuguesa de Riscos, Prevenção e Segurança: Coimbra, Portugal, 2025; Volume 15, pp. 281–300. ISBN 978-989-9053-27-4. [Google Scholar] [CrossRef]
- Batista, B.; Rodrigues, D.; Moreira, E.; Silva, F. Técnicas de recolha de dados em investigação: Inquirir por questionário e/ou inquirir por entrevista. Reflexões Torno Metodol. Investig. Recolha Dados 2021, 2, 13–36. Available online: https://ria.ua.pt/bitstream/10773/30772/3/Metodologias%20investigacao_Vol2_Digital.pdf (accessed on 2 April 2025). (In Portuguese).
- Martilla, J.; James, J. Importance-Performance Analysis. J. Mark. 1977, 41, 77–79. Available online: https://slunik.slu.se/kursfiler/FÖ0349/10294.1314/Martilla_James_1977.pdf (accessed on 2 April 2025). [CrossRef]
- Lukoseviciute, G.; Panagopoulos, T. Management priorities from tourists’ perspectives and beach quality assessment as tools to support sustainable coastal tourism. Ocean. Coast. Manag. 2021, 208, 105646. [Google Scholar] [CrossRef]
- Poseiro, P. HIDRALERTA: O sistema e as ferramentas de validação. In Proceedings of the 9as Jornadas Portuguesas de Engenharia Costeira e Portuária, PIANC Portugal, Lisboa, Portugal, 23–24 November 2017; LNEC: Lisboa, Portugal (In Portuguese). [Google Scholar]
- Zózimo, A.C.; Pinheiro, L.; Santos, M.I.; Fortes, C.J.E.M. Aplicação e validação do sistema HIDRALERTA em situações de tempestade. Territorium 2021, 28, 145–167. [Google Scholar] [CrossRef] [PubMed]
- Zózimo, A.C.; Fortes, C.J.E.M.; Santos, J.A.; Pinheiro, L.; Lemos, R.; Capitão, R.; Fonseca, A.; Roque, D.; Taborda, R.; Silva, A.; et al. Projeto TO-SEALERT: Desenvolvimentos recentes. In Proceedings of the 10as Jornadas de Engenharia Costeira e Portuária, Sines, Portugal, 7–8 April 2022. (In Portuguese). [Google Scholar]
Disclaimer/Publisher’s Note: The statements, opinions and data contained in all publications are solely those of the individual author(s) and contributor(s) and not of MDPI and/or the editor(s). MDPI and/or the editor(s) disclaim responsibility for any injury to people or property resulting from any ideas, methods, instructions or products referred to in the content. |
© 2025 by the authors. Licensee MDPI, Basel, Switzerland. This article is an open access article distributed under the terms and conditions of the Creative Commons Attribution (CC BY) license (https://creativecommons.org/licenses/by/4.0/).