Article

V-STAR: A Cloud-Based Tool for Satellite Detection and Mapping of Volcanic Thermal Anomalies

by
Simona Cariello
1,2,*,
Arianna Beatrice Malaguti
2,
Claudia Corradino
2 and
Ciro Del Negro
2
1
Department of Electrical Electronics and Computer Engineering, University of Catania, 95125 Catania, Italy
2
Istituto Nazionale di Geofisica e Vulcanologia, Sezione di Catania, Osservatorio Etneo, 95125 Catania, Italy
*
Author to whom correspondence should be addressed.
GeoHazards 2025, 6(2), 24; https://doi.org/10.3390/geohazards6020024
Submission received: 28 March 2025 / Revised: 21 May 2025 / Accepted: 22 May 2025 / Published: 27 May 2025

Abstract

:
In recent years, numerous satellite-based systems have been developed to monitor and study volcanic activity from space. This progress reflects the growing demand for accurate and timely monitoring to reduce volcanic risk. Observing volcanoes from a satellite perspective provides key advantages, enabling continuous data acquisition and near-real-time assessment of volcanic activity. Multispectral sensors operating across various regions of the electromagnetic spectrum can detect thermal anomalies associated with lava flows, pyroclastic flows, ash plumes, and volcanic gases. Traditional hotspot detection techniques based on fixed thresholds often miss subtle anomalies on a global scale. In contrast, advanced machine learning algorithms offer a data-driven alternative. We designed and implemented the V-STAR application (Volcanic Satellite Thermal Anomalies Recognition) on Google Earth Engine (GEE) to leverage cloud computing for processing large geospatial datasets in real time. It employs supervised machine learning, specifically Random Forests, to adapt to evolving volcanic conditions. This enhances the accuracy and responsiveness of volcanic monitoring, offering valuable insights into potential eruptive behavior. Here, we present V-STAR as a robust and accessible tool that integrates satellite data and advanced analytics. Through its intuitive interface, V-STAR provides a comprehensive visualization of key volcanic features. The resulting analyses reveal hidden patterns in thermal data, contributing to improved disaster risk reduction strategies associated with volcanic hazards.
Keywords:
satellite; MSI; GEE; volcanoes

1. Introduction

Monitoring volcanic activity is a demanding scientific and operational challenge due to the inherently unpredictable nature of eruptions and the logistical complexity of maintaining ground-based instrumentation in remote and hazardous areas [1,2,3]. Eruptions can occur with little or no warning, limiting the effectiveness of in situ systems that require timely and continuous data acquisition. In many cases, the geographic isolation of volcanoes complicates the installation and maintenance of ground-based sensors, rendering traditional networks insufficient to ensure comprehensive surveillance. These challenges emphasize the need for robust, adaptive, and scalable systems that integrate terrestrial monitoring with satellite-based technologies. Over the past two decades, satellite remote sensing has become an essential component of volcanic hazard monitoring, offering wide spatial coverage, frequent revisit times, and the capability to acquire multi-sensor data in near-real time. Satellite platforms equipped with multispectral and thermal infrared sensors provide key information on volcanic processes by detecting variations in radiance associated with eruptive phenomena. These include lava flows, pyroclastic flows, ash plumes, and volcanic gas emissions [4,5,6,7,8,9,10,11]. By continuously observing active or potentially active volcanoes, satellites allow for early detection of eruptive unrest and monitoring of ongoing activity, even in inaccessible regions [5,6,7,8]. The detection of volcanic thermal anomalies using remote sensing relies on variations in spectral signatures across different bands of the electromagnetic spectrum. Sensors such as the Sentinel-2 Multispectral Instrument (MSI) acquire data in the visible (VIS), near-infrared (NIR), and shortwave infrared (SWIR) regions, enabling the identification of high-temperature volcanic features [9]. Volcanic thermal anomalies originate from diverse eruptive products. Lava flows, which can remain hot for days or weeks after emplacement, produce distinct thermal signals that evolve as they cool. Pyroclastic flows, consisting of high-temperature gas and fragmented rock, generate strong and transient thermal emissions during their rapid downslope propagation [12]. Volcanic ash clouds and plumes, rich in aerosols and gas-phase species, alter the Earth’s radiative balance and may produce surface-level or atmospheric thermal anomalies [13]. These thermal signatures are particularly useful for detecting precursory activity, such as intracrateric heating, dome formation, fresh lava effusion, or increased degassing, which may precede explosive eruptions [14,15].
In addition to raw observational capacity, recent advances in data processing have significantly enhanced our ability to interpret satellite observations. The integration of cloud computing technologies into Earth observation workflows has transformed how large datasets are processed and analyzed [16,17]. Instead of relying on local computing infrastructure and downloading massive volumes of imagery, platforms such as Google Earth Engine (GEE) offer server-side processing, high-performance computing, and direct access to petabyte-scale satellite archives [18,19,20]. These capabilities are critical for global monitoring applications, where near-real-time analysis and high spatial resolution are required.
Thermal anomaly detection typically involves identifying regions that exhibit significant deviations in temperature compared to a reference background. Conventional approaches rely on fixed statistical thresholds or heuristic decision rules to define hotspots. While such techniques are computationally efficient and suitable for identifying strong signals, they often fail to detect subtle or emerging anomalies, especially in heterogeneous environments or under variable atmospheric conditions [21,22,23,24,25]. Fixed-threshold algorithms are inherently limited by their inability to adapt to local variability in spectral signatures, leading to false negatives in cases of low-intensity activity and to false positives in the presence of clouds, snow, or reflective surfaces.
To overcome these limitations, data-driven approaches have been increasingly adopted in geoscience and remote sensing applications [26,27,28]. These include supervised and unsupervised machine learning (ML) models, such as Random Forests, Support Vector Machines, and Deep Neural Networks, which can learn complex relationships between spectral features and volcanic phenomena. By leveraging large training datasets and learning from labeled examples, ML algorithms can generalize to unseen data and detect nonlinear patterns that are difficult to capture using rule-based systems [13,29,30,31]. For instance, convolutional neural networks have been successfully applied to detect volcanic ash clouds from multispectral imagery, while Random Forest models have been used to map recent lava flows and identify thermal anomalies in Sentinel-2 MSI data [26,30,31].
The “data-driven approach” has emerged as a powerful alternative to traditional thresholding methods in volcanic monitoring. Rather than relying on static criteria, ML-based models adapt dynamically to the evolving spectral characteristics of volcanic surfaces during the training phase, learning from both historical and real-time data. This flexibility enables the detection of low-intensity or partially obscured anomalies and facilitates continuous improvement of predictive performance as new data are incorporated into the system [32,33,34]. For example, the presence of background elements, such as snow, vegetation, or cloud cover, can be more effectively managed by models trained to recognize their distinct spectral signatures. As a result, data-driven approaches improve both the sensitivity and specificity of volcanic thermal monitoring systems.
Despite these advances, many operational platforms still rely on a priori fixed-threshold methods. Systems such as MIROVA (Middle InfraRed Observation of Volcanic Activity) [35], MOUNTS (Monitoring Unrest from Space) [36], and the NHI Tool [37] have played an important role in global volcanic surveillance but often use static algorithms that do not fully exploit the potential of adaptive or intelligent processing. MIROVA, for example, calculates MIR radiance from MODIS and VIIRS data to detect thermal anomalies, while MOUNTS applies statistical methods to track changes in activity. Although effective in many cases, these systems may misclassify subtle anomalies or fail to detect them altogether in complex environments. To address this gap, we introduce V-STAR (Volcanic Satellite Thermal Anomalies Recognition), a next-generation volcanic monitoring tool developed within the Google Earth Engine platform. V-STAR is designed to exploit the advantages of cloud computing and artificial intelligence by combining high-resolution Sentinel-2 imagery with a supervised Random Forest classifier trained to detect volcanic thermal anomalies [38]. This model is specifically tailored to recognize both high- and low-intensity anomalies, even under challenging observational conditions. By using spectral data from visible to shortwave infrared bands, V-STAR can differentiate between thermal signatures of active lava, cooling deposits, and non-volcanic background features.
The use of Random Forests in this context provides a robust and interpretable framework for hotspot classification. Unlike single decision trees, which are prone to overfitting, Random Forests aggregate multiple decision trees trained on bootstrapped samples and random feature subsets, improving generalization and reducing variance. The algorithm learns decision rules based on labeled pixels representing thermal anomalies and backgrounds of different conditions and applies these rules to classify new observations in real time. Additionally, the model’s performance is evaluated using standard metrics, such as accuracy, precision, and recall, ensuring that its predictions are quantitatively validated. V-STAR also integrates an intuitive and user-friendly interface that facilitates access to analytical results. Users can visualize time series of thermal anomalies, download data products in standard formats (e.g., GeoTIFF, CSV, XML), and explore multi-temporal Sentinel-2 images for selected volcanoes. The application enables analysis at different spatial and temporal scales, supporting both near-real-time alerts and retrospective studies of eruptive sequences. By automating the detection and mapping of volcanic thermal activity, V-STAR supports early warning systems, risk assessments, and long-term monitoring programs.
In summary, the integration of high-resolution satellite data, machine learning, and cloud-based analytics enables a new level of precision and adaptability in volcanic thermal monitoring. V-STAR addresses the limitations of conventional systems by providing a flexible, scalable, and scientifically grounded tool for identifying and analyzing thermal anomalies. Herein, we describe the methodology, case studies, and performance evaluation of the V-STAR system, demonstrating its potential to enhance volcanic hazard monitoring on a global scale.
The V-STAR system leverages satellite data, machine learning, and cloud-based tools to improve the detection of volcanic thermal anomalies and address the limitations of traditional monitoring approaches. The tool is freely accessible online at the following URL: https://www.ct.ingv.it/technolab/v-star (accessed on 20 September 2024).

2. Materials

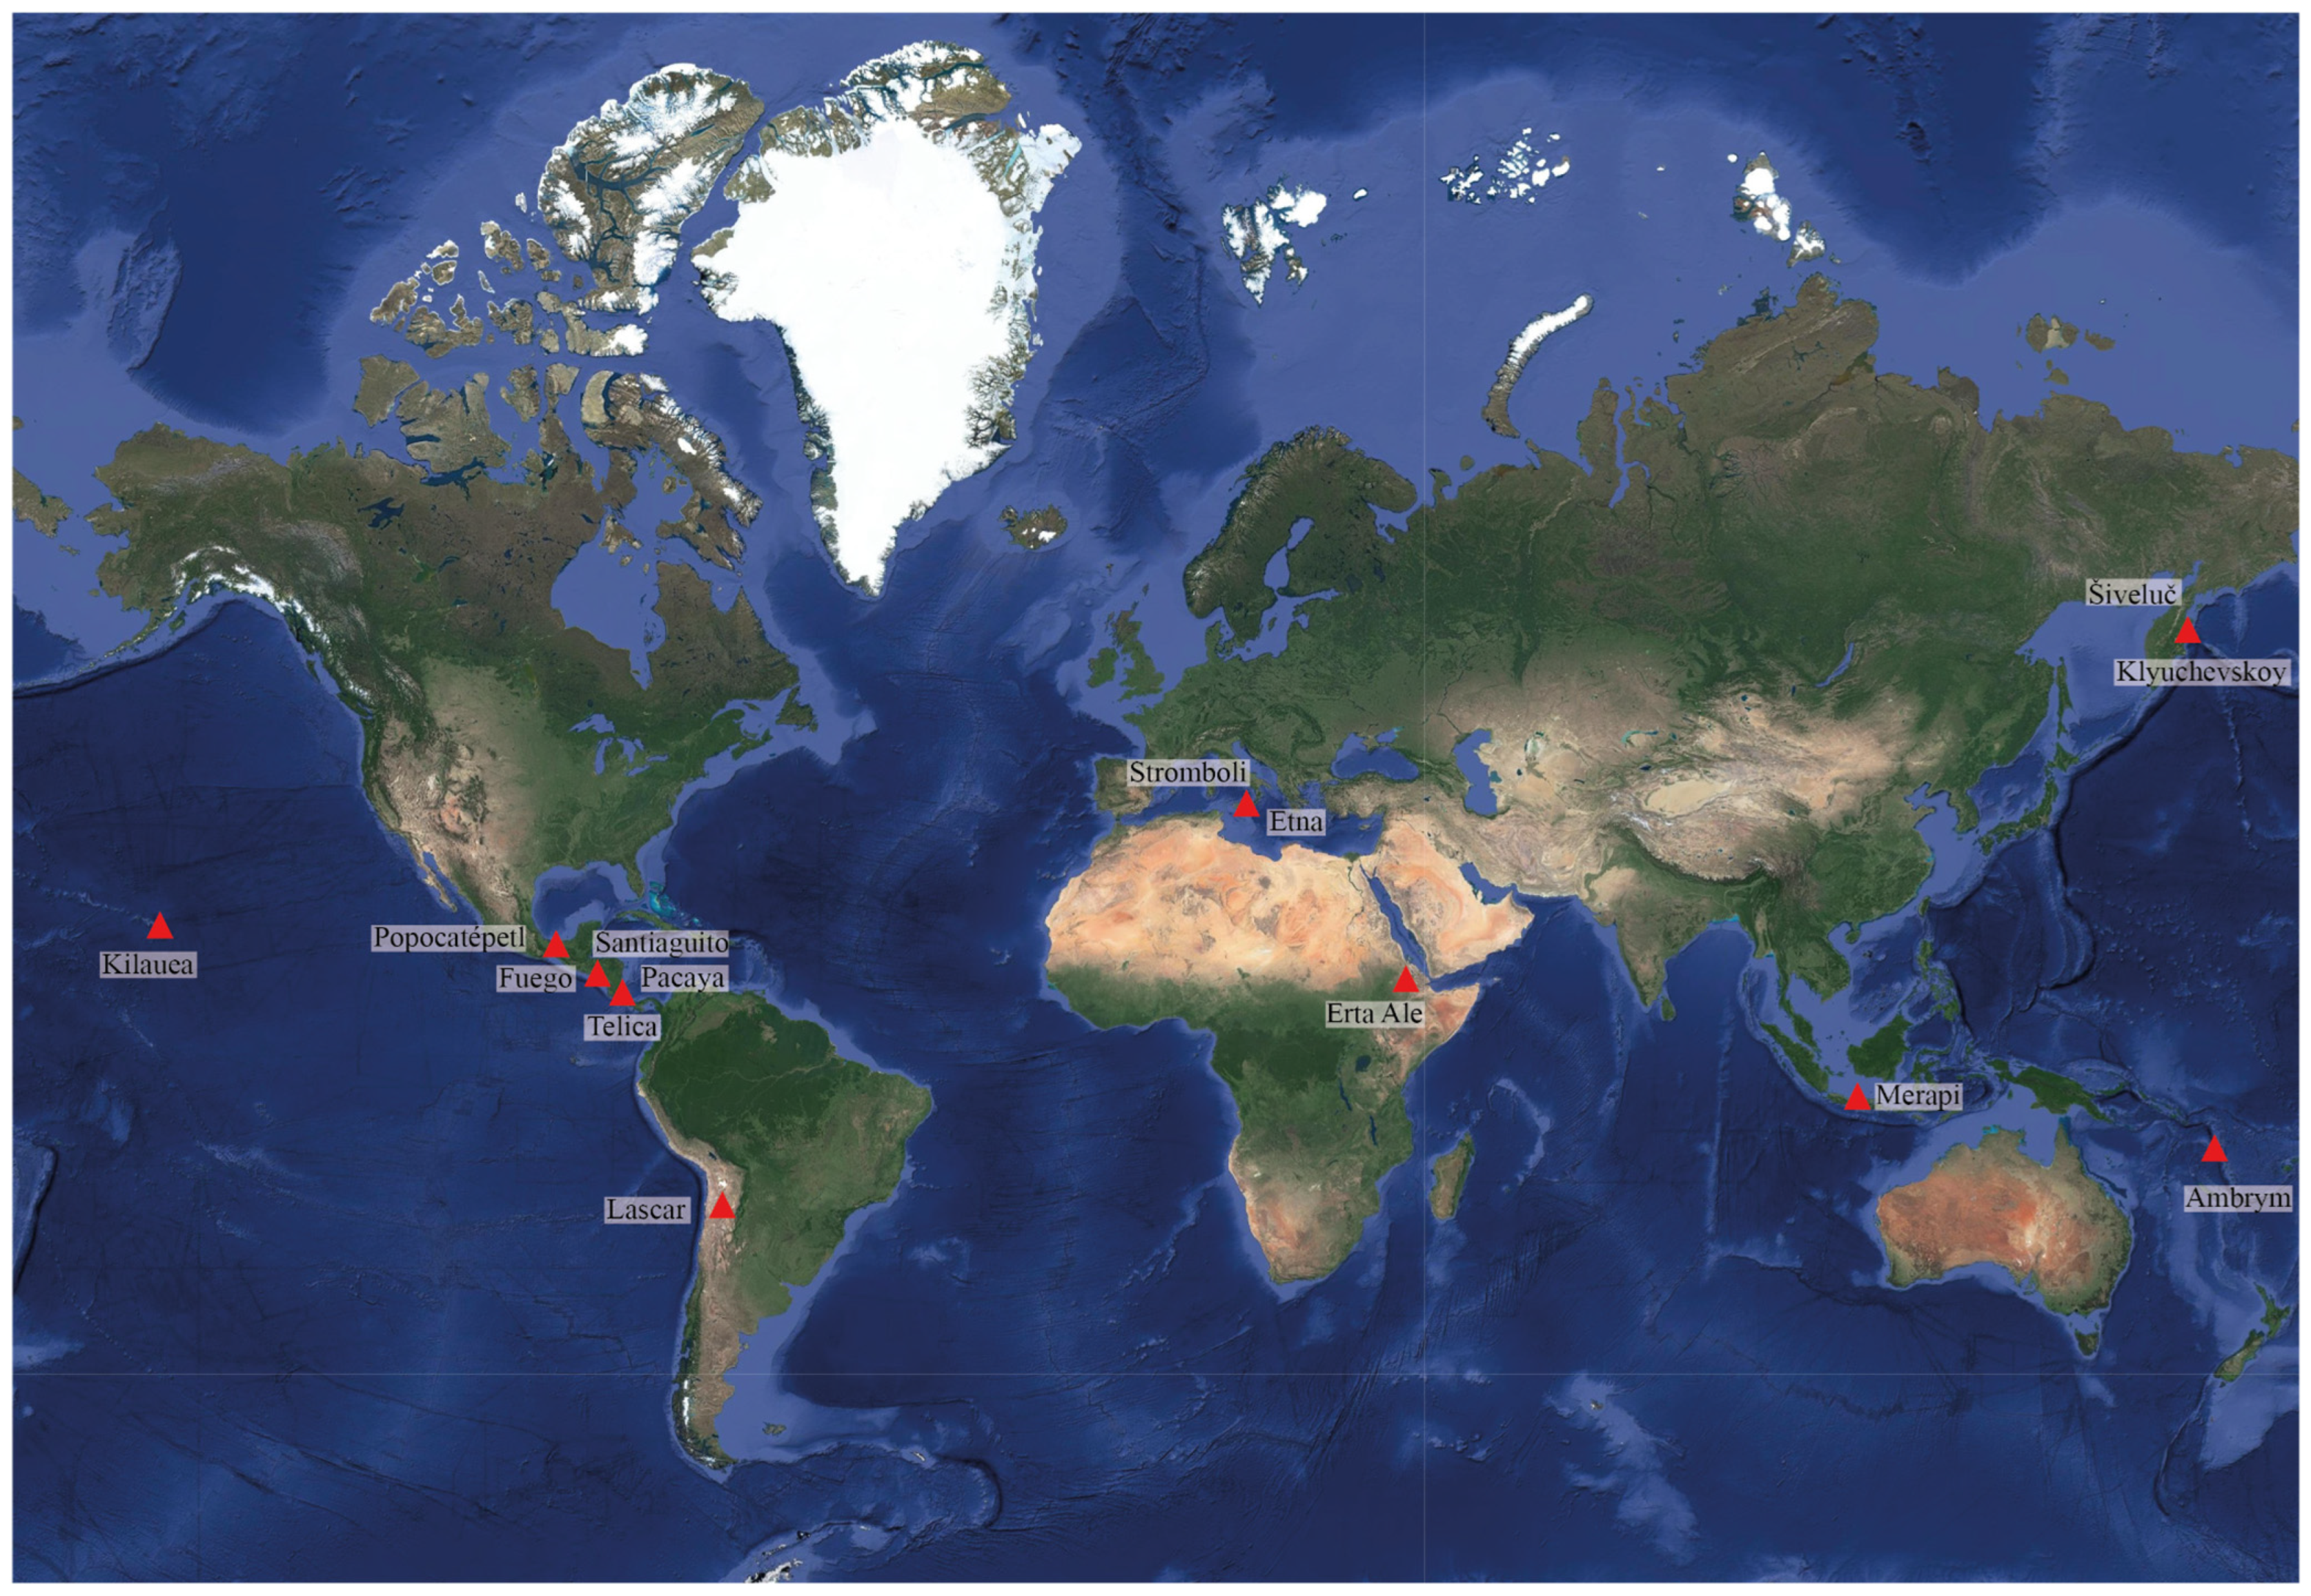
2.1. Volcano Selection

The V-STAR application was tested on 14 volcanoes located across different tectonic settings and geographic regions (Figure 1): Etna and Stromboli (Italy), Klyuchevskoy and Shiveluch (Russia, Kamchatka Peninsula), Lascar (Chile), Popocatépetl (Mexico), Fuego, Pacaya, and Santiaguito (Guatemala), Telica (Nicaragua), Kīlauea (Hawaii, USA), Erta Ale (Ethiopia), Merapi (Indonesia), and Ambrym (Vanuatu).
  • Etna, an active basaltic stratovolcano on the eastern coast of Sicily (Italy), is characterized by frequent effusive eruptions, persistent Strombolian activity, and periodic paroxysmal events. The latter is marked by high ash plumes and lava outflows from the summit craters [39].
  • Stromboli, the northeasternmost island of the Aeolian Archipelago, exhibits persistent low-intensity explosive activity. This ordinary Strombolian activity is occasionally interrupted by lava overflows, major explosions, or paroxysmal events [40].
  • Klyuchevskoy is an active basaltic–andesitic stratovolcano in Kamchatka. Recent eruptions have involved the effusion of voluminous lava flows and moderate to strong explosive activity [41].
  • Shiveluch, also located in Kamchatka, is a highly active andesitic stratovolcano that has produced explosive eruptions, lava dome extrusions, and large-scale structural collapses throughout the Holocene [42].
  • Lascar, an active stratovolcano in northern Chile, shows complex eruptive behavior with persistent fumarolic activity, phreatic and magmatic explosions, lava flows, and dome-building episodes [43,44].
  • Popocatépetl, a large andesitic stratovolcano in central Mexico, is currently characterized by vulcanian explosions, gas-rich ash emissions, and episodic dome growth and destruction cycles [45].
  • Fuego, in Guatemala, is a persistently active stratovolcano with continuous low-intensity Strombolian eruptions, lava effusions, ash-rich explosions, and occasional high-energy paroxysmal events [46].
  • Pacaya, also in Guatemala, is an active basaltic volcano exhibiting Strombolian activity, intermittent Plinian eruptions, lava flows, and dome growth [47].
  • Santiaguito is a dacitic lava dome complex in Guatemala that has shown continuous lava extrusion, frequent ash and gas explosions, partial dome collapses, and short-runout pyroclastic flows [48].
  • Telica, in western Nicaragua, is a basaltic–andesitic volcano located within the Maribios Range. Its activity includes low-energy phreatic explosions every 2–3 years and more violent episodes on a decadal scale [49].
  • Kīlauea, a basaltic shield volcano in Hawaii, alternates between phases dominated by effusive fissure eruptions and periods of explosive summit activity, typical of Hawaiian-style volcanism [50].
  • Erta Ale, in Ethiopia’s Afar Rift, is renowned for its long-lived lava lake and continuous effusive activity. The volcano is situated in a tectonically active region dominated by magma-assisted rifting [51].
  • Merapi, a Quaternary stratovolcano in Central Java (Indonesia), exhibits cyclic eruptive behavior, with frequent low-explosivity eruptions every 4–5 years and more violent events occurring approximately every few decades [52,53].
  • Ambrym is a basaltic volcanic island in Vanuatu’s New Hebrides subduction zone. It is notable for its nested pit craters, lava lakes, frequent Strombolian explosions, and occasional intracaldera fissure eruptions [54,55].

2.2. Satellite Data

The V-STAR application uses multispectral imagery acquired by the Copernicus Sentinel-2 mission, which consists of two polar-orbiting satellites, Sentinel-2A (S2A) and Sentinel-2B (S2B), launched in 2015 and 2017, respectively. Both satellites follow the same sun-synchronous orbit, phased 180° apart, providing a combined global revisit frequency of 5 days. Each satellite is equipped with the Multispectral Instrument (MSI), which captures imagery in 13 spectral bands: four bands at 10 m resolution in the visible (VIS) and near-infrared (NIR), six bands at 20 m resolution in the red edge and shortwave infrared (SWIR), and three atmospheric bands at 60 m resolution.
For this study, we employed Level-1C (TOA) imagery from the Sentinel-2 archive available on GEE. This dataset comprises approximately 6000 images from 2015 to the present, with each image consisting of 13 UINT16 bands representing top-of-atmosphere (TOA) reflectance scaled by 10,000 (see the Sentinel-2 User Handbook for additional details). The TOA reflectance was converted into radiance units [W m−2 sr−1 µm−1]. The bands used are listed in Table 1.
For modeling purposes, these bands were renamed based on their central wavelengths: L0.4, L0.5, L0.6, L0.7, L0.8, L1.6, and L2.2.
These bands span the visible (VIS), near-infrared (NIR), and shortwave infrared (SWIR) ranges, allowing for improved discrimination between volcanic thermal features and background elements. All the satellite data were processed directly on the GEE platform. For each volcano, a default region of interest (ROI) centered and fixed on the summit crater was defined to constrain the area of analysis. Future improvements may include automatic determination of the ROI based on historical thermal activity or topographic context.

3. Methods

The V-STAR application employs a supervised classification approach based on spectral information derived from Sentinel-2 MSI data (provided by European Space Agency (ESA)). The goal is to accurately distinguish volcanic thermal anomalies (class 1) from background elements (class 0), such as clouds, snow, or bare ground. This enables the detection of even low-intensity anomalies in challenging observational conditions.

3.1. The Algorithm: Random-Forest-Based Two-Step Classification Model

The underlying algorithm of the V-STAR application is based on [38], and it is a two-step classification model. Once the RF model [38] is applied to map subtle to high thermal anomalies, a second refinement classification step based on clustering classification is used to highlight only the hotter pixels. This latter step is crucial during intense activity when haloes are present.
The RF model consists of three main steps: feature selection, model training, and performance evaluation.
(i) Feature Selection. To train the machine learning model to detect thermal anomalies, it is essential to select a set of discriminative input features. Two candidate feature sets were evaluated, and the most effective, referred to as Feat2, was selected based on its ability to distinguish thermal anomalies from heterogeneous backgrounds. This feature set leverages the spectral signatures of different land covers and volcanic products, including erupted materials and thermally active zones [38]. Feat2 includes bands from the visible (VIS) to shortwave infrared (SWIR) range, allowing the model to detect high-temperature anomalies but also learn spectral signatures of the cooling volcanic products that may have weak responses in infrared bands. This broader spectral integration improves the model’s ability to reduce false negatives, especially in the presence of background elements with known spectral behaviors, such as vegetation, snow, or clouds. All the selected bands in the feature sets (see Table 2) were normalized using z-score normalization to account for differences in dynamic range and units, ensuring that each band contributes comparably to the model. Z-score normalization (also known as standardization) is a statistical technique used to scale variables to a common range without distorting their relative differences. For each pixel value x in a band, the normalized value z is computed as follows: z = (x − μ)/σ, where μ is the mean and σ is the standard deviation of the band. This process ensures that each band contributes equally to the analysis, preventing those with larger numerical ranges from dominating the model’s learning process. It improves performance and supports a more balanced and robust analysis.
(ii) Model Training. The classification model adopted in V-STAR is a Random Forest (RF) algorithm. RF is an ensemble learning method based on the aggregation of multiple decision trees. Each decision tree is trained on a random subset of the data, using a randomly selected subset of input features at each split, and the final prediction is obtained via majority voting. Decision trees are supervised learning models that recursively partition the feature space using rules derived during training. While a single decision tree may suffer from overfitting, the Random Forest approach mitigates this by averaging across multiple trees, thus improving generalization. In our implementation, the Random Forest classifier is composed of 100 trees, a value chosen by trial and error, to ensure a balance between computational efficiency and classification performance. During the training phase, the model learns optimal decision boundaries from labeled pixels (thermal anomaly vs. background), exploiting spectral differences to generate robust classification rules. RF is particularly well-suited for remote sensing applications involving heterogeneous landscapes, as it handles high-dimensional data and nonlinear relationships effectively while maintaining interpretability.
(iii) Performance Evaluation. Model performance is evaluated using standard classification metrics, taking into account the spatial overlap between predicted and actual thermal anomaly areas. Since the dataset is imbalanced, i.e., background (class 0) pixels are far more frequent than anomaly (class 1) pixels, metrics sensitive to the positive class are prioritized. The key evaluation metrics are as follows:
  • Accuracy
    ( ACC ) = A ( t e s t r e a l ) A ( t e s t r e a l )
Measures the spatial agreement between predicted and observed lava flow areas based on the intersection and union of their surfaces.
  • Precision (also known as the positive predictive value (PPV))
    ( PPV ) = A ( t e s t r e a l ) A ( t e s t )
Indicates the proportion of predicted thermal anomalies that correspond to actual anomalies.
  • Recall (also known as the true positive rate (TPR))
    ( TPR ) = A ( t e s t r e a l ) A ( r e a l )
Indicates the proportion of actual thermal anomalies correctly identified by the model.
The accuracy (ACC) metric is defined as the ratio between the area of intersection and the area of union of the predicted and actual lava flows, expressed as follows:
( ACC ) = A ( t e s t r e a l ) A ( t e s t r e a l )
where A(testreal) and A(testreal) represent the areas of spatial overlap and total coverage, respectively. ACC quantifies the spatial agreement between the modeled and observed lava flow fields, providing a measure of both positional accuracy and extent similarity. The positive predictive value (PPV) indicates the proportion of the predicted lava flow area that coincides with the actual flow, while the true positive rate (TPR) quantifies the proportion of the actual lava flow area that is correctly identified by the model. All three metrics range from 0 (no agreement) to 1 (perfect match), where 1 implies complete spatial overlap between the predicted and actual lava extents. The joint analysis of ACC, PPV, and TPR provides insights into the model’s tendency to overestimate or underestimate the target area. Specifically, underestimation occurs when PPV > ACC, suggesting that the predicted area is more conservative than the actual flow, whereas overestimation is indicated when TPR > ACC, meaning the predicted area exceeds the real extent. For benchmarking, a traditional fixed-threshold algorithm was implemented using established decision rules, allowing direct comparison with the machine learning approach.
Refinement classification step:
In order to refine the classification when haloes/refraction errors are present, an unsupervised classification is performed on Sentinel-2 imagery using a clustering algorithm. Pixels identified as thermal anomalies are clustered based on their intensities in order to obtain high and low thermal anomalies clusters.
We selected the most suitable spectral bands for the analysis, specifically, band B8A and band B11, which are sensitive to higher thermal emissions.
Once the information from these two bands is masked by the RF anomaly map, an unsupervised clustering is performed using the LVQ algorithm (Learning Vector Quantization). Learning Vector Quantization (LVQ) is a supervised classification algorithm that represents each class through one or more prototypes, which are representative vectors. During training, these prototypes are progressively adjusted to better represent the data of their respective class. When a new data point needs to be classified, the algorithm assigns it to the class of the nearest prototype based on the distance (usually Euclidean) between the data point and the prototypes.
This algorithm is applied on a random sample of pixels within the masked study area and then applied to the rest. Each pixel is thus assigned to a cluster based on thermal emissions, namely, high and low. Once the anomalous cluster is identified, it is represented by red pixels, while the entire RF mask is displayed as a yellow outline. Finally, two quantitative parameters are calculated: the total number of pixels classified as anomalous and the corresponding surface area, expressed in square meters.
The results of this last step are integrated into the graphical user interface (GUI), where the user can visualize the (very hot) anomalies on the map and read the associated quantitative data, including the number of pixels and the total area.
This additional step allows us to further refine the analysis and provide the user with deeper insight into the hottest portions of the detected volcanic thermal anomalies.

3.2. The Platform: Google Earth Engine (GEE)

GEE is a cloud-based platform for planetary-scale geospatial analysis that enables users to access and process satellite imagery and geospatial datasets without the need for local storage or computational resources. It provides direct access to an extensive multi-petabyte archive of satellite imagery, including Sentinel, MODIS, Landsat, and many other missions, as well as a wide range of environmental datasets. GEE offers a JavaScript API and a Python API (earthengine-api version: 1.5.15), allowing users to build, execute, and visualize geospatial workflows within a web-based code editor. One of the main advantages of GEE is its ability to perform massive parallel processing of satellite data, enabling near-real-time analysis over large geographic areas. It also provides built-in functions for image preprocessing, time-series analysis, classification, and visualization, greatly simplifying the development of remote sensing applications. In the V-STAR application (version: 1.0), GEE is used as both the computational engine and the user interface. Sentinel-2 Level-1C images are accessed directly from the GEE data catalog, and all the data preprocessing (including filtering by cloud cover, image selection, and band extraction), classification, and visualization are performed entirely within the platform. The Random Forest classifier is implemented using GEE’s machine learning module, trained on labeled pixels representing thermal anomalies and background conditions. One of the key features of V-STAR (version: 1.0) is its user-friendly graphical interface, which allows users to interactively select the volcano of interest, define the region of analysis, and view the results dynamically. The platform also provides tools to export classified images and data in various formats (e.g., GeoTIFF, CSV, XML), facilitating further analysis or integration into other workflows. By leveraging GEE, V-STAR (version: 1.0) significantly reduces the limitations typically associated with satellite data processing, such as slow download speeds, storage constraints, and the need for high-performance local computing infrastructure. This makes it accessible to a broad range of users, including researchers, civil protection authorities, and decision-makers involved in volcanic risk mitigation and monitoring.

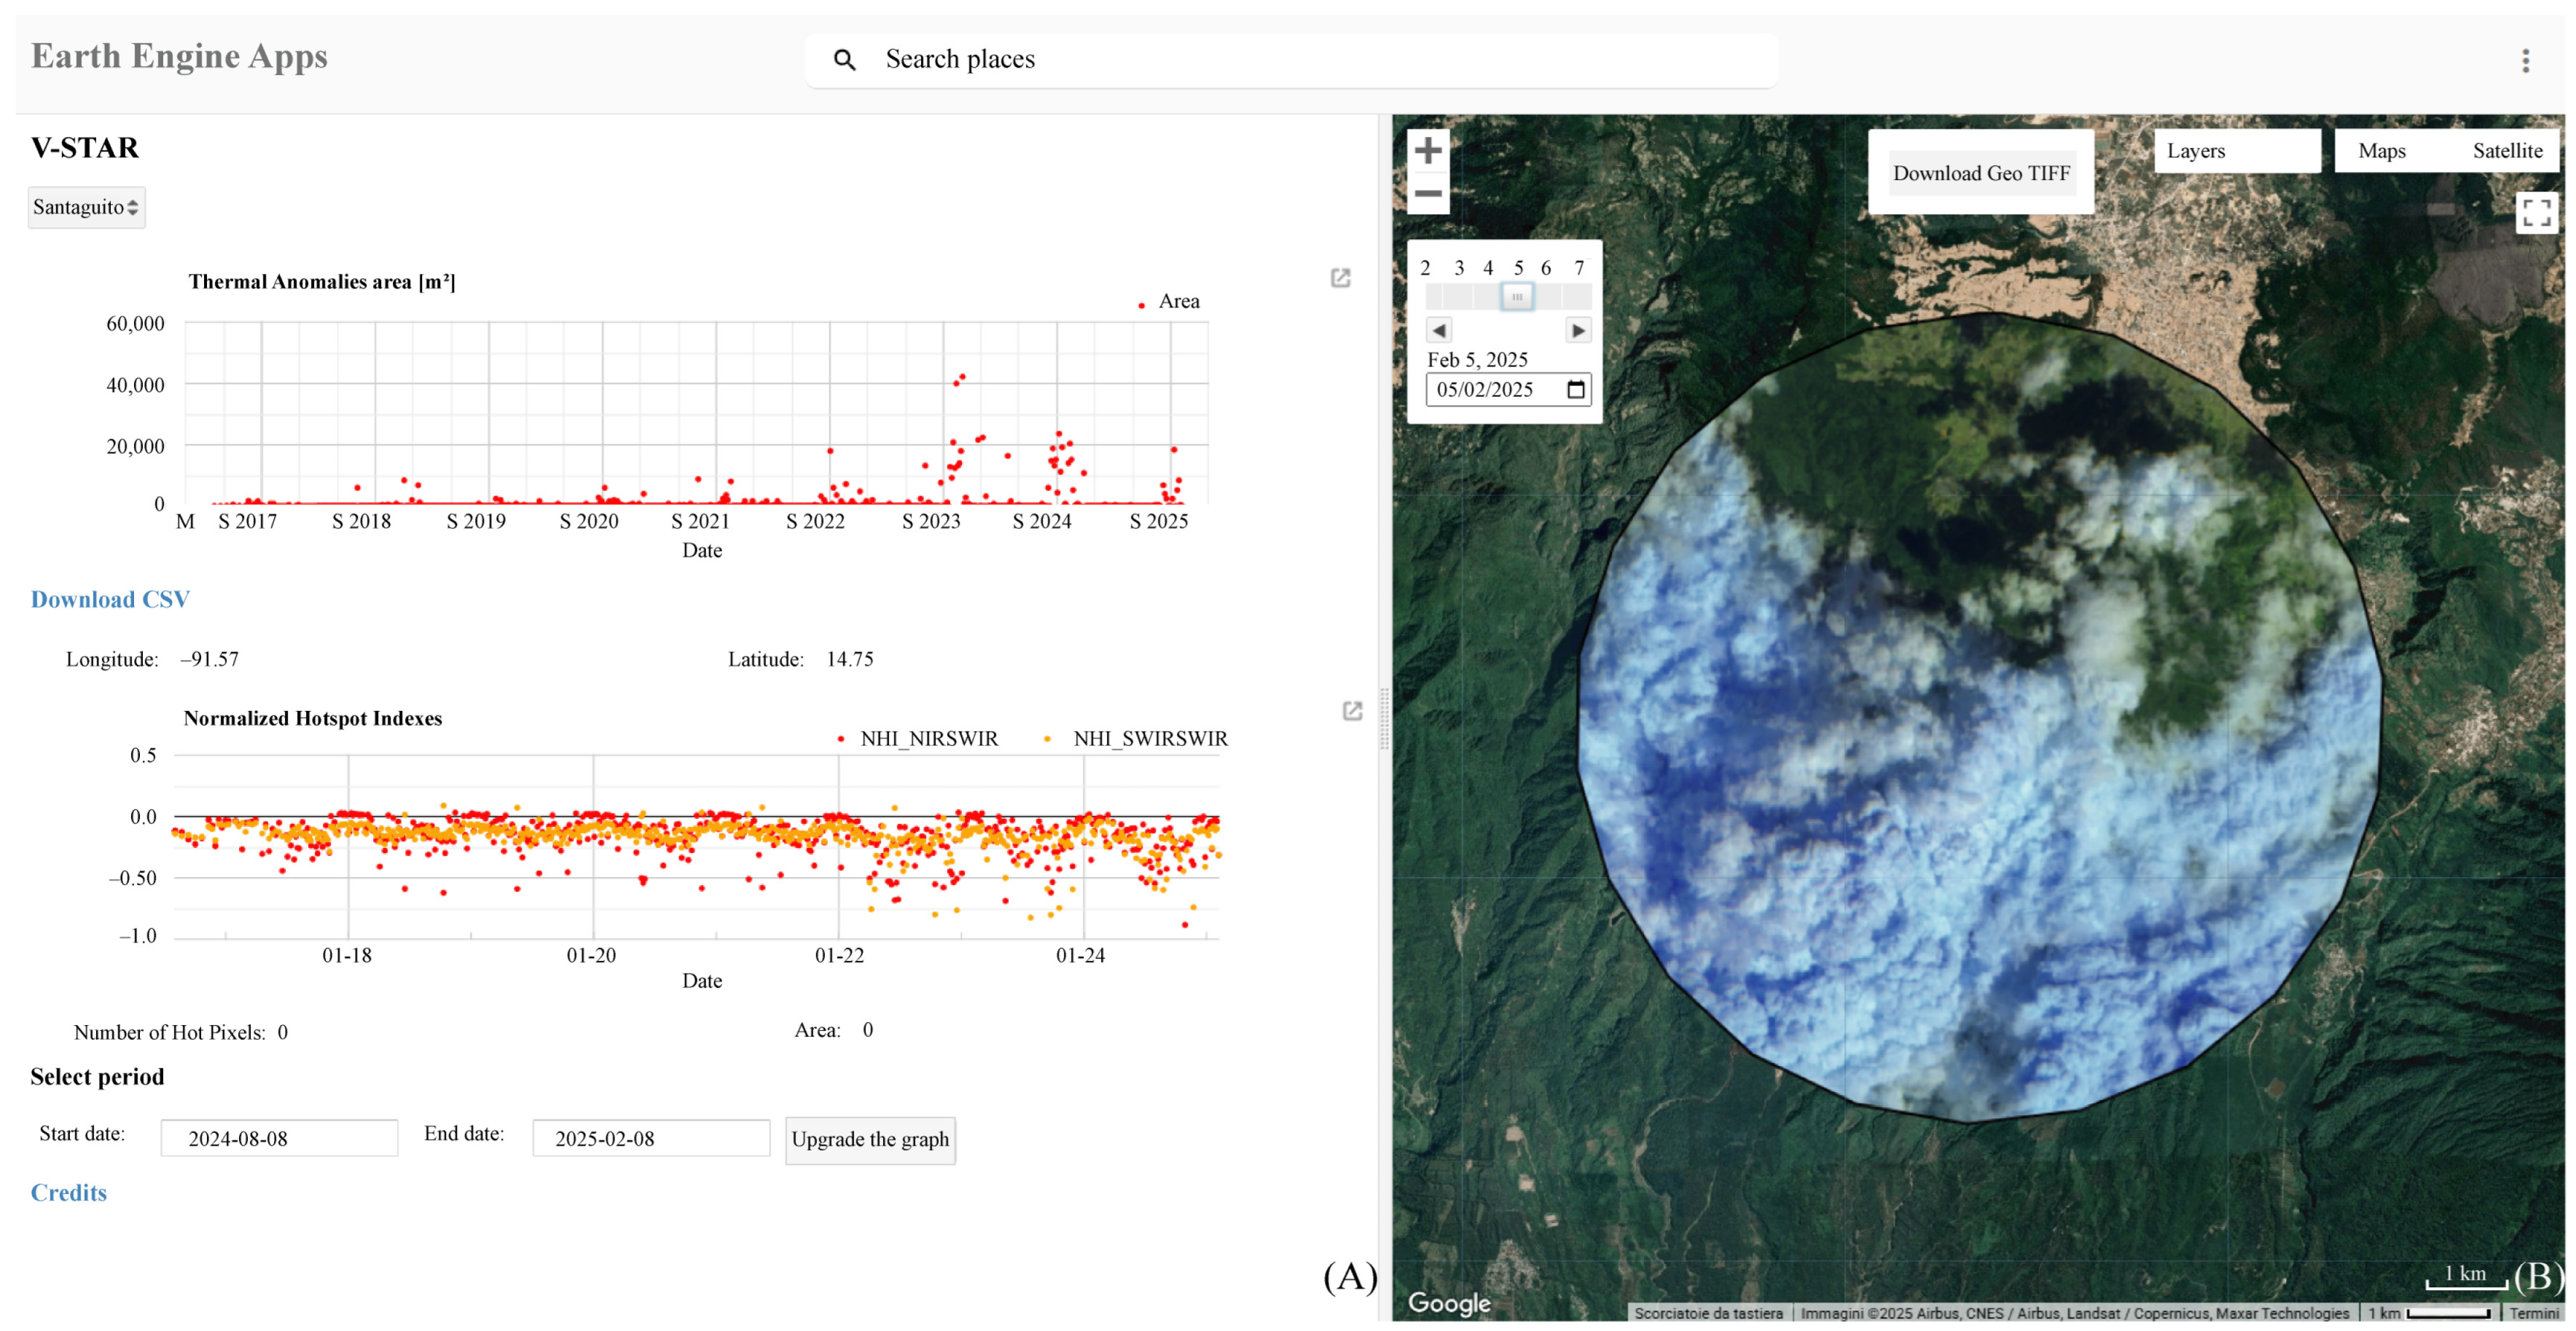
3.3. Exploring the Interface: Features and Tools

V-STAR (version: 1.0) offers an intuitive and user-friendly interface that provides all users, including those with limited experience, the essential tools for performing accurate and efficient analyses. The interaction begins by selecting the volcano of interest from a predefined list. Upon selection, the application automatically connects to Google servers, initiates the Random Forest classifier, and retrieves and prepares the relevant data for visualization. Once loading is complete, the interface is divided into two main sections.
On the left side (Figure 2A), the first graph displays a time series of the areal extent of thermal anomalies detected at the selected volcano over the past six months. Users also have the option to download the complete time series, from 2016 to the present, in CSV format for further offline analysis. Below this, the Normalized Hotspot Index (NHI) is plotted over time. The NHI is based on the normalized difference between spectral bands from the Sentinel-2 satellite that are sensitive to thermal anomalies. Specifically, two indices are computed:
  • NHI(SWIR–SWIR) = (B12 − B11)/(B12 + B11), where B11 and B12 are both shortwave infrared (SWIR) bands.
  • NHI(NIR–SWIR) = (B11 − B8A)/(B11 + B8A), where B8A is the near-infrared (NIR) band and B11 is an SWIR band.
These indices are designed to highlight thermally anomalous pixels by enhancing the radiometric contrast between hot targets (e.g., active lava or fumaroles) and the cooler surrounding background. By default, the NHI is calculated at the center of the crater; however, users can reposition the cursor to any location within the scene to recalculate the index for the new point. Additionally, the application displays the number of hot pixels identified by the Random Forest classifier and automatically computes the total anomalous area (in square meters) for the selected image. The interface also allows users to define a custom time window for exploring the time series, making it easier to identify temporal patterns, trends, or episodic changes in thermal activity.
On the right side of the interface (Figure 2B), the most recent Sentinel-2 image available for the selected volcano is displayed. A calendar widget enables users to browse and select specific acquisition dates. If the requested date is not available in the archive, a notification is displayed informing the user. The trained Random Forest model is automatically applied to each available selected image, and when the image contains a thermal anomaly, either intracrateric or more extensive, such as a lava flow or lava lake, the anomaly map is shown. Yellow contours delineate the subtle to high anomaly’s extent, while red pixels mark the hottest areas within the segmentation. V-STAR (version: 1.0) also enables the export of classification results. Users can download the outputs in GeoTIFF and XML formats, which are compatible with standard geospatial analysis platforms, including GIS software (version: 3.40.3) and Google Earth (version: Pro or other).

4. Results

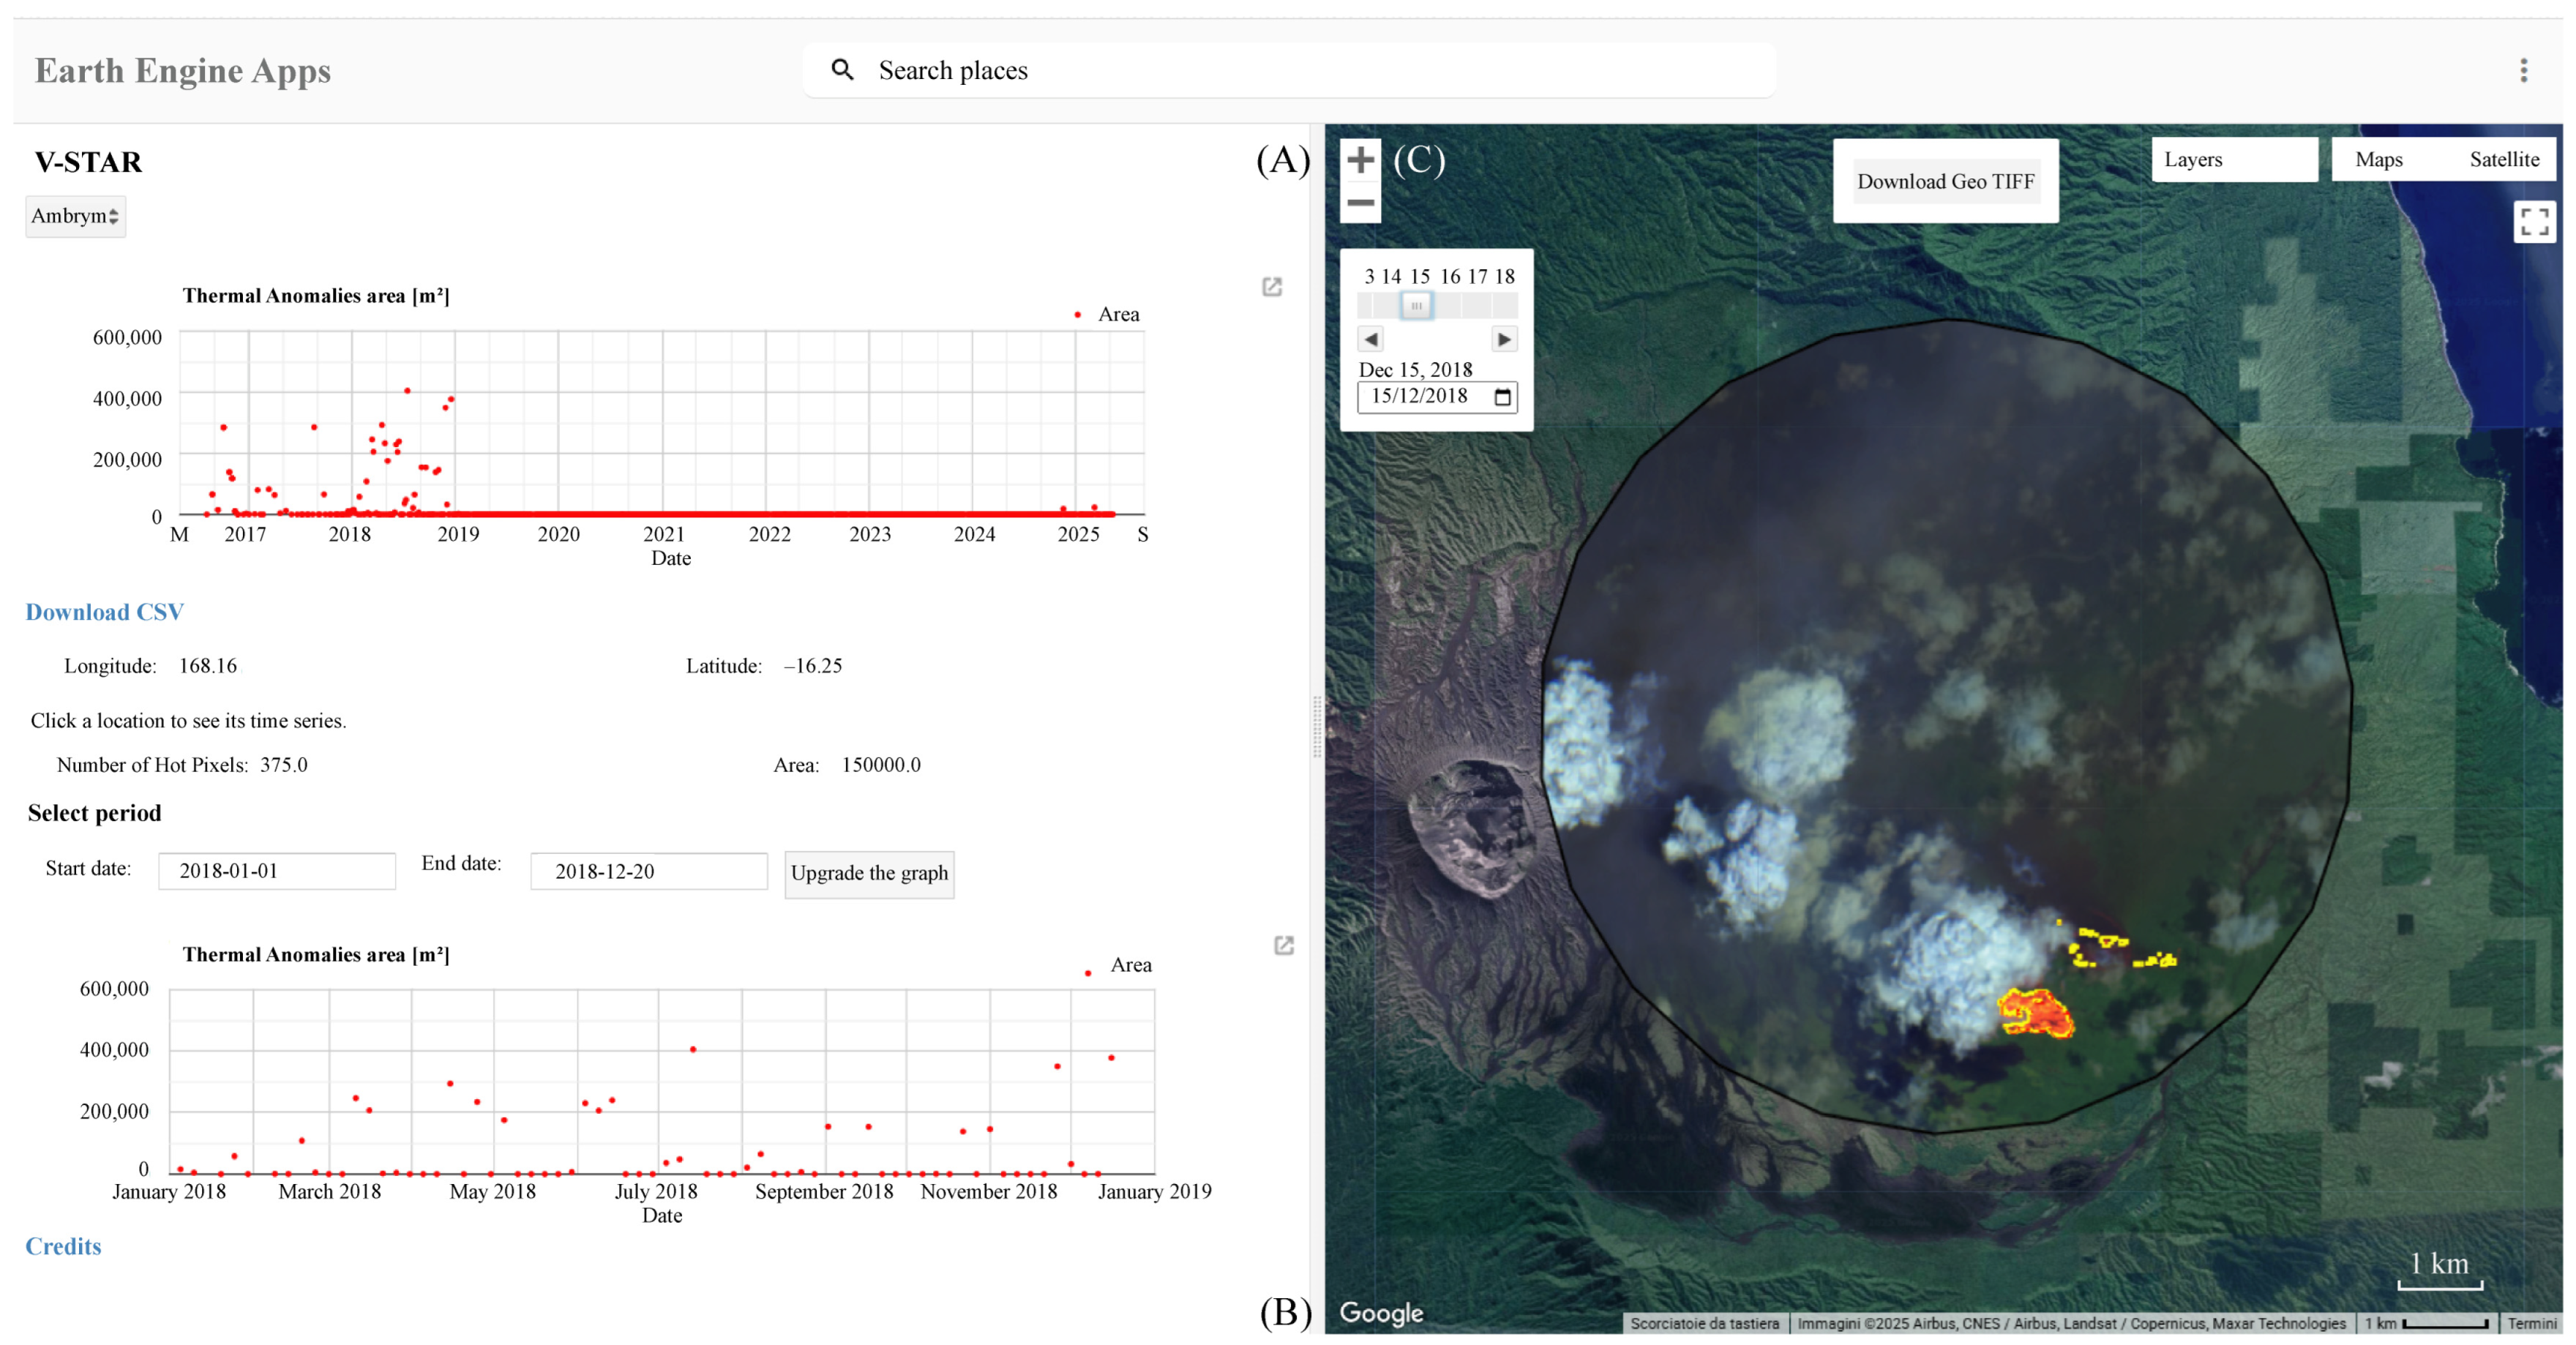
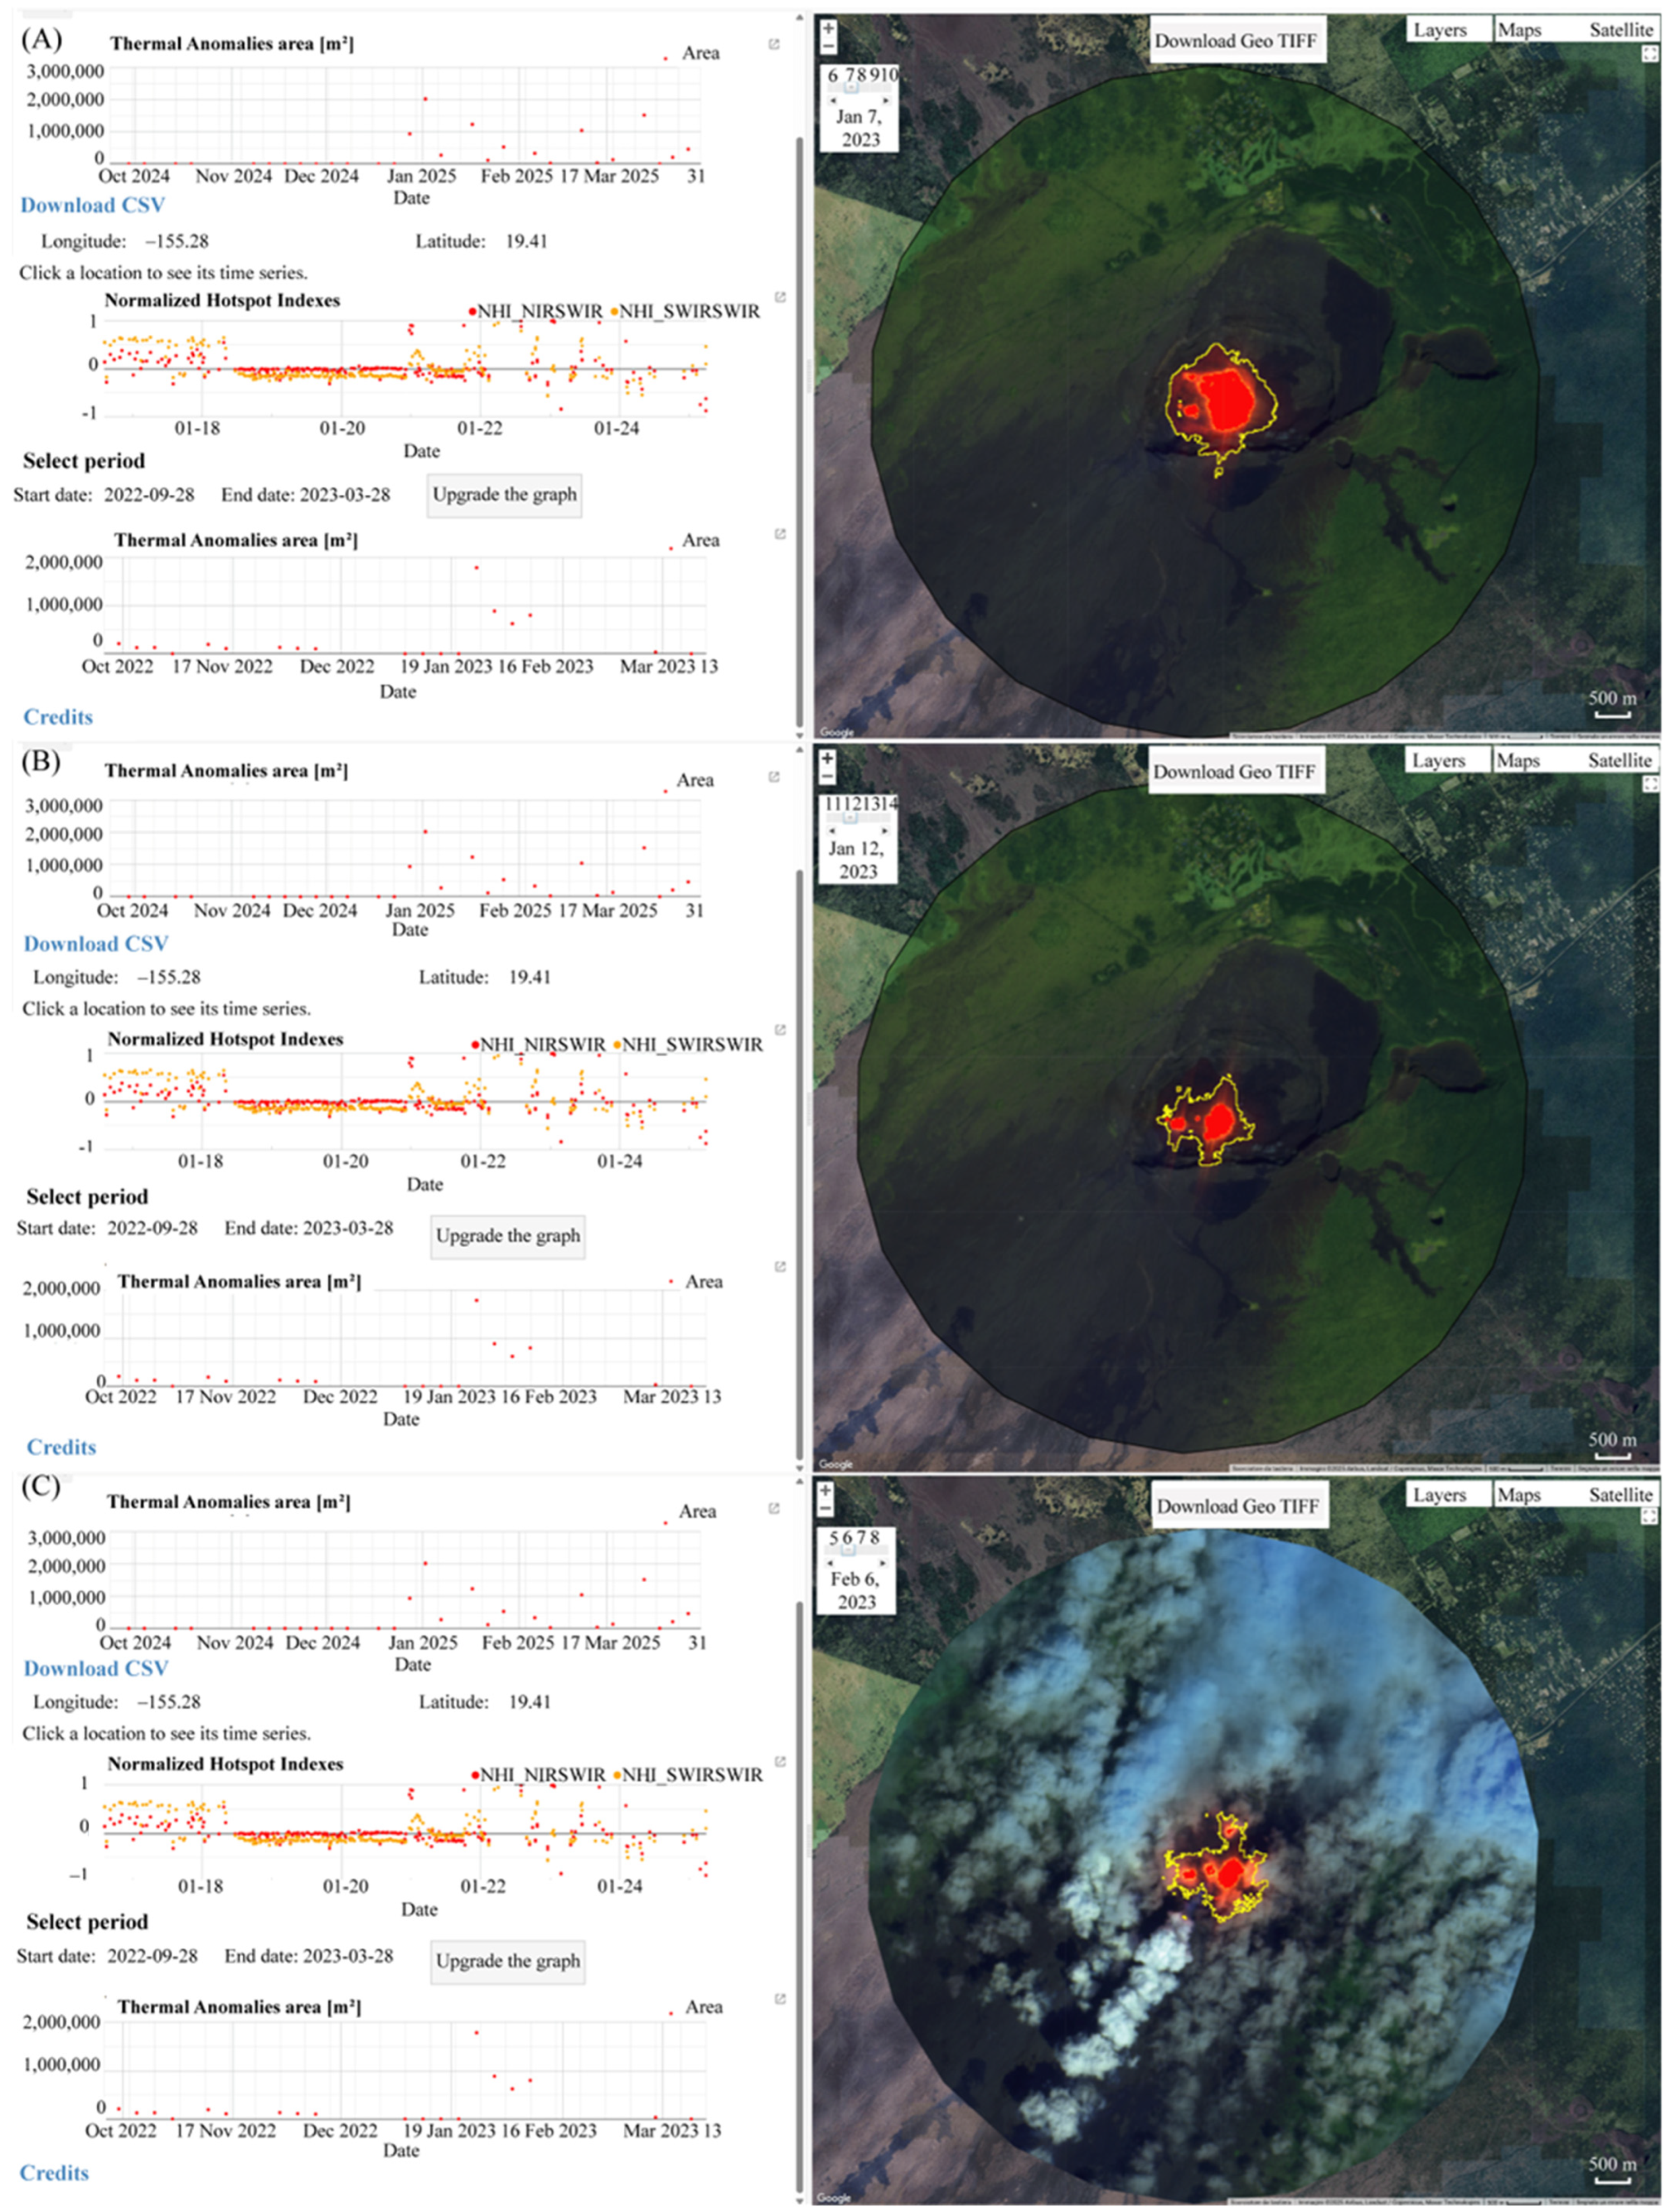
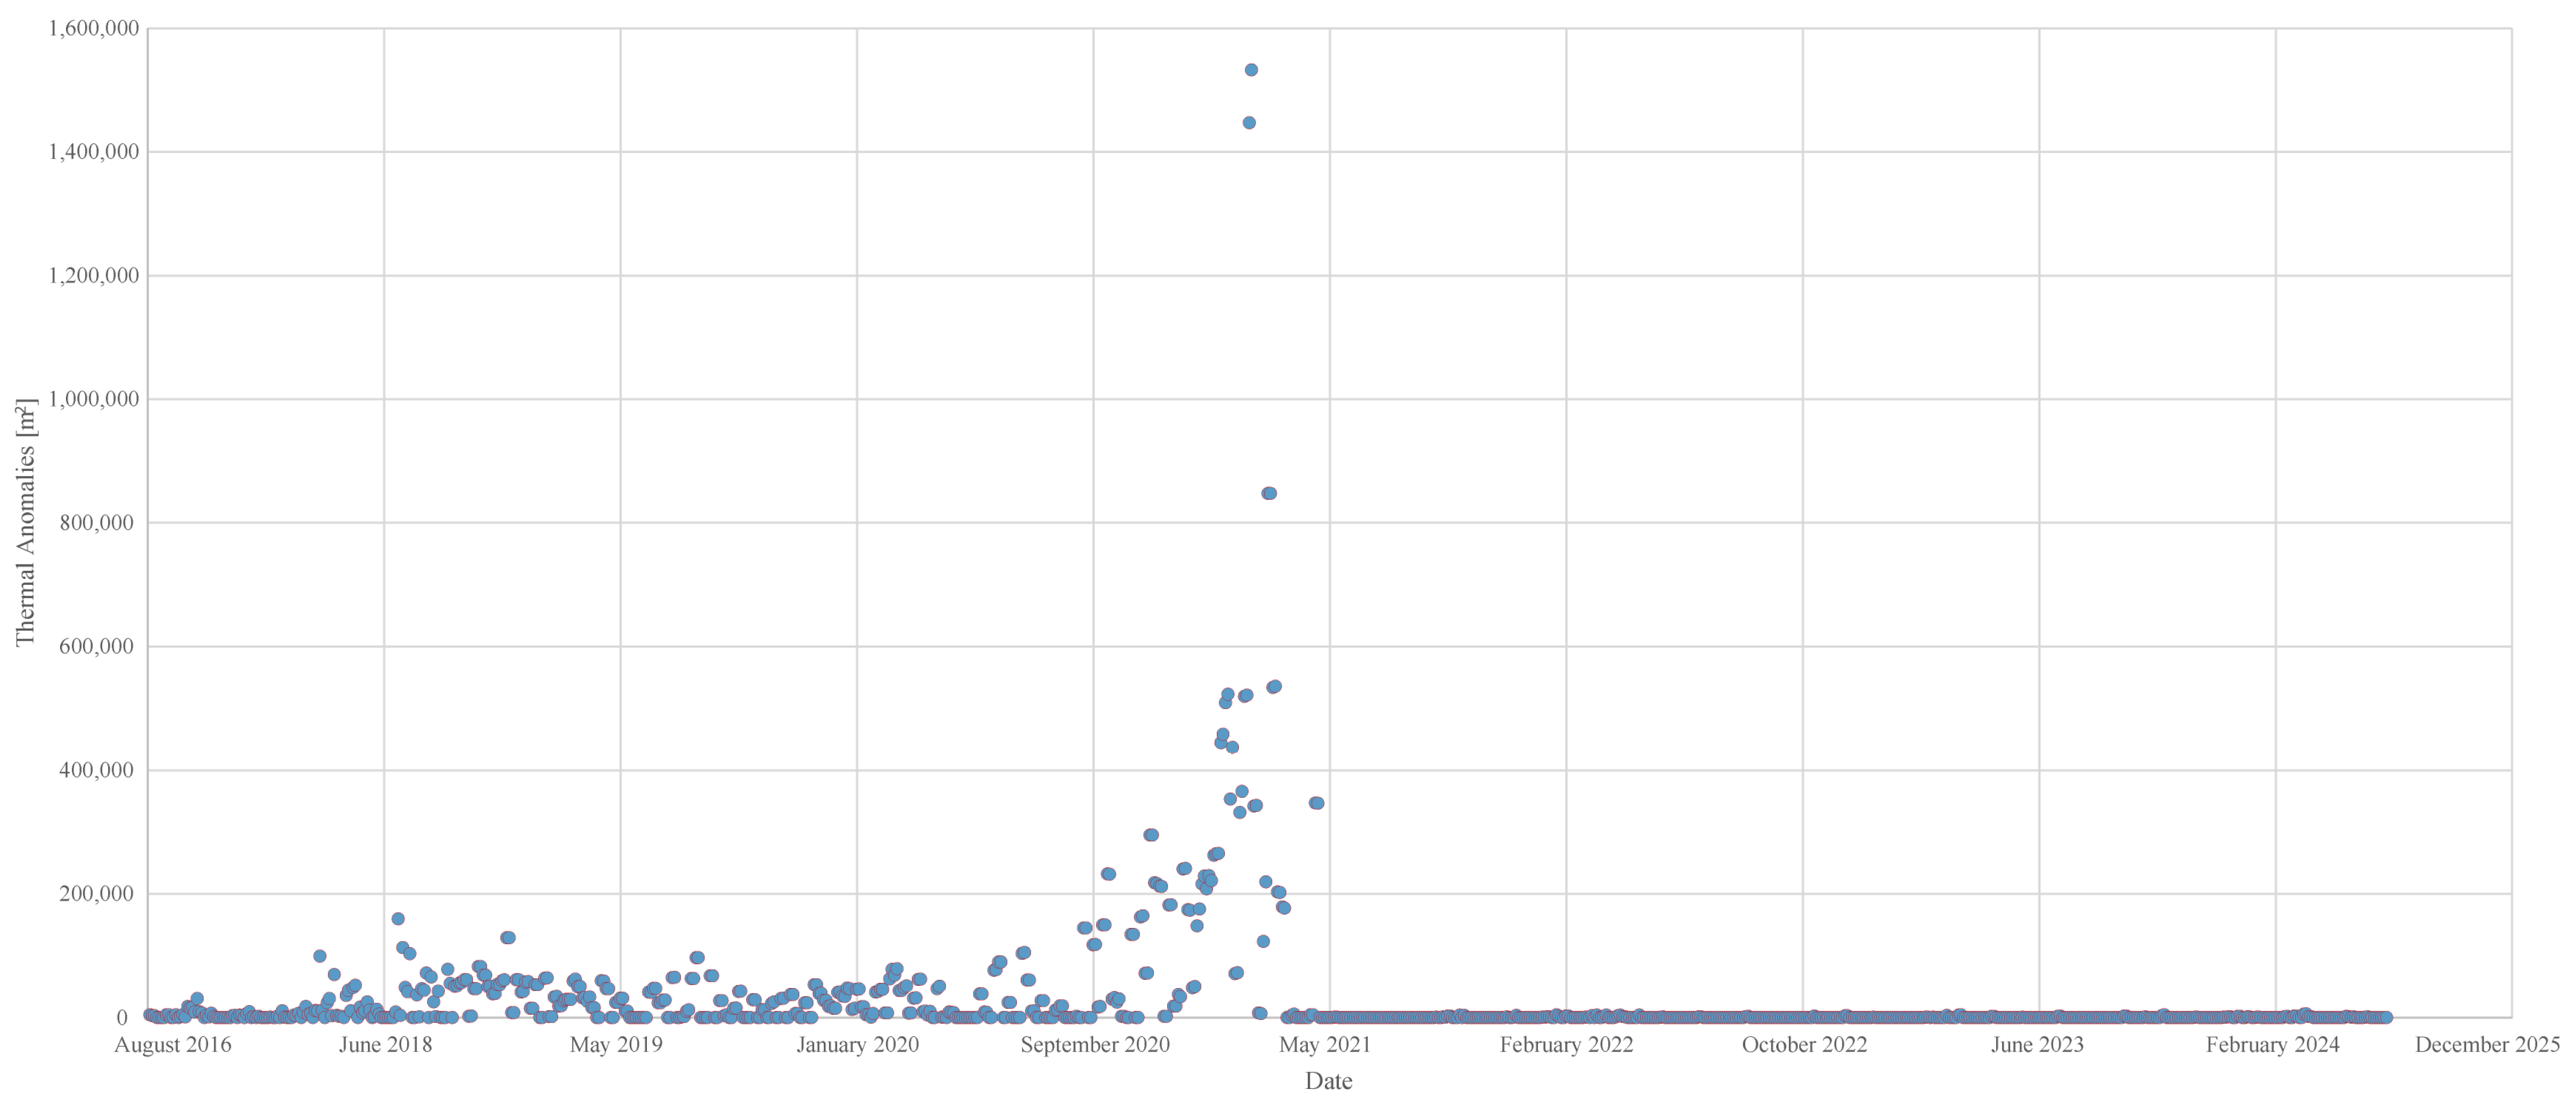
4.1. Identification of Unrest/Quiescence Periods of Active Volcanoes

We evaluated the capability of Sentinel-2 MSI imagery combined with the Random Forest (RF) model to detect and characterize unrest and quiescence phases in active volcanoes by analyzing the case of Ambrym volcano (Vanuatu).
Specifically, we investigated the Ambrym eruption that occurred on 15 December 2018. The previous lateral eruptive activity had taken place in 2015, when a minor surface lava flow was recorded within the caldera [55,56]. The results obtained from the analysis of Sentinel-2 MSI data processed with the RF model reveal the presence of persistent thermal anomalies at the summit craters starting in January 2018, continuing up to the onset of the lateral eruption on 15 December 2018 (Figure 3). These results align with temperature anomaly data and SO2 emissions derived from Himawari-8 satellite observations [55], which confirm the initiation of intra-caldera activity. This case study highlights the potential of the V-STAR system—particularly the RF-based classification approach—to track subtle thermal changes during extended periods of apparent quiescence. The ability to detect a progressive increase in thermal anomalies prior to the eruptive event demonstrates the tool’s usefulness for monitoring transitions from quiescence to unrest. It also supports the integration of data-driven models and high-resolution satellite imagery in operational early warning systems.

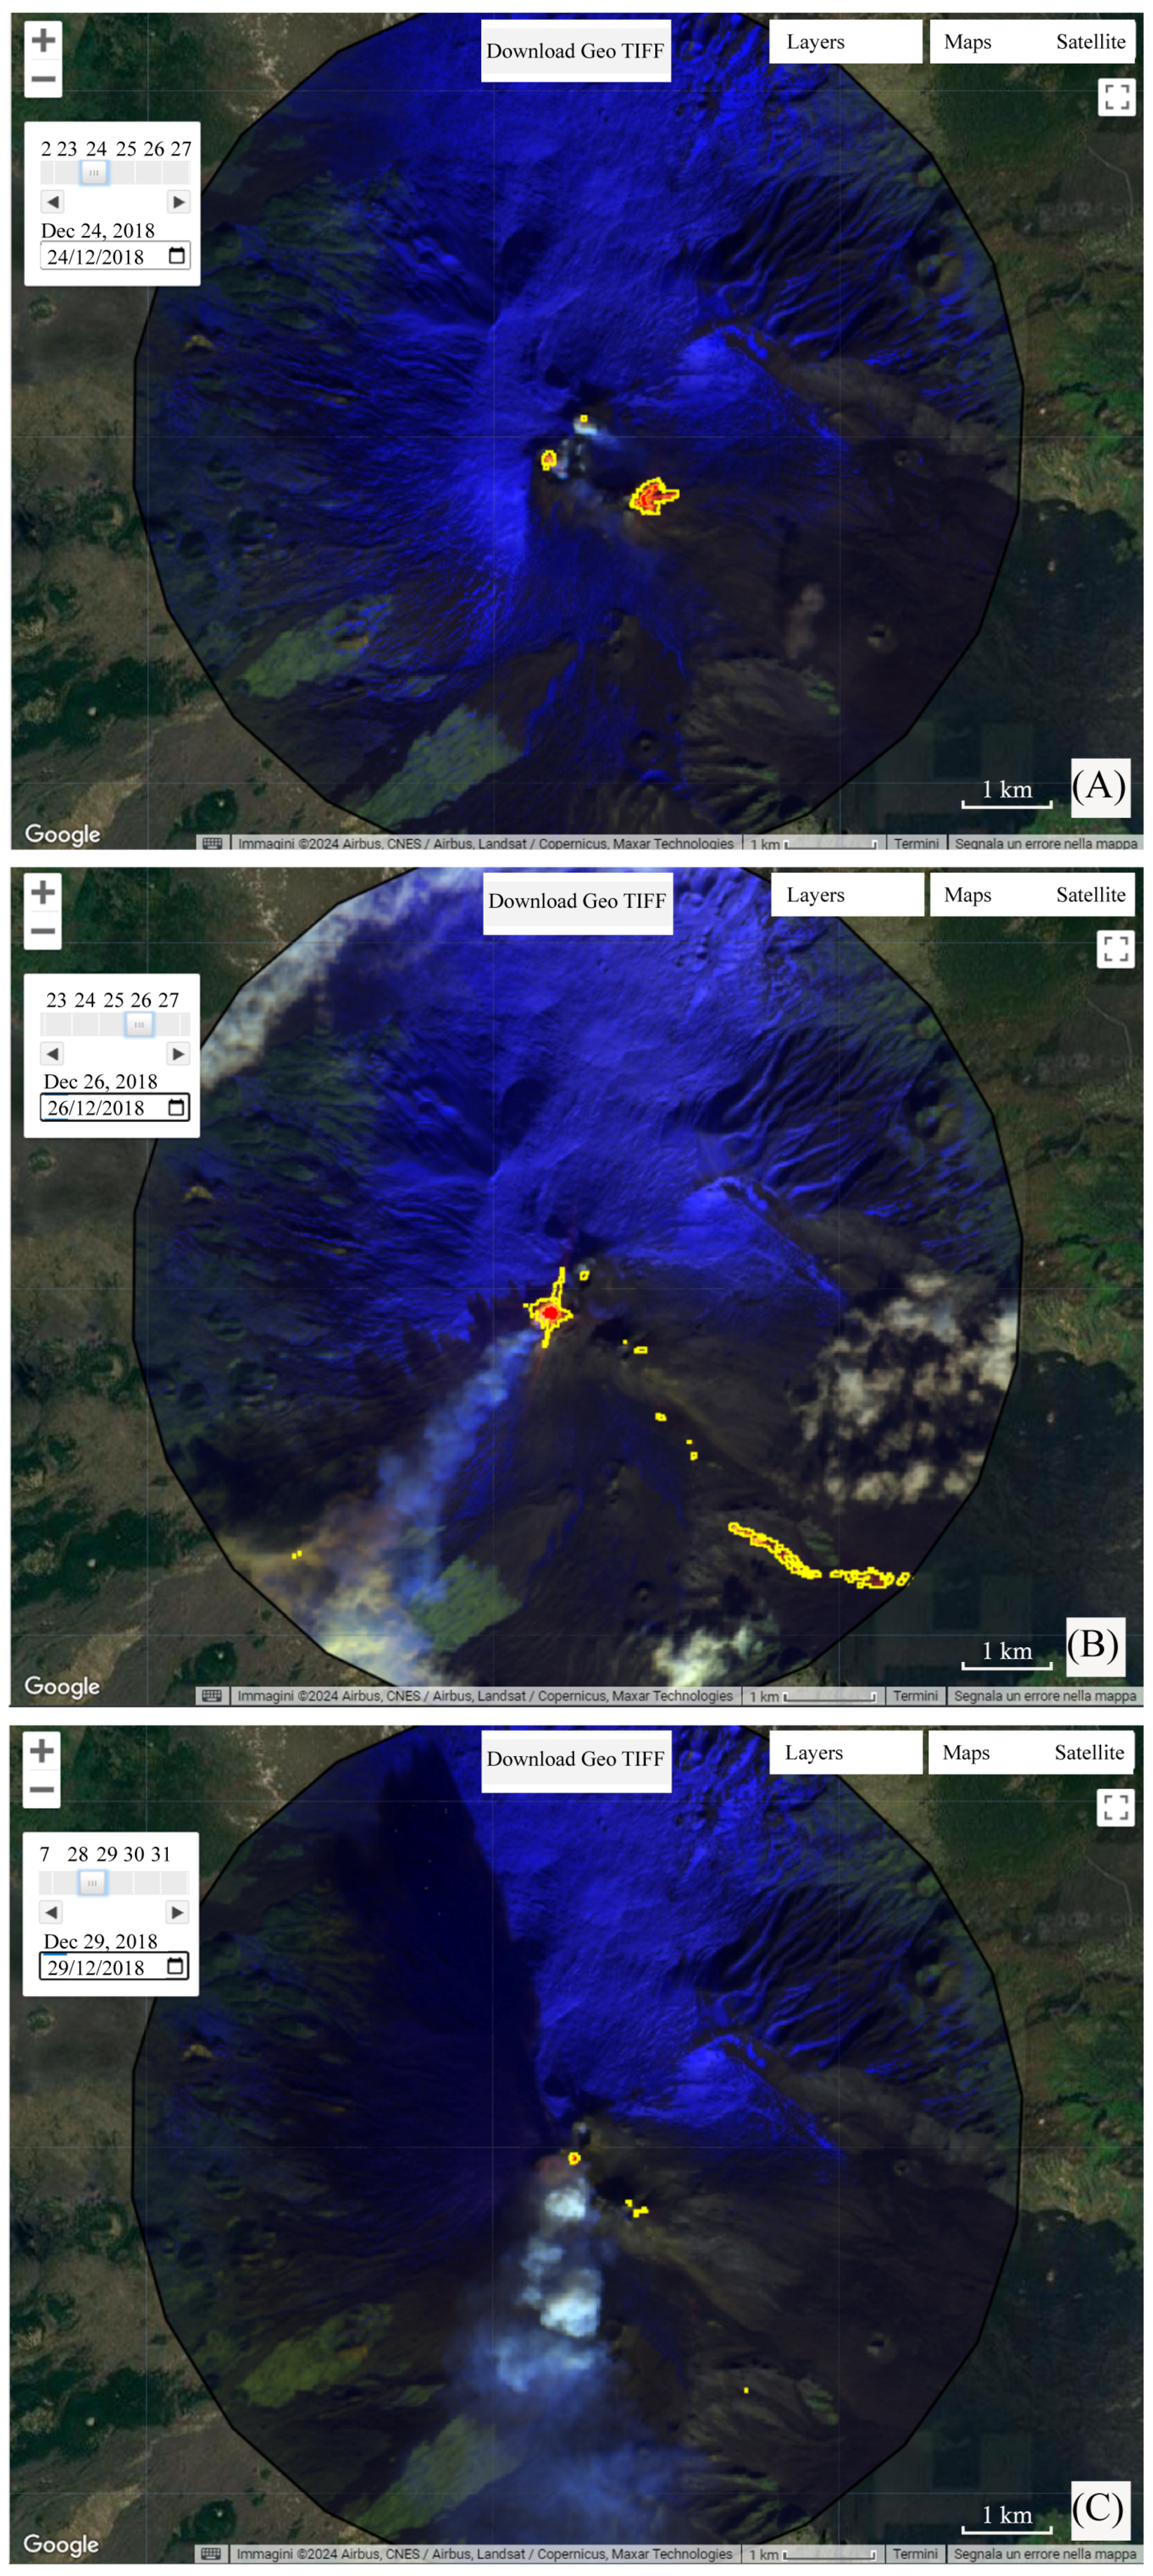
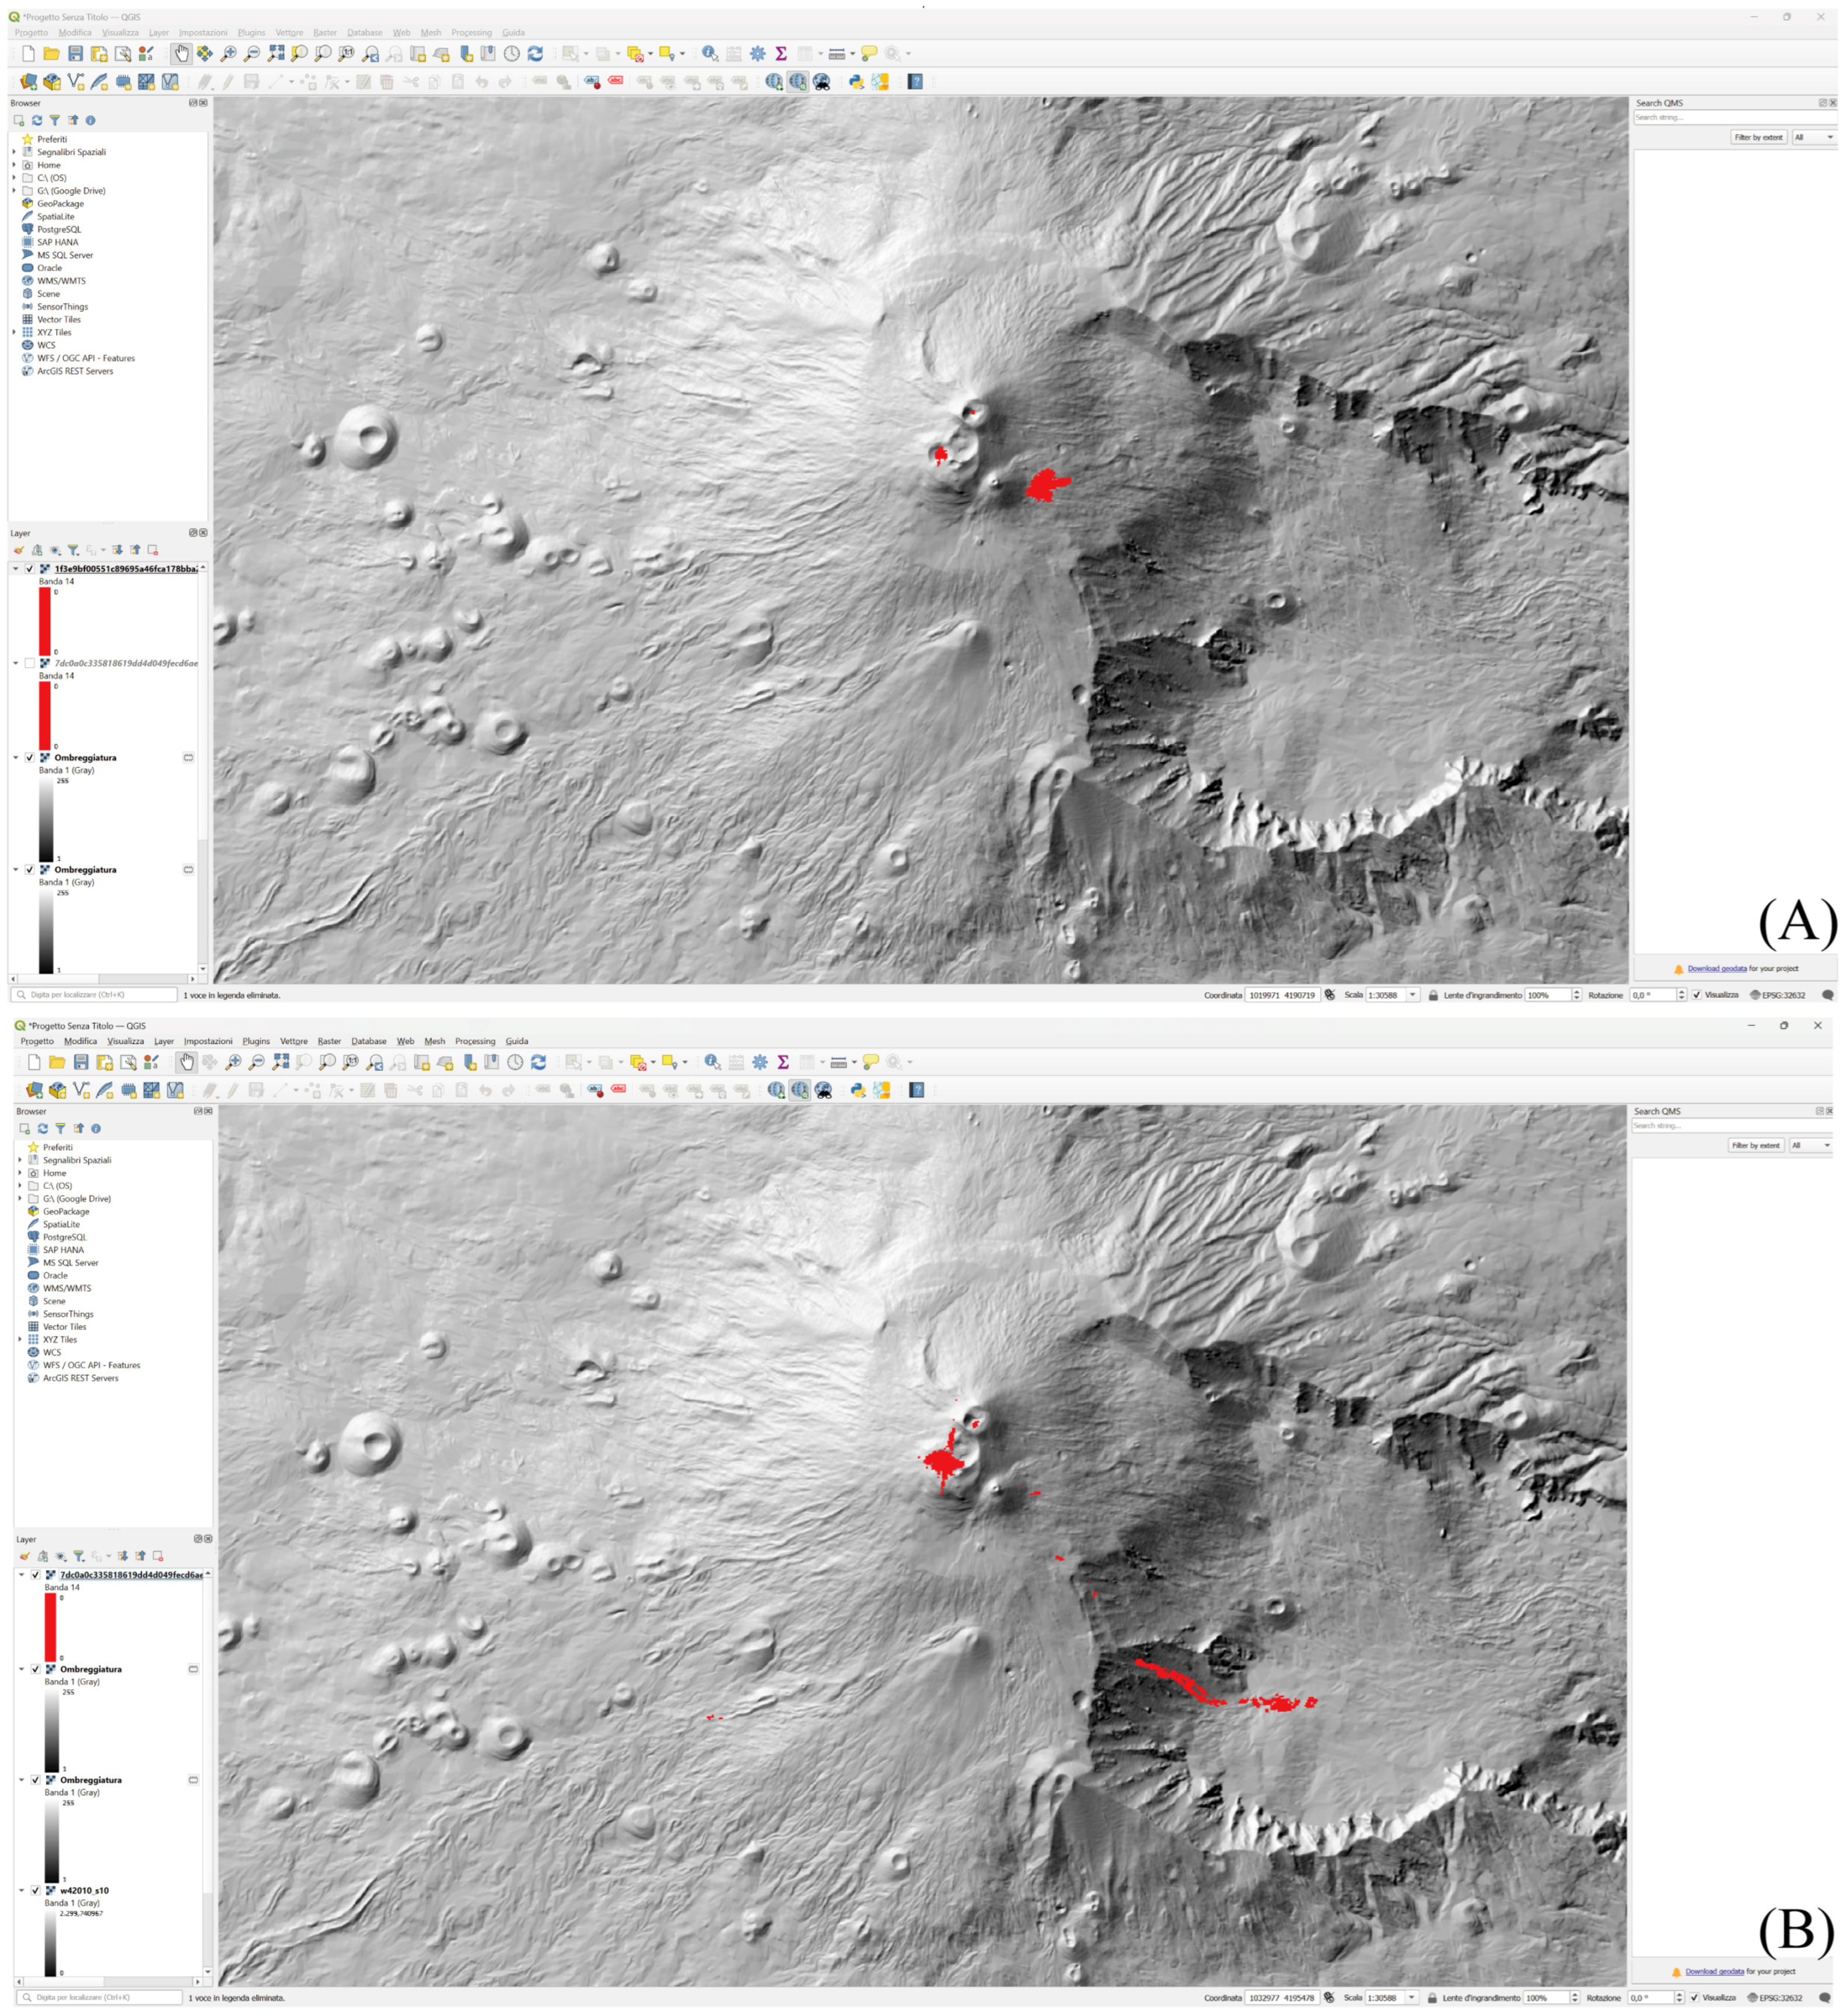
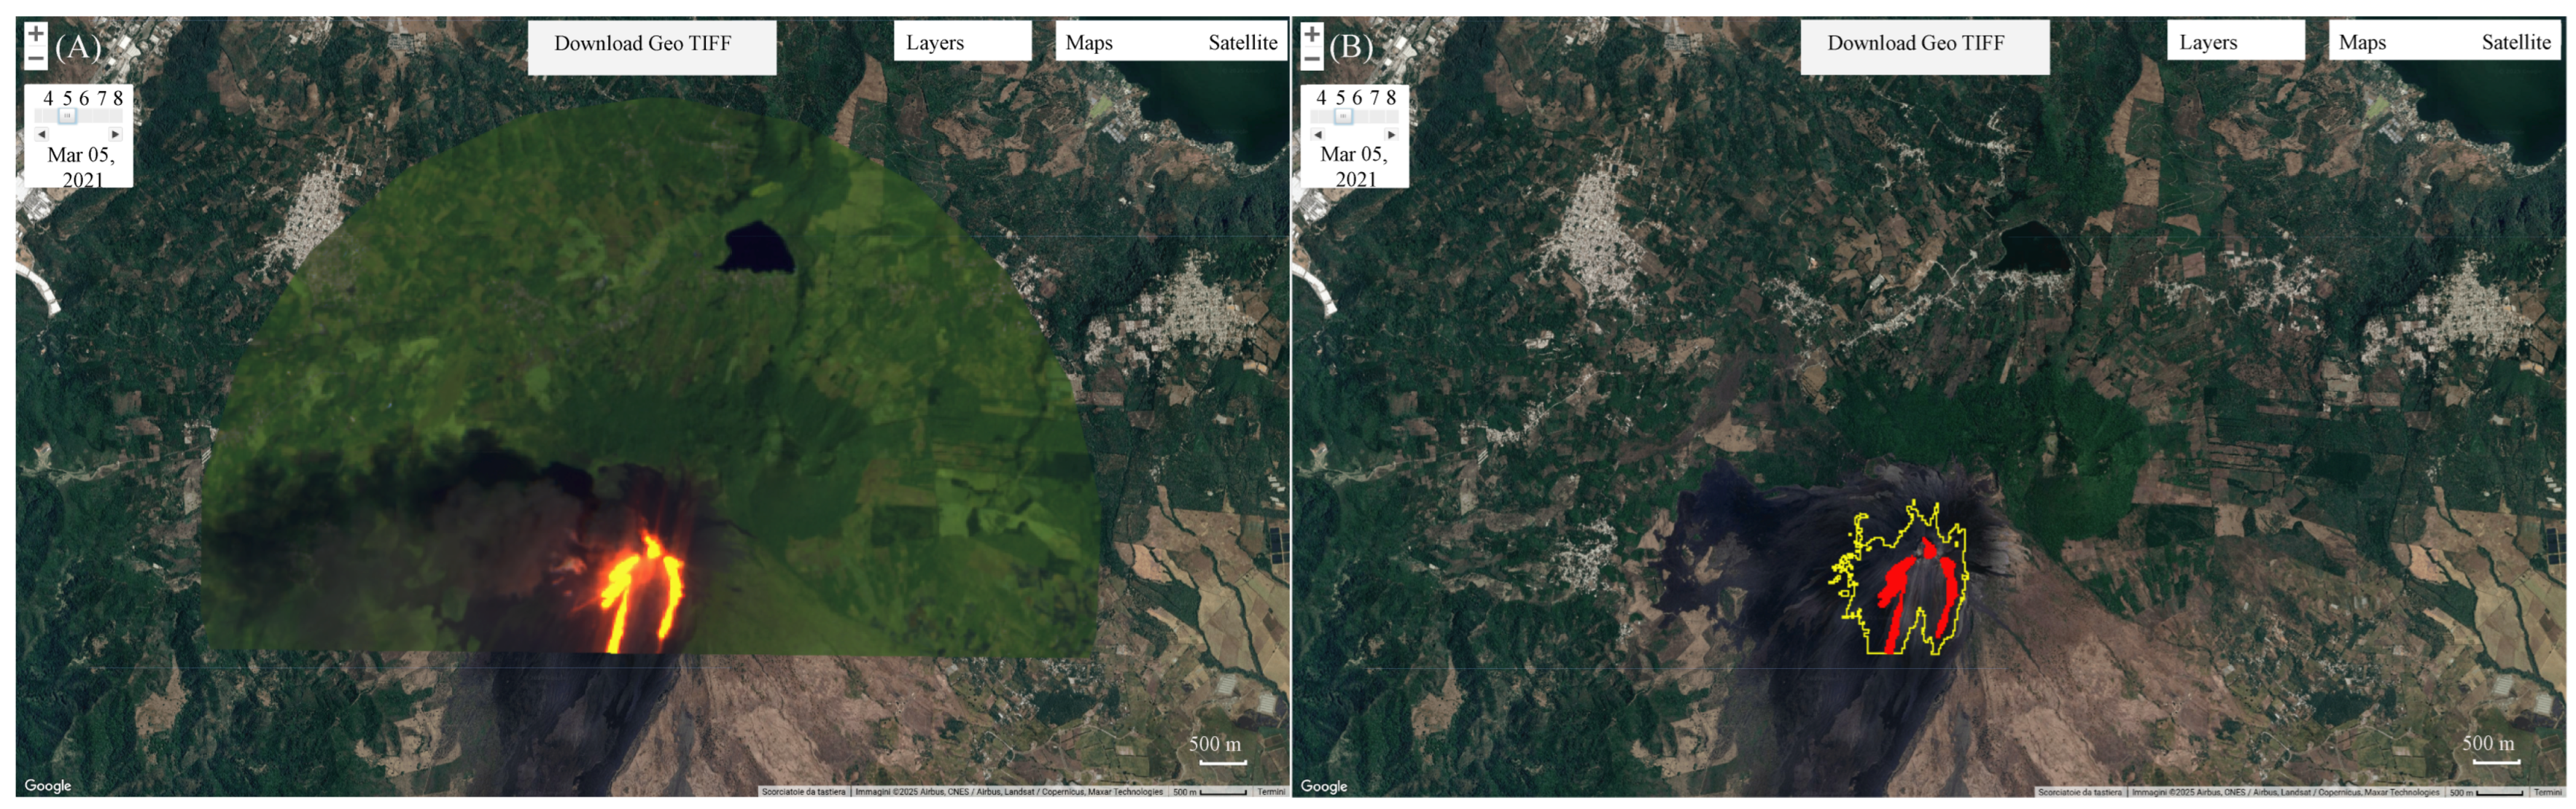
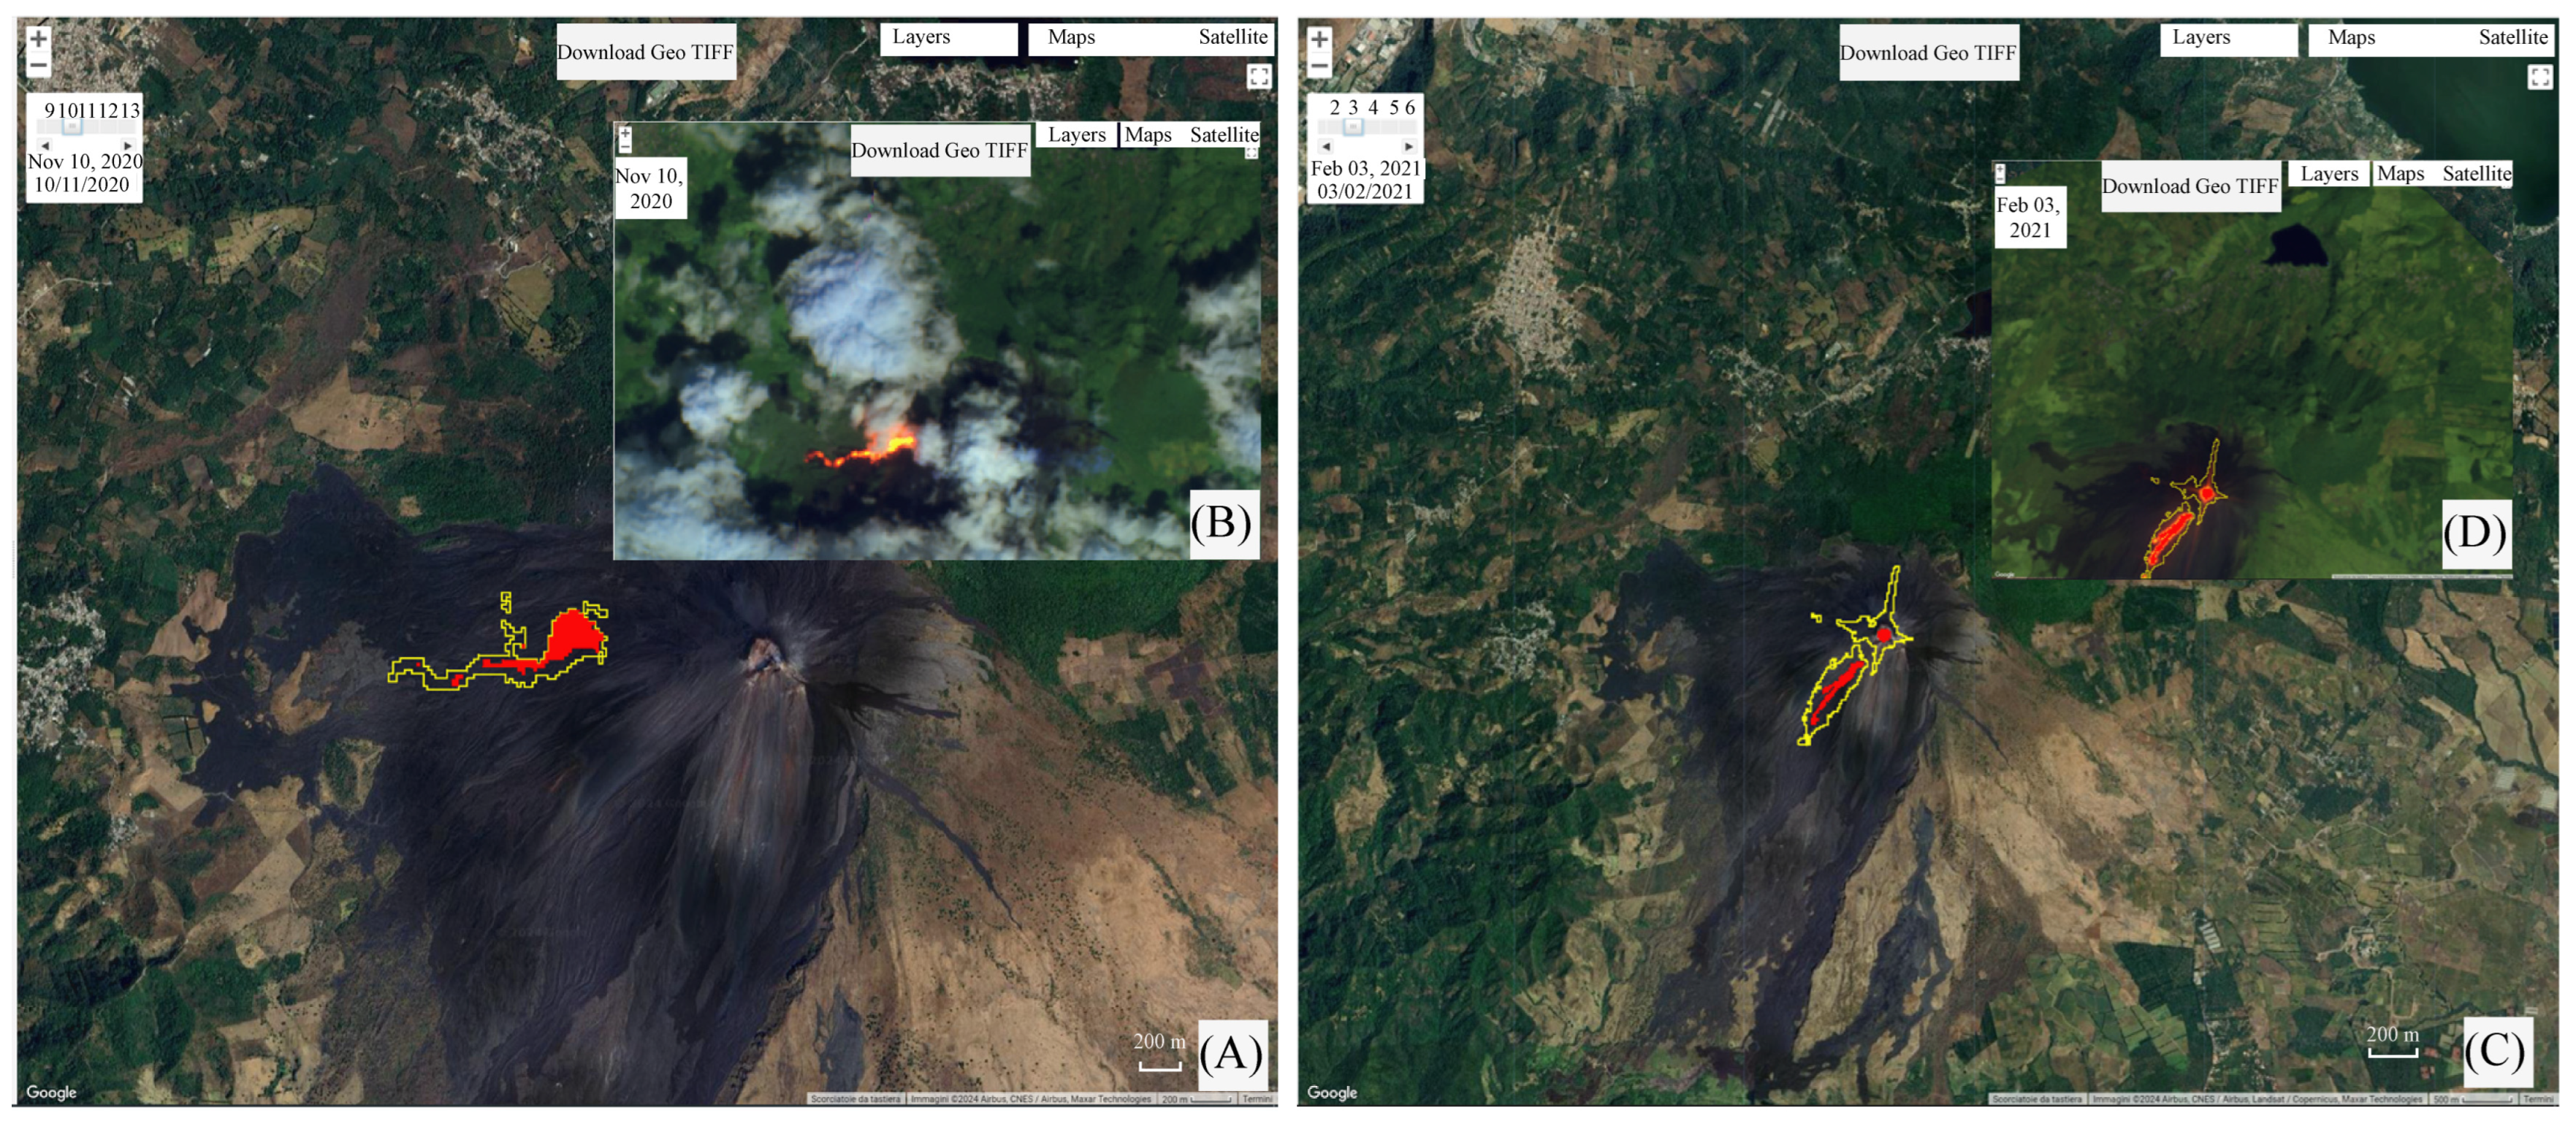
4.2. Lava Flow Monitoring and Mapping

Sentinel-2 MSI imagery combined with the Random Forest model enables effective mapping and monitoring of lava-inundated areas. We present two case studies: the December 2018 eruption of Mount Etna (Italy) and the January–February 2023 eruption of Kīlauea (Hawaii).
One of the most recent lateral eruptions of Etna occurred in December 2018 [39,57,58]. From 21 November 2018, thermal anomalies were observed at the Southeast Crater in the summit area. On 8 December 2018, Strombolian activity began at both the Southeast Crater and Bocca Nuova crater in the summit area [INGV-OE, Bollettino Etna settimanale di dicembre 2018; Rep. N. 50/2018 ETNA. Available online: www.ct.ingv.it (accessed on 2 February 2025)]. On the morning of 24 December 2018, a new lateral eruption began. This event was characterized by the intrusion of a magmatic dike into the volcano’s upper eastern flank, which triggered a strong seismic swarm and notable ground deformation [INGV-OE, Rep. N. 53/2018 ETNA]. The lateral eruption ended on 27 December 2018 [39,57,58], although thermal anomalies associated with the cooling lava flow remained visible until 29 December 2018 (Figure 4). V-STAR detected the beginning and end of the lateral eruption. The results show the thermal anomaly area seen on 24 December (0.12 km2) associated with the emplacement of the lava flow in the first phase of the lateral eruption (Figure 4A). The end of the effusive activity was assessed on 27 December, when the cooling lava flow was shown with a residual thermal anomaly area of 0.28 km2 (Figure 4B), indicating rapid flow development. The V-STAR application also allows users to download thermal anomaly maps in GeoTIFF format, which can be directly imported into GIS platforms, such as QGIS. As shown in Figure 5, the lava flow can be visualized over a digital elevation model (DEM) of Etna, enabling users to track its progression over time and produce real-time geological maps.
The second case study focuses on the latest reactivation of the lava lake at Halema’uma’u Crater, located at the summit of Kīlauea. The eruption began on 5 January 2023 and ended on 19 February 2023 (Hawaiian Volcano Observatory—https://www.usgs.gov/observatories/hvo (accessed on 2 October 2024). The lava coverage was monitored by integrating Sentinel-2 MSI observations with the Random Forest classification. The first cloud-free image, acquired on 7 January 2023, revealed a thermal anomaly corresponding to the active lava lake, with an estimated surface area of 1.7 km2 (Figure 6A). After five days, on 12 January, the thermal anomaly had reduced to 0.89 km2 (Figure 6B). On 6 February, the last cloud-free image prior to the end of the eruption revealed a renewed increase in activity, with the affected area reaching approximately 1.08 km2 (Figure 6C).
These results confirm the potential of the V-STAR system to provide high-resolution, time-sensitive mapping of lava flows, which is critical for hazard assessment, response planning, and updating volcanic geodatabases.

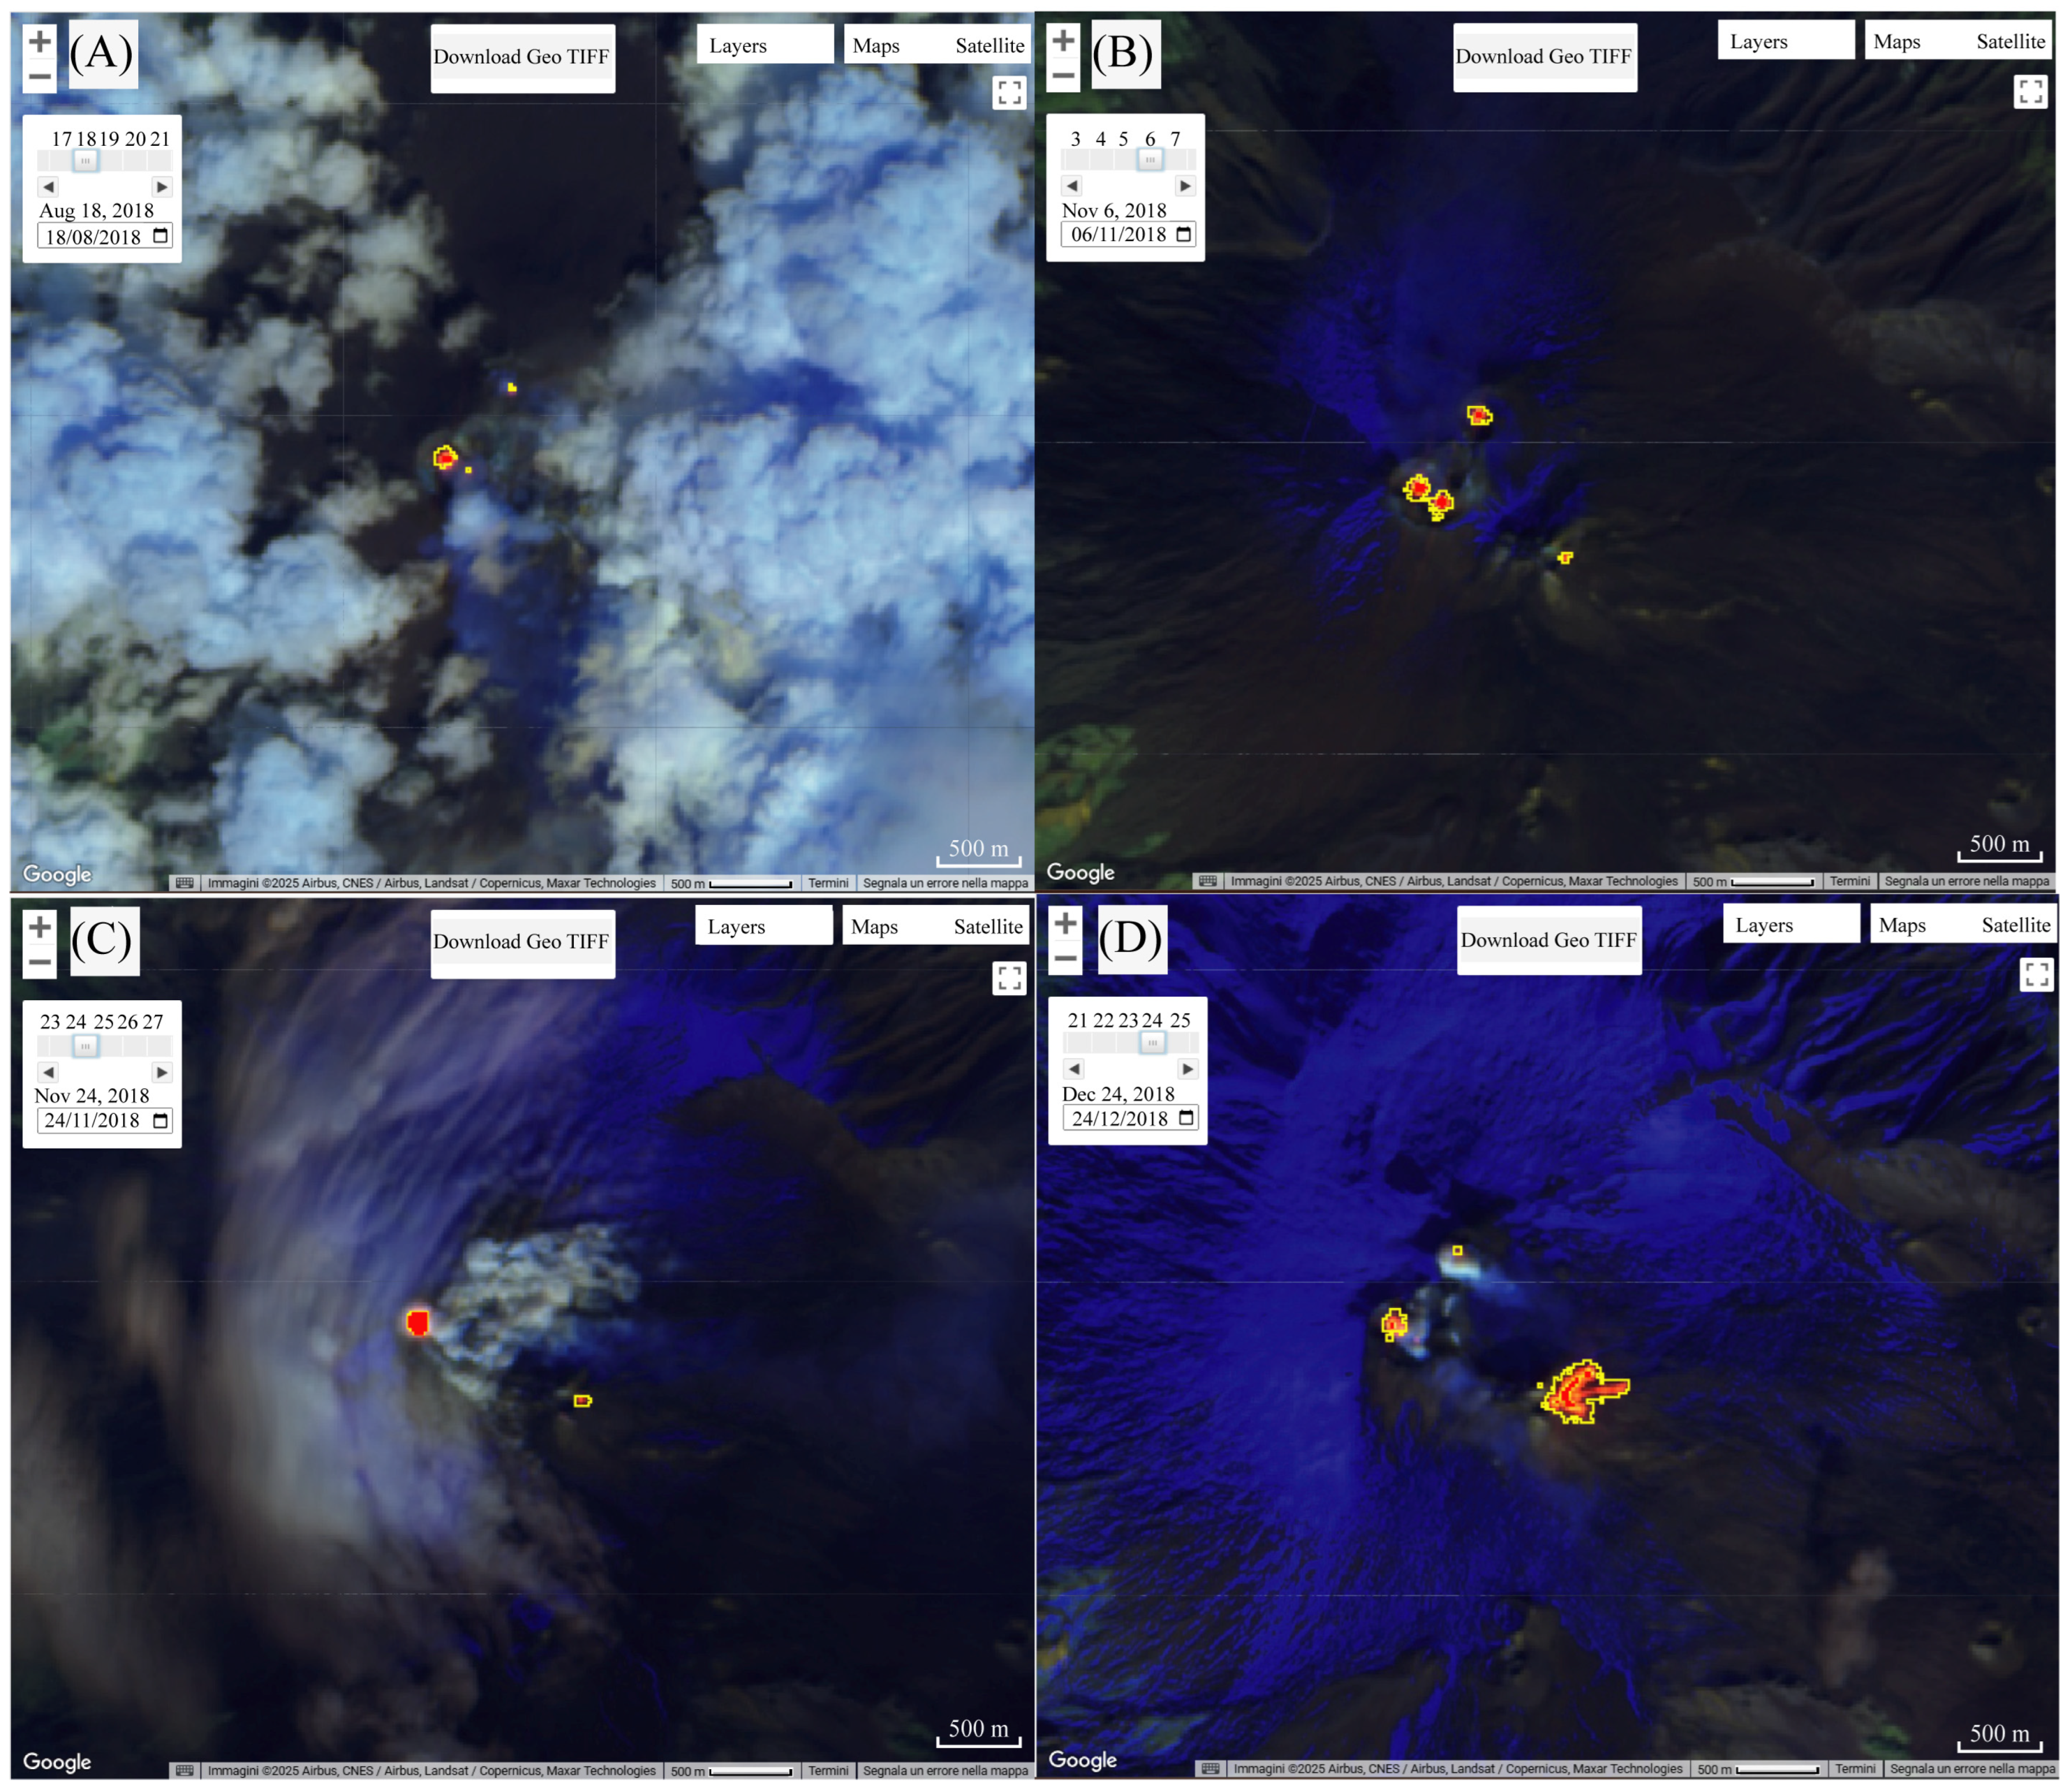
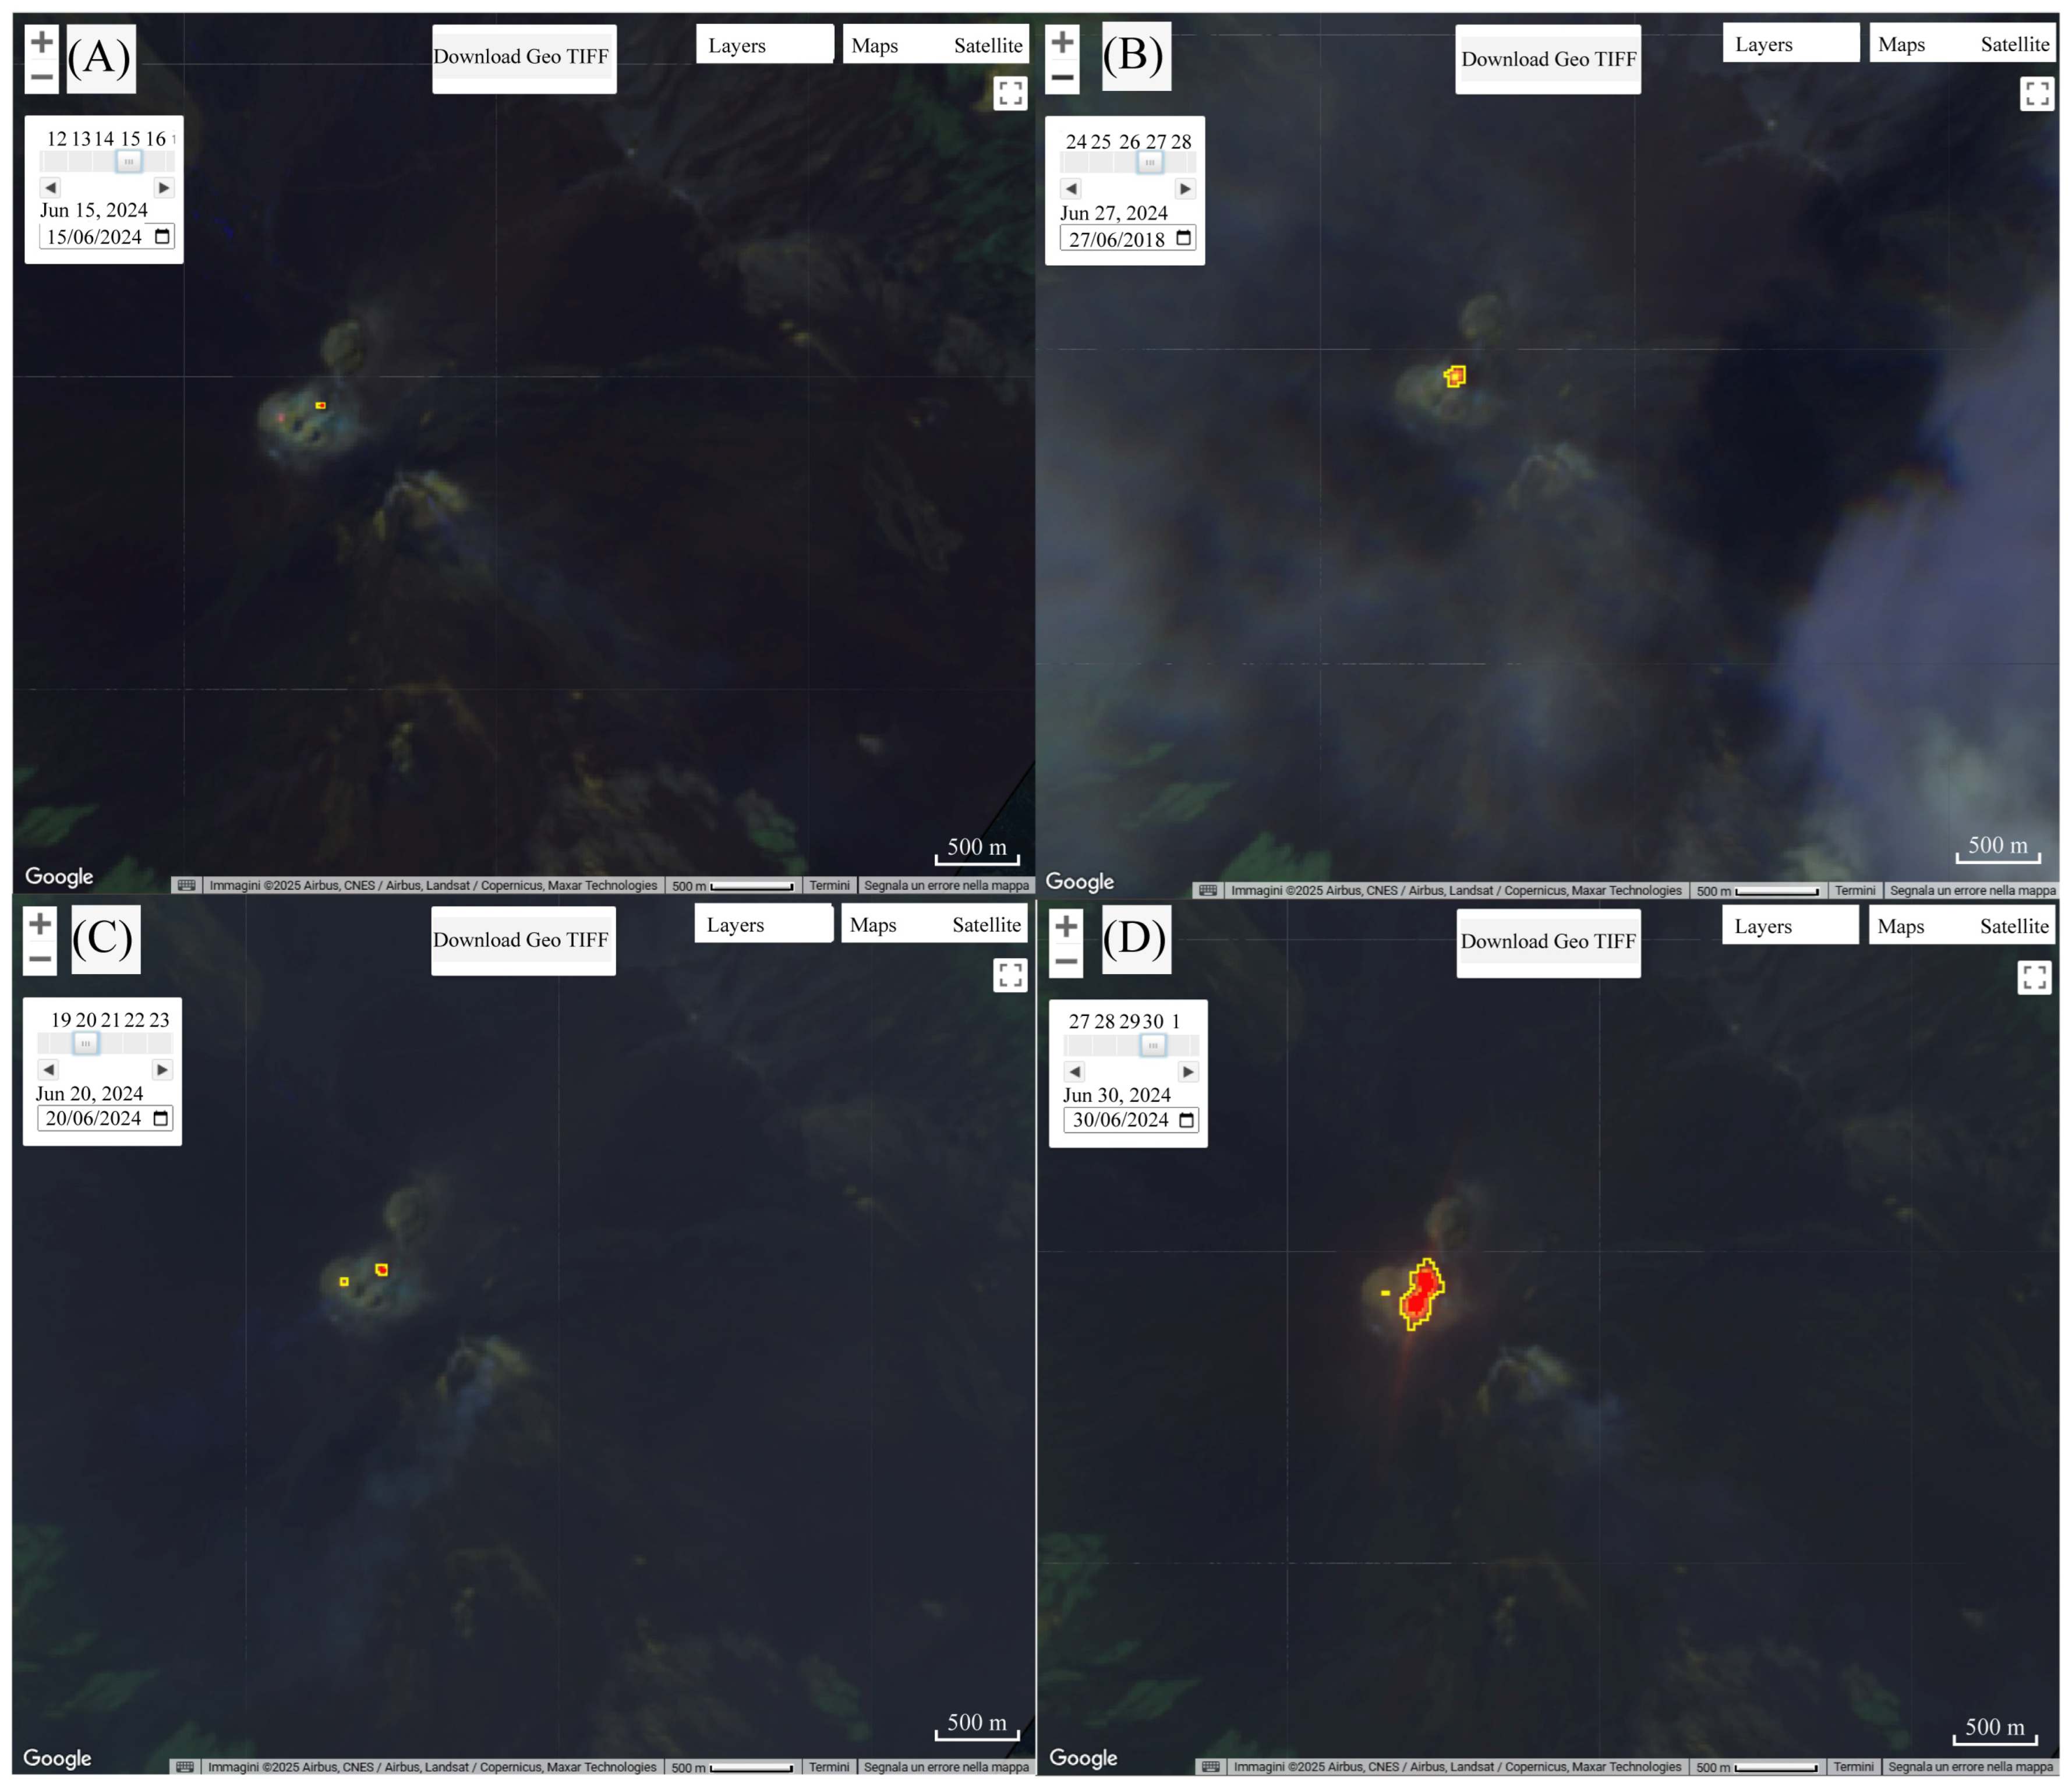
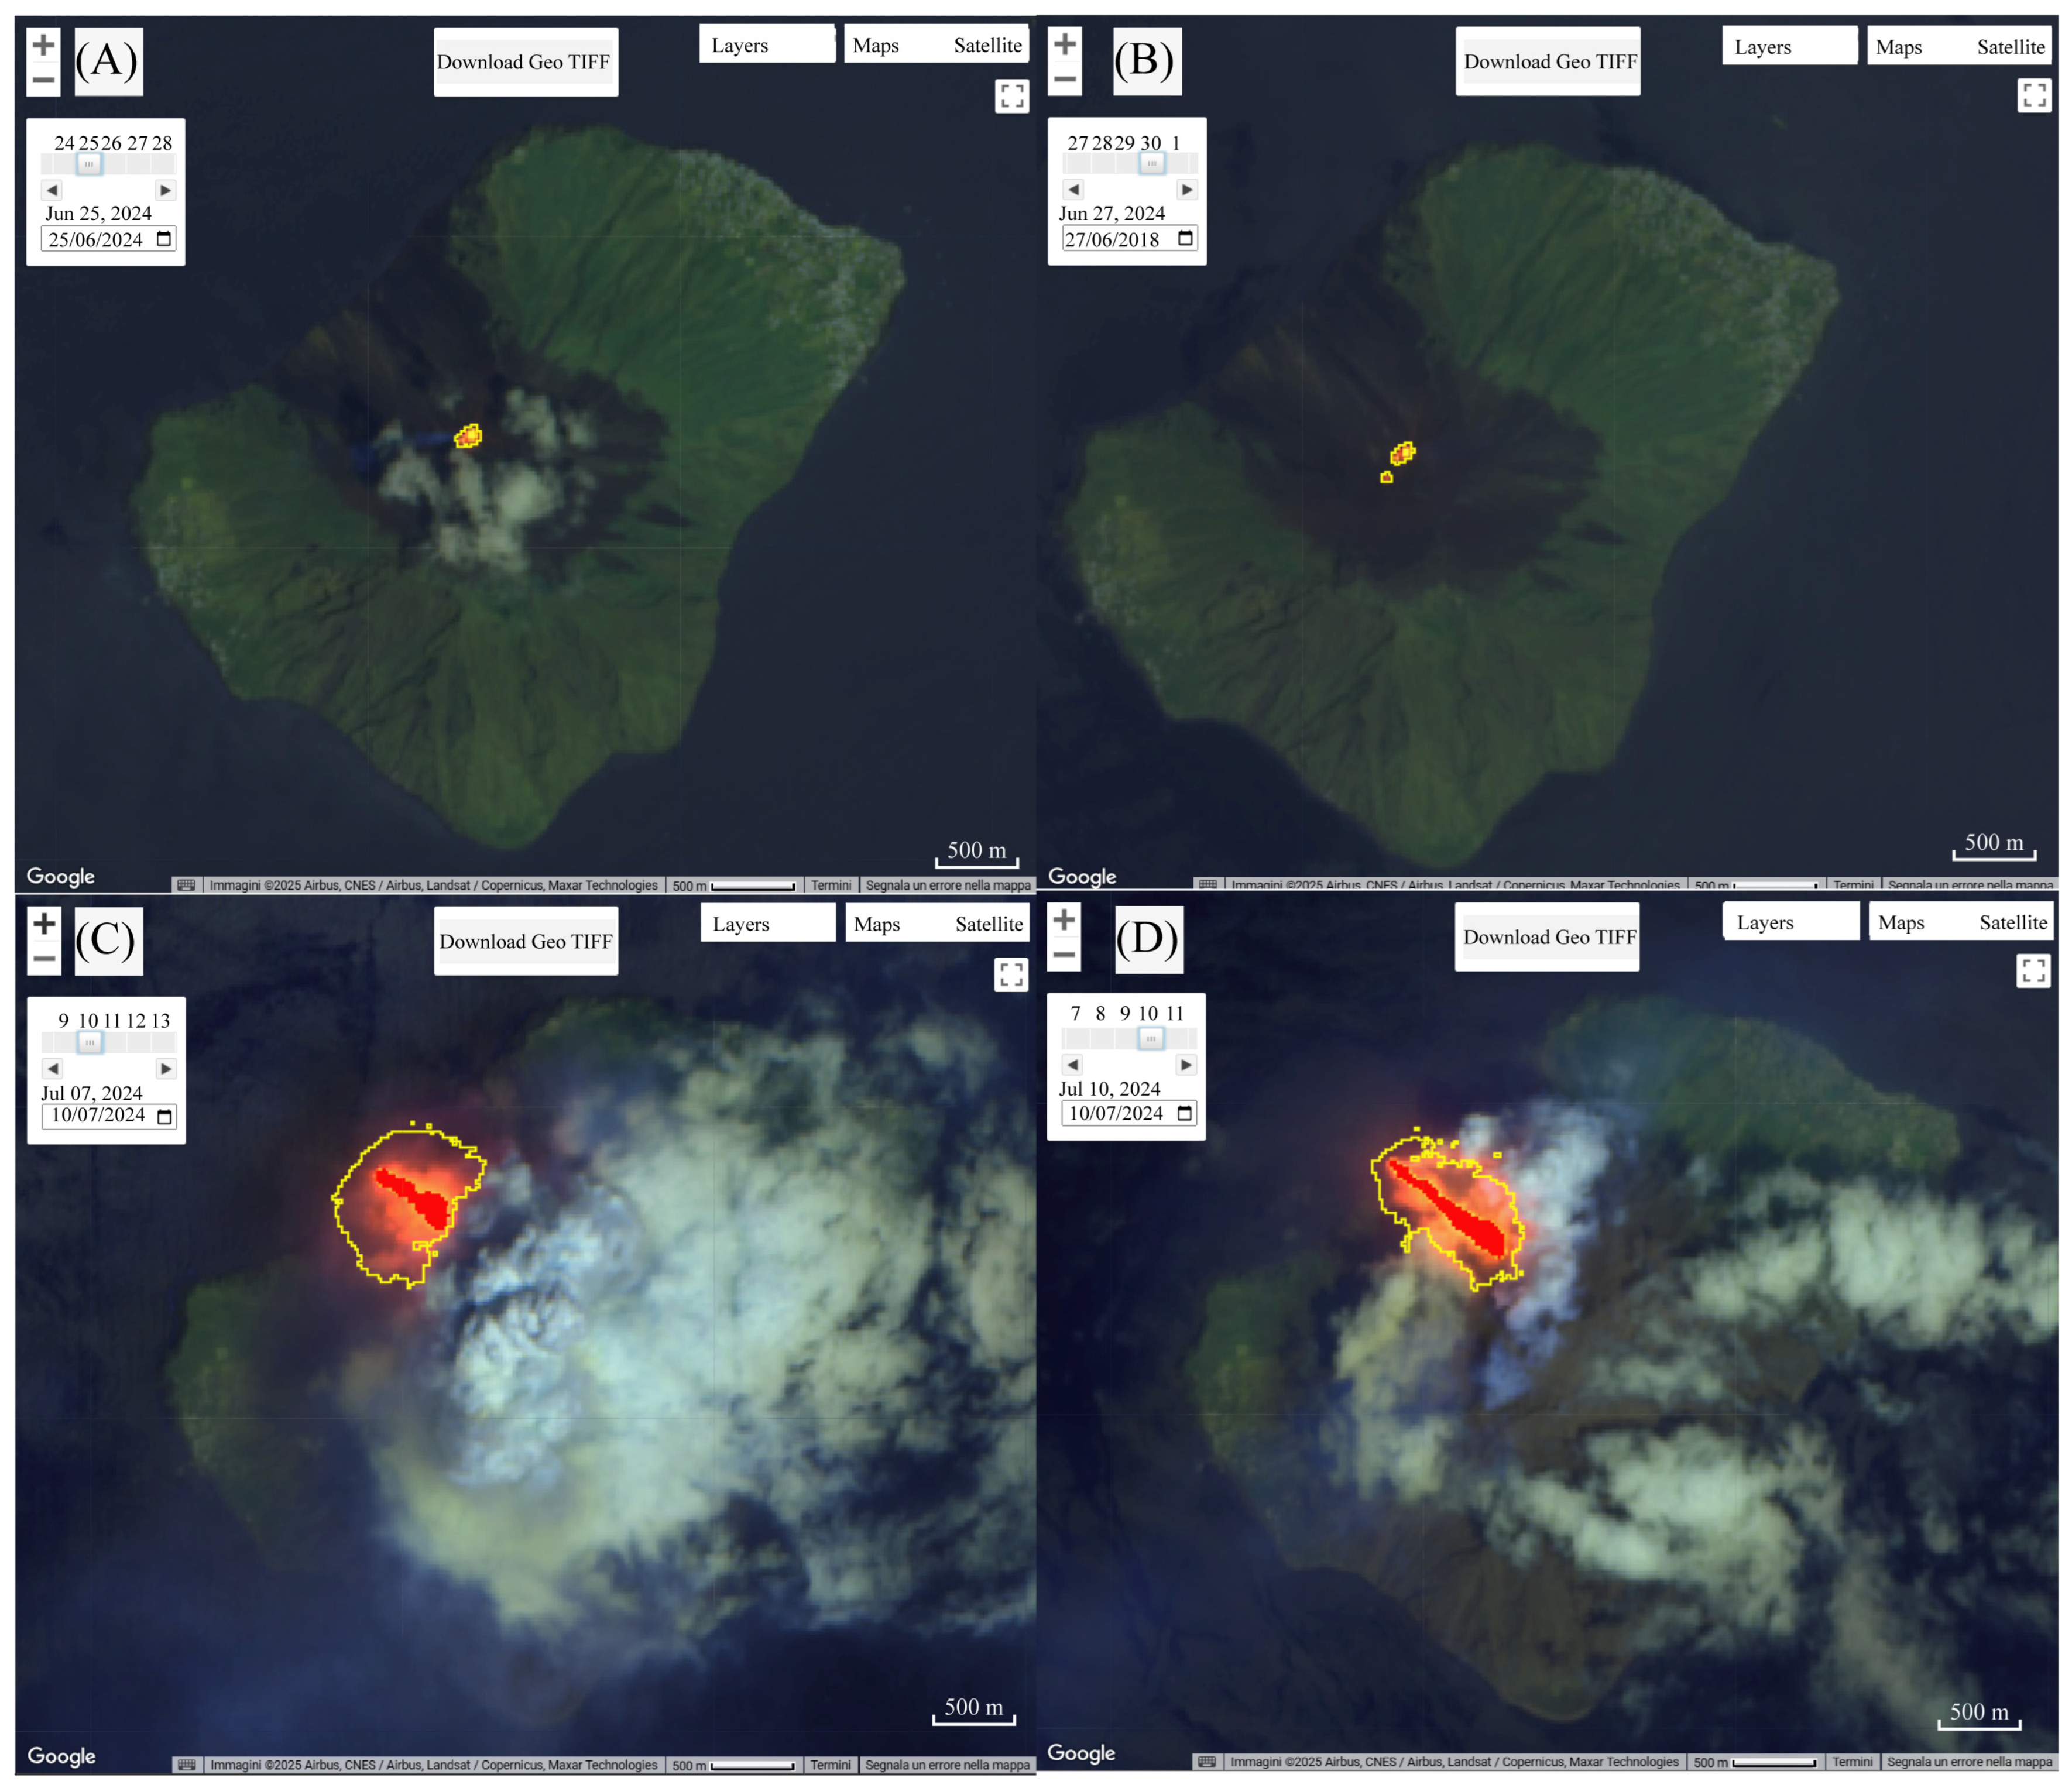
4.3. Localization of Active Vents and Thermal Anomaly Assessment

Accurate localization of active vents, identification of reactivation phases, and assessment of thermal anomalies reported by other systems are among the most relevant capabilities offered by the V-STAR application. This section presents three illustrative cases: the reactivation of Bocca Nuova crater in the summit area of Etna volcano (Italy) in 2018, the reactivation of the Voragine crater (also in the summit area of Etna) in 2024, and the paroxysmal event at Stromboli (Aeolian Islands, Italy) in 2024.
Figure 7 illustrates the potential of the system, showing thermal anomaly maps derived from Sentinel-2 MSI data between August and December 2018 for the Mt. Etna summit area. A marked increase in the areal extent of thermal anomalies at Bocca Nuova (BN) is observed starting in August 2018 (Figure 7A), associated with intensified degassing and intermittent Strombolian activity. At that time, two pit craters, BN1 and BN2, were present inside the Bocca Nuova crater. This Strombolian phase is followed by the reactivation of BN2 (Figure 7B), characterized by sustained gas emissions, discontinuous Strombolian explosions, and several localized high-temperature gas venting points. Subsequently, the fusion of BN1 and BN2 into a single, thermally active Bocca Nuova vent is evident (Figure 7C), culminating in increased intracrater activity shortly before the 24 December 2018 eruption (Figure 7D). This event was marked by violent Strombolian activity and copious ash emissions [INGV-OE, Bollettino settimanale di Etna di Dicembre 2018; Rep. N. 53/2018 ETNA. Available online: www.ct.ingv.it (accessed on 2 February 2025)].
Figure 8 illustrates the potential of the system, showing thermal anomaly maps derived from Sentinel-2 MSI data in June 2024 for the Mt. Etna summit area. On the night of 13–14 June 2024, activity resumed at the Voragine crater after nearly three years of quiescence (Figure 8A) [39,59]. The initial spattering evolved into Strombolian activity over the following days (Figure 8B,C). Beginning on 29 June, an intracrateric lava flow was reported within Voragine, progressing toward the interior of Bocca Nuova, specifically toward the BN2 pit crater (Figure 8D). On 4 July, the Strombolian activity that had started in mid-June intensified significantly, accompanied by the emergence of two lava flows. These were generated by two distinct vents located on the southeastern and northwestern flanks of the scoria cone inside Voragine. A few hours later, Strombolian activity transitioned into a lava fountain episode [59].
Figure 9 illustrates the potential of the system, showing thermal anomaly maps derived from Sentinel-2 MSI data in June–July 2024 for Stromboli volcano. An intense eruptive phase began with a lava overflow on 23 June 2024, culminating in a paroxysmal event on 11 July 2024, which included multiple overflows, pyroclastic density currents, and debris avalanches [INGV-OE, Bollettino settimanale di Stromboli di Luglio 2024; Rep. N. 29/2024 STROMBOLI. Available online: www.ct.ingv.it (accessed on 2 February 2025)]. Following the brief lava overflow on 23 June, a second overflow was recorded on 28 June (Figure 9A,B). On 3 July, intense spattering activity in sector N1 of the northern crater culminated in the collapse of the outer cone margin overlooking the Sciara del Fuoco. This event was followed by another lava overflow from the same N1 vent, accompanied by explosive activity and spattering. On 4 July, effusive activity resumed from two eruptive vents aligned along the Sciara del Fuoco. From that date, both explosive activity and active lava flows remained visible (Figure 9C,D). On 11 July, a high-energy explosive event occurred, classifiable as paroxysmal, and was generated by the northern crater terrace area. This explosion produced pyroclastic flows with rapid, widespread expansion toward the sea.
These case studies confirm the capability of the V-STAR system to accurately identify spatially and temporally localized thermal anomalies, track vent reactivation, and support interpretation of eruptive dynamics in near-real time.

5. Discussion

V-STAR represents an innovative example of how cloud computing, combined with remote sensing and machine learning, can be used effectively for volcanic hazard monitoring [59]. Built on Google Earth Engine (GEE) and employing a supervised Random Forest (RF) algorithm, the system provides accurate and timely information on the presence and evolution of thermal anomalies, including the mapping of lava flows and active vents.
One of V-STAR’s key strengths is its generalizability. The model is adaptable to a variety of volcanic systems with different eruptive behaviors, compositions, and geological settings. This versatility makes it a valuable tool for both the scientific community and monitoring authorities, facilitating global-scale assessments and enhancing understanding of complex volcanic phenomena.
The application of the Random Forest algorithm contributes significantly to this flexibility. RF’s ability to aggregate predictions from multiple decision trees enhances the model’s robustness and precision [60,61]. However, its performance is strongly influenced by feature selection, particularly the inclusion of visible spectral bands from Sentinel-2 MSI imagery. These bands are critical for distinguishing thermally active surfaces from other components of the volcanic environment, such as vegetation, cooled lava, or ash deposits. Their contribution improves the discrimination capacity of the model by incorporating contextual and environmental information.
Our case studies have demonstrated V-STAR’s effectiveness in detecting and mapping lava flows, including eruptions at Etna, Kīlauea, Ambrym, and Stromboli. Nevertheless, several limitations emerged during our assessments. Specifically, the model occasionally overestimates the extent of lava flows or lava lakes under conditions such as the presence of refraction halos, atmospheric interference, or cloud cover. These effects can lead to the misclassification of pixels and enlargement of the mapped thermal area. These effects are reduced by considering only the red maps (refinement classification step) highlighting the hottest anomalies. Conversely, when satellite sensor passage occurs in the presence of cooling lava, V-STAR may underestimate thermal anomalies due to lower emitted radiance, which challenges detection by satellite sensors. In this case, satellite sensors with thermal bands sensitive to lower thermal features would be needed. These effects are well illustrated in the case of Pacaya volcano (Guatemala), which has exhibited variable activity since 2016, including phases of intense eruptive behavior during 2020–2021. V-STAR successfully captured the evolution of thermal anomalies during this period but also revealed instances of overestimation and underestimation. Figure 10 shows a clear increase in thermal activity at Pacaya, particularly between 2020 and 2021. On 5 March 2021, a peak anomaly area of 1,532,400 m2 was recorded (Figure 11). This value corresponds to the entire yellow-mapped region produced by the algorithm, which may include artifacts induced by halo effects or partial cloud contamination [62,63]. In Figure 12, the difference between the raw Sentinel-2 imagery (Figure 12A) and the thermal anomaly map (Figure 12B) is evident. The presence of halos is particularly pronounced in the satellite scene. By considering only the red-mapped area, which represents the hottest pixels, the estimated lava flow area is significantly reduced to 273,200 m2, with 683 hot pixels identified—likely closer to the actual thermal extent.
To improve detection accuracy, two main strategies should be considered: the integration of multisensor data and remote sensing data fusion (RSDF) techniques, and the use of spatial features associated with volcanic thermal activity [15,64,65].
Data fusion involves the combination of heterogeneous information from multiple sources, such as sensors operating at different spectral, spatial, and temporal resolutions, to derive a more complete and reliable characterization of volcanic processes. For example, V-STAR already exploits thermal and visible bands to enhance classification performance. The integration of additional data sources, such as thermal infrared from MODIS or VIIRS, or SAR data from Sentinel-1, would further increase system robustness. As discussed in [66], RSDF techniques improve object detection, change detection, and tracking by combining complementary information. These methods enhance the quality of input data and allow the generation of fused datasets that outperform individual sources in both resolution and interpretability.
Volcanic activity often generates spatial patterns, such as thermal anomalies, gas emissions, and thermal gradients near craters, which help differentiate true signals from background noise or artefacts induced by atmospheric effects, terrain variability, or sensor limitations [67]. Beyond data fusion, incorporating spatial features like texture, edge orientation, and pixel neighborhood relationships has proven essential for improving classification accuracy. However, manually extracting such descriptors is often suboptimal in complex, dynamic environments.
For example, convolutional neural networks (CNNs) are specifically designed to capture spatial hierarchies of patterns through layers of convolutional filters [68,69]. Training a CNN allows the model to automatically learn the most discriminative spatial features directly from the data, without any a priori assumptions about what those features should be. This adaptive capability is particularly beneficial in volcanic environments, where the spatial morphology of thermal anomalies may vary significantly from one eruption or volcano to another [15,70]. RSDF strategies combined with CNN approaches enable a more nuanced, accurate, and resilient detection pipeline, ultimately contributing to more effective monitoring in volcanic regions [64,65].
V-STAR’s adaptability across various volcanic settings is another notable strength. The platform has proven effective for both persistently active systems (e.g., Etna, Stromboli, Kīlauea) and intermittently active or dome-building volcanoes (e.g., Santiaguito, Lascar, Shiveluch). Its performance in different geological and atmospheric contexts further confirms the robustness of the RF-based approach, even in the presence of complicating factors, such as clouds, ash plumes, or topographic shadowing. The Pacaya volcano case further reinforces the importance of refining detection strategies. Although the model was able to capture and map elevated thermal activity, it also showed the limits of pixel-based classification in complex atmospheric conditions. This underscores the need for continued refinement of the algorithm, including the possible integration of cloud masking algorithms, confidence layers, or multi-temporal smoothing filters.
Finally, V-STAR demonstrates the potential of integrating cloud computing, remote sensing, and machine learning into a flexible and operational tool for volcanic thermal anomaly detection. The system offers a valuable contribution to volcanic hazard monitoring, supporting rapid mapping, early warning, and scientific research. Its scalability, adaptability, and potential for further enhancement through data fusion positions it as a forward-looking solution for global volcanic risk mitigation.

6. Conclusions

V-STAR is an innovative application for monitoring volcanic thermal anomalies, leveraging cloud computing and machine learning, specifically the Random Forest method, to analyze and map complex eruptive phenomena. Developed within the Google Earth Engine (GEE) environment, V-STAR enables fast, scalable, and accurate assessments of volcanic thermal activity by processing multispectral satellite imagery in near-real time. Its versatility makes it a highly adaptable tool for a wide range of volcanic contexts, including both effusive and explosive systems, and ensures precise and reliable analysis, even in remote or data-scarce regions.
The application has proven effective in detecting and mapping subtle thermal anomalies, down to detailed lava flow outlines, as exemplified by the case study of Pacaya volcano. Through time-series analysis and visual inspection of mapped anomalies, V-STAR has demonstrated its capacity to capture the onset, evolution, and decline of eruptive episodes. Its ability to track both intracrateric activity and lateral lava flows enhances its value for hazard assessment and rapid response. However, some discrepancies were observed, such as the overestimation of thermal anomalies in the presence of refraction halos or cloud cover, and underestimation of emplaced lava flows when satellite sensor passage occurred during the cooling phases of lava, when thermal emissions weaken. While the former was fixed with second-step mapping based on clustering classification (refinement classification step), the latter is not model-related but data related. These limitations underscore the importance of ongoing V-STAR refinement, particularly through (a) the use of spatial features associated with volcanic thermal activity and (b) the integration of data from multiple satellite platforms and the adoption of remote sensing data fusion techniques. Such enhancements would enable the combination of diverse spectral, spatial, and temporal data sources, leading to more robust and comprehensive volcanic monitoring products.
Future improvements may also focus on the automatic definition of the region of interest (ROI), allowing the system to better adapt to volcano-specific thermal behavior and topographic settings. This could involve the use of historical thermal anomaly patterns, digital elevation models to delineate crater rims and flanks, and machine learning techniques, such as clustering or convolutional neural networks, to dynamically identify and track active zones.
V-STAR’s approach contributes significantly to both the scientific community and operational volcanic surveillance, fostering a better understanding of volcanic processes on a global scale. Its intuitive interface, automated classification, and exportable outputs make it suitable not only for researchers but also for civil protection agencies and decision-makers involved in risk mitigation.
Thanks to its adaptability to diverse geological scenarios and its capability to analyze multispectral satellite data with high spatial resolution, V-STAR represents a concrete step forward in the technological evolution of volcanic monitoring. With continued development, such as integrating additional sensors, refining classification algorithms, and incorporating contextual geophysical data, this tool has the potential to become a key component in the early detection and mitigation of volcanic hazards worldwide.
The tool is freely accessible online through the TechnoLab webpage, at the following URL: https://www.ct.ingv.it/technolab/v-star.

Author Contributions

Conceptualization, C.C. and S.C.; methodology, C.C. and S.C.; software, S.C. and C.C.; validation, A.B.M., S.C. and C.C.; formal analysis, S.C.; investigation, C.C.; resources, C.D.N.; data curation, S.C. and A.B.M.; writing—original draft preparation, S.C., A.B.M., C.C. and C.D.N.; writing—review and editing, S.C., A.B.M., C.C. and C.D.N.; visualization, S.C.; supervision, C.C. and C.D.N.; project administration, C.C. and C.D.N.; funding acquisition, C.D.N. All authors have read and agreed to the published version of the manuscript.

Funding

This research was supported by the DEMETRA research line of the Earth Telescope Programme, under the ROSE infrastructural project of INGV (OB.FU.: 1215.010), funded by the Italian Ministry of University and Research.

Data Availability Statement

The data presented in this study are available on request from the corresponding author.

Acknowledgments

This work was developed within the framework of the Laboratory of Technologies for Volcanology (TechnoLab) at the INGV in Catania (Italy). Note: Google CoLaboratory™ is a trademark of Google LLC—©2018 Google LLC. All rights reserved. We thank European Space Agency for providing the data.

Conflicts of Interest

The authors declare no conflict of interest.

References

  1. Bevilacqua, A.; Pitman, E.B.; Patra, A.; Neri, A.; Bursik, M.; Voight, B. Probabilistic enhancement of the Failure Forecast Method using a stochastic differential equation and application to volcanic eruption forecasts. Front. Earth Sci. 2019, 7, 135. [Google Scholar] [CrossRef]
  2. Harris, A. Thermal Remote Sensing of Active Volcanoes: A User’s Manual; Cambridge University Press: Cambridge, UK, 2013. [Google Scholar]
  3. Ganci, G.; Cappello, A.; Bilotta, G.; Del Negro, C. How the variety of satellite remote sensing data over volcanoes can assist hazard monitoring efforts: The 2011 eruption of Nabro volcano. Remote Sens. Environ. 2020, 236, 111426. [Google Scholar] [CrossRef]
  4. HOTSAT: A Multiplatform System for the Thermal Monitoring of Volcanic Activity Using Satellite Data; Geological Society: London, UK, 2016. [CrossRef]
  5. Abrams, M.; Abbott, E.; Kahle, A. Combined use of visible, reflected infrared, and thermal infrared images for mapping Hawaiian lava flows. J. Geophys. Res. Solid Earth 1991, 96, 475–484. [Google Scholar] [CrossRef]
  6. Corradino, C.; Ganci, G.; Bilotta, G.; Cappello, A.; Del Negro, C.; Fortuna, L. Smart Decision Support Systems for Volcanic Applications. Energies 2019, 12, 1216. [Google Scholar] [CrossRef]
  7. Patrick, M.R.; Kauahikaua, J.; Orr, T.; Davies, A.; Ramsey, M. Operational Thermal Remote Sensing and Lava Flow Monitoring at the Hawaiian Volcano Observatory; Geological Society: London, UK, 2016; Volume 426, pp. 489–503. [Google Scholar] [CrossRef]
  8. Cariello, S.; Corradino, C.; Del Negro, C. How artificial intelligence can enhance monitoring of volcanoes from space. Il Nuovo Cimento 2024, 100, 47. [Google Scholar]
  9. Pergola, N.; D’Angelo, G.; Lisi, M.; Marchese, F.; Mazzeo, G.; Tramutoli, V. Time Domain Analysis of Robust Satellite Techniques (RST) for Near Real-Time Monitoring of Active Volcanoes and Thermal Precursor Identification. Phys. Chem. Earth 2009, 34, 380–385. [Google Scholar] [CrossRef]
  10. Spinetti, C.; Mazzarini, F.; Casacchia, R.; Colini, L.; Neri, M.; Behncke, B.; Salvatori, R.; Buongiorno, M.F.; Pareschi, M.T. Spectral properties of volcanic materials from hyperspectral field and satellite data compared with LiDAR data at Mt. Etna. Int. J. Appl. Earth Obs. Geoinf. 2009, 11, 142–155. [Google Scholar] [CrossRef]
  11. Ganci, G.; Vicari, A.; Cappello, A.; Del Negro, C. An Emergent Strategy for Volcano Hazard Assessment: From Thermal Satellite Monitoring to Lava Flow Modeling—ScienceDirect. Remote Sens. Environ. 2012, 119, 197–207. [Google Scholar] [CrossRef]
  12. Calvari, S.; Di Traglia, F.; Ganci, G.; Giudicepietro, F.; Macedonio, G.; Cappello, A.; Nolesini, T.; Pecora, E.; Bilotta, G.; Centorrino, V.; et al. Overflows and pyroclastic density currents in March-April 2020 at Stromboli volcano detected by remote sensing and seismic monitoring data. Remote Sens. 2020, 12, 3010. [Google Scholar] [CrossRef]
  13. Torrisi, F.; Corradino, C.; Cariello, S.; Del Negro, C. Enhancing detection of volcanic ash clouds from space with convolutional neural networks. J. Volcanol. Geotherm. Res. 2024, 448, 108046. [Google Scholar] [CrossRef]
  14. Cariello, S.; Corradino, C.; Torrisi, F.; Del Negro, C. Cascading Machine Learning to Monitor Volcanic Thermal Activity Using Orbital Infrared Data: From Detection to Quantitative Evaluation. Remote Sens. 2023, 16, 171. [Google Scholar] [CrossRef]
  15. Corradino, C.; Jouve, P.; La Spina, A.; Del Negro, C. Monitoring Earth’s atmosphere with Sentinel-5 TROPOMI and Artificial Intelligence: Quantifying volcanic SO2 emissions. Remote Sens. Environ. 2024, 315, 114463. [Google Scholar] [CrossRef]
  16. Ray, S.; de Sarkar, A. Execution analysis of load balancing algorithms in cloud computing environment. Int. J. Cloud Comput. Serv. Archit. 2012, 2, 1–13. [Google Scholar]
  17. Sether, A. Cloud Computing Benefits; Social Science Research Network: Rochester, NY, USA, 2016; p. 2781593. [Google Scholar] [CrossRef]
  18. Amani, M.; Ghorbanian, A.; Ahmadi, S.A.; Kakooei, M.; Moghimi, A.; Mirmazloumi, S.M.; Moghaddam, S.H.A.; Mahdavi, S.; Ghahremanloo, M.; Parsian, S.; et al. Google earth engine cloud computing platform for remote sensing big data applications: A comprehensive review. IEEE J. Sel. Top. Appl. Earth Obs. Remote Sens. 2020, 13, 5326–5350. [Google Scholar] [CrossRef]
  19. Gorelick, N.; Hancher, M.; Dixon, M.; Ilyushchenko, S.; Thau, D.; Moore, R. Google Earth Engine: Planetary-scale geospatial analysis for everyone. Remote Sens. Environ. 2017, 202, 18–27. [Google Scholar] [CrossRef]
  20. Carneiro, T.; Da Nobrega, R.V.M.; Nepomuceno, T.; Bian, G.-B.; De Albuquerque, V.H.C.; Filho, P.P.R. Performance Analysis of Google Colaboratory as a Tool for Accelerating Deep Learning Applications. IEEE Access 2018, 6, 61677–61685. [Google Scholar] [CrossRef]
  21. Tramutoli, V.; Filizzola, C.; Genzano, N.; Lisi, M. Robust Satellite Techniques for Detecting Preseismic Thermal Anomalies. In Pre-Earthquake Processes; American Geophysical Union (AGU): Washington, DC, USA, 2018; pp. 241–258. [Google Scholar] [CrossRef]
  22. Steffke, A.M.; Harris, A.J.L. A review of algorithms for detecting volcanic hot spots in satellite infrared data. Bull. Volcanol. 2011, 73, 1109–1137. [Google Scholar] [CrossRef]
  23. Hua, L.; Shao, G. The progress of operational forest fire monitoring with infrared remote sensing. J. For. Res. 2017, 28, 215–229. [Google Scholar] [CrossRef]
  24. Giglio, L.; Schroeder, W.; Justice, C.O. The collection 6 MODIS active fire detection algorithm and fire products. Remote Sens. Environ. 2016, 178, 31–41. [Google Scholar] [CrossRef]
  25. Higgins, J.; Harris, A. VAST: A program to locate and analyse volcanic thermal anomalies automatically from remotely sensed data. Comput. Geosci. 1997, 23, 627–645. [Google Scholar] [CrossRef]
  26. Corradino, C.; Ganci, G.; Cappello, A.; Bilotta, G.; Hérault, A.; Del Negro, C. Mapping Recent Lava Flows at Mount Etna Using Multispectral Sentinel-2 Images and Machine Learning Techniques. Remote Sens. 2019, 11, 1916. [Google Scholar] [CrossRef]
  27. Anantrasirichai, N.; Biggs, J.; Albino, F.; Hill, P.; Bull, D. Application of Machine Learning to Classification of Volcanic Deformation in Routinely Generated InSAR Data. J. Geophys. Res. Solid Earth 2018, 123, 6592–6606. [Google Scholar] [CrossRef]
  28. Lary, D.J.; Alavi, A.H.; Gandomi, A.H.; Walker, A.L. Machine learning in geosciences and remote sensing. Geosci. Front. 2016, 7, 3–10. [Google Scholar] [CrossRef]
  29. Amato, E.; Corradino, C.; Torrisi, F.; Del Negro, C. A Deep Convolutional Neural Network for Detecting Volcanic Thermal Anomalies from Satellite Images. Remote Sens. 2023, 15, 3718. [Google Scholar] [CrossRef]
  30. Tello, J.F.G.; Coltelli, M.; Marsella, M.; Celauro, A.; Baena, J.A.P. Convolutional Neural Network Algorithms for Semantic Segmentation of Volcanic Ash Plumes Using Visible Camera Imagery. Remote Sens. 2022, 14, 4477. [Google Scholar] [CrossRef]
  31. Lüdtke, A.; Jerosch, K.; Herzog, O.; Schlüter, M. Development of a Machine Learning Technique for Automatic Analysis of Seafloor Image Data: Case Example, Pogonophora Coverage at Mud Volcanoes. Comput. Geosci. 2012, 39, 120–128. [Google Scholar] [CrossRef]
  32. Desani, N.R.; Chittibala, D.R. Adaptive Machine Learning Models for Real-Time Anomaly Detection in Streaming Data. Int. J. Inf. Technol. Manag. Inf. Syst. 2021, 12, 57–62. [Google Scholar]
  33. Coppola, D.; Marco, L.; Massimetti, F.; Hainzl, S.; Shevchenko, A.V.; Mania, R.; Shapiro, M.N.; Walter, T.R. Thermal remote sensing reveals communication between volcanoes of the Klyuchevskoy Volcanic Group. Sci. Rep. 2021, 11, 13090. [Google Scholar] [CrossRef]
  34. Murphy, S.W.; Oppenheimer, C.; Filho, C.R.d.S. Calculating radiant flux from thermally mixed pixels using a spectral library. Remote Sens. Environ. 2014, 142, 83–94. [Google Scholar] [CrossRef]
  35. Coppola, D.; Laiolo, M.; Cigolini, C.; Massimetti, F.; Delle Donne, D.; Ripepe, M.; Arias, H.; Barsotti, S.; Parra, C.B.; Centeno, R.G.; et al. Thermal Remote Sensing for Global Volcano Monitoring: Experiences From the MIROVA System. Front. Earth Sci. 2020, 7, 362. [Google Scholar] [CrossRef]
  36. SValade, S.; Ley, A.; Massimetti, F.; D’hondt, O.; Laiolo, M.; Coppola, D.; Loibl, D.; Hellwich, O.; Walter, T.R. Towards Global Volcano Monitoring Using Multisensor Sentinel Missions and Artificial Intelligence: The MOUNTS Monitoring System. Remote Sens. 2019, 11, 1528. [Google Scholar] [CrossRef]
  37. Genzano, N.; Pergola, N.; Marchese, F. A Google Earth Engine Tool to Investigate, Map and Monitor Volcanic Thermal Anomalies at Global Scale by Means of Mid-High Spatial Resolution Satellite Data. Remote Sens. 2020, 12, 3232. [Google Scholar] [CrossRef]
  38. Corradino, C.; Amato, E.; Torrisi, F.; Del Negro, C. Data-Driven Random Forest Models for Detecting Volcanic Hot Spots in Sentinel-2 MSI Images. Remote Sens. 2022, 14, 4370. [Google Scholar] [CrossRef]
  39. Andronico, D.; Cannata, A.; Di Grazia, G.; Ferrari, F. The 1986–2021 paroxysmal episodes at the summit craters of Mt. Etna: Insights into volcano dynamics and hazard. Earth-Sci. Rev. 2021, 220, 103686. [Google Scholar] [CrossRef]
  40. Rosi, M.; Bertagnini, A.; Landi, P. Onset of the persistent activity at Stromboli Volcano (Italy). Bull. Volcanol. 2000, 62, 294–300. [Google Scholar] [CrossRef]
  41. Ozerov, A.Y. The evolution of high-alumina basalts of the Klyuchevskoy volcano, Kamchatka, Russia, based on microprobe analyses of mineral inclusions. J. Volcanol. Geotherm. Res. 2000, 95, 65–79. [Google Scholar] [CrossRef]
  42. Gorbach, N.; Portnyagin, M.; Tembrel, I. Volcanic structure and composition of Old Shiveluch volcano, Kamchatka. J. Volcanol. Geotherm. Res. 2013, 263, 193–208. [Google Scholar] [CrossRef]
  43. Tassi, F.; Aguilera, F.; Vaselli, O.; Medina, E.; Tedesco, D.; Delgado Huertas, A.; Poreda, R.; Kojima, S. The magmatic- and hydrothermal-dominated fumarolic system at the Active Crater of Lascar volcano, northern Chile. Bull. Volcanol. 2009, 71, 171–183. [Google Scholar] [CrossRef]
  44. Matthews, S.J.; Gardeweg, M.C.; Sparks, R.S.J. The 1984 to 1996 cyclic activity of Lascar Volcano, northern Chile: Cycles of dome growth, dome subsidence, degassing and explosive eruptions. Bull. Volcanol. 1997, 59, 72–82. [Google Scholar] [CrossRef]
  45. Gómez-Vazquez, A.; De la Cruz-Reyna, S.; Mendoza-Rosas, A.T. The ongoing dome emplacement and destruction cyclic process at Popocatépetl volcano, Central Mexico. Bull. Volcanol. 2016, 78, 58. [Google Scholar] [CrossRef]
  46. Volcanic Processes and Human Exposure as Elements to Build a Risk Model for Volcan de Fuego, Guatemala—ProQuest. Available online: https://www.proquest.com/openview/e4ac0ac98a5fa2a6122db7d413cba2f9/1?pq-origsite=gscholar&cbl=18750&casa_token=BreFrqQGGrUAAAAA:ecn842u15CbV71ZDfZmE0-2fZZtC87RtVVXn31XA1EHwVhhf9DkETUFEEC0x1tfnBjWUG1JttXo (accessed on 7 February 2025).
  47. Battaglia, A.; Bitetto, M.; Aiuppa, A.; Rizzo, A.; Chigna, G.; Watson, I.M.; D’Aleo, R.; Cacao, F.J.J.; de Moor, M.J. The Magmatic Gas Signature of Pacaya Volcano, With Implications for the Volcanic CO2 Flux From Guatemala. Geophys. Geosyst. 2018, 19, 667–692. [Google Scholar] [CrossRef]
  48. Rose, W.I., Jr. Santiaguito volcanic dome, Guatemala. Geol. Soc. Am. Bull. 1972, 83, 1413–1434. [Google Scholar] [CrossRef]
  49. Roman, D.C.; LaFemina, P.C.; Bussard, R.; Stephens, K.; Wauthier, C.; Higgins, M.; Feineman, M.; Arellano, S.; de Moor, J.M.; Avard, G.; et al. Mechanisms of Unrest and Eruption at Persistently Restless Volcanoes: Insights From the 2015 Eruption of Telica Volcano, Nicaragua. Geochem. Geophys. Geosyst. 2019, 20, 4162–4183. [Google Scholar] [CrossRef]
  50. Holcomb, R.T. Eruptive history and long-term behavior of Kilauea Volcano. Volcanism Hawaii 1987, 1, 261–350. [Google Scholar]
  51. Harris, A.J.; Carniel, R.; Jones, J. Identification of variable convective regimes at Erta Ale Lava Lake. J. Volcanol. Geotherm. Res. 2005, 142, 207–223. [Google Scholar] [CrossRef]
  52. Gertisser, R.; del Marmol, M.A.; Newhall, C.; Preece, K.; Charbonnier, S.; Andreastuti, S.; Handley, H.; Keller, J. Geological History, Chronology and Magmatic Evolution of Merapi. In Merapi Volcano; Gertisser, R., Troll, V.R., Walter, T.R., Nandaka, I.G.M.A., Ratdomopurbo, A., Eds.; Active Volcanoes of the World; Springer International Publishing: Cham, Switzerland, 2023; pp. 137–193. [Google Scholar] [CrossRef]
  53. Harijoko, A.; Marliyani, G.I.; Wibowo, H.E.; Freski, Y.R.; Handini, E. The Geodynamic Setting and Geological Context of Merapi Volcano in Central Java, Indonesia. In Merapi Volcano: Geology, Eruptive Activity, and Monitoring of a High-Risk Volcano; Gertisser, R., Troll, V.R., Walter, T.R., Nandaka, I.G.M.A., Ratdomopurbo, A., Eds.; Springer International Publishing: Cham, Switzerland, 2023; pp. 89–109. [Google Scholar] [CrossRef]
  54. Németh, K.; Cronin, S.J. Volcanic Craters, Pit Craters and High-Level Magma-Feeding Systems of a Mafic Island-Arc Volcano: AMBRYM, Vanuatu, South Pacific. Spécial Publ. “Geol. Soc. Lond.” 2008, 302, 87–102. [Google Scholar] [CrossRef]
  55. Shreve, T.; Grandin, R.; Boichu, M.; Garaebiti, E.; Moussallam, Y.; Ballu, V.; Delgado, F.; Leclerc, F.; Vallée, M.; Henriot, N.; et al. From prodigious volcanic degassing to caldera subsidence and quiescence at Ambrym (Vanuatu): The influence of regional tectonics. Sci. Rep. 2019, 9, 18868. [Google Scholar] [CrossRef]
  56. Hamling, I.J.; Cevuard, S.; Garaebiti, E. Large-Scale Drainage of a Complex Magmatic System: Observations from the 2018 Eruption of Ambrym Volcano, Vanuatu. Res. Lett. 2019, 46, 4609–4617. [Google Scholar] [CrossRef]
  57. De Beni, E.; Cantarero, M.; Neri, M.; Messina, A. Lava flows of Mt Etna, Italy: The 2019 eruption within the context of the last two decades (1999–2019). J. Maps 2020, 17, 65–76. [Google Scholar] [CrossRef]
  58. Malaguti, A.B.; Corradino, C.; La Spina, A.; Branca, S.; Del Negro, C. Machine Learning Insights into the Last 400 Years of Etna Lateral Eruptions from Historical Volcanological Data. Geosciences 2024, 14, 295. [Google Scholar] [CrossRef]
  59. Calvari, S.; Nunnari, G. Reawakening of Voragine, the Oldest of Etna’s Summit Craters: Insights from a Recurrent Episodic Eruptive Behavior. Remote Sens. 2024, 16, 4278. [Google Scholar] [CrossRef]
  60. Belgiu, M.; Drăguţ, L. Random Forest in Remote Sensing: A Review of Applications and Future Directions. ISPRS J. Photogramm. Remote Sens. 2016, 114, 24–31. [Google Scholar] [CrossRef]
  61. Rodriguez-Galiano, V.F.; Ghimire, B.; Rogan, J.; Chica-Olmo, M.; Rigol-Sanchez, J.P. An Assessment of the Effectiveness of a Random Forest Classifier for Land-Cover Classification. ISPRS J. Photogramm. Remote Sens. 2012, 67, 93–104. [Google Scholar] [CrossRef]
  62. Pieri, D.; Abrams, M. ASTER Watches the World’s Volcanoes: A New Paradigm for Volcanological Observations from Orbit. J. Volcanol. Geotherm. Res. 2004, 135, 13–28. [Google Scholar] [CrossRef]
  63. Corradino, C.; Ramsey, M.S.; Pailot-Bonnetat, S.; Harris, A.J.L.; Del Negro, C. Detection of subtle thermal anomalies: Deep learning applied to the ASTER global volcano dataset. IEEE Trans. Geosci. Remote Sens. 2023, 61, 5000715. [Google Scholar] [CrossRef]
  64. Lagios, E.; Vassilopoulou, S.; Sakkas, V.; Dietrich, V.; Damiata, B.N.; Ganas, A. Testing satellite and ground thermal imaging of low-temperature fumarolic fields: The dormant Nisyros Volcano (Greece). ISPRS J. Photogramm. Remote Sens. 2007, 62, 447–460. [Google Scholar] [CrossRef]
  65. Di Bella, G.S.; Corradino, C.; Cariello, S.; Torrisi, F.; Del Negro, C. Advancing Volcanic Activity Monitoring: A Near-Real-Time Approach with Remote Sensing Data Fusion for Radiative Power Estimation. Remote Sens. 2024, 16, 2879. [Google Scholar] [CrossRef]
  66. Shin, H.-C.; Roth, H.R.; Gao, M.; Lu, L.; Xu, Z.; Nogues, I.; Yao, J.; Mollura, D.; Summers, R.M. Deep convolutional neural networks for computer-aided detection: CNN architectures, dataset characteristics and transfer learning. IEEE Trans. Med. Imaging 2016, 35, 1285–1298. [Google Scholar] [CrossRef]
  67. Krizhevsky, A.; Sutskever, I.; Hinton, G.E. ImageNet Classification with Deep Convolutional Neural Networks. Adv. Neural Inf. Process. Syst. 2012, 25, 1097–1105. [Google Scholar] [CrossRef]
  68. Ramsey, M.S.; Corradino, C.; Harris, A.J.L.; Pailot-Bonnétat, S.; Del Negro, C. Statistical retrieval of volcanic activity in long time series orbital data: Implications for forecasting future activity. Remote Sens. Environ. 2023, 295, 113704. [Google Scholar] [CrossRef]
  69. Yuan, Q.; Shen, H.; Li, T.; Li, Z.; Li, S.; Jiang, Y.; Zhang, L. Deep Learning in Environmental Remote Sensing: Achievements and Challenges. Remote Sens. Environ. 2020, 241, 111716. [Google Scholar] [CrossRef]
  70. Del Rosso, M.P.; Sebastianelli, A.; Spiller, D.; Mathieu, P.P.; Ullo, S.L. On Board Volcanic Eruption Detection Through CNNs and Satellite Multispectral Imagery. arXiv 2021, arXiv:2106.15281. [Google Scholar] [CrossRef]
Figure 1. Overview of the volcanoes selected [modified after Google Earth Pro http://www.earth.google.it (accessed on 22 September 2024)].
Geohazards 06 00024 g001
Figure 2. V-STAR interface. (A) shows the different information for the selected volcano; (B) shows the image from Sentinel-2 MSI related to the selected volcano and the calendar to change the date.
Geohazards 06 00024 g002
Figure 3. Thermal anomalies of the Ambrym volcano (Vanuatu). (A) Thermal anomalies area (m2) from 2016 to nowadays; (B) selected period of thermal anomalies; (C) layers menu and thermal anomaly map product from S2-MSI data of 15 December 2018, covering the area of the Ambrym volcano during an intra-calderic effusive eruption.
Geohazards 06 00024 g003
Figure 4. Thermal anomaly map from Sentinel-2 MSI from (A) 24 December 2018, (B) 26 December 2018, (C) and 29 December 2018 of Etna (Italy).
Geohazards 06 00024 g004
Figure 5. Geotiff file extracted from the V-STAR App of the (A) 24 December 2018 and (B) 26 December 2018 eruption of Etna (Italy) and plotted on a DEM via QGIS software (version: 3.40.3).
Geohazards 06 00024 g005
Figure 6. Thermal anomaly map from S2-MSI from (A) 7 January 2023, (B) 12 January 2023, and (C) 6 February 2023 of Kīlauea lava lake.
Geohazards 06 00024 g006
Figure 7. Mt. Etna (Sicily, Italy) thermal activity of August–December 2018: (A) 18 August 2018 Bocca Nuova (BN) thermal anomalies; (B) 6 November 2018 reactivation of BN2; (C) 24 November 2018 the fusion of BN1 and BN2 into BN; (D) BN intracraterial activity before the 24 December 2018 activity.
Geohazards 06 00024 g007
Figure 8. (A) Activity at the crater Voragine, 13–14 June 2024; (B,C) increasing activity at the Voragine crater; (D) emission of an intracraterial lava flow from the Voragine crater into the interior of the Bocca Nuova pit crater.
Geohazards 06 00024 g008
Figure 9. Stromboli Island (Aeolian Archipelago, Italy) thermal activity before the paroxysm on 11 July 2024: (A,B) increasing activity after the two overflows on 23 and 28 June 2024; (C,D) increased effusive and explosive activity after a sector collapses, and pyroclastic flows of 3 and 4 July 2024.
Geohazards 06 00024 g009
Figure 10. Time series of the areal extension of the Pacaya volcano.
Geohazards 06 00024 g010
Figure 11. The difference between the satellite image (A) and the thermal anomalies mapped onto the visible image (B) can be clearly observed.
Geohazards 06 00024 g011
Figure 12. An example of both underestimation and overestimation. In (A), the lava flow is underestimated due to cloud cover, (B) contains the same lava flow, but displayed with the original satellite image overlaid, while in (C), it is overestimated because of refraction-related errors, and (D) contains the same lava flow, but displayed with the original satellite image overlaid.
Geohazards 06 00024 g012
Table 1. Spectral bands and resolutions of Sentinel-2 MSI sensor.
BandDescriptionS2A Wavelength (nm)S2B Wavelength (nm)Resolution (m)
B2Blue496.6492.110
B3Green560.0559.010
B4Red664.5665.010
B5Red-edge 1703.9703.820
B8ANear Infrared narrow (NIRn)864.8864.020
B11Shortwave Infrared 1 (SWIR1)1613.71610.420
B12Shortwave Infrared 2 (SWIR2)2202.42185.720
Table 2. Feature sets used for the model. L0.4 = Band 2 (Blue), L0.5 = Band 3 (Green), L0.6 = Band 4 (Red), L0.8 = Band 8A (NIR), L1.6 = Band 11 (SWIR), L2.2 = Band 12 (SWIR).
Feat2
L0.4
L0.5
L0.6
L0.8
L1.6
L2.2
Disclaimer/Publisher’s Note: The statements, opinions and data contained in all publications are solely those of the individual author(s) and contributor(s) and not of MDPI and/or the editor(s). MDPI and/or the editor(s) disclaim responsibility for any injury to people or property resulting from any ideas, methods, instructions or products referred to in the content.

