Abstract
Traditional seismic risk assessments often require specialized expertise and extensive computational time, making probabilistic seismic risk evaluations less accessible to practitioners and decision-makers. To reduce the barriers related to applications of quantitative seismic risk analysis, this paper develops a Quick Loss Estimation Tool (QLET) designed for rapid seismic risk assessment of Canadian buildings. By approximating the upper tail of a seismic hazard curve using an extreme value distribution and by integrating it with building exposure-vulnerability models, the QLET enables efficient computation of seismic loss curves for individual sites. The tool generates seismic loss exceedance probability curves and financial risk metrics based on Monte Carlo simulations, offering customizable risk assessments for various building types. The QLET also incorporates regional site proxy models based on average shear-wave velocity in the uppermost 30 m to enhance site-specific hazard characterization, addressing key limitations of global site proxy models and enabling risk-based seismic microzonation. The QLET streamlines hazard, exposure, and vulnerability assessments into a user-friendly tool, facilitating regional-scale risk evaluations within practical timeframes, making it particularly applicable to emergency preparedness, urban planning, and insurance analysis.
1. Introduction
Probabilistic seismic risk assessments play a critical role in promoting seismic risk reduction for communities and in quantifying financial exposure/liability for governments and insurance companies [1,2]. While the methodology for such assessments is well established (e.g., catastrophe models) and the value of quantitative seismic risk evaluations for buildings and infrastructure is widely recognized (e.g., benefit–cost analysis of risk mitigation measures) [3,4], significant barriers remain for practitioners and decision-makers. These hurdles include reliance on catastrophe modeling consultancy services or technical software (e.g., OpenQuake [5]) and computational limitations when handling large-scale risk assessments. Moreover, difficulties in collecting and integrating essential models and data related to site-specific seismic hazards, building exposure, and vulnerability functions make traditional assessments resource-intensive and highly specialized.
A quantitative seismic risk assessment tool that is employed at regional or national scales can be particularly beneficial for policymaking related to disaster risk management [6,7,8]. Such tools can provide standard seismic risk outputs, visualizations, and quantitative risk metrics that are easy to interpret and act upon for disaster risk management. However, one of the primary limitations, apart from expertise, is the computational cost. A simulation-based probabilistic seismic hazard analysis (PSHA) can be especially demanding due to the large size of stochastic event sets to account for numerous uncertainties [9]. Traditionally, seismic hazard curves are approximated by power functions [10] or hyperbolic functions [11] in the log-log space, and the approximated functions are integrated with seismic vulnerability functions to conduct probabilistic seismic risk analysis. Alternatively, extreme value distributions and other statistical distributions that have suitable upper tail characteristics can be used to approximate seismic hazard curves [12,13], and then to simulate the annual maximum seismic hazard parameters, bypassing full PSHA computation.
To promote applications of probabilistic seismic risk analysis to practical problems, this study develops a MATLAB-based Quick Loss Estimation Tool (QLET) by focusing on Canadian buildings. MATLAB is selected due to its highly optimized matrix-based operations, robust built-in visualization tools, and integrated App Designer, which allowed for the rapid prototyping and efficient development of an interactive graphical user interface. The QLET is made accessible to interested readers/users (see Data Availability Statement). While we acknowledge the limitations of relying on commercial software, QLET’s core methodology can be adapted to other platforms, such as Python, in future developments. The QLET streamlines seismic risk assessment for Canadian buildings by efficiently integrating seismic hazard curves, site characterization models, and vulnerability functions, and enables rapid seismic risk estimation for individual sites and wide regions. The key advantage of the QLET lies in its ability to produce probabilistic outputs, such as exceedance probability (EP) curves and financial risk metrics, and to significantly reduce computational times compared to traditional approaches. Unlike existing catastrophe models that require extensive expertise and long runtimes, the QLET offers a fast, user-friendly alternative for seismic risk evaluation.
The seismic hazard component of the QLET is based on the latest (6th generation) national seismic hazard model in Canada developed by the Geological Survey of Canada (GSC), which is based on NGA ground motion prediction equations [14,15]. The GSC’s model computes ground motion parameters, such as peak ground acceleration (PGA), peak ground velocity (PGV), and spectral acceleration (SA), for return periods between 98 years and 2475 years at irregularly spaced grids with an average resolution of approximately 15 km. The GSC model outputs inform building codes and structural design standards in Canada, but their applications to probabilistic seismic risk assessments are limited due to high computational costs. To facilitate longer return-period hazard estimates (e.g., 5000 and 10,000 years), the QLET employs the tail approximation method [12], which allows robust extrapolation of seismic hazard curves beyond standard return periods. This enables the generation of annual maximum hazard samples, which serve as inputs for seismic risk estimation.
Recognizing significant influences by local soil conditions on ground motion parameters, the QLET incorporates global and regional Vs30 site proxy models in seismic hazard modeling (note: Vs30 is the time-averaged shear-wave velocity of the upper 30 m of soil and/or rock). The global Vs30 model by the United States Geological Survey (USGS), which serves as the baseline in the QLET, estimates continuous Vs30 values based on topographic slope where steeper slopes relate to higher Vs30 values [16]. These estimates, while continuous, have typical uncertainties of ±50 to 100 m/s and are often interpreted in terms of broad site classes (e.g., 300–360 m/s) for seismic design purposes. To improve accuracy, the QLET implements regional Vs30 models for Metro Vancouver [17] and for St. Lawrence Lowlands (covering Ottawa, Montreal, and Quebec City) [18]. These regional models are based on 3D geological models that are informed by in situ site characterizations and geotechnical measurements and provide more accurate representations of site effects than the global model. The ability to incorporate both global and regional Vs30 data allows the QLET to improve site-specific hazard characterization and seismic microzonation [19,20], which are essential for urban centers with dense infrastructure and high seismic risk. In particular, the QLET is used to generate new risk-based seismic microzonation maps for Metro Vancouver and St. Lawrence Lowlands by considering recently developed regional Vs30 models.
Recent advances in seismic risk modeling have led to the development of a comprehensive nationwide building exposure model that is accompanied by seismic vulnerability functions for structural, non-structural, and contents loss for Canadian buildings [21]. In the QLET, these vulnerability functions, coupled with site-specific hazard data, form the basis for calculating seismic loss curves and key risk metrics. This makes QLET well-suited for applications in disaster risk reduction, urban planning, and insurance risk modeling, where rapid insights are essential for effective decision-making.
The paper is organized as follows. Section 2 presents the methodology of the QLET by introducing its hazard, exposure, and vulnerability components. The functionalities of the QLET are also summarized in this section. Subsequently, Section 3 demonstrates the results of the QLET for two seismic areas in Canada, Vancouver and Montreal. In particular, the effects of using the regional Vs30 models are highlighted in the context of microzonation. Finally, Section 4 describes the main conclusions and utility of the QLET.
2. Methodology
2.1. Overview
Seismic risk assessment requires an integrated approach that accounts for seismic hazard, local site effects, building exposure, and vulnerability characteristics. Existing methods are often based on a PSHA framework, such as those implemented in a catastrophe modeling platform (e.g., OpenQuake), which incorporates large-scale stochastic event catalogs and extensive ground motion simulations to capture seismic hazard uncertainties [5,22]. While these approaches are robust, they can also be computationally intensive, especially when applied to large-scale regional/national risk assessments.
To improve computational efficiency, the methodology presented in this study fits a continuous probability distribution to discrete hazard values using a statistical tail approximation method. This fitted curve enables both interpolation and extrapolation across a wide range of return periods, including those not directly provided by the GSC model. When combined with Monte Carlo simulation-based loss estimation, this approach allows for rapid site-specific and regional risk evaluations while avoiding the full computational burden of stochastic event-based PSHA calculations. This balance between accuracy and efficiency makes the method well-suited for practical seismic risk applications.
The methodology consists of the following key components:
- Seismic hazard assessment: The framework utilizes PSHA outputs and approximates them by extreme value distributions to extend hazard estimates beyond standard return periods for which exact PSHA outputs are available from the GSC model. To estimate hazard curves at user-defined sites that do not coincide with the original GSC model grid, QLET performs spatial interpolation between nearby GSC hazard points. For each site or grid point, ground motion parameters (e.g., SA) are interpolated from neighboring data, enabling continuous and location-specific hazard estimation across the region of interest.
- Vs30 characterization and site effects: Regional variations in ground motion amplification are accounted for using both global and regional Vs30 models, facilitating improved site-specific risk estimation where more accurate regional Vs30 models are available.
- Building exposure and seismic vulnerability models: The framework utilizes seismic vulnerability functions, adapted to Canadian building stock, to estimate structural, non-structural, and contents losses.
- Simulation-based risk computation: A Monte Carlo simulation is applied to compute key seismic risk outputs, including EP loss curves and value-at-risk (VaR) estimates.
These components are integrated into the QLET that streamlines the entire risk assessment process. Since the PSHA outputs are available for a discrete set of Vs30 values, the first required input for hazard estimation is the site’s Vs30 value. The QLET automates hazard-vulnerability calculations and provides rapid loss estimation, making it suitable for both site-specific and regional-scale applications. The following sections describe each component in detail. A workflow of the methodology is illustrated in Figure 1, outlining the sequential steps from hazard assessment to final risk computation.
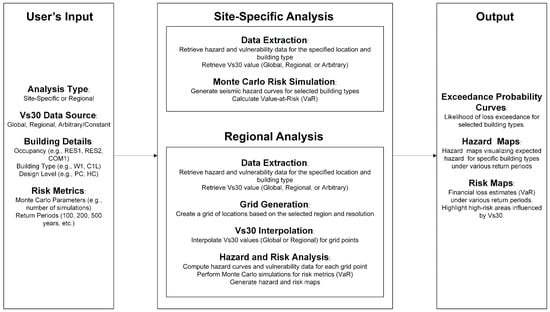
Figure 1.
A calculation flowchart of the Quick Loss Estimation Tool (QLET).
2.2. Hazard Assessment
PSHA forms the basis of probabilistic seismic risk assessment, generating ground motion parameters necessary for estimating potential building damage and financial losses. In this study, we use the 6th generation national seismic hazard model developed by the GSC [15]. This model provides ground motion estimates (PGA, PGV, and SA at nine vibration periods between 0.05 and 10 s) for different return periods and Vs30 values at discretized locations across Canada. Among these ground motion parameters, SA is selected as the primary hazard intensity measure because it is widely used in engineering applications and seismic design provisions. SA values at different periods capture the dynamic responses of linear elastic structures, making them more directly relevant for damage and loss estimation than PGA and PGV, which represent peak characteristics of ground motions but do not fully capture peak structural responses. Although PGV is also considered to be correlated with earthquake damage [23], the current study uses SA because the seismic vulnerability functions adopt SA as an input ground motion parameter (Section 2.5).
2.2.1. Tail Approximation for Seismic Hazard Estimates
The GSC model provides seismic hazard estimates for ten return periods (98, 140, 224, 332, 475, 689, 975, 1403, 1975, and 2475 years) and fifteen Vs30 values (140, 160, 180, 250, 300, 360, 450, 580, 760, 910, 1100, 1500, 1600, 2000, and 3000 m/s) at irregularly spaced 34,733 locations across the country. However, for probabilistic risk assessment, hazard estimates for intermediate return periods and extended return periods (e.g., 5000 and 10,000 years) are often needed. To address this, a statistical tail approximation method is used to estimate hazard levels across all return periods, enabling both interpolation for intermediate values and extrapolation for extended values.
To estimate hazard values across different return periods, four probability distributions (Gumbel, Frechet, Weibull, and lognormal) are considered. The first three distributions can be expressed as the generalized extreme value distribution [24], which has been used to obtain the estimate of the largest observation of an independent and identically distributed random sample originated from a stochastic process. Under the linear stability postulate, the probability distribution function of the maximum of the stochastic sequence can be approximated by one of the Gumbel, Frechet, and Weibull distributions. They are suitable candidates for approximating the upper tail of seismic hazard distributions because of their ability to model extreme values and skewed distributions [12,13]:
- The Gumbel (type I extreme) distribution is effective for modeling peak values related to various natural phenomena (e.g., earthquake magnitude and wind speed);
- The Frechet (type II extreme) distribution is appropriate for heavy-tailed hazard processes (e.g., rainfall);
- The Weibull (type III extreme) distribution is widely used for characterizing the strength and fatigue of materials; and
- The lognormal distribution is commonly used for ground motion parameters.
Each model is fitted to the relationship between ground motion parameter and exceedance frequency via least-squares regression. The best-fit model is selected based on the highest correlation coefficient between the original data and the fitted model, ensuring that the hazard approximation maintains consistency with the GSC data. For complete details of the tail approximation methodology and its applications, readers are referred to [12].
As a final remark in this subsection, the adopted upper tail approximation is a parametric approach (i.e., specific probability distributions with two parameters are fitted to ten data points per location and ground motion parameter and model selection is conducted based on the linear correlation coefficient). Alternatively, it is worthwhile adopting non-parametric approaches, such as kernel density estimation [25]. When such a non-parametric model is implemented, more rigorous evaluations of the best fitting models will be necessary because the number of parameters of the candidate models becomes different (e.g., the Akaike and Bayes Information Criteria could be adopted to account for the model complexity) and their performances in the upper tail may vary significantly. This can be considered as a future topic of the upper tail approximation of PSHA-derived hazard curves.
2.2.2. Validation Against OpenQuake and Computational Efficiency
To assess the reliability of the tail approximation method, the generated hazard curves are compared with results obtained from the GSC hazard model and OpenQuake. The OpenQuake version 3.18 is run using the hazard model input files that are provided by [15]. The primary objective is to ensure that the method accurately reproduces hazard estimates across multiple locations, site conditions, and return periods while maintaining computational efficiency.
Comparative analyses are conducted at eight locations across Canada (Victoria, Vancouver, Calgary, Toronto, Ottawa, Montreal, Quebec City, and La Malbaie), reflecting diverse seismicity. For demonstration in this study, Vancouver and Montreal are chosen as representative locations. Vancouver represents a seismically active western region influenced by the Cascadia subduction zone, while Montreal represents an eastern region, primarily affected by intraplate seismicity along the St. Lawrence Rift System. The validation is focused on mid-range spectral periods (0.3 s, 0.5 s, and 1.0 s; they are relevant for seismic vulnerability functions for Canadian buildings) up to the return period of 10,000 years, as these are critical for seismic risk assessment. The validation is performed by comparing the tail approximation results (as implemented in the QLET) with the GSC hazard values (as a benchmark for return periods between 100 and 2500 years) and with the OpenQuake PSHA calculations (as a benchmark for return periods between 2500 and 10,000 years).
Figure 2 presents the comparisons for Vancouver and Montreal, showing annual exceedance frequency curves for SA at 0.3 s based on the tail approximation method, GSC data, and OpenQuake. The different slopes of the seismic hazard curves for Vancouver and Montreal reflect the degree of uncertainties related to seismicity and ground motions in Western and Eastern Canada. Additionally, comparisons of the calculated SA ratios across return periods confirm that differences remain within 10% for most hazard levels, indicating strong agreement. However, through the validation exercises, systematic differences are also observed at short spectral periods less than 0.1 s and for low Vs30 values. Additional sensitivity analyses reveal that amplification effects are more pronounced at low Vs30 values (typically less than 180 m/s). The discrepancies are likely due to differences in site amplification models implemented in OpenQuake.
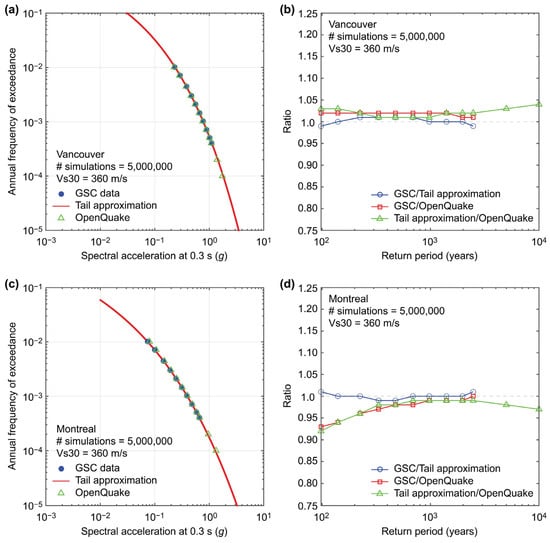
Figure 2.
Comparison of seismic hazard curves (a,c) and ratios (b,d) for the tail approximation method, GSC, and OpenQuake for Vancouver and Montreal.
Traditional PSHA-based risk assessments rely on numerous stochastic ground motion realizations, requiring significant computational resources. OpenQuake simulations for regional-scale assessments often take days to weeks, making them impractical for rapid decision-making. In contrast, the QLET enables regional-scale risk assessments within practical timeframes, typically within a few to tens of minutes, depending on the spatial extent and resolution of the analysis (note: a seismic hazard curve for each case is simulated within a second and the simulation can be adjusted for the minimum ground motion level, which curtails unnecessary calculations that result in no seismic loss). The tail approximation approach significantly reduces computational overhead by leveraging precomputed hazard data by the GSC and efficiently interpolating hazard values across extended return periods. This computational efficiency makes the QLET particularly suitable for applications requiring rapid seismic risk assessments, such as emergency preparedness, urban planning, and insurance modeling.
2.3. Vs30 Characterization and Site Effects
Seismic hazard assessments critically depend on accurate site characterization, as local soil conditions significantly influence ground motion parameters. A key parameter for site classification is Vs30, which is widely used in ground motion models and for seismic hazard mapping to account for site effects. While global Vs30 datasets, such as the USGS Vs30 model [16], offer broad coverage with spatial resolution of 3 arc seconds (approximately 1 km grids), they primarily rely on topographic slope proxies to estimate subsurface conditions. This approach, while effective for regional-scale assessments, lacks the resolution and accuracy needed for site-specific seismic risk evaluations, particularly in regions with complex geological features.
To improve the accuracy of site effect representation, the QLET implements regional Vs30 models. The Metro Vancouver seismic microzonation model [17] provides high spatial resolution Vs30 estimates (200 m grids) based on direct shear-wave velocity (Vs) measurements, multi-method geophysical surveys, and geotechnical data. This accounts for site-specific amplification effects, particularly within the Fraser River delta, glacial sediments, and bedrock transition zones. On the other hand, the St. Lawrence Lowlands Vs30 model [18] refines Vs30 estimates for Eastern Canada with a spatial resolution of 500 m, covering urban areas of Ottawa, Montreal, and Quebec City. This model incorporates borehole Vs measurements, geophysical surveys, and empirical relationships tailored to the region’s Quaternary sediments and bedrock formations.
The reliance on topographic proxies in global Vs30 datasets introduces biases, particularly in regions with low-relief terrain, where such proxies may fail to capture subsurface variability. These biases underestimate ground motion effects in Western Canada, particularly in areas like Metro Vancouver, where deep sedimentary basins amplify seismic waves and overestimate ground motion effects in Eastern Canada, where topography-based Vs30 estimates may incorrectly classify stiff soil or rock sites as softer deposits due to flat topography [26]. By incorporating high-resolution regional Vs30 models, the QLET improves site classification and hazard characterization, leading to more accurate risk assessments for Canadian buildings.
To illustrate the impact of regional Vs30 data, Figure 3 compares the USGS global Vs30 estimates with the regional models for Metro Vancouver and the St. Lawrence Lowlands. This comparison highlights substantial differences in Vs30 characterizations, particularly in densely populated urban areas where local geotechnical conditions play a crucial role in seismic hazard estimation. More specifically, Vs30 values in downtown Vancouver and Northern Vancouver are underestimated when the global model is used instead of the regional model, while the opposite trends are applicable to the Fraser River delta. On the other hand, Vs30 values on Island of Montreal and Jesus Island are grossly underestimated in the global model in comparison with the regional model. Overall, the key advantages of the regional Vs30 models include: (i) higher spatial resolution, capturing localized site effects that global models cannot resolve; (ii) integration of in situ Vs profiling data, reducing reliance on empirical proxies; and (iii) improved accuracy in seismic loss modeling, critical for risk-sensitive applications, such as urban planning and insurance modeling. By integrating both global and regional Vs30 models, the QLET enhances site-specific hazard characterization and risk-based seismic microzonation, making it a more effective tool for seismic risk assessment in Canada. The next generation of the national seismic risk model (under development) will include a hybrid Vs30 model for Canada developed from the global model that is replaced (mosaic inserts) where regional Vs models are available.
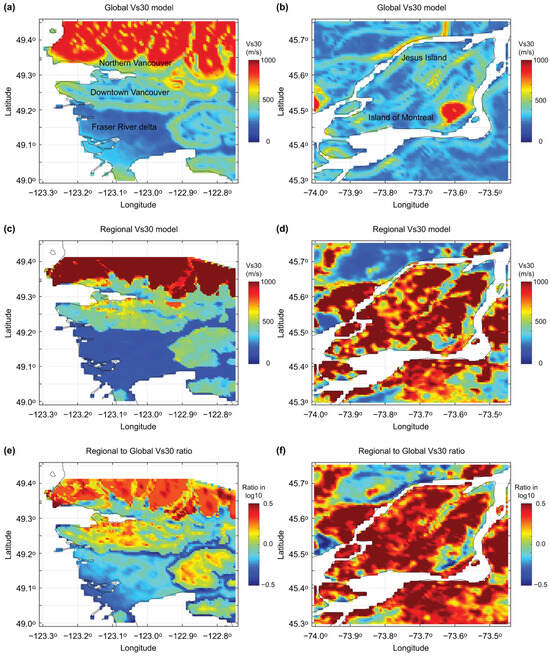
Figure 3.
Comparison of global Vs30 (USGS) and regional Vs30 models for Vancouver (a,c) and Montreal (b,d). The ratios of the Vs30 values based on the regional and global models for Vancouver and Montreal are shown in (e) and (f), respectively.
2.4. Building Exposure
Seismic risk assessments require detailed building exposure data to quantify potential losses from earthquakes. The term “building exposure” refers to the physical and economic characteristics of structures, including occupancy type, construction material, seismic design level, and economic value. These parameters are crucial for estimating seismic vulnerability and financial risk, as different building types exhibit varying levels of structural resistance under earthquake loading.
The QLET requires users to define each building based on three key attributes:
- Occupancy type, describing the building’s use (e.g., residential, commercial, and industrial);
- Structural system, identifying the primary construction material and framing type, affecting seismic resistance of the building; and
- Seismic design level, differentiating buildings based on their compliance with seismic design codes. Pre-code (PC), low-code (LC), moderate-code (MC), and high-code (HC) are used for structures built before seismic design considerations were implemented, for structures designed with minimal seismic provisions, for structures compliant with mid-level seismic standards; and for structures designed to meet modern seismic resistance requirements, respectively.
The QLET supports a wide range of occupancy types and structural categories (in total, 7260 combinations of the three attributes) [21], allowing flexibility in defining buildings for seismic risk assessment. Overall, each building type follows a standardized taxonomy, such as:
- RES1-C2L-PC: A low-rise residential building (RES1) with light concrete construction (C2L) and no seismic design (PC).
- COM4-W1-MC: A commercial building (COM4) with wood-frame construction (W1) and a moderate seismic design level (MC).
To estimate seismic risk in financial terms, users must specify the economic exposure values for each building in terms of structural elements, non-structural elements, and building contents (note: all values should be specified in Canadian dollars (CAD)). The structural value corresponds to the primary structural system; the non-structural value is associated with interior components, mechanical/electrical systems, partitions, and elevators; and the contents value is related to furniture, equipment, and stored goods inside the building. This building component classification is consistent with the Natural Resources Canada (NRCan) system [27] and is carried over to seismic vulnerability functions (Section 2.5).
The QLET operates with user-defined exposure datasets, allowing users to analyze individual buildings or conduct large-scale regional assessments. To aid this model input, predefined reference exposure datasets prepared by the NRCan [21] are integrated into the QLET. This allows users to visualize the concentration of different building types across a study area, assess regional exposure trends, such as the dominance of wood-frame residential buildings in the suburbs or the prevalence of high-rise concrete structures in urban centers, and cross-check user-defined exposure inputs against national trends to ensure realistic scenario setup. By separating calculation inputs from reference data, the QLET ensures that exposure datasets remain user-controlled and adaptable. Figure 4 illustrates the geographic distributions of wood and concrete buildings in Vancouver and Montreal based on the NRCan database, showing the complementary spatial coverages of these two building typologies.
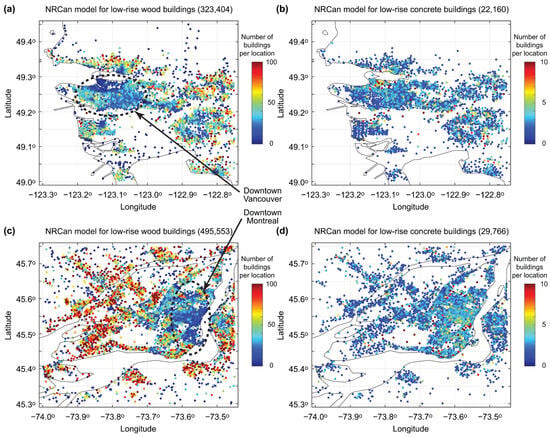
Figure 4.
Reference NRCan building exposure models of (a) wood-frame and (b) concrete structures in Vancouver and (c) wood-frame and (d) concrete structures in Montreal.
2.5. Seismic Vulnerability Functions
Seismic vulnerability functions describe an expected relationship between ground motion parameter and expected damage for different building types. These functions are essential for assessing structural performance under earthquake shaking and form a key component of risk assessment frameworks. In the QLET, vulnerability functions are adopted from empirical and analytical fragility models tailored to Canadian buildings [21]. These functions are applied to the building typologies defined in Section 2.4, which classify structures based on occupancy type, construction material, and seismic design level. Since the damage ratios estimated from the NRCan’s seismic vulnerability functions correspond to mean damage estimates, uncertainty of the damage ratios is represented by the lognormal distribution with a median ratio of 1 and coefficient of variation of 0.3. The value of 0.3 for the coefficient of variation is estimated as a lower limit of this coefficient based on insurance loss data from the 1994 Northridge earthquake [28], which is considered to be suitable for well-defined exposed buildings. When the building definitions are less certain, a larger value of the coefficient of variation, such as 0.6, can be adopted. An important limitation of the seismic vulnerability functions that are implemented in the QLET is that these functions are not validated empirically due to the lack of seismic damage and loss data in Canada. Although analytical seismic vulnerability functions of Canadian wooden buildings are favorably compared with empirical seismic vulnerability functions that are based on insurance loss data from the 1994 Northridge [28], a full validation is not feasible. The seismic risk outputs from the QLET are consistent with the national seismic risk model (current standard) and validation using empirical earthquake damage is necessary in future.
Figure 5 presents example vulnerability functions for two different building types, i.e., RES1-W1-PC (low-rise wood-frame residential, pre-code) and RES1-C2L-PC (low-rise concrete residential, pre-code). The curves illustrate how different building components (structural, non-structural, and contents) contribute to total loss as a function of SA at 0.3 s. The data points represent mean loss ratios, while the solid lines indicate best-fit lognormal curves used for computation. The wood-frame structure (Figure 5a) shows higher structural damage at lower intensities compared to the concrete building (Figure 5b). The concrete building exhibits more gradual loss accumulation across all components. These functions are essential for transforming seismic hazard into economic loss estimates, which are further discussed in Section 2.6.
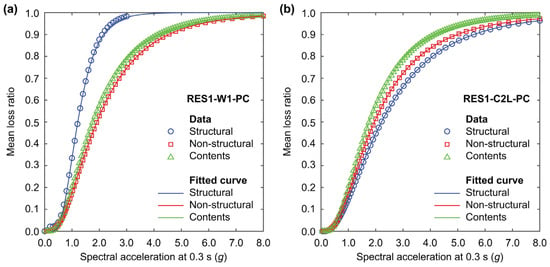
Figure 5.
Seismic vulnerability functions for (a) wood building (RES1-W1-PC) and (b) concrete building (RES1-C2L-PC).
2.6. Risk Computation and Output
The QLET integrates hazard, exposure, and vulnerability components to compute seismic risk metrics efficiently. The risk assessment framework follows a structured process to estimate potential economic losses from earthquakes, allowing for site-specific and regional-scale evaluations.
The core risk computation in the QLET involves Monte Carlo simulations, which generate synthetic loss scenarios based on seismic hazard exceedance curves estimated through spatial and Vs30-based interpolation of precomputed GSC hazard data (Section 2.2 and Section 2.3), combined with user-defined exposure datasets (Section 2.4), and seismic vulnerability functions (Section 2.5) (see Figure 1). A full PSHA is not performed in the QLET; instead, the tool builds on the preexisting hazard outputs [15] and extends them using spatial interpolation and statistical fitting of the hazard curves. The financial loss estimation is derived from the convolution of hazard curves and vulnerability models, producing EP curves that quantify the probability of exceeding a given loss level.
More specifically, for a site-specific analysis, the following simulation steps are implemented:
- Obtain a Vs30 value at the building location from a global or regional Vs30 model.
- Extract preexisting seismic hazard values for the location and Vs30 at ten return period levels from seismic hazard values of the 6th generation national seismic hazard model.
- Carry out the upper tail approximation of the ten seismic hazard values by automatically identifying the most suitable model from the Gumbel, Frechet, Weibull, and lognormal distributions.
- Simulate a large number of the ground motion parameter realizations (= Nsimu) from the fitted probability distribution. Each data point represents the annual maximum ground motion. In this step, a user can introduce the minimum ground motion level to make the Monte Carlo simulations more efficient (e.g., ground motion hazards greater than 0.05 g can be considered). The user’s decision of the minimum threshold is informed by the incipient ground motion level for seismic damage to the considered building typology while balancing longer compute times associated with a chosen lower ground motion level.
- Simulate seismic loss ratios for structural, non-structural, and contents elements from the lognormal distribution and multiply the simulated loss ratios by their economic values. The total seismic loss is obtained by summing these three losses and is used to construct an EP curve.
For a regional-scale analysis, after generating the grid locations in a target region, the same simulation steps are repeated for all locations to create seismic hazard and risk microzonation maps.
The QLET produces the following risk outputs:
- EP curves represent the probability of losses exceeding a given threshold over a specified time period. These are essential for risk-based decision-making in sectors like insurance and disaster mitigation planning. Various risk metrics, such as annual expected loss, can be calculated using the EP curves.
- VaR is the expected loss at a given probability level (e.g., 1% or 0.1% annual exceedance probability) and is particularly useful for financial planning, helping governments, infrastructure managers, and insurers quantify potential worst-case losses.
- Geospatial seismic risk maps visualize the seismic risk distribution across different regions, enabling the comparison of risk levels for different building types and geographic locations.
A key advantage of the QLET is its computational speed compared to traditional catastrophe models. Regional risk assessments (e.g., city-wide analysis) can be performed in several minutes rather than hours or days (depending on the spatial extent and resolution). This efficiency is achieved through the tail approximation and simulation of a seismic hazard curve and streamlined hazard-loss integration, reducing the need for extensive stochastic simulations.
3. Results
3.1. Effects of Building Types
The influence of building typology on seismic vulnerability is a critical aspect of seismic risk assessment. Two representative building types, RES1-W1-PC and RES1-C2L-PC, are analyzed for Vancouver and Montreal. The Vs30 value is arbitrarily chosen as 360 m/s. The vulnerability functions of these buildings are shown in Figure 5. The following economic building cost values are considered: structural value = 120,000 CAD, non-structural value = 360,000 CAD, and contents value = 220,000 CAD. The number of simulations above the minimum seismic hazard value of 0.01 g is set to Nsimu = 5,000,000. The calculation of an EP curve takes several seconds, including the pre- and post-processing of the data and visualization of the output (note: the computational time can be further reduced by adopting a lower number of simulations, such as Nsimu = 500,000, which produces sufficiently accurate results).
The seismic loss curves for the two building types and for the two locations are compared in Figure 6. The results for Vancouver and Montreal demonstrate differential impacts of material properties and structural design on EP curves. While both building types exhibit similar trends, the wood-frame building case shows moderately higher probabilities of loss exceedance compared to the concrete building case under the same exceedance probability levels (note: the vulnerability function of the structural component for the wooden building is higher than that for the concrete building (Figure 5)). The concrete building case results in reduced seismic loss, particularly at lower probabilities of exceedance, indicating better overall seismic performance.
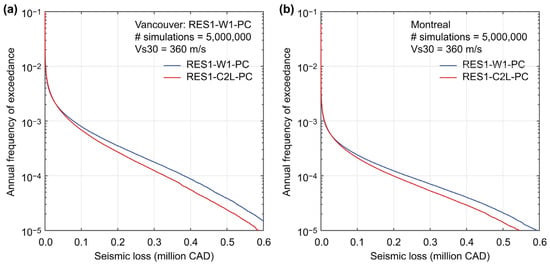
Figure 6.
Exceedance probability curves for two building types (RES1-W1-PC and RES1-C2L-PC) in (a) Vancouver and (b) Montreal.
Regional seismic hazard levels contribute to the absolute magnitude of losses. The differences of the EP curves for Vancouver and Montreal (for the building type) stem from the differences in regional seismic hazards. Figure 2 shows the different seismic hazard characteristics for the two locations. Although the hazard curve for Montreal is consistently lower than that for Vancouver, the differences of the hazard curves become smaller at rarer annual exceedance frequencies. Similarly, in Figure 6, the effects of regional seismicity can be seen in the downward shift of the EP curves from Vancouver to Montreal for both building types and the heavier upper tail of the EP curves for Montreal than Vancouver.
It should be emphasized that these comparisons are specific to the selected building types (RES1-W1-PC and RES1-C2L-PC) and their respective design characteristics. The results do not imply that concrete buildings are generally more resilient under seismic loading. Other factors, such as design level, occupancy type, and material quality, will significantly affect building performance.
3.2. Seismic Hazard and Risk Maps
This section explores the spatial distributions of seismic hazard and risk for Vancouver and Montreal using SA maps (Figure 7 and Figure 8) and VaR maps (Figure 9 and Figure 10). Two return periods, i.e., 500 and 2500 years, are focused upon, and two Vs30 models (i.e., global and regional) are implemented. For seismic risk mapping, RES1-W1-PC is considered with the same economic values as Section 3.1. The visualizations of spatial hazard and risk estimates highlight the differences in seismicity between Vancouver (Western Canada) and Montreal (Eastern Canada) and demonstrate QLET’s ability to assess regional seismic risks effectively. Over areas spanning 0.45 degrees in latitude and 0.55 degrees in longitude, 101 by 101 grids are set up. For each location, 200,000 ground motion samples are drawn above 0.05 g from the fitted hazard curve (SA at 0.3 s), and used in conjunction with the vulnerability functions to derive site-specific EP curves (note: this minimum SA level is adequate because the seismic vulnerability functions are essentially zero at this ground motion level; Figure 5). The computation takes approximately 10 min. It is important to point out the same building model is placed at the grid locations; thereby, both seismic hazard and risk mapping results shown in this section can be viewed as seismic microzonation products. In particular, VaR maps correspond to risk-based seismic microzonation. In Canada, such risk-based seismic microzonation results for both western and eastern seismic regions have not been reported in the literature. Note also that using the QLET, similar seismic microzonation products for other urban areas, such as Ottawa and Quebec City, can be obtained.
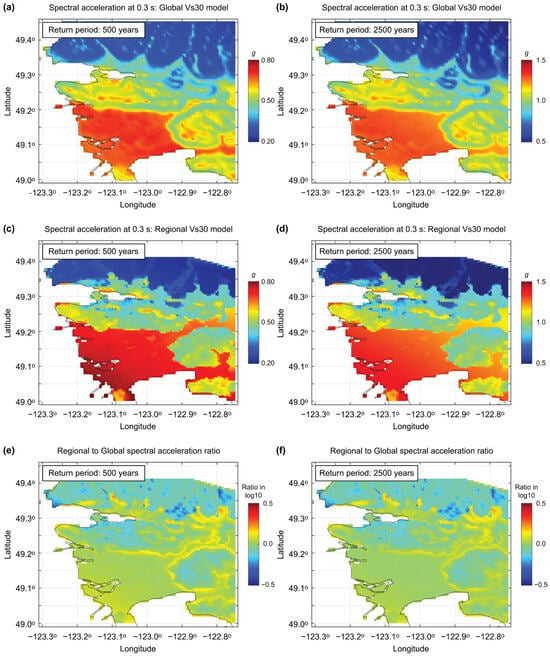
Figure 7.
Comparison of spectral acceleration at 0.3 s maps for the 500-year (a,c) and 2500-year (b,d) return periods utilizing global (a,b) and regional (c,d) Vs30 models for Vancouver. The ratios of the ground motion values based on the regional and global models are shown in (e,f). Note that ratio differences of log10 (0.5) are equivalent to a factor of 3.2.
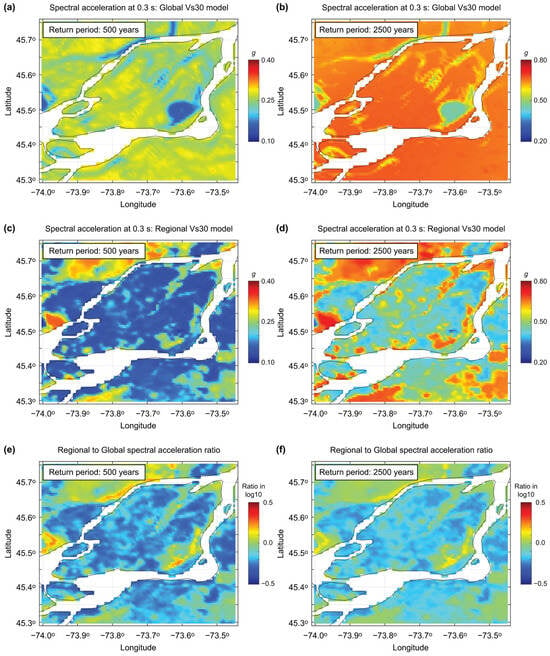
Figure 8.
Comparison of spectral acceleration at 0.3 s maps for the 500-year (a,c) and 2500-year (b,d) return periods utilizing global (a,b) and regional (c,d) Vs30 models for Montreal. The ratios of the ground motion values based on the regional and global models are shown in (e,f). Note that ratio differences of log10 (0.5) are equivalent to a factor of 3.2.
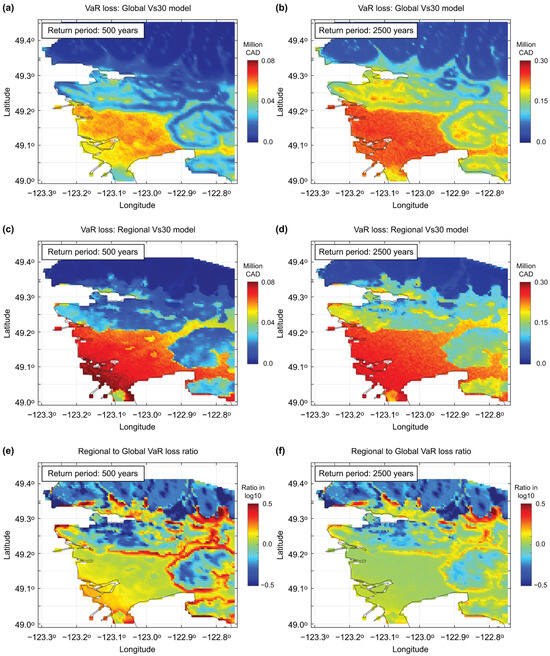
Figure 9.
Comparison of value-at-risk seismic loss maps for the 500-year (a,c) and 2500-year (b,d) return periods utilizing global (a,b) and regional (c,d) Vs30 models for Vancouver. The ratios of the seismic loss values based on the regional and global models are shown in (e,f). Note that ratio differences of log10 (0.5) are equivalent to a factor of 3.2.
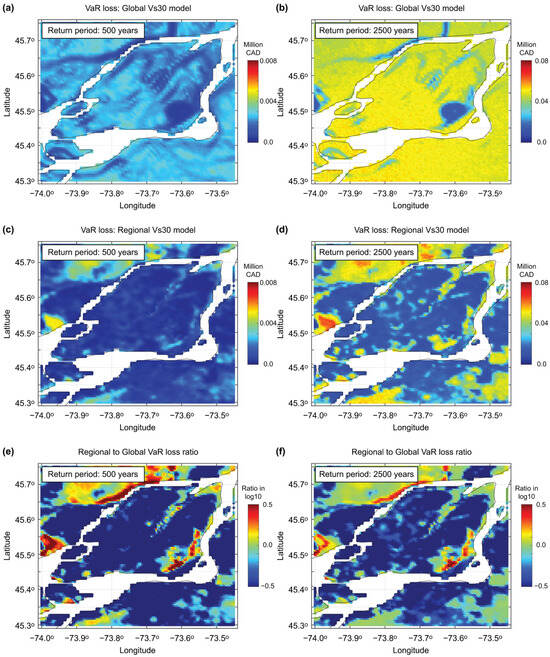
Figure 10.
Comparison of value-at-risk seismic loss maps for the 500-year (a,c) and 2500-year (b,d) return periods utilizing global (a,b) and regional (c,d) Vs30 models for Montreal. The ratios of the seismic loss values based on the regional and global models are shown in (e,f). Note that ratio differences of log10 (0.5) are equivalent to a factor of 3.2.
Figure 7a–d present the 500-year and 2500-year SA at 0.3 s maps for Vancouver by considering the global and regional Vs30 models. In Figure 7e,f, the ratios of the SA maps are displayed. The SA maps based on the global Vs30 model (Figure 7a,b) show artificial features that are based on local changes in topographical slopes but are not actually related to spatial variations of Vs30 values. For instance, such a feature can be seen in east of the Fraser River delta; for clear contrast, Figure 7a,c can be compared. The spatial patterns of the SA ratio maps (Figure 7e,f) are similar to the Vs30 ratio map shown in Figure 3e (but the color trend is reversed, because high Vs30 values generally translate to low SA values). The hazard-based seismic microzonation maps using the regional Vs-informed model are useful for identifying local areas where hazard values could be mis-specified due to the use of less applicable global topographic-proxy model. Notably, as shown in Figure 7, the regional Vs30 model results in a wider range of SA at 0.3 s values, with both larger peaks and smaller lows compared to the global model, evident from the more pronounced contrast in Figure 7c,d compared to Figure 7a,b. This increased variability suggests that using a regional site model may better capture localized ground motion amplification effects, potentially influencing not only mean estimates but also the variance in seismic risk outcomes. While this benefit may depend on regional characteristics, it highlights the potential value of incorporating detailed site condition data into hazard modeling.
Figure 8 shows the same set of SA maps for Montreal (as shown in Figure 7 for Vancouver). The effects of using the regional Vs30 model over the global model are more significant and widespread across the region. As indicated in Figure 3, the Vs30 values on Montreal and Jesus Islands are underestimated in the global Vs30 model due to flat topography, while the regional geological model in the St. Lawrence Lowlands indicates relatively thin clay/sand sediments overlying hard rock (i.e., high Vs30 values, with high impedance contrast). The seismic hazard maps shown in Figure 8a,b versus Figure 8c,d display very different spatial patterns of the SA values, highlighting the importance of considering the regional site proxy model in Eastern Canada. The SA ratio maps shown in Figure 8e,f, which exhibit the reversed color patterns of Figure 3f, indicate gross overestimation of regional seismic hazard when the global model is used for this region. It is important to note that Figure 7 and Figure 8 present seismic hazard maps, not risk maps. The SA at 0.3 s values reflect surface ground motions derived from seismic hazard outputs using either global or regional Vs30 models. No building typologies or vulnerability models are applied in these figures.
Next, VaR maps are generated for Vancouver and Montreal by considering the two return periods and the two site proxy models. The results for Vancouver and Montreal are shown in Figure 9 and Figure 10, respectively. It is important to stress that these VaR maps based on the regional Vs30 model are new risk-based seismic microzonation products for these seismic regions.
From spatial pattern viewpoints, for Vancouver, Figure 9 presents similar characteristics as Figure 7, which is expected. Notable differences between Figure 7 and Figure 9 (i.e., hazard-based and risk-based seismic microzonation maps) are that the variability of the seismic risk estimates is greater than that of the seismic hazard estimates. This suggests that the influence of local site effects becomes more pronounced when hazard values are propagated through vulnerability models, emphasizing that an accurate range of hazard values is crucial for reliable risk estimation. The seismic loss ratio maps shown in Figure 9e,f highlight that local areas with relatively large changes in slope angle over short distances correspond to locations where large biases could occur associated with inaccurate Vs30 estimation. The rate of change in Vs30 values in global topographic-proxy models strongly depends on the pixelation or rastering of the governing digital elevation model (e.g., 3 arc seconds (~1 km) is relatively high resolution for global models). In contrast, regional Vs-informed models typically utilize the highest topographic resolution available (in the case of Metro Vancouver, 1 m contouring from a LiDAR-based DEM is used to define lowland and upland zones within which Vs30 is mapped separately at a 200 m rastering). On the other hand, for Montreal, Figure 10 shows similar spatial patterns as Figure 8, but with greater variations over the region. The extent of overestimation of the seismic risk, when the inaccurate global site proxy model is used for Eastern Canada, can be significant.
In summary, the practical implications of the comparisons shown in Figure 6, Figure 7, Figure 8, Figure 9 and Figure 10 are significant because the regional Vs30 models offer a more nuanced understanding of seismic hazards, making them indispensable for urban planning, emergency response, and risk mitigation efforts. In contrast, the global Vs30 model, while useful for broader assessments, may lack the resolution necessary for detailed site-specific analyses. By integrating both global and regional Vs30 datasets, QLET demonstrates its flexibility and capability in adapting to available data while emphasizing the value of high-resolution inputs for seismic hazard analysis.
3.3. Capabilities and Limitations
The QLET offers several advantages in seismic risk assessment.
- Efficiency and accessibility: By employing Monte Carlo simulations and leveraging existing national datasets (e.g., GSC’s seismic hazard model and NRCan’s building exposure-vulnerability models), the QLET provides practitioners with an efficient and user-friendly tool for seismic risk analysis without requiring extensive computational resources.
- Integration of regional data/models: The tool enables the use of high-resolution regional Vs30 models, offering enhanced accuracy compared to global models, particularly in areas like Vancouver and Montreal, where detailed local site condition datasets are available.
- Visualization and interpretation: Through outputs, such as EP curves and spatial VaR maps, the QLET facilitates the visualization of seismic risk distribution, making it accessible to decision-makers and stakeholders.
While the current implementation of the QLET is tailored to Canadian datasets, the underlying framework is adaptable to other regions where compatible seismic hazard, exposure, and vulnerability data are available. The QLET also complements more comprehensive event-based national frameworks, such as CanSRM1 [29]. Although a formal validation has not yet been conducted, QLET’s regional risk outputs for major urban centers could be compared in future work against CanSRM1 results to examine consistency in risk trends and spatial loss patterns. Such comparisons would support benchmarking of the QLET against detailed simulations and guide its broader adoption in practice.
Despite its capabilities, the QLET has limitations. First, the tool does not account for the potential spatial correlation of seismic hazards across regions, which can influence portfolio-level risk assessment [30,31]. Regarding the implemented data and models, the accuracy of QLET’s results is contingent upon the quality and spatial density of the input data. Second, while the regional Vs30 models enhance accuracy, discrepancies in hazard, exposure, or vulnerability data/models may impact the reliability of the outcomes. Third, while the QLET incorporates NRCan’s detailed vulnerability functions, further refinement could be achieved by integrating dynamic characteristics of building models that consider specific behavior under varying seismic scenarios.
To address these limitations, the following strategies could be considered. Future versions of the QLET could include modules for modeling spatial correlation in seismic hazards, especially for applications involving portfolio risk analysis. In addition, the QLET should be updated when new data and models become available. For instance, incorporating future regional Vs30 datasets for other Canadian cities or improved vulnerability models can further enhance the tool’s utility and accuracy. By highlighting these capabilities and limitations, we aim to underscore QLET’s current value, while identifying pathways for its continuous improvement to meet the evolving needs of seismic risk assessment.
4. Conclusions
This study presents the MATLAB-based QLET tailored to support seismic risk assessment for Canadian buildings. By integrating advanced seismic hazard models, detailed vulnerability functions, and both regional and global Vs30 models, the QLET bridges the gap between computational efficiency and data accuracy, enabling rapid and customizable seismic risk evaluations. The tool effectively demonstrates its capability to produce actionable insights through its application to diverse scenarios, such as analyzing the effects of building typologies, regional seismic hazards, and site-specific conditions. Unlike traditional approaches that may require days to weeks of computation for large-scale seismic risk assessments, the QLET enables regional-scale evaluations within practical timeframes. Depending on the spatial extent and level of detail, the QLET can generate loss exceedance curves and VaR estimates within several to tens of minutes, significantly improving computational efficiency.
Key findings from this study underline the utility of the QLET in quantifying seismic risks across various geographies and building stock compositions. For example, the comparison of building typologies highlights the differential vulnerability of wood-frame versus concrete structures, while hazard and risk maps illustrate significant regional variations in seismicity and financial risk, serving as new risk-based seismic microzonation products. Moreover, the inclusion of the regional Vs30 models enhances the accuracy of ground motion predictions, addressing potential biases associated with global models and emphasizing the value of localized data for detailed risk assessments. Known improvements to Vs30-proxy modeling include incorporation of Quaternary geology mapping (when available), or slope curvature or roughness in combination with topographic slope angle, known as terrain classification mapping [32]. Regional Vs-informed models are generated from Vs profiling datasets, that are often developed into 3D Vs models. Hence, improvements to global Vs30-proxy models are the ‘mosaic’ replacement of global proxy modeling with regional Vs-informed models where available [33].
Despite its capabilities, the QLET is not without limitations. The tool’s reliance on input data quality and its inability to account for correlated seismic hazards across regions present opportunities for further refinement. Future iterations of the QLET could benefit from incorporating spatial correlation models and adapting to emerging datasets, ensuring that it remains a versatile and robust resource for practitioners and decision-makers.
In conclusion, the QLET provides a practical and adaptable solution for rapid seismic risk assessment, offering valuable tools for urban planning, disaster preparedness, and resource allocation. Its ability to accommodate diverse datasets and provide user-friendly outputs positions it as an essential resource for enhancing community resilience and supporting informed risk mitigation strategies.
Lastly, the QLET methodology is applicable to other seismic regions and countries. The required input data for such applications are precalculated seismic hazard values and exposure-vulnerability models. Recall that for Canada, the GSC provides seismic hazard values for eleven ground motion parameters, fifteen Vs30 values, and ten return periods at 34,733 locations. It is strongly recommended that governmental agencies that are responsible for national seismic hazard mapping should create a comprehensive set of calculated seismic hazard values for different ground motion parameters, return periods, site conditions, and locations and make it accessible to the public so that efficient statistical methods can be developed to circumvent computational bottlenecks caused by full PSHA. Although the development of the national exposure and seismic vulnerability models is a major undertaking, well-established OpenQuake approaches can be adopted to facilitate this process. The developed exposure-vulnerability models should also be released as open-access data. This study aimed at demonstrating potential benefits of such open-access data policies and decision-support tools for earthquake risk management.
Author Contributions
Conceptualization, P.M. and K.G.; methodology, P.M. and K.G.; software, P.M.; validation, N.S.; formal analysis, P.M.; investigation, P.M.; resources, K.G. and S.M.; data curation, P.M.; writing—original draft preparation, P.M. and K.G.; writing—review and editing, N.S. and S.M.; visualization, P.M. and K.G.; supervision, K.G.; project administration, K.G.; funding acquisition, K.G. and S.M. All authors have read and agreed to the published version of the manuscript.
Funding
This study is supported by the Canada Research Chair program (950–232015) and the NSERC Discovery Grant (RGPIN-2024-04428). Funding of the Metro Vancouver seismic microzonation mapping project is provided by the Institute of Catastrophic Loss Reduction with support from the BC Ministry of Emergency Management and Climate Readiness (EMBCK20CS0023).
Data Availability Statement
The QLET tool is available on GitHub from https://github.com/pmomeni/QuickLossEstimationTool_QLET (accessed on 31 May 2025). In this depository, the tool can be accessed through a MATLAB-based application with a graphical user interface. For those who are interested in modifying and extending the QLET tool, the original MATLAB codes for site-specific and regional analyses are also provided. The Vs30 data of the Metro Vancouver seismic microzonation mapping project is obtained from https://doi.org/10.5683/SP3/VBR7UT (accessed on 31 May 2025).
Conflicts of Interest
The authors declare no conflicts of interest. The funders had no role in the design of the study; in the collection, analyses, or interpretation of data; in the writing of the manuscript; or in the decision to publish the results.
Abbreviations
The following abbreviations are used in this manuscript:
| CAD | Canadian dollars |
| EP | Exceedance probability |
| GSC | Geological Survey of Canada |
| NRCan | Natural Resources Canada |
| PGA | Peak ground acceleration |
| PGV | Peak ground velocity |
| PSHA | Probabilistic seismic hazard analysis |
| QLET | Quick loss estimation tool |
| SA | Spectral acceleration |
| USGS | United States Geological Survey |
| VaR | Value at risk |
| Vs30 | Time-averaged shear-wave velocity of the upper 30 m of soil and/or rock |
References
- Michel-Kerjan, E.; Hochrainer-Stigler, S.; Kunreuther, H.; Linnerooth-Bayer, J.; Melcher, R.; Muir-Wood, R.; Ranger, N.; Vaziri, P.; Young, M. Catastrophe risk models for evaluating disaster risk reduction investments in developing countries. Risk Anal. 2013, 33, 984–999. [Google Scholar] [CrossRef]
- Mitchell-Wallace, K.; Jones, M.; Hillier, J.; Foote, M. Natural Catastrophe Risk Management and Modelling: A Practitioner’s Guide; Wiley-Blackwell: Hoboken, NJ, USA, 2017; 536p. [Google Scholar]
- Porter, K.A. Should we build better? The case for resilient earthquake design in the United States. Earthq. Spectra 2020, 37, 523–544. [Google Scholar] [CrossRef]
- Malomo, D.; Xie, Y.; Doudak, G. Unified life-cycle cost–benefit analysis framework and critical review for sustainable retrofit of Canada’s existing buildings using mass timber. Can. J. Civ. Eng. 2023, 51, 687–703. [Google Scholar] [CrossRef]
- Silva, V.; Amo-Oduro, D.; Calderon, A.; Costa, C.; Dabbeek, J.; Despotaki, V.; Pittore, M. Development of a global seismic risk model. Earthq. Spectra 2020, 36, 372–394. [Google Scholar] [CrossRef]
- Goda, K.; Wilhelm, K.; Ren, J. Relationships between earthquake insurance take-up rates and seismic risk indicators for Canadian households. Int. J. Disaster Risk Reduct. 2020, 50, 101754. [Google Scholar] [CrossRef]
- León, J.A.; Ordaz, M.; Haddad, E.; Araújo, I.F. Risk caused by the propagation of earthquake losses through the economy. Nat. Commun. 2022, 13, 2908. [Google Scholar] [CrossRef]
- Kunreuther, H.; Conell-Price, L.; Li, B.; Kovacs, P.; Goda, K. Influence of a private-public risk pool and an opt-out framing on earthquake protection demand for Canadian homeowners in Quebec and British Columbia. Risk Anal. 2024, 44, 2008–2024. [Google Scholar] [CrossRef]
- Assatourians, K.; Atkinson, G.M. EqHaz: An open-source probabilistic seismic-hazard code based on the Monte Carlo simulation approach. Seismol. Res. Lett. 2013, 84, 516–524. [Google Scholar] [CrossRef]
- Cornell, C.A.; Jalayer, F.; Hamburger, R.O.; Foutch, D.A. Probabilistic basis for 2000 SAC Federal Emergency Management Agency steel moment frame guidelines. J. Struct. Eng. 2002, 128, 526–533. [Google Scholar] [CrossRef]
- Bradley, B.A.; Dhakal, R.P.; Cubrinovski, M.; Mander, J.B.; MacRae, G.A. Improved seismic hazard model with application to probabilistic seismic demand analysis. Earthq. Eng. Struct. Dyn. 2007, 36, 2211–2225. [Google Scholar] [CrossRef]
- Goda, K. Nationwide earthquake risk model for wood-frame houses in Canada. Front. Built Environ. 2019, 5, 128. [Google Scholar] [CrossRef]
- Iervolino, I. Asymptotic behavior of seismic hazard curves. Struct. Saf. 2022, 99, 102264. [Google Scholar] [CrossRef]
- Goulet, C.A.; Bozorgnia, Y.; Abrahamson, N.; Kuehn, N.; Al Atik, L.; Youngs, R.; Graves, R.; Atkinson, G.M. Central and Eastern North America Ground-Motion Characterization-NGA-East Final Report; PEER Report 2018-08; Pacific Earthquake Engineering Research Center: Berkeley, CA, USA, 2018. [Google Scholar] [CrossRef]
- Kolaj, M.; Halchuk, S.; Adams, J. Sixth Generation Seismic Hazard Model of Canada: Final Input Files to Produce Values Proposed for the 2020 National Building Code of Canada; Geological Survey of Canada Open File 8924; Natural Resources Canada: Ottawa, ON, Canada, 2023. [CrossRef]
- Allen, T.I.; Wald, D.J. On the use of high-resolution topographic data as a proxy for seismic site conditions (VS 30). Bull. Seismol. Soc. Am. 2009, 99, 935–943. [Google Scholar] [CrossRef]
- Adhikari, S.R.; Molnar, S.; Wang, J. Seismic microzonation mapping of Greater Vancouver based on various site classification metrics. Front. Earth Sci. 2023, 11, 1221234. [Google Scholar] [CrossRef]
- Nastev, M.; Parent, M.; Benoit, N.; Ross, M.; Howlett, D. Regional VS30 model for the St. Lawrence lowlands, eastern Canada. Georisk Assess. Manag. Risk Eng. Syst. Geohazards 2016, 10, 200–212. [Google Scholar] [CrossRef]
- Yamazaki, F.; Maruyama, Y. Seismic Microzonation. In Encyclopedia of Solid Earth Geophysics; Gupta, H.K., Ed.; Springer: Dordrecht, The Netherlands, 2011. [Google Scholar] [CrossRef]
- Matsuoka, M.; Wakamatsu, K.; Hashimoto, M.; Senna, S.; Midorikawa, S. Evaluation of liquefaction potential for large areas based on geomorphologic classification. Earthq. Spectra 2015, 31, 2375–2395. [Google Scholar] [CrossRef]
- Hobbs, T.E.; Journeay, J.M.; LeSueur, P. Developing a Retrofit Scheme for Canada’s Seismic Risk Model; Geological Survey of Canada Open File 8822; Natural Resources Canada: Ottawa, ON, Canada, 2021. [CrossRef]
- Baker, J.W.; Bradley, B.; Stafford, P. Seismic Hazard and Risk Analysis; Cambridge University Press: Cambridge, UK, 2021; 600p. [Google Scholar] [CrossRef]
- Torisawa, K.; Matsuoka, M.; Horie, K.; Inoguchi, M.; Yamazaki, F. Development of fragility curves for Japanese buildings based on integrated damage data from the 2016 Kumamoto earthquake. J. Disaster Res. 2022, 17, 464–474. [Google Scholar] [CrossRef]
- Sornette, D. Critical Phenomena in Natural Sciences: Chaos, Fractals, Self-Organization and Disorder: Concepts and Tools; Springer: Berlin/Heidelberg, Germany, 2006; 528p. [Google Scholar] [CrossRef]
- Gramacki, A. Nonparametric Kernel Density Estimation and Its Computational Aspects; Springer: Cham, Switzerland, 2018; 176p. [Google Scholar] [CrossRef]
- Fyfe, M. Evaluation of Effectiveness in Seismic Microzonation Hazard Mapping in Canada: Communication, Use, Standardization and Levels. Master’s Thesis, The University of Western Ontario, London, ON, Canada, 2023. [Google Scholar]
- Journeay, M.; LeSueur, P.; Chow, W.; Wagner, C.L. Physical Exposure to Natural Hazards in Canada; Geological Survey of Canada Open File 8892; Natural Resources Canada: Ottawa, ON, Canada, 2022. [CrossRef]
- Goda, K.; Zhang, L.; Tesfamariam, S. Portfolio seismic loss estimation and risk-based critical scenarios for residential wooden houses in Victoria, British Columbia, and Canada. Risk Anal. 2020, 41, 1019–1037. [Google Scholar] [CrossRef]
- Hobbs, T.E.; Journeay, J.M.; Rao, A.S.; Kolaj, M.; Martins, L.; LeSueur, P.; Simionato, M.; Silva, V.; Pagani, M.; Rotheram, D.; et al. A national seismic risk model for Canada: Methodology and scientific basis. Earthq. Spectra 2023, 39, 1410–1434. [Google Scholar] [CrossRef]
- Kohrangi, M.; Bazzurro, P.; Vamvatsikos, D. Seismic risk and loss estimation for the building stock in Isfahan: Part II—Hazard analysis and risk assessment. Bull. Earthq. Eng. 2021, 19, 1739–1763. [Google Scholar] [CrossRef]
- Du, A.; Wang, X.; Xie, Y.; Dong, Y. Regional seismic risk and resilience assessment: Methodological development, applicability, and future research needs—An earthquake engineering perspective. Reliab. Eng. Syst. Saf. 2023, 233, 109104. [Google Scholar] [CrossRef]
- Iwahashi, J.; Kamiya, I.; Matsuoka, M.; Yamazaki, D. Global terrain classification using 280 m DEMs: Segmentation, clustering, and reclassification. Prog. Earth Planet. Sci. 2018, 5, 1. [Google Scholar] [CrossRef]
- Heath, D.; Wald, D.J.; Worden, C.B.; Thompson, E.M.; Scmocyk, G. A global hybrid Vs30 map with a topographic-slope-based default and regional map insets. Earthq. Spectra 2020, 36, 1570–1584. [Google Scholar] [CrossRef]
Disclaimer/Publisher’s Note: The statements, opinions and data contained in all publications are solely those of the individual author(s) and contributor(s) and not of MDPI and/or the editor(s). MDPI and/or the editor(s) disclaim responsibility for any injury to people or property resulting from any ideas, methods, instructions or products referred to in the content. |
© 2025 by the authors. Licensee MDPI, Basel, Switzerland. This article is an open access article distributed under the terms and conditions of the Creative Commons Attribution (CC BY) license (https://creativecommons.org/licenses/by/4.0/).