Abstract
A low-temperature tempering staged drying process was proposed in this study to minimize quality degradation and improve drying efficiency during waxy corn drying. Experiments of continuous drying, low-temperature tempering drying, and low-temperature tempering staged drying were conducted to investigate the drying characteristics and quality of waxy corn. The results showed that the low-temperature tempering drying process could shorten the effective drying time and increase the drying rate during the latter stage of the drying process. Under the same hot air temperature, increasing the tempering temperature from 30 °C to 40 °C reduced the effective drying time by 20 min. The Modified Henderson and Pabis model exhibited the best fit to the experimental drying data (R2 ≥ 0.9864). The microstructural images of the waxy corn flour showed no significant changes among the experimental groups. The color difference (ΔE) of the continuous drying group was higher than that of the other experimental groups. Both the low-temperature tempering drying process and the low-temperature tempering staged drying process caused less damage to the waxy corn with a relatively lower crack ratio, thereby leading to a reduced electrical conductivity value. The starch content of the 80 °C–60 °C–40 °C group was higher than that of the other experimental groups. Based on comprehensive evaluation of the drying characteristics, the color parameters, and the quality of the dried waxy corn, the 80 °C–60 °C–40 °C group represents a favorable alternative.
1. Introduction
Waxy corn (Zea mays L. var. ceratina Kulesh) is rich in nutrients, containing 70–75% starch, over 10% protein, 5% fat, and 2% multivitamins. It serves as a versatile resource that can be processed into food products, used as feed, or employed for producing natural amylopectin. Its economic value is significantly higher than that of common corn [1,2]. In major corn-producing provinces such as Shandong in China, the cropping system is double cropping per year. To ensure timely sowing of winter wheat, waxy corn must be harvested in early October, when its moisture content of waxy corn exceeds 35% wet basis (w.b.). For long-term storage (>6 months), waxy corn is typically dried to a moisture content of 14% w.b., which reduces water activity and inhibits microbial growth [3]. For high moisture grains such as freshly harvested waxy corn, hot air drying is widely adopted due to its relatively high drying efficiency.
Current research on the hot air drying characteristics of corn has mainly focused on the effects of multiple factors, including the hot air temperature, the air velocity, the drying methods, and the tempering duration [4,5,6]. Among these parameters, the hot air temperature has a more significant impact on both the drying characteristics and the product quality. Elevating the hot air temperature accelerates both the surface moisture evaporation and the internal moisture migration rates within the corn kernels, which can significantly improve the drying rate. However, excessive heat adversely affects grain quality, particularly by impairing the nutritional components and causing color changes [7,8]. Baidhe et al. [6] established that the optimal quality retention for high-moisture corn (moisture content exceeding 21% w.b.) is achieved under hot air drying conditions utilizing a temperature range of 65–81 °C and an air velocity of 2–2.6 m/s. Compared with continuous drying, tempering drying is more conducive to achieving moisture equilibrium in corn kernels, reducing their exposure time to high-temperature environments and minimizing quality degradation.
Tempering drying refers to adding a tempering stage in the hot air drying process, during which the material is placed in a heat-isolated environment for a period of time. The internal moisture migrates to the surface of the material, and homogenizes the moisture distribution inside the material [9]. The drying rate can be improved if the material is placed again in an external heat source [10]. A study on the tempering drying of soybeans shows that the tempering process could increase the drying rate and reduce energy consumption compared to continuous drying [11]. An experimental study on solar-assisted heat pump drying of radishes revealed that higher tempering ratios exerted a more significant effect on enhancing drying efficiency and reducing energy consumption [12]. Tempering drying has been widely acknowledged as a promising approach to enhancing energy efficiency and product quality without incurring additional drying costs [13,14]. Under ambient tempering conditions, the drying rate remains low, while the energy required to reheat the material is high. Furthermore, a longer tempering duration will prolong the total drying time of the materials. These factors reduce the drying efficiency of the equipment and increase the heat loss. At present, research on the drying characteristics and quality changes of waxy corn remain limited. It is essential to explore the influences of various hot air drying methods and parameters on the drying characteristics, and thereby determine the optimal drying process.
A low-temperature tempering drying process is proposed, wherein the tempering stage is performed at low temperatures (30 °C, 40 °C) to accelerate moisture redistribution. This study investigated the drying kinetics and quality parameters of waxy corn, with drying temperature (60 °C, 70 °C, 80 °C), tempering temperature (30 °C, 40 °C) and intermittent time (0 min, 60 min) adopted as experimental factors. The effects of the drying experimental factors on the moisture transfer processes, microstructure, and quality changes were analyzed to optimize the drying process for waxy corn.
2. Materials and Methods
2.1. Materials
The experimental raw materials were waxy corn kernels of the cultivar ‘Xianda Nuo 001’, harvested on 3 October 2024 from Binzhou City, Shandong Province, China. The corn harvester used was a Lovol corn harvester, Lovol Heavy Industry Co., Ltd., Weifang, China. The method of oven drying at 105 °C until constant weight was adopted using the LC101-00 Electric Drying Oven in the experiment, and the initial moisture content of the corn kernels was determined to be 35% ± 0.5% w.b. The impurities and broken kernels were removed from the harvested corn kernel, which were then sealed and stored in a 4 °C refrigerator for subsequent experimental use.
2.2. Instruments
The instruments employed in this study were as follows: LC101-00 Electric Drying Oven, Lichen Instrument Technology Co., Ltd., Shanghai, China; DDS-307 Conductivity Meter, Yidian Scientific Instrument Co., Ltd., Shanghai, China; YS4580 Portable Colorimeter, 3NH Technology Co., Ltd., Shenzhen, China; Biotek Synergy H1 Microplate Reader, Agilent Technologies (China) Co., Ltd., Beijing, China; G300 Scanning Electron Microscope (SEM), ZEISS, Oberkochen, Germany; PK-20M Vacuum Freeze Dryer, Hunan Pingke Scientific Instrument Co., Ltd., Changsha, China. JFSD-100-II hammer mill, Shanghai Jiading cereals and oils Instrument Co., Ltd., Shanghai, China.
The LC101-00 electric drying oven features a rated power of 600 W and an inner chamber dimension of 250 × 250 × 250 mm. The internal circulating fan delivers a rated air flow rate of 120 m3/h, ensuring uniform temperature distribution within the chamber. The exhaust port has a diameter of 80 mm with an adjustable opening.
2.3. Experiment Design and Methodology
Three hot air drying treatments were applied to the waxy corn kernels: continuous drying, low-temperature tempering drying, low-temperature tempering staged drying. A full factorial experimental design was adopted to conduct the continuous drying and low-temperature tempering drying experiments of waxy corn. The hot air temperatures were set at 60 °C, 70 °C, and 80 °C, while the tempering temperatures were set at 30 °C and 40 °C. To balance the drying quality and drying efficiency, a low-temperature tempering staged drying experiment (80 °C–60 °C–40 °C) was conducted.
For the continuous drying group, drying experiments were conducted at a constant hot air temperature (60, 70, 80 °C) in an LC101-00 Electric Drying Oven. The material weight was measured every 20 min in the experimental process.
For the low-temperature tempering drying group, drying experiments were divided into drying phase and tempering phase, and the time of each phase was 60 min. The drying phase (60, 70, 80 °C) and tempering phase (30, 40 °C) were carried out alternately in different drying ovens—such as the 60 °C–40 °C test group where the temperature of the drying oven used for drying was set at 60 °C, while the temperature of the drying oven used for tempering was set at 40 °C. The material weight was measured every 30 min at the drying phase and every 60 min at the tempering phase.
For the low-temperature tempering staged drying group, drying experiments were also divided into the drying phase and tempering phase, and the time of each phase was 60 min. The temperature was set at 80 °C for the first 30 min, then at 60 °C for 30 min during the drying phase. The drying phase and tempering phase (40 °C) were carried out alternately. The material weight was measured every 30 min in the drying phase and every 60 min in the tempering phase.
The drying process was terminated when the wet basis moisture content of the corn fell below 10%. Both dried samples and fresh samples were subjected to vacuum freeze-drying for 36 h to homogenize their processing methods and final moisture contents, and fresh samples served as the control group.
The bottom dimension of material trays was 80 × 100 mm, and each tray contained 100 g of material. A total of 11 test groups were designed and implemented in this study (as shown in Table 1). Each treatment was replicated twice, thus requiring 22 experiments in total.

Table 1.
Experiment parameters of hot air continuous drying and low-temperature tempering drying for waxy corn.
To ensure the stability of ambient temperatures during the drying process, multiple hot air drying ovens were deployed, each maintaining an independent and constant temperature environment (as shown in Figure 1).
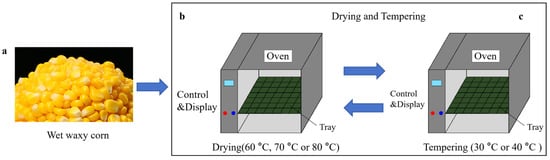
Figure 1.
Drying test process, (a) wet waxy corn, (b,c) drying and tempering oven.
2.4. Drying Characteristic Parameters
2.4.1. Dry Basis Moisture Content
The calculation formula of the dry basis moisture content in the drying process is as follows:
where Mt is waxy corn dry basis moisture content at t time, g/g [15]; mt is waxy corn quality at t time, g; md is waxy corn dry matter quality, g.
2.4.2. Moisture Ratio
Since the equilibrium moisture content of waxy corn is much less than Mt and M0, the formula for calculating the moisture ratio (MR) can be simplified to the following formula [16]:
where M0 is initial dry basis moisture content, g/g.
2.4.3. Drying Rate
Drying rate (DR) was calculated by the following formula [17]:
where Mt1 is dry basis moisture content at t1 time, g/g; Mt2 is dry basis moisture content at t2 time, g/g.
2.5. Drying Model
There are hundreds of mathematical models of the drying process, which are widely used in grain, fruit, vegetable, and other crop drying productions. According to the drying process of waxy corn, four commonly used thin-layer drying models were selected in this paper [18,19,20]. The drying models are as follows in Table 2.
Table 2.
Four commonly used thin layer drying models.
The goodness of model fitting was determined by the coefficient of determination R2, root mean square error (RMSE), and the sum of squared errors (SSE). A coefficient of determination R2 closer to 1 indicates a better degree of model fitting, while smaller values of RMSE and SSE correspond to a higher fitting accuracy.
The effective moisture diffusivity (Deff) for the drying of waxy corn was estimated on the basis of Fick’s second law. Under the assumptions that material shrinkage is neglected, moisture migration occurs via diffusion and the diffusion coefficient remains constant, then, the value of Deff can be calculated using the simplified Equation (4) [21,22]:
where t is the drying time (s), Deff is the effective moisture diffusivity (m2/s), and r is the equivalent radius of corn kernel (3.5 × 10⁻³ m).
The activation energy (Ea) can be calculated from the Arrhenius-type relationship as shown in Equation (5) [23]:
where D0 is the frequency factor of the effective diffusion coefficient (m2/s), Ea is the activation energy (kJ/mol), R is the universal gas constant (8.314 J/(mol·K)), and T is the drying temperature (°C).
2.6. Microstructure
Scanning electron microscope (SEM) images can visually reveal the microstructural changes of corn kernels during drying and clarify the mechanisms of quality damage. Five samples from the control group and the 80 °C experimental group were affixed to specimen stubs using double-sided adhesive tape, followed by platinum sputter-coating. Observation was then conducted under a magnification of 1000× using a G300 scanning electron microscope.
2.7. Color
Color is a commonly used indicator in corn drying, which can directly reflect kernel browning and quality deterioration during the drying process. Dried waxy corn kernels were pulverized into powder using a JFSD-100-II hammer mill and sieved through a 1 mm sieve. Colorimetric analysis of the waxy corn flour from each group was conducted using a YS4580 portable colorimeter to determine the color parameters (L, a, b). Each sample was measured in triplicate, with the mean value calculated as the final result [24]:
where ΔE is color difference, L, a and b are the brightness, red-green and blue-yellow values of the dried waxy corn, L*, a* and b* are the brightness, red-green and blue-yellow values of the waxy corn of control group, respectively.
2.8. Quality Parameters
Quality parameters such as crack ratio, electrical conductivity, starch content, and soluble sugar content can comprehensively reflect the physical damage, cell membrane integrity, and nutritional quality changes of corn during drying. These key parameters provide an essential basis for evaluating the drying quality and optimizing the drying processes to minimize grain damage and nutritional loss.
2.8.1. Crack Ratio
Following the method described by Wen Jing [25], 100 waxy corn kernels were randomly selected from the dried samples and placed on a petri dish. An LED light source was positioned underneath the petri dish. Individual kernels were held with tweezers over the light source and observed under a magnifying glass. A kernel was classified as a cracked kernel if the crack length exceeded half of the kernel’s length. The crack ratio of the sample was calculated as the percentage of cracked kernels relative to the total number of kernels tested. Each sample was analyzed in triplicate.
2.8.2. Electrical Conductivity
Thirty grams of freeze-dried corn kernels were weighed into a beaker, followed by the addition of 200 mL of distilled water. The beaker was placed in a 25 °C water bath and soaked for 24 h [26]. After the soaking period, the electrical conductivity of the aqueous solution was measured using a DDS-307 conductivity meter. Each sample was measured in triplicate, and the mean value was calculated for subsequent analysis.
2.8.3. Starch Content
The starch content was quantified using the anthrone colorimetric method. This method is based on the colorimetric principle that carbohydrates are dehydrated in concentrated sulfuric acid to form furfural derivatives, which then condense with anthrone to produce a blue-green complex. The samples were first hydrolyzed into glucose, and the absorbance was measured at a wavelength of 630 nm using a Biotek Synergy H1 microplate reader. The starch content was calculated from the glucose standard curve and then multiplied by a conversion factor of 0.9. Each sample was measured in triplicate, and the mean value was calculated for subsequent analysis.
2.8.4. Soluble Sugar Content
The soluble sugar content was quantified using the anthrone colorimetric method. The samples were ground and repeatedly extracted with 80% ethanol in a water bath at 80 °C. The clear soluble sugar extract was collected and mixed with anthrone reagent for color development. The absorbance of the solution was measured at a wavelength of 630 nm using a Biotek Synergy H1 microplate reader, and the corresponding sugar content was determined from the standard curve. Each sample was measured in triplicate, and the mean value was calculated for subsequent analysis.
2.9. Data Processing Method
The experimental data were processed by Excel, Origin 9.1, and SPSS27, with subsequent data calculation, fitting, and plotting conducted via these software tools. The statistical test was performed using ANOVA followed by the S-N-K test. The results data were expressed in the form of mean ± standard deviation, and the data were analyzed for significance, with different letters a, b, c, d, e, f indicating significant difference (p < 0.05).
3. Results and Discussion
3.1. Drying Characteristics
Figure 2 illustrates the moisture ratio data obtained under different experimental conditions. Under continuous drying conditions, the drying durations of waxy corn were 300, 260, 180 min at hot air temperatures of 60, 70, 80 °C, respectively. Under low-temperature tempering drying, the total drying durations corresponding to hot air temperatures of 60, 70, 80 °C were 500, 420, 300 min (at 30 °C tempering) and 480, 400, 280 min (at 40 °C tempering), respectively. Additionally, the drying durations of waxy corn were 360 min under the staged drying at hot air temperatures of 80 °C–60 °C and tempering temperatures of 40 °C.
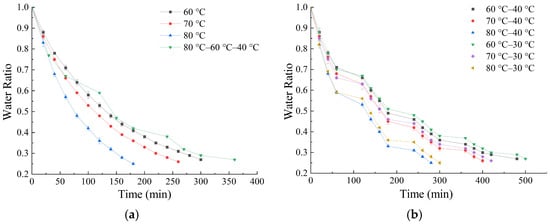
Figure 2.
Moisture ratio curves under different experimental conditions: (a) continuous drying group and low-temperature tempering staged drying group, (b) low-temperature tempering drying group.
The results demonstrated that the low-temperature tempering process prolonged the total drying duration, with lower tempering temperatures further extending it. Compared with continuous drying, it was found that the low-temperature tempering process reduced the effective drying time (total duration excluding tempering stages) of waxy corn. At tempering temperatures of 30 °C and 40 °C, the effective drying times were 260, 240, 180 min and 240, 220, 160 min, corresponding to hot air temperatures of 60, 70, 80 °C, respectively. The drying duration of waxy corn was only 180 min under low-temperature tempering staged drying.
Figure 3 represents the drying rate of waxy corn under different experimental conditions. As shown in Figure 3b, the drying rate curve indicates that the drying process of waxy corn undergoes a phase of increasing rate followed by a phase of decreasing rate, with no constant-rate drying stage observed. Elevated hot air temperatures and tempering temperatures served to accelerate the drying rate. Notably, the drying rate declined significantly during the tempering stage. At the low moisture content stages of waxy corn, the drying rate following the tempering process was higher than that of continuous drying under the same hot air temperature. This is mainly achieved by redistributing moisture inside the material, reducing the internal moisture gradient, avoiding surface hardening, and thus lowering the internal water diffusion resistance.
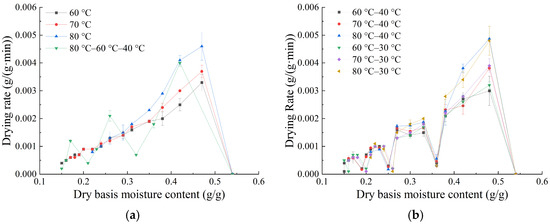
Figure 3.
Drying rate curves under different experimental conditions: (a) continuous drying group and low-temperature tempering staged drying group, (b) low-temperature tempering drying group.
3.2. Drying Model
The fitting statistics for various models for the four test groups at an 80 °C hot air temperature are presented in Table 3. Across all test groups, the R2, SSE, and RMSE values range from 0.9495 to 0.9999, 3.70 × 10⁻⁵ to 5.34 × 10⁻², and 1.92 × 10⁻³ to 6.71 × 10⁻², respectively. Compared to other drying models, the Modified Henderson and Pabis model exhibited the highest R2 values (0.9864–0.9999), the lowest SSE (3.70 × 10⁻⁵–8.09 × 10⁻³), and the lowest RMSE (0.0309–0.0591) values in all experimental treatments. Similar findings were reported for the drying of jujube slices and tomato slices [27,28]. The results demonstrate that the Modified Henderson and Pabis model is well-fitted for multi-stage drying processes, thereby providing critical data support for optimizing the low-temperature tempering drying process of waxy corn, R2 ≥ 0.9864.
Table 3.
Results of the fitting statistics of various models at 80 °C drying temperature.
According to the fitting results, the moisture ratio curves of the continuous drying group (80 °C) and low-temperature tempering staged drying group more closely resembled an exponential function, thus resulting in higher R2 values and better fitting performance. In contrast, the moisture ratio curves of the low-temperature tempering drying groups at 30 °C and 40 °C exhibited a stepped pattern, which led to relatively lower R2 values.
3.3. Effective Moisture Diffusivity and Activation Energy
In this study, the Deff of waxy corn varied from 1.20 × 10⁻⁸ to 3.14 × 10⁻⁸ m2/s (as shown in Table 4), increasing with rising hot air and tempering temperatures. Compared to the low-temperature tempering drying group, the continuous drying group exhibited a shorter total duration, resulting in a higher Deff value. A higher tempering temperature enhanced the moisture migration rate during the tempering stage, which led to an increase in the Deff value under the same hot air temperature. The Deff values of waxy corn drying were higher than those given in previous literature [29,30].
Table 4.
Effective moisture diffusivity and activation energy under different experimental conditions.
The activation energy (Ea) of the drying process for waxy corn varied from 21.69 to 27.01 kJ/mol. The Ea was positively correlated with temperature, indicating that the grain drying process is an endothermic and non-spontaneous process [31,32]. The Ea of the low-temperature tempering drying group at 30 °C was lower than that of the other groups, indicating a reduced energy barrier and lower energy consumption under this condition.
3.4. Morphology of Waxy Corn Flour
Scanning electron microscopy (SEM) images of waxy corn flour under different drying conditions are shown in Figure 4. The waxy corn flour contains starch granules along with some protein-containing germ and seed coat fragments. The starch granules exhibit spherical or polygonal morphologies with varying particle sizes and relatively smooth but uneven surfaces—as the main components of starch, amylose, and amylopectin typically form orthorhombic and hexagonal structures with lipids, proteins, minerals, ions, and glucose nanocrystals [33]. No significant changes in the microscopic morphology of waxy corn flour were observed from the microstructure image among the groups.
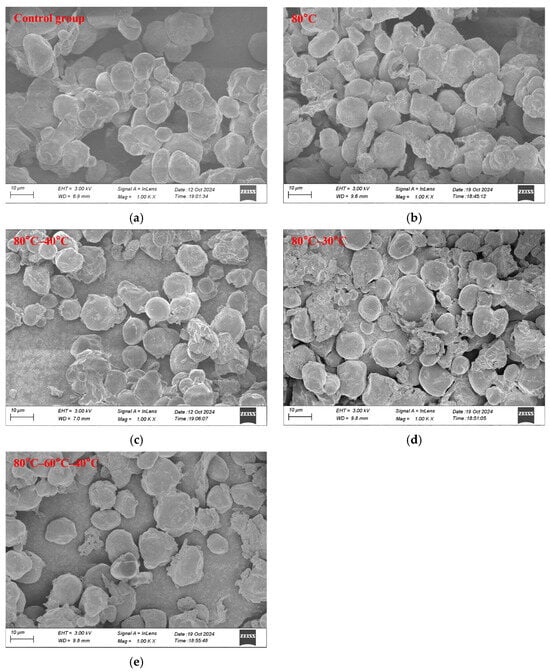
Figure 4.
Microstructure image of waxy corn flour: (a) Control group, (b) 80 °C, (c) 80 °C–40 °C, (d) 80 °C–30 °C, (e) 80 °C–60 °C–40 °C.
3.5. Color of Waxy Corn Flour
The color parameters of waxy corn flour under different drying conditions are shown in Table 5, and the differences in color parameters among the groups are minor. Compared with the control group, the lightness values (L) of the continuous drying groups increased, while the red-green values (a) and blue-yellow values (b) decreased. The L value of the low-temperature tempering drying group did not differ significantly from that of the control group. This is because the high-temperature hot air drying promotes the degradation of carotenoids in the corn [34], resulting in significant pigment loss and an increase in L value. In contrast, freeze-drying minimizes oxidative and enzymatic degradation pathways, thereby preserving the structural integrity and chromophore activity of the carotenoids to maintain near original color profile.
Table 5.
Color values of dried waxy corn flour under different experimental conditions.
There were no significant differences in the L, a, and b values among the continuous drying groups at 60, 70, and 80 °C, while the L mean values were higher than those of other drying groups. The continuous drying group exhibited significantly larger color difference (ΔE) values, indicating greater color change relative to the other drying groups. Moreover, the color difference increased with rising drying temperatures under the same conditions.
3.6. Quality
3.6.1. Crack Ratio
As illustrated in Figure 5, the increment in the crack ratio increased significantly with rising drying temperature. This is because higher temperatures accelerate the drying rate and internal moisture migration, intensifying the stress within the waxy corn kernels and leading to a higher crack ratio. These findings are consistent with the experimental results reported by Shuo Wei et al. [35].
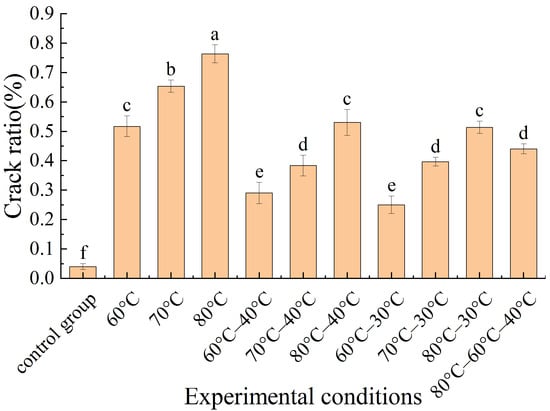
Figure 5.
Crack ratio values of dried waxy corn under different experimental conditions. Note: a–f different superscript letters indicate statistical difference by the test S-N-K (p < 0.05).
At the same hot air temperature, the crack ratio of the low-temperature tempering drying group was significantly lower than that of the continuous drying group. For the low-temperature tempering drying group, the tempering temperature (30 °C, 40 °C) had no significant effect on the crack ratio under identical hot air temperature conditions. The crack ratio of the 80 °C–60 °C–40 °C test group did not significantly differ from that of the 80 °C–30 °C and 80 °C–40 °C test groups and was numerically smaller than that of the other two groups. During the hot air drying of corn kernels, heat is transferred from the kernel surface to the interior, resulting in a higher surface temperature than the internal temperature. Consequently, the moisture evaporation rate at the surface exceeds the rate of inward-to-outward moisture migration. The resulting moisture gradient and temperature gradient between the exterior and interior induce the formation of stress cracks. Owing to their polymeric starch composition, cereal grains are highly prone to drying-induced stress cracking, and grain breakage represents one of the primary causes of quality deterioration and grain loss [36]. The changes in the starch structure due to glass transition are associated with moisture content and temperature changes during drying, and most stress cracks are formed upon cooling [37].
3.6.2. Electrical Conductivity
Electrical conductivity, serving as a quantitative indicator of changes in cell membrane permeability, enables the evaluation of cell membrane damage in the corn kernels induced by different drying conditions. Notably, a higher electrical conductivity value indicates lower seed viability in waxy corn [26]. Figure 6 shows the electrical conductivity of waxy corn under different drying conditions, and the trend of electrical conductivity among all experimental groups is consistent with that of the crack ratio. Specifically, the electrical conductivity of groups under 60 °C hot air drying with tempering at 30 °C or 40 °C showed no significant difference from that of the control group and was lower than that of the other drying groups. At the same hot air temperature, the electrical conductivity values of the continuous drying groups were consistently higher than those of the low-temperature tempering drying groups. The results indicate that the low-temperature tempering process mitigates kernel damage and results in a lower electrical conductivity in the waxy corn kernels. Furthermore, the electrical conductivity values increased with rising drying temperatures. This phenomenon can be attributed to the fact that higher drying temperatures lead to a higher crack ratio in the waxy corn kernels, thereby increasing the leaching of intracellular substances during the soaking process. The results are consistent with the findings of Junhu Cheng [38].
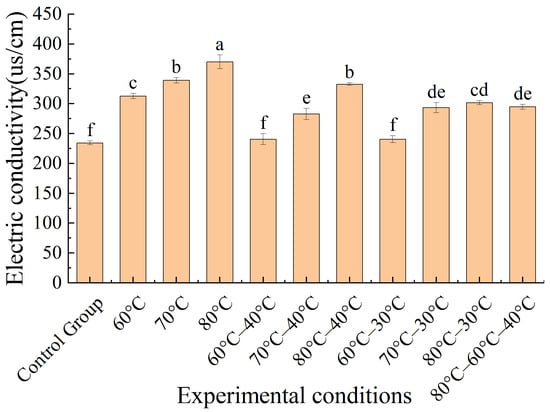
Figure 6.
Electrical conductivity of dried waxy corn under different experimental conditions. Note: a–f different superscript letters indicate statistical difference by the test S-N-K (p < 0.05).
3.6.3. Starch Content and Soluble Sugar Content
Figure 7 shows the starch and soluble sugar contents of the dried waxy corn under different drying conditions. Compared with the control group, the starch content of the waxy corn decreased in all treatment groups. At the same hot air temperature, the low-temperature tempering drying groups (30 °C, 40 °C) exhibited higher starch contents than the continuous drying group. As the hot air temperature increased, the starch content of the dried waxy corn decreased, with the 80 °C continuous drying group showing the lowest value. This phenomenon may be attributed to starch gelatinization and elevated viscosity at higher temperatures. Meanwhile, starch molecules—especially amylopectin in the amorphous regions—undergo slow hydrolysis, yielding small quantities of reducing sugars such as maltose and glucose, which contribute to the observed decrease in starch content. This finding is consistent with the results reported by Paul Malumba [39]. In contrast, the low-temperature tempering process reduced the effective drying time, resulting in less reduction in starch content. The starch content of the low-temperature tempering staged drying group (80 °C–60 °C–40 °C) was only slightly lower than that of the control group and showed no significant difference compared with the low-temperature tempering drying groups at hot air temperatures 60 °C and 70 °C.
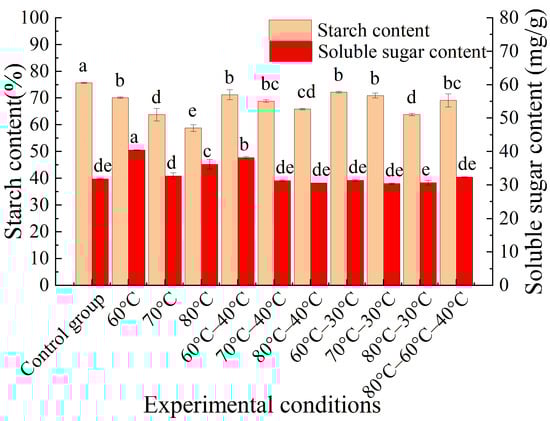
Figure 7.
Starch and soluble sugar contents of dried waxy corn under different experimental conditions. Note: a–e different superscript letters indicate statistical difference by the test S-N-K (p < 0.05).
Compared with the low-temperature tempering drying group, the soluble sugar content of the waxy corn in the continuous drying group was higher at the same hot air temperature. This may be attributed to partial starch degradation during the continuous hot air drying process, which increased the soluble sugar content. In the low-temperature tempering drying group, the soluble sugar content did not change significantly compared with the control group, and the temperature changes had a minimal effect on the soluble sugar content. The waxy corn after low-temperature tempering drying had a lower soluble sugar content and exhibited better storage stability. This is due to the fact that soluble sugars in corn kernels act as the direct energy source for kernel respiration, and soluble sugar content also plays a crucial role in seed germination. A decrease in soluble sugar content will reduce the physiological and biochemical reactions of corn kernels.
4. Discussion
Waxy corn exhibits an extremely high amylopectin content, endowing it with processing properties that cannot be achieved by common corn, making it irreplaceable in high-end food processing and specialized modified starch production. Up to now, the studies of the tempering drying of corn have mainly analyzed the effects of different tempering ratios and tempering durations on the drying characteristics of corn. Under ambient tempering conditions, the drying rate is low and the energy consumption for the reheating of materials is high. These factors also reduce the drying efficiency of the equipment and increase heat loss.
A low-temperature tempering drying process is proposed in this study. The results show that the tempering stage performed at low temperatures (30 °C, 40 °C) can accelerate moisture redistribution and improve the drying rate. Compared with the continuous drying group, the effective drying times at tempering temperatures of 30 °C and 40 °C were reduced to 40, 20, 0 min and 60, 40, 20 min, corresponding to hot air temperatures of 60, 70, 80 °C, respectively. At the low moisture content stages of waxy corn, the drying rate following the tempering process was higher than that of continuous drying. The results demonstrate that the low-temperature tempering process facilitates moisture equilibration of corn and reduces the magnitude of grain temperature decline, thereby shortening the effective drying time. The findings align with prior results on jujube slices [27].
At different hot air temperatures, the waxy corn in the low-temperature tempering drying group shows a lower cracking ratio and electrical conductivity but a higher starch content than those in the continuous drying group. Nevertheless, the cracking ratio and electrical conductivity increased, while the starch content decreased with the rise of the hot air temperature. The low-temperature tempering process can reduce the moisture gradient between the interior and exterior of the waxy corn kernels, thereby relieving the stress induced by such gradients during drying, which can decrease the cracking rate [40]. After corn samples were soaked in water for a period of time, soluble substances or electrolytes in the corn leached out through the cell membrane—the greater the leakage, the poorer the integrity of the cell membrane and the higher the conductivity of the soaking solution [38]. Thus, electrical conductivity and cracking ratio exhibited the same variation trend. The observed decrease in starch content can be attributed to starch gelatinization and the accompanying increase in viscosity at elevated temperatures, as well as the slow hydrolysis of starch molecules—particularly amylopectin in the amorphous regions. The low-temperature tempering process prevented waxy corn from remaining at a high temperature for a prolonged period, resulting in fewer reductions in starch content.
The increase in color difference is attributed to the intensification of both the Maillard reaction and carotenoid degradation at higher temperatures [23,41]. The continuous drying group exhibited significantly larger color difference (ΔE) values. The application of the low-temperature tempering process reduced the effective drying time and shortened the exposure time to the drying environment, thereby decreasing the color difference values. No significant changes in the microscopic morphology of the waxy corn flour were observed from the microstructure image of the different hot air drying groups. The results indicating that the granular and crystalline structures of corn starch remained intact under drying conditions of 60–80 °C.
To balance drying quality and drying efficiency, a low-temperature tempering staged drying test (80 °C–60 °C–40 °C) was conducted. The drying duration of the waxy corn was only 180 min. Compared with other drying groups at a hot air temperature of 80 °C, it exhibited lower cracking rate, electrical conductivity, and color difference value, as well as a higher starch content. Based on comprehensive evaluation of the drying characteristics, color parameters, and quality of the dried waxy corn, the 80 °C–60 °C–40 °C group represents a favorable alternative. The quality of the dried waxy corn was optimal under the 60 °C–30 °C low-temperature tempering drying process. If the drying efficiency is not considered, the 60 °C–30 °C low-temperature tempering drying process achieves the best drying quality and is therefore the optimal choice.
The Modified Henderson and Pabis model is well-fitted for multi-stage drying processes, thereby providing critical data support for optimizing the low-temperature tempering drying process of waxy corn, R2 ≥ 0.9864. This superior performance can be attributed to two key factors: the integration of additional exponential terms to account for deviations from the original assumptions, coupled with the model’s inherent flexibility and its comprehensive consideration of supplementary terms and parameters associated with grain shape and non-uniform moisture distribution [42].
A limited number of experimental parameters were adopted for low-temperature tempering staged drying in this study, which constitutes a certain limitation. Future research can further enlarge the experimental factors and levels and systematically investigate their effects on the drying quality and drying characteristics of waxy corn.
5. Conclusions
The low-temperature tempering drying process effectively reduces the effective drying time of waxy corn and enhances the drying rate during the latter stage of drying, with the maximum reduction in effective drying time reaching 20%. Among the models tested, the Modified Henderson and Pabis model exhibited the best fit to the experimental drying data of waxy corn. The Deff of waxy corn varied from 1.20 × 10⁻⁸ to 3.14 × 10⁻⁸ m2/s, and the Ea of waxy corn varied from 21.69 to 27.01 kJ/mol.
Among the different hot air drying groups, no significant differences were observed in the microscopic morphology of the waxy corn flour. The low-temperature tempering drying group exhibited smaller color differences, lower crack ratio, and reduced electrical conductivity. The soluble sugar content of the low-temperature tempering drying group did not change significantly compared with the control group.
Based on the quality of the dried waxy corn, the 60 °C–30 °C low-temperature tempering drying process was identified as the optimal drying process. Based on comprehensive evaluation of the drying characteristics, color parameters, and quality of the dried waxy corn, the 80 °C–60 °C–40 °C group represents a favorable alternative.
Author Contributions
Conceptualization, Q.S., M.H. and Z.Z.; methodology, Q.S. and X.Y.; software, Q.S. and Q.Y.; validation, Q.S. and Z.J.; formal analysis, Q.S. and Q.Y.; investigation, Q.S. and M.H.; resources, Z.Z. and Z.J.; data curation, Q.S. and Q.Y.; writing—original draft preparation, Q.S. and Q.Y.; writing—review and editing, Q.S., Z.Z. and X.Y.; visualization, Q.S., D.G. and M.H.; supervision, D.G. and F.Z.; project administration, Q.S. and Z.Z.; funding acquisition, Z.Z. and F.Z. All authors have read and agreed to the published version of the manuscript.
Funding
This research was funded by Agricultural Science and Technology Innovation Project of the Shandong Academy of Agricultural Sciences: CXGC2026B11; Key Research and Development Program (Major Science and Technology Innovation Project) of Shandong Province: 2024CXGC010901; National Natural Science Foundation of China Youth Science Fund Project: 32201691.
Institutional Review Board Statement
Not applicable.
Informed Consent Statement
Not applicable.
Data Availability Statement
The datasets generated for this study are available upon request from the corresponding author.
Conflicts of Interest
The authors declare no conflicts of interest.
References
- Dang, D.; Guan, Y.; Zheng, H.; Zhang, X.; Zhang, A.; Wang, H.; Ruan, Y.; Qin, L. Genome-wide association study and genomic prediction on plant architecture traits in sweet corn and waxy corn. Plants 2023, 12, 2020303. [Google Scholar] [CrossRef]
- Li, X.; Wang, J.; Qu, Y.; Li, Y.; Humaira, Y.; Muhammad, S.; Pu, H.; Yu, L.; Li, H. Comparison of storage and lignin accumulation characteristics between two types of snow pea. PLoS ONE 2022, 17, e0268776. [Google Scholar] [CrossRef] [PubMed]
- Akter, F.; Muhury, R.; Sultana, A.; Deb, U.K. A Comprehensive Review of Mathematical Modeling for Drying Processes of Fruits and Vegetables. Int. J. Food Sci. 2022, 2022, 6195257. [Google Scholar] [CrossRef] [PubMed]
- Chen, P.; Wang, X.; Fan, M.; Tian, G.; Zhu, W.; Zhu, Y.; Jin, Y. Simulation study of moisture and heat migration during hot air drying of corn with stacked structures based on CFD-DEM. J. Stored Prod. Res. 2025, 112, 102627. [Google Scholar] [CrossRef]
- An, J.; Xie, H.; Yan, J.; Wei, H.; Wu, Y.; Liao, X. A review of applications of energy analysis: Grain, fruit and vegetable drying technology. Energy Rep. 2024, 12, 5482–5506. [Google Scholar] [CrossRef]
- Baidhe, E.; Clementson, C.L.; Hellevang, K.; Lin, Z. Optimization of high-temperature drying conditions for enhanced quality of high-moisture corn. Smart Agric. Technol. 2025, 12, 101271. [Google Scholar] [CrossRef]
- Coradi, P.C.; Maldaner, V.; Lutz, V.; Daí, P.V.d.S.; Teodoro, P.E. Influences of drying temperature and storage conditions for preserving the quality of maize postharvest on laboratory and field scales. Sci. Rep. 2020, 10, 22006. [Google Scholar] [CrossRef] [PubMed]
- Ren, G.; Zhang, L.; Zeng, F.; Li, Y.; Li, L.; Duan, X. Effects of hot air drying temperature and tempering time on the properties of maize starch. Int. J. Agric. Biol. Eng. 2020, 13, 236–241. [Google Scholar] [CrossRef]
- Hou, Y.; Wu, W.; Wang, H.; Zhang, H.; Guan, C. Effect of intermittent ratio on the performance of a closed-loop heat pump drying system with a novel ternary refrigerant and on the drying characteristics of corn kernels. Int. Commun. Heat Mass Transf. 2025, 161, 108541. [Google Scholar] [CrossRef]
- Yang, Z.; Zhu, E.; Zhu, Z.; Wang, J.; Li, S. A comparative study on intermittent heat pump drying process of Chinese cabbage (Brassica campestris L. ssp) seeds. Food Bioprod. Process. 2013, 91, 381–388. [Google Scholar] [CrossRef]
- Defendi, R.O.; Paraíso, P.R.; Jorge, L.M.d.M. Optimization study of soybean intermittent drying in fixed-bed drying technology. Dry. Technol. 2017, 35, 125–137. [Google Scholar] [CrossRef]
- Singh, A.; Sarkar, J.; Rekha Sahoo, R. Experimentation on solar-assisted heat pump dryer: Thermodynamic, economic and exergoeconomic assessments. Sol. Energy 2020, 208, 150–159. [Google Scholar] [CrossRef]
- Kumar, C.; Karim, M.A.; Joardder, M.U.H. Intermittent drying of food products: A critical review. J. Food Eng. 2014, 121, 48–57. [Google Scholar] [CrossRef]
- Wang, B.; Wang, J. Mechanical properties of maize kernel horny endosperm, floury endosperm and germ. Int. J. Food Prop. 2019, 22, 863–877. [Google Scholar] [CrossRef]
- Noshad, M.; Ghasemi, P. Influence of freezing pretreatments on kinetics of convective air-drying and quality of grapes. Food Biosci. 2020, 38, 100763. [Google Scholar] [CrossRef]
- Başlar, M.; Kılıçlı, M.; Toker, O.S.; Sağdıç, O.; Arici, M. Ultrasonic vacuum drying technique as a novel process for shortening the drying period for beef and chicken meats. Innov. Food Sci. Emerg. Technol. 2014, 26, 182–190. [Google Scholar] [CrossRef]
- Mohan, V.P.C.; Talukdar, P. Experimental Studies for Convective Drying of Potato. Heat Transf. Eng. 2014, 35, 1288–1297. [Google Scholar] [CrossRef]
- Henderson, S.M.; Pabis, S. Grain drying theory, II. Temperature effects on drying coefficients. J. Agric. Eng. Res. 1961, 44, 1111–1122. [Google Scholar]
- Hii, C.L.; Law, C.L.; Cloke, M. Modeling using a new thin layer drying model and product quality of cocoa. J. Food Eng. 2009, 90, 191–198. [Google Scholar] [CrossRef]
- Karathanos, V.T. Determination of water content of dried fruits by drying kinetics. J. Food Eng. 1999, 39, 337–344. [Google Scholar] [CrossRef]
- Kumar, A.; Kandasamy, P.; Chakraborty, I.; Hangshing, L. Analysis of energy consumption, heat and mass transfer, drying kinetics and effective moisture diffusivity during foam-mat drying of mango in a convective hot-air dryer. Biosyst. Eng. 2022, 219, 85–102. [Google Scholar] [CrossRef]
- Crank, J. The Mathematics of Diffusion, 2nd ed.; Oxford University Press: London, UK, 1975. [Google Scholar]
- Odjo, S.; Malumba, P.; Dossou, J.; Janas, S.; Béra, F. Influence of drying and hydrothermal treatment of corn on the denaturation of salt-soluble proteins and color parameters. J. Food Eng. 2012, 109, 561–570. [Google Scholar] [CrossRef]
- Pei, Y.; Li, Z.; Song, C.; Li, J.; Xu, W.; Zhu, G. Analysis and modelling of temperature and moisture gradient for ginger slices in hot air drying. J. Food Eng. 2022, 323, 111009. [Google Scholar] [CrossRef]
- Wen, J. Study on Characteristics and Quality of Vacuum Drying of Corn. Master’s Thesis, Sichuan Agricultural University, Chengdu, China, 2019. [Google Scholar]
- Shi, H.; Ke, Y.; Liu, Y.; Yu, X. Optized conditions of the electrical conductivity method for detem ination of seed vigor in maizel. Seed 2008, 7–10. [Google Scholar] [CrossRef]
- Bao, T.; Hao, X.; Shishir, M.R.I.; Karim, N.; Chen, W. Cold plasma: An emerging pretreatment technology for the drying of jujube slices. Food Chem. 2021, 337, 127783. [Google Scholar] [CrossRef]
- Erick César, L.-V.; Ana Lilia, C.-M.; Octavio, G.-V.; Isaac, P.F.; Rogelio, B.O. Thermal performance of a passive, mixed-type solar dryer for tomato slices (Solanum lycopersicum). Renew. Energy 2020, 147, 845–855. [Google Scholar] [CrossRef]
- Kumar, N.; Sagar, K.; Seth, N. Mathematical modelling and characterization of drying of pre-treated sweet corn (Zea mays L.) kernels. J. Food Sci. Technol. 2022, 59, 3989–3996. [Google Scholar] [CrossRef]
- An, N.-n.; Sun, W.; Li, D.; Wang, L.-j.; Wang, Y. Effect of microwave-assisted hot air drying on drying kinetics, water migration, dielectric properties, and microstructure of corn. Food Chem. 2024, 455, 139913. [Google Scholar] [CrossRef] [PubMed]
- Cavalcanti-Mata, M.E.R.M.; Duarte, M.E.M.; Lira, V.V.; Oliveira, R.F.D.; Costa, N.L.; Oliveira, H.M.L. A new approach to the traditional drying models for the thin-layer drying kinetics of chickpeas. J. Food Process Eng. 2020, 43, e13569. [Google Scholar] [CrossRef]
- Lisboa, H.M.; Araujo, H.; Paiva, G.; Oriente, S.; Pasquali, M.; Duarte, M.E.; Mata, M.E.R.M.C. Determination of characteristic properties of mulatto beans (Phaseolus vulgaris L.) during convective drying. J. Agric. Food Res. 2019, 1, 100003. [Google Scholar] [CrossRef]
- Esquivel-Fajardo, E.A.; Martinez-Ascencio, E.U.; Oseguera-Toledo, M.E.; Londoño-Restrepo, S.M.; Rodriguez-García, M.E. Influence of physicochemical changes of the avocado starch throughout its pasting profile: Combined extraction. Carbohydr. Polym. 2022, 281, 119048. [Google Scholar] [CrossRef]
- Multari, S.; Marsol-Vall, A.; Keskitalo, M.; Yang, B.; Suomela, J.-P. Effects of different drying temperatures on the content of phenolic compounds and carotenoids in quinoa seeds (Chenopodium quinoa) from Finland. J. Food Compos. Anal. 2018, 72, 75–82. [Google Scholar] [CrossRef]
- Wei, S.; Xiao, B.; Xie, W.; Wang, F.; Chen, P.; Yang, D. Stress simulation and cracking prediction of corn kernels during hot-air drying. Food Bioprod. Process. 2020, 121, 202–212. [Google Scholar] [CrossRef]
- Mwaro, W.B.; Maranga, S.M.; Ikua, B.; Kanali, C.L. (Eds.) Modeling Maize Grain Breakage in the Drag Chain Conveyor Handling Systems. In Proceedings of the 2014 International Conference on Sustainable Research and Innovation, Nairobi, Kenya, 7–9 May 2014. [Google Scholar]
- Zheng, Z.; Ren, L.; Fu, H.; Yang, P.; Lv, L.; Xu, J.; Yang, D. Effect of glass transition on the formation of drying cracks in the component parts of maize kernels. Biosyst. Eng. 2023, 236, 131–146. [Google Scholar] [CrossRef]
- Cheng, J.; Zhou, X.; Zhang, Y.; Deng, L.; Ren, H. Analysis of correlation between quality characteristics and starch yield of dried maize. J. Henan Univ. Technol. (Nat. Sci. Ed.) 2010, 31, 37–42. [Google Scholar] [CrossRef]
- Malumba, P.; Janas, S.; Roiseux, O.; Sinnaeve, G.; Masimango, T.; Sindic, M.; Deroanne, C.; Béra, F. Comparative study of the effect of drying temperatures and heat-moisture treatment on the physicochemical and functional properties of corn starch. Carbohydr. Polym. 2010, 79, 633–641. [Google Scholar] [CrossRef]
- Liu, H.; He, Y.; Tang, T.; Zhai, M. Cracking prediction of germinated brown rice based on intragranular drying kinetics. Powder Technol. 2022, 406, 117587. [Google Scholar] [CrossRef]
- Huang, Y.; Sun, Y.; Mehmood, A.; Lu, T.; Chen, X. Unraveling the temporal changes of Maillard reaction products and aroma profile in coffee leaves during hot-air drying. J. Food Compos. Anal. 2024, 128, 106055. [Google Scholar] [CrossRef]
- Chekole Mihret, Y.; Tekeste Hailemesikel, S.; Getnet Alemu, A.; Admasu Delele, M. Modeling the drying kinetics, performance evaluation, and economic analysis of rice drying using a rice husk-fueled mixed-flow dryer. Energy Convers. Manag. X 2024, 24, 100774. [Google Scholar] [CrossRef]


Disclaimer/Publisher’s Note: The statements, opinions and data contained in all publications are solely those of the individual author(s) and contributor(s) and not of MDPI and/or the editor(s). MDPI and/or the editor(s) disclaim responsibility for any injury to people or property resulting from any ideas, methods, instructions or products referred to in the content. |
© 2026 by the authors. Licensee MDPI, Basel, Switzerland. This article is an open access article distributed under the terms and conditions of the Creative Commons Attribution (CC BY) license.