Abstract
The low level of mechanization in the production process of cumin seeds is one of the primary factors limiting their yield and economic efficiency. To enhance the mechanization of cumin seed production, this study focused on cumin seeds as the research subject. Physical parameters of cumin seeds were determined through physical experiments; based on these parameters, a discrete element model of cumin seeds was established, and the shear modulus was calibrated using angle of repose tests. The established model was used to simulate the seeding process of a seed drill, the model’s accuracy was verified by analyzing the seed trajectory, movement velocity, seeding quality, and the dynamic angle of repose of seeds inside the drill. Results indicated that the collision recovery coefficient, static friction coefficient, and rolling friction coefficient between cumin seeds and ABS plastic, stainless steel plates, and other cumin seeds were 0.3, 0.35, and 0.21; 0.49, 0.39, 0.24; and 0.24, 0.38, 0.18, respectively. Calibration via simulated cylinder accumulation tests yielded a deviation of 0.28% between the simulated accumulation angle and the physical accumulation angle at a shear modulus of 100 MPa; the simulated seed trajectory during dispensing closely matched physical dispensing tests. The average deviation in particle drop velocity within the bridge channel region was 4.23%, with a maximum deviation of 6.07%; the average deviation in dynamic packing angle from start to finish for the particle group was 2.84%, with a maximum deviation of 4.18%; and the average mass discharged from the 14 simulated seed nozzles was 0.0446 g, compared to 0.043 g in physical tests, with a deviation of 3.72%. These results demonstrate the high accuracy and reliability of the established cumin discrete element model and its parameters, providing technical support for the design and optimization of full-process mechanical cumin production systems.
1. Introduction
Cumin belongs to the aromatic plant genus Foeniculum within the Apiaceae family. The entire plant is edible, and its dried fruits serve as a classic spice widely used in braised dishes, baking, and other applications [1]. In recent years, with the rapid development of the food processing and catering industries, demand for cumin has continued to grow. Xinjiang is one of China’s primary cumin-producing regions, with a cultivation area of 3 million mu (approximately 200,000 hectares) and an annual output of 120,000 tons, accounting for over 90% of the national total. Given this situation, conducting research on the physical properties of cumin seeds and establishing simulation models based on the EDEM represents a crucial pathway for enhancing the level of full mechanization. The physical parameters of cumin seeds not only form the foundation for the authenticity and reliability of simulation models but also provide essential data support for the design of full mechanization equipment. Simulation models constructed using the EDEM can simulate the motion, forces, and interactions of seeds and related materials under mechanical action within a computer environment. For instance, in seeding equipment, the model can simulate seed dispensing processes, providing a basis for optimizing dispensing structure parameters [2,3,4]; in harvesting equipment, the model can analyze force distribution exerted by harvesting devices on seeds, enabling adjustments to operational parameters to reduce seed breakage rates [5,6,7,8]; and in air-cleaning equipment, the model can predict the movement trajectories of seeds and impurities within air currents, allowing for the matching of appropriate air speeds and feed rates to reduce impurity content and improve cleaning quality [9]. This approach enables the identification and correction of design flaws before prototype manufacturing, eliminating the need for repeated field trials constrained by seasonal and environmental factors in traditional research and development. Consequently, it shortens development cycles, reduces costs, and advances the full mechanization of cumin production. As a numerical simulation method based on the assumption of discontinuity, the EDEM can effectively simulate the interactions between granular materials and agricultural machinery.
Currently, numerous scholars have conducted discrete element modeling studies on agricultural materials. Du et al. [10] conducted discrete element simulation parameter calibration for tea stems, providing reliable parameter references for the development of harvesting equipment. Guo et al. [11] calibrated simulation model parameters for sunflower seed extractables, laying the foundation for mechanized operation simulations during sunflower combined harvesting. Xie et al. [12] established a simulation model for Panax notoginseng roots, providing theoretical foundations and technical support for subsequent research on root–soil separation platforms. Miao et al. [13] established a Pinus sylvestris var. mongolica seed model. Through simulation analysis of seedling tray vibration parameters under varying amplitude and frequency conditions, they investigated the effects of tray vibration parameters on the spatial morphology of Pinus sylvestris var. mongolica seed populations. Yang et al. [14] developed a Leymus chinensis seed discrete element model. The model’s reliability was validated through angle of repose tests, providing a reference basis for studying the interaction mechanism between Leymus chinensis seeds and machinery using the EDEM. Guo et al. [15] established a discrete element model for sorghum seeds, calibrated contact parameters between seeds and photosensitive resin materials, and validated parameter accuracy through comparisons between simulation results and physical experiments, as well as t-tests. This provides parameter references for discrete element simulation of mechanized sorghum seeding. While standard specimens of the aforementioned materials allow direct measurement of parameters like shear modulus, cumin seeds present unique challenges. Their small particle size and distinctive rhombic structure result in physical properties significantly different from those of crop seeds studied in existing research, making accurate shear modulus determination via direct measurement difficult. To advance the full mechanization of cumin production, it is necessary to establish a dedicated discrete element model for cumin seeds and calibrate its shear modulus parameters.
This study focuses on cumin seeds. First, physical parameters of cumin seeds were determined through physical experiments, based on which a discrete element model was established. The shear modulus was calibrated using angle of repose tests. Subsequently, the calibrated model was employed to simulate the operation process of the seed drill. The accuracy of the model was verified by analyzing the seed trajectory, movement velocity, seed distribution quality, and the dynamic angle of repose of seeds within the drill. These results provide effective technical support for the design and optimization of equipment for cumin seed sowing, harvesting, and wind-sorting.
2. Materials and Methods
The sample used in this study is “Xinyue Cumin No. 1,” sourced from the Kashgar region of Xinjiang. Its purity is ≥92.0%, cleanliness is ≥95.0%, germination rate is ≥75.0%, and moisture content is ≤12.0%.
2.1. Experimental Equipment
To measure the geometric dimensions, moisture content, density, impact recovery coefficient, friction coefficient, and angle of repose of cumin seeds, the following equipment is required: 500-196-30 vernier caliper (Mitutoyo Corporation, Kawasaki, Japanese, accuracy 0.01 mm), RB-9023A electric heating constant-temperature drying oven (Nanjing Runbang Machinery Technology Co., Ltd., Nanjing, China), SQP-QUINTIX35-1CN electronic balance (Sartorius Scientific Instruments (Beijing) Co., Ltd., Beijing, China, accuracy: 0.01 mg), graduated cylinder (capacity: 50 mL), XM3-103 high-definition high-speed camera (Shenyang Xingmai Technology Co., Ltd., Shenyang, China), inclinometer (Taizhou Hongrui Teaching Equipment Co., Ltd., Taizhou, China), ABS cylinder, and XWGP-II fruit quality tester (Harbin Xinwang Hanko Machinery Equipment Co., Ltd., Harbin, China).
2.2. Method
2.2.1. Measurement of Geometric Dimensions
To obtain the distribution of geometric dimensions for the seeds, 200 cumin seeds were randomly selected. Their geometric dimensions were measured using a vernier caliper, and statistical analysis was conducted on the seed dimensions. The distribution of geometric dimensions for cumin seeds is shown in Figure 1, exhibiting a normal distribution. The primary distribution ranges for seed length, width, and height were 4.8–5 mm, 1.5–1.6 mm, and 1.3–1.4 mm, respectively, providing a basis for the geometric dimensions of the cumin discrete element model.
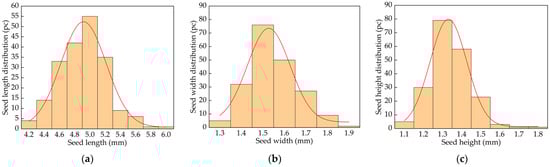
Figure 1.
Geometric size distribution of cumin seeds. (a) Seed length; (b) Seed height; (c) Seed width.
2.2.2. Determination of Moisture Content
To determine the moisture content of cumin seeds using the low-temperature drying method, first place the cumin seed container in an oven and pre-dry it at (103 ± 2) °C for 30 min. Remove it, allow it to cool to room temperature, and weigh its mass (m0). Next, weigh 8 g of cumin seeds using an electronic balance. After grinding and pulverizing, prepare five samples, each approximately 1 g, and placed them into the pre-weighed cumin seeds container boxes as shown in Figure 2. The total mass of the cumin seeds and container boxes before drying (m1) should be recorded. Place the sample containers into the drying oven and dry at (103 ± 2) °C for 18 h. Immediately after drying, seal the containers and cool to room temperature. Weigh the total mass of the dried cumin seeds and containers (m2). Substitute this data into Equation (1) to determine the moisture content of the cumin seeds.
where m0 is the weight of the container box, (g); m1 is the weight of the seeds and container box before drying, (g); m2 is the weight of the seeds and container box after drying, (g).
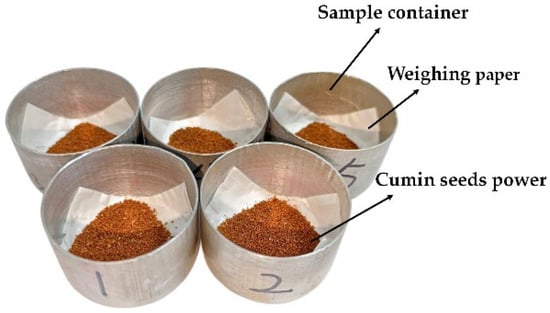
Figure 2.
Sample preparation.
2.2.3. Determination of Density
When determining density, the liquid immersion method is commonly used. However, since some cumin seeds float on the water surface and are difficult to fully submerge in the liquid, the pore-filling method [16] was employed instead. In this method, the liquid is replaced with fine sand, as shown in Figure 3. Prior to the experiment, 10 mL of fine sand was measured using a graduated cylinder. Its mass was weighed on an electronic balance at 13.7 g. Substituting this value into Equation (2) yielded a density of 1.37 g/cm3 for the fine sand. Next, 4 g of cumin seeds was weighed using an electronic balance. These seeds were thoroughly mixed with the 10 mL of fine sand before being poured into the graduated cylinder. The mixture was gently shaken and compacted to minimize voids within the mixture’s volume, ultimately yielding a total volume of 13.3 mL for the seeds and sand. Substituting into Equation (3) yielded the density of the cumin seeds.
where m is the mass of sand (g); v is the volume of sand (mL).
where M is the mass of seeds (g); V1 is the combined volume of seeds and sand, (mL); V2 is the volume of sand (mL).
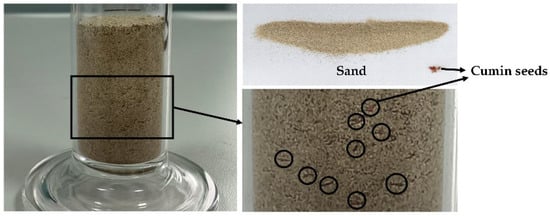
Figure 3.
Volume measurement of cumin seeds.
2.2.4. Determination of Collision Recovery Coefficient
The collision recovery coefficient is a key physical parameter measuring a seed’s ability to return to its initial state after impact. A higher value indicates stronger deformation recovery capability post-collision [17,18]. This parameter is crucial in discrete element simulations, and drop tests are employed to accurately determine its numerical value.
Due to the small size of cumin seeds, the initial drop height was set to 0.25 m to achieve a more pronounced rebound height [19]. During the fall and rebound process, the base of the cumin seeds remained fixed against the contact plate, with a pre- and post-impact velocity of 0 m/s [20]. The maximum rebound height h’ after impact was recorded using an XM3-103 high-definition high-speed camera, as shown in Figure 4. Substituting into Equation (4), the average value was obtained after repeating the experiment 10 times. Contact plates included ABS plate, stainless steel plate, and cumin seed plate. The cumin seeds were uniformly bonded onto a wooden board to create a seed plate made of bonded cumin seeds, measuring the collision recovery coefficient between cumin seeds [21].
where v1 is the velocity of the seed before colliding with the material plate, (m/s); v2 is the velocity of the seed after colliding with the material plate, (m/s); v3 is the velocity of the material plate before colliding with the seed, (m/s); v4 is the velocity of the material plate after colliding with the seed, (m/s); h is the initial height from which the seed falls, (m); and h′ is the maximum height reached by the seed after bouncing off the plate, (m).
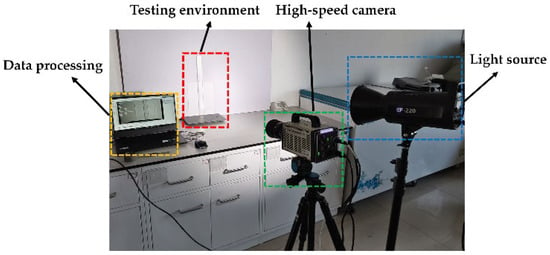
Figure 4.
Determination of collision recovery coefficient.
2.2.5. Determination of Friction Coefficient
- Static Friction Coefficient.
The static friction coefficient is also a crucial parameter in discrete element simulation. To accurately obtain its value, an inclinometer was used to measure the static friction coefficient between cumin seeds and the contact plate, as shown in Figure 5. The contact plates used were made from the three material types described in Section 2.2.4: ABS plates, stainless steel plates, and cumin seed plates. During measurement, the contact plate was placed horizontally. Cumin seeds were placed on the contact plate, and the inclined plate was slowly raised. When the angle of the inclined plate reached a certain point, the cumin seeds transitioned from stationary to sliding. The angle at this point was recorded using a protractor [22]. This angle was substituted into Equation (5) to calculate the static friction coefficient. The experiment was repeated 10 times, and the average value was taken.
where θ is the angle of the inclined plate, (°).
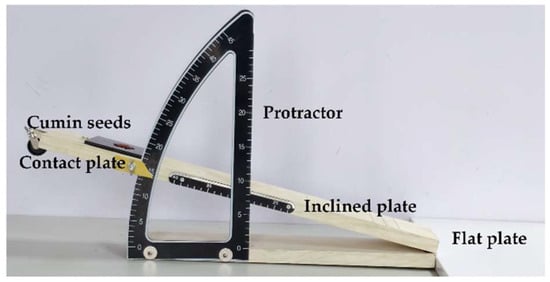
Figure 5.
Inclinometer.
- 2.
- Rolling Friction Coefficient.
The rolling friction coefficient not only reflects the quality of material flow properties but also serves as a crucial parameter in discrete element modeling. It will be directly applied in subsequent simulations of cylindrical pile tests and seed dispensing processes in seed drills, extending further to the simulation of harvesting and wind-sorting operations. Similarly, an inclinometer was used to measure the rolling friction coefficient between cumin seeds and the contact plate [23]. Based on extensive preliminary tests, cumin seeds were placed at a position S = 0.08 m on the inclined plane, with the inclined plate set at a 21° angle. The seeds rolled down the inclined plane from a state of zero initial velocity. Under rolling friction, the seeds rolled a distance L on the flat surface after leaving the contact plate before stopping [24]. Substituting these data into Equation (6) yielded the rolling friction coefficient for cumin seeds. Assuming cumin seeds are ideal ellipsoids, the rolling process involved pure rolling without slippage. The test was repeated 10 times, and the average value was taken.
where m is the mass of the cumin seed, (kg); β is the angle of inclination of the inclined plane, (°); μ is the coefficient of rolling friction; S is the length of the seed’s slide down the inclined plane, (m); L is the distance the seed slides on the horizontal plane, (m).
2.2.6. Model Development
- 1.
- Modeling of Cumin Seeds
When performing particle discrete element modeling using EDEM 2022 software, increasing the number of spherical particle cells enhances the fidelity of the particle model but also prolongs simulation time and reduces efficiency. Therefore, while ensuring minimal modeling error, the number of spherical particles should be minimized [24]. To balance computational accuracy and computational load, this study approximates cumin seeds using 11 spheres bonded together. The sphere radii and position coordinates are listed in Table 1. The outer envelope of the 11 spheres forms an ellipse with a major axis α = 5 mm and a minor axis β = 1.4 mm. The model is shown in Figure 6.

Table 1.
Modeling parameters for cumin granules.
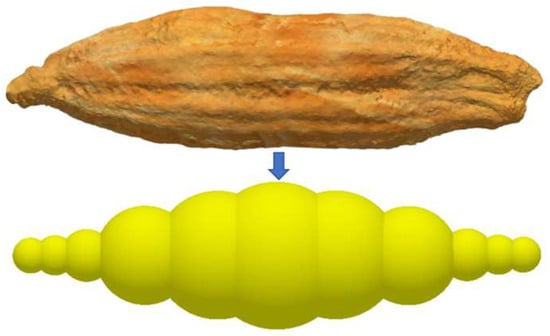
Figure 6.
Discrete element simulation particle model for cumin seeds.
- 2.
- Contact Model Selection
When conducting discrete element simulations, the selection of contact models is particularly critical for the accuracy of simulation results. Due to the low moisture content of cumin seeds, their surfaces remain dry, making it difficult to form continuous and stable liquid bridges between adjacent seeds. Consequently, the liquid bridge force can be disregarded. Under low-moisture conditions, the microscopic adhesion effects on the seed surface are extremely weak, resulting in numerically small adhesion coefficients that have negligible influence on the macroscopic mechanical behavior and bulk properties of the particles. Therefore, the Hertz–Mindlin (no slip) contact mechanics model [25] was employed for simulation analysis. This model accurately describes elastic collisions, sliding friction, and rolling behavior of particles, fully accounting for energy dissipation and momentum transfer during contact. Additionally, it offers high computational efficiency and excellent numerical stability, making it the widely adopted default contact model in EDEM software, as shown in Figure 7. This contact model simplifies the mechanical analysis of grains. The contact force between two grains can be decomposed into normal and tangential components at the contact point [26]. Both tangential and normal contact forces are simplified as parallel connections of a spring and a damper, with the tangential force additionally constrained by Coulomb friction. The spring provides an opposing repulsive force between two seeds in collision contact, while the damper acts like a shock absorber, dissipating part of the relative kinetic energy between the colliding seeds [27].
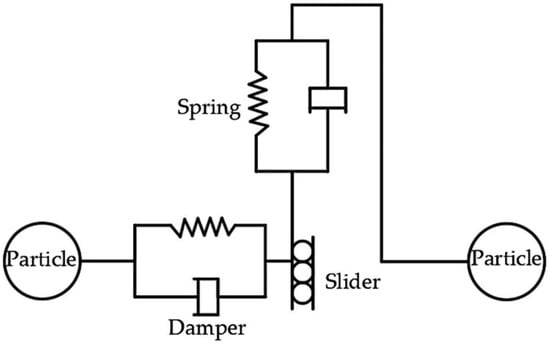
Figure 7.
Hertz–Mindlin (no slip) contact mechanics model.
According to Newton’s second law, the equation of translational motion for each particle is:
Normal elastic force :
Normal damping force :
Tangential elastic force :
Tangential damping force
where E is the equivalent elastic modulus, (Pa); R* is the equivalent contact radius, (m); δn is the normal overlap, (m); kn is the normal stiffness coefficient, (N/m); is the normal component of relative particle velocity, (m/s); ζ is the damping ratio; e is the collision recovery coefficient; m* is the equivalent mass, (kg); G* is the equivalent shear modulus, (Pa); kt is the tangential stiffness coefficient, (N/m); δt is the tangential overlap distance, (m); is the tangential component of the relative velocity between particles, (m/s).
kt = 8G*R*δn
In simulation, the tangential force is also related to Coulomb friction, ensuring that the resultant tangential force does not exceed the maximum static friction force. When this maximum value is exceeded, particles slip at the contact surface [28]. Therefore, the tangential force can be expressed as:
where μ is the coefficient of static friction.
Additionally, the particles are subjected to the torque Tt caused by tangential forces and the rolling friction torque Tr. Therefore, the rotational motion equation for each grain of rice is:
Among them:
where I is the rotational inertia of the particle; ωi is the angular velocity, rad/s; Ri is the distance (vector) from the center of mass of particle i to the contact point.
- 3.
- Modeling and Experimental Validation of Geometric Bodies
- (1)
- Modeling and Experimental Validation of the Cylindrical Pile Test
- Modeling of the Cylindrical Body
Due to the small size of cumin seeds, preparing standard specimens is challenging, making direct measurement of shear modulus difficult. Therefore, the cylindrical pile test combined with simulation calibration was employed to obtain this parameter. First, the cylinder was modeled. Its dimensions were determined based on the particle size of cumin seeds [29], with the cylinder diameter set to 4–5 times the maximum seed diameter and a height-to-diameter ratio of 3:1. Thus, the cylinder parameters were established as diameter 30 mm and height 90 mm. To simulate cumin particle flow and accumulation on ABS plates, and given known contact parameters between cumin and ABS, both the bottomless cylinder and the bottom contact plane were modeled using ABS material for the flow accumulation simulation.
- Simulation Condition Setup
After generating the cylinder geometry, a plane surface was established above the cylinder as the particle factory. 34 g of cumin particles was generated and distributed to fill the entire cylinder. The time integration method was set to Eulerian, with a fixed time step of 20%. The mesh size was set to 3 times the minimum particle radius [30,31,32]. After particle filling, the cylinder was set to rise slowly in the positive direction perpendicular to the plane. Particles gradually flowed out from the cylinder’s base, eventually forming a stable particle pile on the bottom plate. The particle pile was recorded, with the simulation process shown in Figure 8.

Figure 8.
Simulation process of cumin seed aggregation. (a) Overall seed drop behavior in simulation; (b) Filling with cumin seeds; (c) Cumin seeds flowing out; (d) Cumin seed pile formation.
In EDEM simulation of pile formation tests, besides the shape and properties of the seeds themselves and the specifications of the cylinder, the lifting speed of the cylinder also influences the pile morphology. As the lifting speed increases, particles at the edges of the seed pile gradually disperse; conversely, excessively low speeds increase computational load and prolong simulation time [33]. When the cylinder’s lifting speed increases from 0.01 m/s to 0.10 m/s, the edge particles of the granular pile gradually disperse. To balance accuracy and computational efficiency, the geometric lifting speed of 0.05 m/s adopted by Jia Fuguo [34] is referenced.
- Physical Angle of Repose Experiment Validation
To validate the accuracy of the modeled system and the calibration of shear modulus parameters, a physical angle of repose experiment was conducted, as shown in Figure 9. During testing, the ABS cylinder was secured to the quality inspection instrument. To ensure consistent motion, the device’s speed control function was used to set the physical test speed to match the simulated test speed of 0.05 m/s [34]. Multiple tests were conducted under no-load conditions to confirm stable speed. Afterward, cumin seeds were filled into the ABS cylinder, and the cylinder was lifted at a constant speed to minimize errors caused by cylinder vibration and eccentricity. Finally, the seeds naturally accumulated at the bottom to form a conical pile. After resting for 1 min, a horizontal photograph was taken. This procedure was repeated five times.
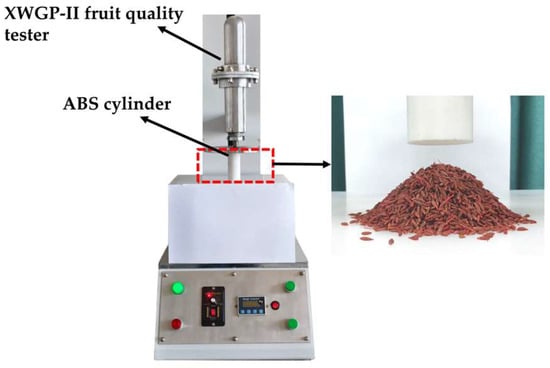
Figure 9.
Physical angle of repose test for cumin seeds.
- (2)
- Seed Drill Modeling and Experimental Validation
- Seed Drill Modeling
The cumin seed drill is the core device for achieving full mechanization in cumin cultivation. To further validate the accuracy of the cumin discrete element model under actual operating conditions, the seed distribution process within the distributor was simulated.
First, a 3D model of the seeder was constructed in SolidWorks 2024, as shown in Figure 10. Non-essential components such as the seed nozzle were removed to reduce simulation time [35], as shown in Figure 11. Subsequently, the simplified model was imported into EDEM in .STEP format.
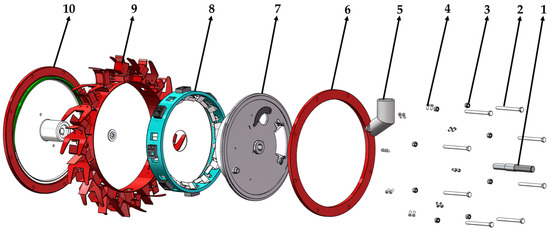
Figure 10.
Seed drill structural diagram. 1. Rotating shaft; 2. Bolt fastener; 3. Nut; 4. Rivet; 5. Seed guide tube; 6. Front mounting plate; 7. Seed inlet plate; 8. Seed pickup belt; 9. Seed discharge nozzle; 10. Rear mounting plate.
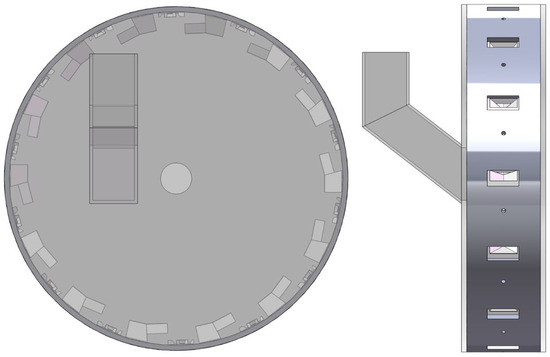
Figure 11.
Seed drill simulation model.
- Simulation Condition Setup
A plane was established above the seed delivery tube as the particle factory, generating 200 g of cumin particles at a rate of 0.1 kg/s, followed by a 1.2 s rest period. The seed drill was set to rotate counterclockwise at 6 r/min, with the simulation period spanning 3.2 to 21 s. Time integration was set to Eulerian with a fixed time step of 10% to simulate the cumin seed dispensing process.
- Drill Experimental Validation
To verify the accuracy of the cumin model within the drill, a test bench for the cumin seed drill was constructed, replacing the front mounting plate with a transparent acrylic sheet. An XM3-103 high-definition high-speed camera captured the movement of cumin seeds within the drill, as shown in Figure 12.
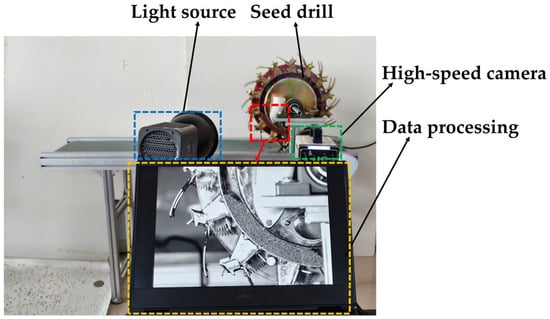
Figure 12.
Cumin seed drill test bench.
3. Results
3.1. Physical Characteristics of Cumin Seeds
Based on the methods described in Section 2.2.1, Section 2.2.2, Section 2.2.3, Section 2.2.4 and Section 2.2.5 several physical properties of cumin seeds were measured, as shown in Table 2. During discrete element simulation, shear modulus serves as the core parameter determining a seed’s force response, deformation. However, due to the small size of cumin seeds, direct measurement of shear modulus is challenging. Therefore, a parameter calibration method was employed to determine the shear modulus of cumin seeds. This enables the simulation model to progressively approximate real mechanical behavior, thereby avoiding repeated trial-and-error in equipment design caused by inaccurate parameters. Parameter calibration is a systematic method that compares simulation results with physical test data through iterative adjustments to finalize uncertain parameters in the simulation model. Initially, existing parameters were applied to EDEM, which provided a reference value. This reference value was then adjusted up or down, with the angle of repose serving as the validation metric. After verification, the shear modulus of cumin seeds was finally determined to be 100 MPa.
Table 2.
Physical characteristics of cumin seeds.
3.2. Angle of Repose Test Verification
To minimize human error in measuring the angle of repose, image processing techniques in MATLAB 2019 software are employed to measure the angle of repose of particles. The specific procedure is as follows: The stable simulated particle pile image is divided into two left-right symmetrical halves. The smoother left contour is selected for grayscale processing, binarization, and hole filling to extract a clear contour line. A fitting equation is obtained through linear fitting [36], and the simulated angle of repose for cumin seeds is ultimately calculated using Equation (19).
where θ is the angle of repose of cumin seed particles, (°); k is the slope of the contour fitting line for cumin seed particles.
Figure 13e shows the linear fitting equation for the unilateral profile of the cumin seed pile: Y = 0.631X − 12.782, k = 0.631. The angle of repose calculated from Equation (19) is 32.25°. Repeating the cumin simulation pile-up test five times yielded the following pile angles: 32.33°, 32.78°, 32.9°, 32.58°, and 32.25°, with an average of 32.57° and a standard deviation of 0.25°. Therefore, the EDEM simulation yielded a cumulation angle of 32.57° ± 0.25° for cumin seeds.
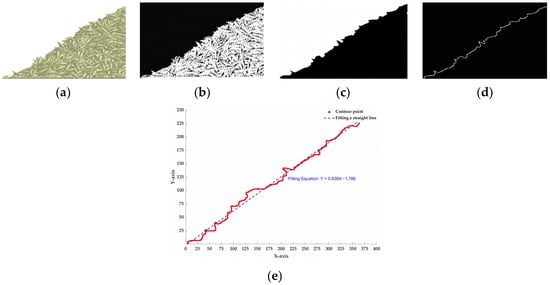
Figure 13.
Image processing of simulated angle of repose. (a) Single-sided image; (b) Binarization; (c) Hole filling; (d) Edge extraction; (e) Linear fitting.
Using the same image processing method, the pile-up images from five physical experiments were analyzed, yielding the following physical angle of repose values for cumin: 32.98°, 32.94°, 32.98°, 32.0°, and 32.42°. Calculations showed that the average value was 32.66°, with a standard deviation of 0.39°. Thus, the physical angle of repose for cumin seeds was determined to be 32.66° ± 0.39°, exhibiting a deviation of 0.28% compared to the simulated angle of 32.57° ± 0.25°. This result validates the high predictive accuracy of the cumin discrete element model. Parameter calibration also determined the shear modulus of cumin seeds to be 100 MPa.
Figure 14 shows the comparison between experimental and simulated results. While the pile morphology appears similar, the simulated image exhibits slight differences in slope smoothness compared to the actual seed pile. This discrepancy arises because the simulation uses uniformly sized particles, whereas the experimental data, despite sieving, retains some particle size dispersion.
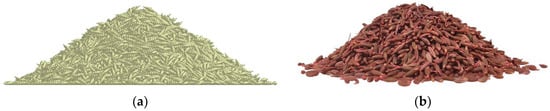
Figure 14.
Comparison test of angle of repose for cumin granules. (a) Simulated accumulation morphology; (b) Physical accumulation morphology.
3.3. Verification of the Seed Drill’s Seeding Process
To validate the accuracy of the cumin seed discrete element model during the seeding process, the state of seeds falling from a specific bridge chute and the accumulation state of seed clusters over time were analyzed, with corresponding physical experiments conducted for verification.
In EDEM, the bridge chute area was selected and divided into five contiguous zones along the seed movement path to analyze the seed falling process, with the specific zoning shown in Figure 15a. In the physical experiment, an XM3-103 high-definition high-speed camera synchronously recorded the seeds’ trajectories. Comparing the simulation with the physical experiment, seeds exhibited the complete process of accumulation, scattering, and eventual fall on the bridge chute, as shown in Figure 16.
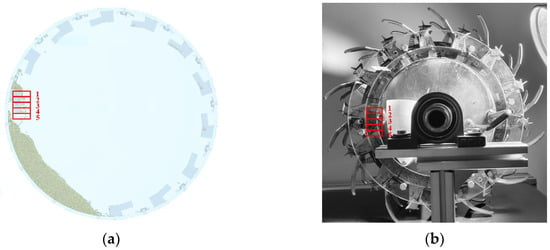
Figure 15.
Comparison of overall condition of fallen cumin Seeds. (a) Overall seed drop behavior in simulation; (b) Overall seed drop status during the trial.
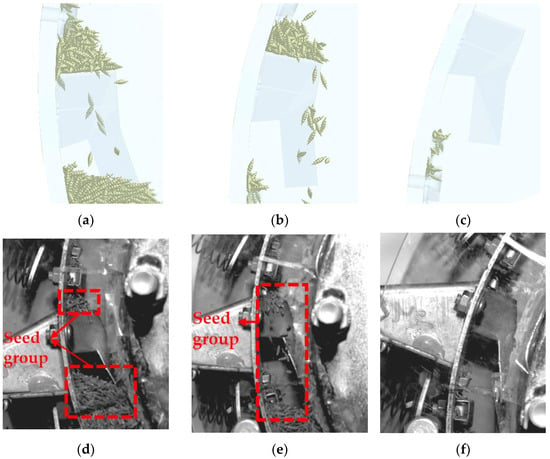
Figure 16.
Comparison of the dropping process of cumin seeds. (a) Simulated drop at 8.8 s; (b) Simulated drop at 9.1 s; (c) Simulated drop at 9.8 s; (d) Actual drop at 8.8 s; (e) Actual drop at 9.1 s; (f) Actual drop at 9.8 s.
Additionally, the dynamic accumulation patterns of seeds within the seed drill during simulation and experiment were analyzed, as depicted in Figure 17. Images captured at multiple time points reveal that the seed pile angle in the simulation gradually increased from 95.61° at the start to 144.98°, ultimately reaching 167.62% upon completion. Compared to the actual pile angles of 98.83°, 143.20°, and 164.20°, the maximum deviation was 4.18% with an average deviation of 2.84%, as shown in Figure 18.
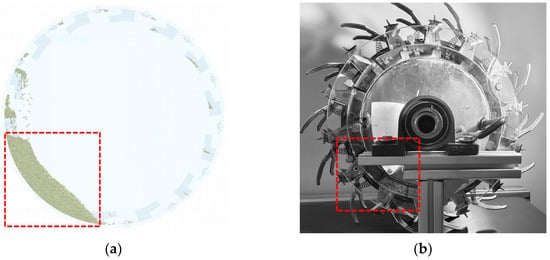
Figure 17.
Comparison of overall accumulation status of cumin seeds. (a) Overall state of seed accumulation in simulation; (b) Overall state of seed accumulation in experiment.
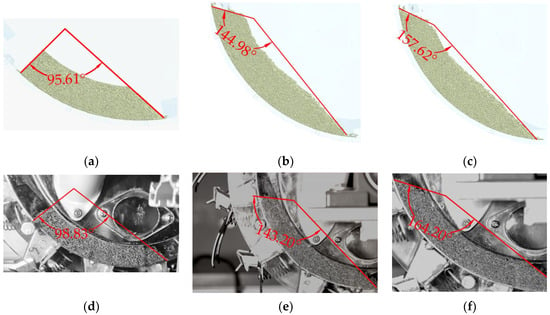
Figure 18.
Comparison of the accumulation process of cumin seeds. (a) Simulation accumulation at 3.2 s; (b) Simulation accumulation at 8 s; (c) Simulation accumulation at 21 s; (d) Actual accumulation at 3.2 s; (e) Actual accumulation at 8 s; (f) Actual accumulation at 21 s.
To further validate the discrete element model of cumin seeds, quantitative analysis was conducted on the seed drop velocity over the bridge chute and the mass discharge from the seed spout.
The average drop velocity of seeds in each of the five consecutive zones within Figure 15 was calculated, as shown in Figure 19. The simulated particle drop velocities of 0.903, 0.773, 0.681, 0.631, and 0.431 exhibited an average deviation of 4.23% compared to the actual velocities of 0.944, 0.744, 0.642, 0.625, and 0.458. Although simulation and experimental velocities showed discrepancies in certain zones, both exhibited an overall decreasing trend with zone variation. To verify the significance of these zone-specific differences, a one-way ANOVA statistical test was conducted, as shown in Table 3. The result yielded p > α (α = 0.05), indicating no statistically significant difference between simulated and actual drop velocities.
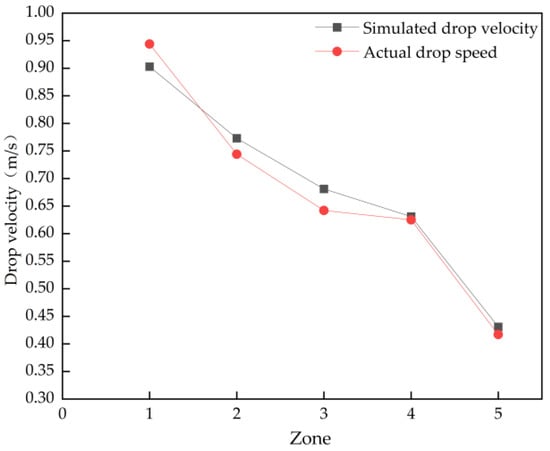
Figure 19.
Comparison of simulated compared to actual falling speed across 5 regions.
Table 3.
Analysis of variance table for simulation and experimental results of cumin seed falling speed.
In the EDEM simulation, an appropriately sized Grid Bin Group was set up at the seed spout beneath the seed drill to measure the mass of seeds discharged from each spout, thereby obtaining the simulated seed distribution. In the physical test, the 14 seed spouts were numbered, and cumin seeds discharged from each spout were collected separately. An electronic balance was used to weigh the actual mass of seeds dropped from each spout.
The seed discharge quantities from each dispensing nozzle obtained through simulation and experiment were compared, with the results shown in Figure 20. Although discrepancies exist between the simulated and actual drop masses for different nozzles, the average simulated drop mass of 0.0446 g exhibits a deviation of 3.72% compared to the average actual drop mass of 0.043 g.
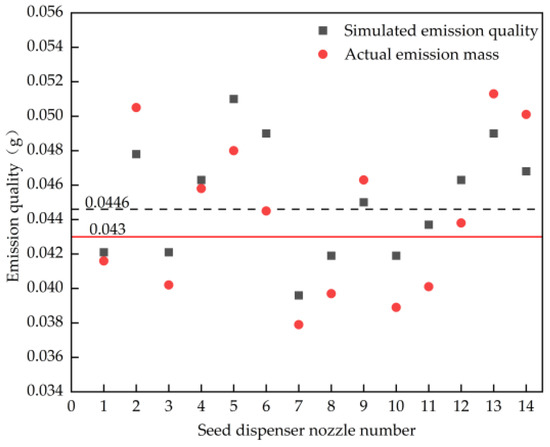
Figure 20.
Comparison of simulated and actual discharge quality for different seed dispensing nozzles.
The results collectively demonstrate that the established cumin discrete element model can accurately simulate the movement trajectory, velocity, dynamic angle of repose, and seed distribution within the seed drill. This model provides an effective simulation analysis tool for the design and optimization of full-process mechanical equipment for cumin production.
4. Discussion
This study characterized the physical properties of cumin seeds, addressing their irregular morphology and minute particle size, thereby providing parameterization for model development. Through cylindrical pile tests, the shear modulus was calibrated to ensure model–material consistency. Using the calibrated model, the seeding process within a seed drill was simulated, with physical bench tests validating the simulation results.
Compared to existing research, the discrete element method has demonstrated broad applicability in studying interactions between agricultural crops and machinery. For instance: Chen et al. [37] achieved an error of only 1.16% between the simulated and physical angle of repose for Sesbania seeds through parameter calibration, and validated the model’s suitability for seed drill simulation by comparing results with experimental bench tests; Fan et al. [38] proposed a universal wheat stalk model that realistically reproduces physical behavior during harvesting, providing crucial references for improving harvesting equipment and optimizing harvesting processes; Zhang et al. [39] simulated the air-classification process of chili peppers, analyzing their motion states and separation mechanisms during air classification, offering theoretical foundations for enhancing air-classification efficiency; and Guo et al. [40] analyzed the effects of varying wind speeds, screen inclination angles, and aperture shapes on impurity content and loss rates by simulating rice grain and stalk movement behavior. Collectively, these studies demonstrate the applicability and reliability of discrete element technology across different mechanized crop production stages. They further validate the credibility of discrete element simulation in cumin seed distribution modeling, providing robust theoretical support for related seeder design and process optimization.
5. Conclusions
This study determined the physical parameters of cumin seeds through physical experiments and EDEM simulation software, subsequently establishing a discrete element model for cumin seeds. The shear modulus was calibrated using angle of repose tests. Based on the calibrated discrete element model, the seeding process of cumin seeds in a seed drill was simulated. The main conclusions are as follows:
- Physical experiments measured the collision recovery coefficient, static friction coefficient, and rolling friction coefficient between cumin seeds and ABS board, stainless steel plate, and cumin seeds themselves as follows: 0.3, 0.35, 0.21; 0.49, 0.39, 0.24; 0.24, 0.38, 0.18.
- The shear modulus of cumin seeds was calibrated via a cylindrical pile test. When the shear modulus was set to 100 MPa, the simulated angle of repose was 32.57° ± 0.25°, exhibiting a deviation of 0.28% compared to the physical angle of repose of 32.66° ± 0.39°. This validated the reasonableness of the parameter value.
- Simulation and physical testing analysis of the cumin seed distribution process: The simulated drop velocities of particles in the bridge chute region were 0.903, 0.773, 0.681, 0.631, and 0.431, compared to actual velocities of 0.944, 0.744, 0.642, 0.625, and 0.458, yielding an average deviation of 4.23%. The simulated angle of repose values of 95.61°, 144.98°, and 157.62° exhibited an average deviation of 2.84% and a maximum deviation of 4.18% compared to the actual values of 98.83°, 143.20°, and 164.20°; the average mass of seeds discharged from the 14 simulated seed-dispensing nozzles was 0.0446 g, exhibiting a deviation of 3.72% compared to the physical test average of 0.043 g. The results demonstrate that the cumin discrete element model can accurately simulate the state of cumin seeds during the seeding process, providing reliable technical support for the design and optimization of full-process mechanical cumin production systems.
Author Contributions
Conceptualization, Y.Z.; methodology, P.C. and H.W.; investigation, L.L.; resources, Y.Z.; data curation, W.C.; writing—original draft preparation, P.C. and H.W.; writing—review and editing, P.C. and H.W.; visualization C.W.; supervision, J.M.; project administration, Y.Z. and L.L.; funding acquisition, Y.Z. All authors have read and agreed to the published version of the manuscript.
Funding
This research was funded by the First Division of the Xinjiang Production and Construction Corps’ Science and Technology Research Program: Development and Demonstration of Key Equipment for Cotton–Cumin Co-sowing, grant number 2024ZB03 and the Autonomous Region’s Financial Support Program for Agricultural Mechanization Development: Research and Development, Manufacturing, Promotion, and Application of Harvesting Equipment for Cumin Intercropping Systems, grant number CF2025-07.
Institutional Review Board Statement
Not applicable.
Informed Consent Statement
Not applicable.
Data Availability Statement
The data presented in this study are available on request from the corresponding author.
Acknowledgments
The authors are grateful to the anonymous reviewers for their comments.
Conflicts of Interest
The authors declare no conflicts of interest.
References
- Zhang, Y.L.; Lai, X.; Zhang, Q.Y. Optimization of ultrasonic-assisted extraction process and analysis of chemical composition and activity of essential oil from fennel seeds. Chin. Condiment 2025, 50, 142–147. [Google Scholar] [CrossRef]
- Xie, J.; Zhang, H.; Feng, H. Design and Experiment of Friction Adjustable Precision Seed Feeder Device for Wheat Experimental Sowing. Trans. Chin. Soc. Agric. Mach. 2025, 56, 164–173. [Google Scholar] [CrossRef]
- Li, M.S.; Wang, P.; Yan, Y.L. Design and experiment of chain-spoon type maize precision seed metering device. Trans. Chin. Soc. Agric. Eng. 2025, 41, 77–89. [Google Scholar] [CrossRef]
- Xu, J.; Sun, S.; He, Z.; Wang, X.; Zeng, Z.; Li, J.; Wu, W. Design and Optimisation of Seed-Metering Plate of Air-Suction Vegetable Seed-Metering Device Based on DEM-CFD. Biosyst. Eng. 2023, 230, 277–300. [Google Scholar] [CrossRef]
- Yu, Y.F.; Li, L.X.; Yang, Z.Y.; Yang, D.Q.; He, Z.F.; Teng, S.M.; Hua, R.J.; Xie, S.J. Research on automatic throwing and loading system for silage harvester. Trans. Chin. Soc. Agric. Mach. 2025, 56, 63–75. [Google Scholar] [CrossRef]
- Li, X.; Salem, A.; Liu, Y.; Sun, B.; Shi, G.; He, X.; Wang, D.; Chang, Z. Design and Experiment of a Dual-Disc Potato Pickup and Harvesting Device. AgriEngineering 2025, 7, 148. [Google Scholar] [CrossRef]
- Jin, F.; Yang, S.H.; Zhang, J.S. Design and test of variable gap transition section for corn grain harvester. Trans. Chin. Soc. Agric. Mach. 2025, 56, 349–360. [Google Scholar] [CrossRef]
- Liu, S.; Yang, X.; Zhang, Z.; Xu, J.; Zhao, P.; Tian, S.; Wei, L.; Ning, X. Design and Simulation of Chinese Cabbage Harvester. Agriculture 2025, 15, 831. [Google Scholar] [CrossRef]
- Zhao, L.; Ma, X.D.; Guo, B.J. Simulation Study on Grain Cleaning Based on DEM-CFD Coupling. J. Shandong Agric. Univ. 2020, 51, 738–743. [Google Scholar] [CrossRef]
- Du, Z.; Li, D.H.; Li, X.P. Calibration and Experiment of Discrete Element Model Parameters for Tea Stem. Trans. Chin. Soc. Agric. Mach. 2025, 56, 311–320. [Google Scholar] [CrossRef]
- Guo, H.; Han, J.X.; Lü, Z.S. Discrete Element Model Construction and Parameter Calibration of Combined Harvest Oil Sunflower Extract. Trans. Chin. Soc. Agric. Mach. 2025, 56, 319–330. [Google Scholar] [CrossRef]
- Kaiting, X.; Zhaoguo, Z.; Fa’an, W.; Xiaolan, Y.; Chenglin, W.; Shifei, J. Calibration and Experimental Verification of Discrete Element Parameters of Panax Notoginseng Root. Int. J. Agric. Biol. Eng. 2024, 17, 13–23. [Google Scholar] [CrossRef]
- Miao, Z.; Li, Z.; Xu, K.; Wu, L.; Su, N.; Song, G.; Liu, Y. The Numerical Simulation Analysis of Pinus Sylvestris Var. Mongolica Seeds Vibration Situation Based on EDEM. IOP Conf. Ser. Earth Environ. Sci. 2019, 252, 052111. [Google Scholar] [CrossRef]
- Yang, L.; Chen, W.; Kan, Z.; Meng, H.; Qi, J. Parameter calibration for discrete element simulation of Leymus chinensis seeds based on RSM optimization. Sci. Rep. 2025, 15, 79. [Google Scholar] [CrossRef]
- Mi, G.; Liu, Y.; Wang, T.; Dong, J.; Zhang, S.; Li, Q.; Chen, K.; Huang, Y. Measurement of Physical Properties of Sorghum Seeds and Calibration of Discrete Element Modeling Parameters. Agriculture 2022, 12, 681. [Google Scholar] [CrossRef]
- Pottbäcker, J.; Hinrichsen, O. Experimental study on the influence of filling method and particle material on the packed-bed porosity. Chem. Ing. Tech. 2017, 89, 454–458. [Google Scholar] [CrossRef]
- Liu, C.; Zhang, H.; Li, Z.; Zeng, Z.; Zhang, X.; Gong, L.; Li, B. Experimental and Numerical Study on the Restitution Coefficient and the Corresponding Elastic Collision Recovery Mechanism of Rapeseed. Agronomy 2025, 15, 1872. [Google Scholar] [CrossRef]
- Wang, L.; Zhou, W.; Ding, Z.; Li, X.; Zhang, C. Experimental Determination of Parameter Effects on the Coefficient of Restitution of Differently Shaped Maize in Three-Dimensions. Powder Technol. 2015, 284, 187–194. [Google Scholar] [CrossRef]
- Yuanze, L.; Jianhua, X.; Jia, Z.; Yong, Y.; Qinghe, M.; Yakun, D.; Deying, M. Parameter Calibration and Experimental Verification of Discrete Element Simulation Model for Protaetia Brevitarsis Larvae Bioconversion Mixture. Int. J. Agric. Biol. Eng. 2024, 17, 35–44. [Google Scholar] [CrossRef]
- Rao, G.; Zhao, W.Y.; Shi, L.R. Calibration and experimental validation of discrete element simulation parameters for double-low rapeseed. J. China Agric. Univ. 2023, 28, 192–207. [Google Scholar] [CrossRef]
- Ye, D.P.; Qing, J.X.; Lin, Z.Q. Establishment and Parameter Calibration of Discrete Element Model for Neyraudia reynaudiana Stalk. Trans. Chin. Soc. Agric. Mach. 2025, 56, 139–149. [Google Scholar] [CrossRef]
- Wang, L.; Li, R.; Wu, B.; Wu, Z.; Ding, Z. Determination of the Coefficient of Rolling Friction of an Irregularly Shaped Maize Particle Group Using Physical Experiment and Simulations. Particuology 2018, 38, 185–195. [Google Scholar] [CrossRef]
- Lü, J.Q.; Wang, P.R.; Yang, X.H. Design and Experiment of Seed-clearing Device for Cup-belt Type Patato Seed-metering Device. Trans. Chin. Soc. Agric. Mach. 2019, 50, 51–60. [Google Scholar] [CrossRef]
- Zhou, L.; Yu, J.; Wang, Y.; Yan, D.; Yu, Y. A Study on the Modelling Method of Maize-Seed Particles Based on the Discrete Element Method. Powder Technol. 2020, 374, 353–376. [Google Scholar] [CrossRef]
- Xu, C.; Xu, F.; Tang, H.; Wang, J. Determination of Characteristics and Establishment of Discrete Element Model for Whole Rice Plant. Agronomy 2023, 13, 2098. [Google Scholar] [CrossRef]
- Han, Y.L.; Jia, F.G.; Tang, Y.R. Influence of granular coefficient of rolling friction on accumulation characteristics. Acta Phys. Sin. 2014, 63, 173–179. [Google Scholar] [CrossRef]
- Yan, H.S.; Wang, Y.H.; Chen, Z.H. Resistance performance of polar ships in ice areas. Chin. J. Polar Res. 2025, 37, 316–326. [Google Scholar] [CrossRef]
- Fu, H.; Wu, Z.Z.; Duan, J.L. Calibration of contact parameters of ‘Luli’ apple for simulation based on discrete element. J. South China Agric. Univ. 2025, 46, 407–418. [Google Scholar] [CrossRef]
- Wang, J.; Geng, B.; Yang, Z.; Yang, J.; Zhang, K.; Meng, Y. Discrete Meta-Modeling and Parameter Calibration of Harvested Alfalfa Stalks. Agronomy 2025, 15, 2390. [Google Scholar] [CrossRef]
- Duan, J.; Shi, X.; Wang, B. Testing and EDEM Simulation Analysis of Material Properties of Small Vegetable Seeds for Sustainable Seeding Process. Sustainability 2025, 17, 7292. [Google Scholar] [CrossRef]
- Zhang, H.J.; Chen, X.B.; Li, H.L. Simulated Contact Parameters Calibration and Experiment of Controlled-release Fertilizer Particles. Trans. Chin. Soc. Agric. Mach. 2024, 55, 80–90. [Google Scholar] [CrossRef]
- Liu, F.Y.; Zhang, J.; Li, B. Calibration of parameters of wheat required in discrete element method simulation based on repose angle of particle heap. Trans. Chin. Soc. Agric. Eng. 2016, 32, 247–253. [Google Scholar] [CrossRef]
- Ma, Y.C.; Wang, Z.S.; Shi, L.R. Determination the intrinsic parameters and calibration of contact parameters for wheat seed particles. J. China Agric. Univ. 2025, 30, 175–184. [Google Scholar] [CrossRef]
- Jia, F.G.; Han, Y.L.; Liu, Y. Simulation prediction method of repose angle for rice particle materials. Trans. Chin. Soc. Agric. Eng. 2014, 30, 254–260. [Google Scholar] [CrossRef]
- Li, H.; Zhao, W.Y.; Shi, L.R. Design and Test of Seed Ladle Tongue Type Flax Precision Burrow Planter. Trans. Chin. Soc. Agric. Mach. 2024, 55, 85–95. [Google Scholar] [CrossRef]
- Liu, Z.; Yan, J.; Liu, F.; Wang, L. Calibration and Testing of Discrete Element Simulation Parameters for the Presoaked Cyperus Esculentus L. Rubber Interface Using EDEM. Agronomy 2025, 15, 2440. [Google Scholar] [CrossRef]
- Chen, S.; Li, Y.; Wei, B.; Shi, M.; Zou, X.; Huang, X. Establishment of a Discrete-Element Model and Verification of a Seeder Bench Experiment for Sesbania Seeds. Appl. Sci. 2025, 15, 4710. [Google Scholar] [CrossRef]
- Fan, J.; Zhang, L.; Sun, K.; Qian, X.; Wang, L.; Yu, J. A General Discrete Element Modelling Method and Harvest Process for Wheat Plants. Biosyst. Eng. 2025, 259, 104284. [Google Scholar] [CrossRef]
- Zhang, D.; Zhang, X.; Wu, D.; Lin, S.; Zhang, T.; Xu, W. Simulation of Pepper Cleaning Based on DEM-CFD Coupling. J. Agric. Sci. Technol. 2023, 25, 87–96. [Google Scholar] [CrossRef]
- Guo, B.; Ma, X.; Liu, Z. Simulation Study and Parameters Discussion on Wind-sieve Type Grain Cleaning. J. Agric. Mech. Res. 2021, 43, 10–15. [Google Scholar] [CrossRef]
Disclaimer/Publisher’s Note: The statements, opinions and data contained in all publications are solely those of the individual author(s) and contributor(s) and not of MDPI and/or the editor(s). MDPI and/or the editor(s) disclaim responsibility for any injury to people or property resulting from any ideas, methods, instructions or products referred to in the content. |
© 2026 by the authors. Licensee MDPI, Basel, Switzerland. This article is an open access article distributed under the terms and conditions of the Creative Commons Attribution (CC BY) license.