1. Introduction
Cassava is a vital economic crop, particularly in Thailand, which is the world’s leading exporter of cassava, producing over 7.27 million tons of processed cassava annually. The global demand for cassava continues to rise, with Thai exports increasing by 18.8% from 2020 to 2024 [
1]. However, cassava production faces significant challenges due to disease outbreaks exacerbated by global climate variability. As a result, fresh cassava root production declined by 9.93%, with yields dropping to 27.76 million tons over 1.24 million hectares of planted area (
https://www.fao.org/4/y1177e/Y1177E04.htm, accessed on 9 November 2024) [
2,
3]. To address these challenges and increase yield per hectare, modern agricultural techniques are essential [
4,
5]. Relevant government agencies have promoted advanced farming practices, including selecting suitable cassava varieties, improving soil structure, and optimizing fertilizer application. One critical technique involves the precise application of chemical fertilizers, tailored to the specific needs of cassava plants in different regions, which can also help reduce production costs [
6].
The use of remote sensing to assess crop maturity and yield in South Africa has been limited due to challenges associated with satellite imagery. However, the increased use of UAVs (unmanned aerial vehicles) in recent years has created new opportunities for surveying, even on small-scale and complex farms. In cassava breeding programs, exploring non-destructive selection methods has always been a priority. Therefore, efforts are underway to reduce the selection cycle for cassava and to develop low-cost, non-destructive imaging methods that can accurately measure root traits in the field [
7,
8,
9,
10].
Unmanned aerial vehicles (UAVs) have transitioned from practical tools to fully industrialized equipment across various fields. In precision agriculture, advancements in UAVs and sensor technology have significantly enhanced automation and integration [
11,
12]. However, processing the vast amounts of image data generated—such as managing photos, analyzing them, and displaying results from large-scale phenotype datasets—necessitates a high-precision data conversion and analysis framework [
13,
14,
15].
Applying herbicides at variable rates based on specific areas is preferable to uniform application when controlling prevailing weeds and plant diseases in farmers’ fields [
9]. Uniform application of agrochemicals often leads to excessive use of harmful chemicals, increased crop production costs, environmental damage, health risks, and reduced sprayer efficiency [
15]. Intelligent variable rate sprayers incorporate electronic and automated systems in agricultural machinery, enhancing the efficiency of agrochemical applications [
16]. These sensor-based control systems allow for the precise application of chemicals only as needed, reducing waste and environmental impact. Many researchers have developed vision-based spot applicators for real-time weed detection, utilizing various remote sensing devices. Vision-based algorithms have been applied to create variable rate systems for target detection using Raspberry Pi and OpenCV in drone systems. Machine learning-based systems have shown high accuracy in real-time target detection [
17,
18,
19,
20,
21,
22,
23,
24].
In traditional cassava farming, pesticides and fertilizers are applied manually, which is labor-intensive, time-consuming, and costly. Each hectare of land requires several hours of manual labor, with workers earning approximately 14 USD/ha. Moreover, manual spraying exposes workers to harmful chemicals, posing significant health risks. To address these challenges, RC helicopters and drones equipped with variable-rate sprayer systems are increasingly being used in cassava fields.
Although the initial cost of these systems, approximately 20 USD/ha, is higher than manual labor, they offer significant benefits in terms of efficiency, safety, and cost-effectiveness. For example, spraying and fertilizing 1.6 ha of cassava can be completed in about 10 min with only 1–2 workers required to operate the equipment. These systems provide better coverage and can reach difficult-to-access areas, making them more effective than traditional methods. Additionally, the use of pesticide sprays can be hazardous to human health, and using RC helicopters and drones can eliminate the risk of exposure to harmful chemicals.
However, these systems also have drawbacks, such as the high cost of the devices, the need for specialized training, and the potential for mechanical failures. The limited liquid-carrying capacity of these devices necessitates frequent refueling, which can be time-consuming. Maintenance costs, including battery replacement, also add to the overall expense.
Table 1 provides a detailed comparison of the parameters between RC helicopters and drones with variable-rate sprayer systems.
The integration of drone technology with remote sensing offers a flexible and cost-effective solution for monitoring crops like cassava. Drones equipped with advanced sensors can provide real-time data, enabling more efficient agricultural management. Despite their potential, the application of drones in remote sensing is still in the experimental stage. The aim of this research is to propose an agricultural precision technology for managing and monitoring disease outbreaks in cassava planting areas. This approach can significantly reduce production costs, prevent damage, and increase the yield of fresh cassava roots per hectare. For this purpose, a high-angle aerial photography system and a remote-controlled spraying system have been designed and fabricated. These systems have been mounted on both a radio-controlled helicopter and low-cost drones to determine which is more suitable. The system is composed of a near-infrared band and an RGB-band digital camera equipped with a remote-control shutter using a 72 MHz remote control. The aerial image data obtained from the system will be processed to measure crop growth, crop density, and crop disease infestations.
2. Proposed Technology and Operational Procedure
The research focuses on integrating low-altitude remote sensing with variable-rate sprayer systems to improve cassava crop management. These systems have been mounted on both a radio-controlled helicopter and low-cost drones to identify the more suitable option. The setup includes a near-infrared band and an RGB-band digital camera, which is equipped with a remote-control shutter using a remote control. Additionally, it employs a webcam and real-time image processing to assess crop growth, density, and disease infestations, adjusting the spray rate accordingly.
2.1. Hardware and System Configuration
This study focuses on comparing the technical characteristics of radio-controlled helicopters and unmanned drones, both equipped with the same remote-controlled variable rate chemical spraying system. A domestically assembled radio-controlled helicopter was selected for the study; it weighs 6 kg and can carry a payload of 5 kg. The helicopter is operated by a skilled pilot using a 42 MHz radio transmitter with a control range of 0.8 to 2 km.
Additionally, a drone with an eight-rotor system and a diaphragm pump was chosen. This drone can carry 5 L of liquid and has a spraying duration of 15 min per battery charge. With a maximum pump pressure of 0.4 MPa, it achieves a maximum flow rate of 72 L per hour and can fly up to 30 m above the ground.
The overall research will begin with grid soil sampling analysis and will examine the correlation between NDVI, GNDVI, and chlorophyll content for both healthy and infected cassava plants. Following this, the performances of the two systems will be compared. Images obtained from both systems will be calibrated using image processing techniques. After calibration, statistical analysis and GIS mapping will be conducted. The main components of the LARS platform used in this study are illustrated in
Figure 1.
Key Innovations in Research Methods That Provide New Approaches or Insights
The primary objective of this research is to evaluate and compare the performance of RC helicopters (RC-helicopter locally assembled, Thailand) and drones (GCS-9 model #GCS-9, Lipo Battery 6S1P, 14,000 mAh, 22.2 V, KASET GEN Y Co., Ltd.,: Bangkok, Thailand) equipped with variable-rate spraying systems in diseased cassava fields. Key innovations that will provide new insights include:
A modern precision imaging system adapted from a standard webcam to capture images in the near-infrared range. This imaging system has been enhanced with devices that minimize vibrations and deviations when collecting low-altitude images above the cassava fields. In conjunction with a plot coordinate data collection system, the low-altitude imaging setup can work effectively with ground-based high-precision image processing systems.
Testing will be conducted at heights of 5, 10, 15, and 20 m above the planting fields. These three heights were chosen due to the limitations in the quality of the RGB band camera and the exhaust fumes produced by the RC helicopter model. The high-angle image data and cassava plot coordinates will be transmitted to a ground-based computer for analysis. This analysis will also integrate data on soil compaction, soil moisture, NDVI (Normalized Difference Vegetation Index), and GNDVI (Green Normalized Difference Vegetation Index) values.
The spraying rate will be adjusted based on the density of objects processed by the developed low-altitude image processing algorithm. This algorithm quantifies the density of target objects as digital values and distinguishes between diseased and healthy cassava plants. As a result, the spraying system can operate with high accuracy and respond promptly to the needs of the fields.
The main control system will utilize all collected data to create a GIS (Geographic Information System) mapping application, which will serve as a valuable database for farmers.
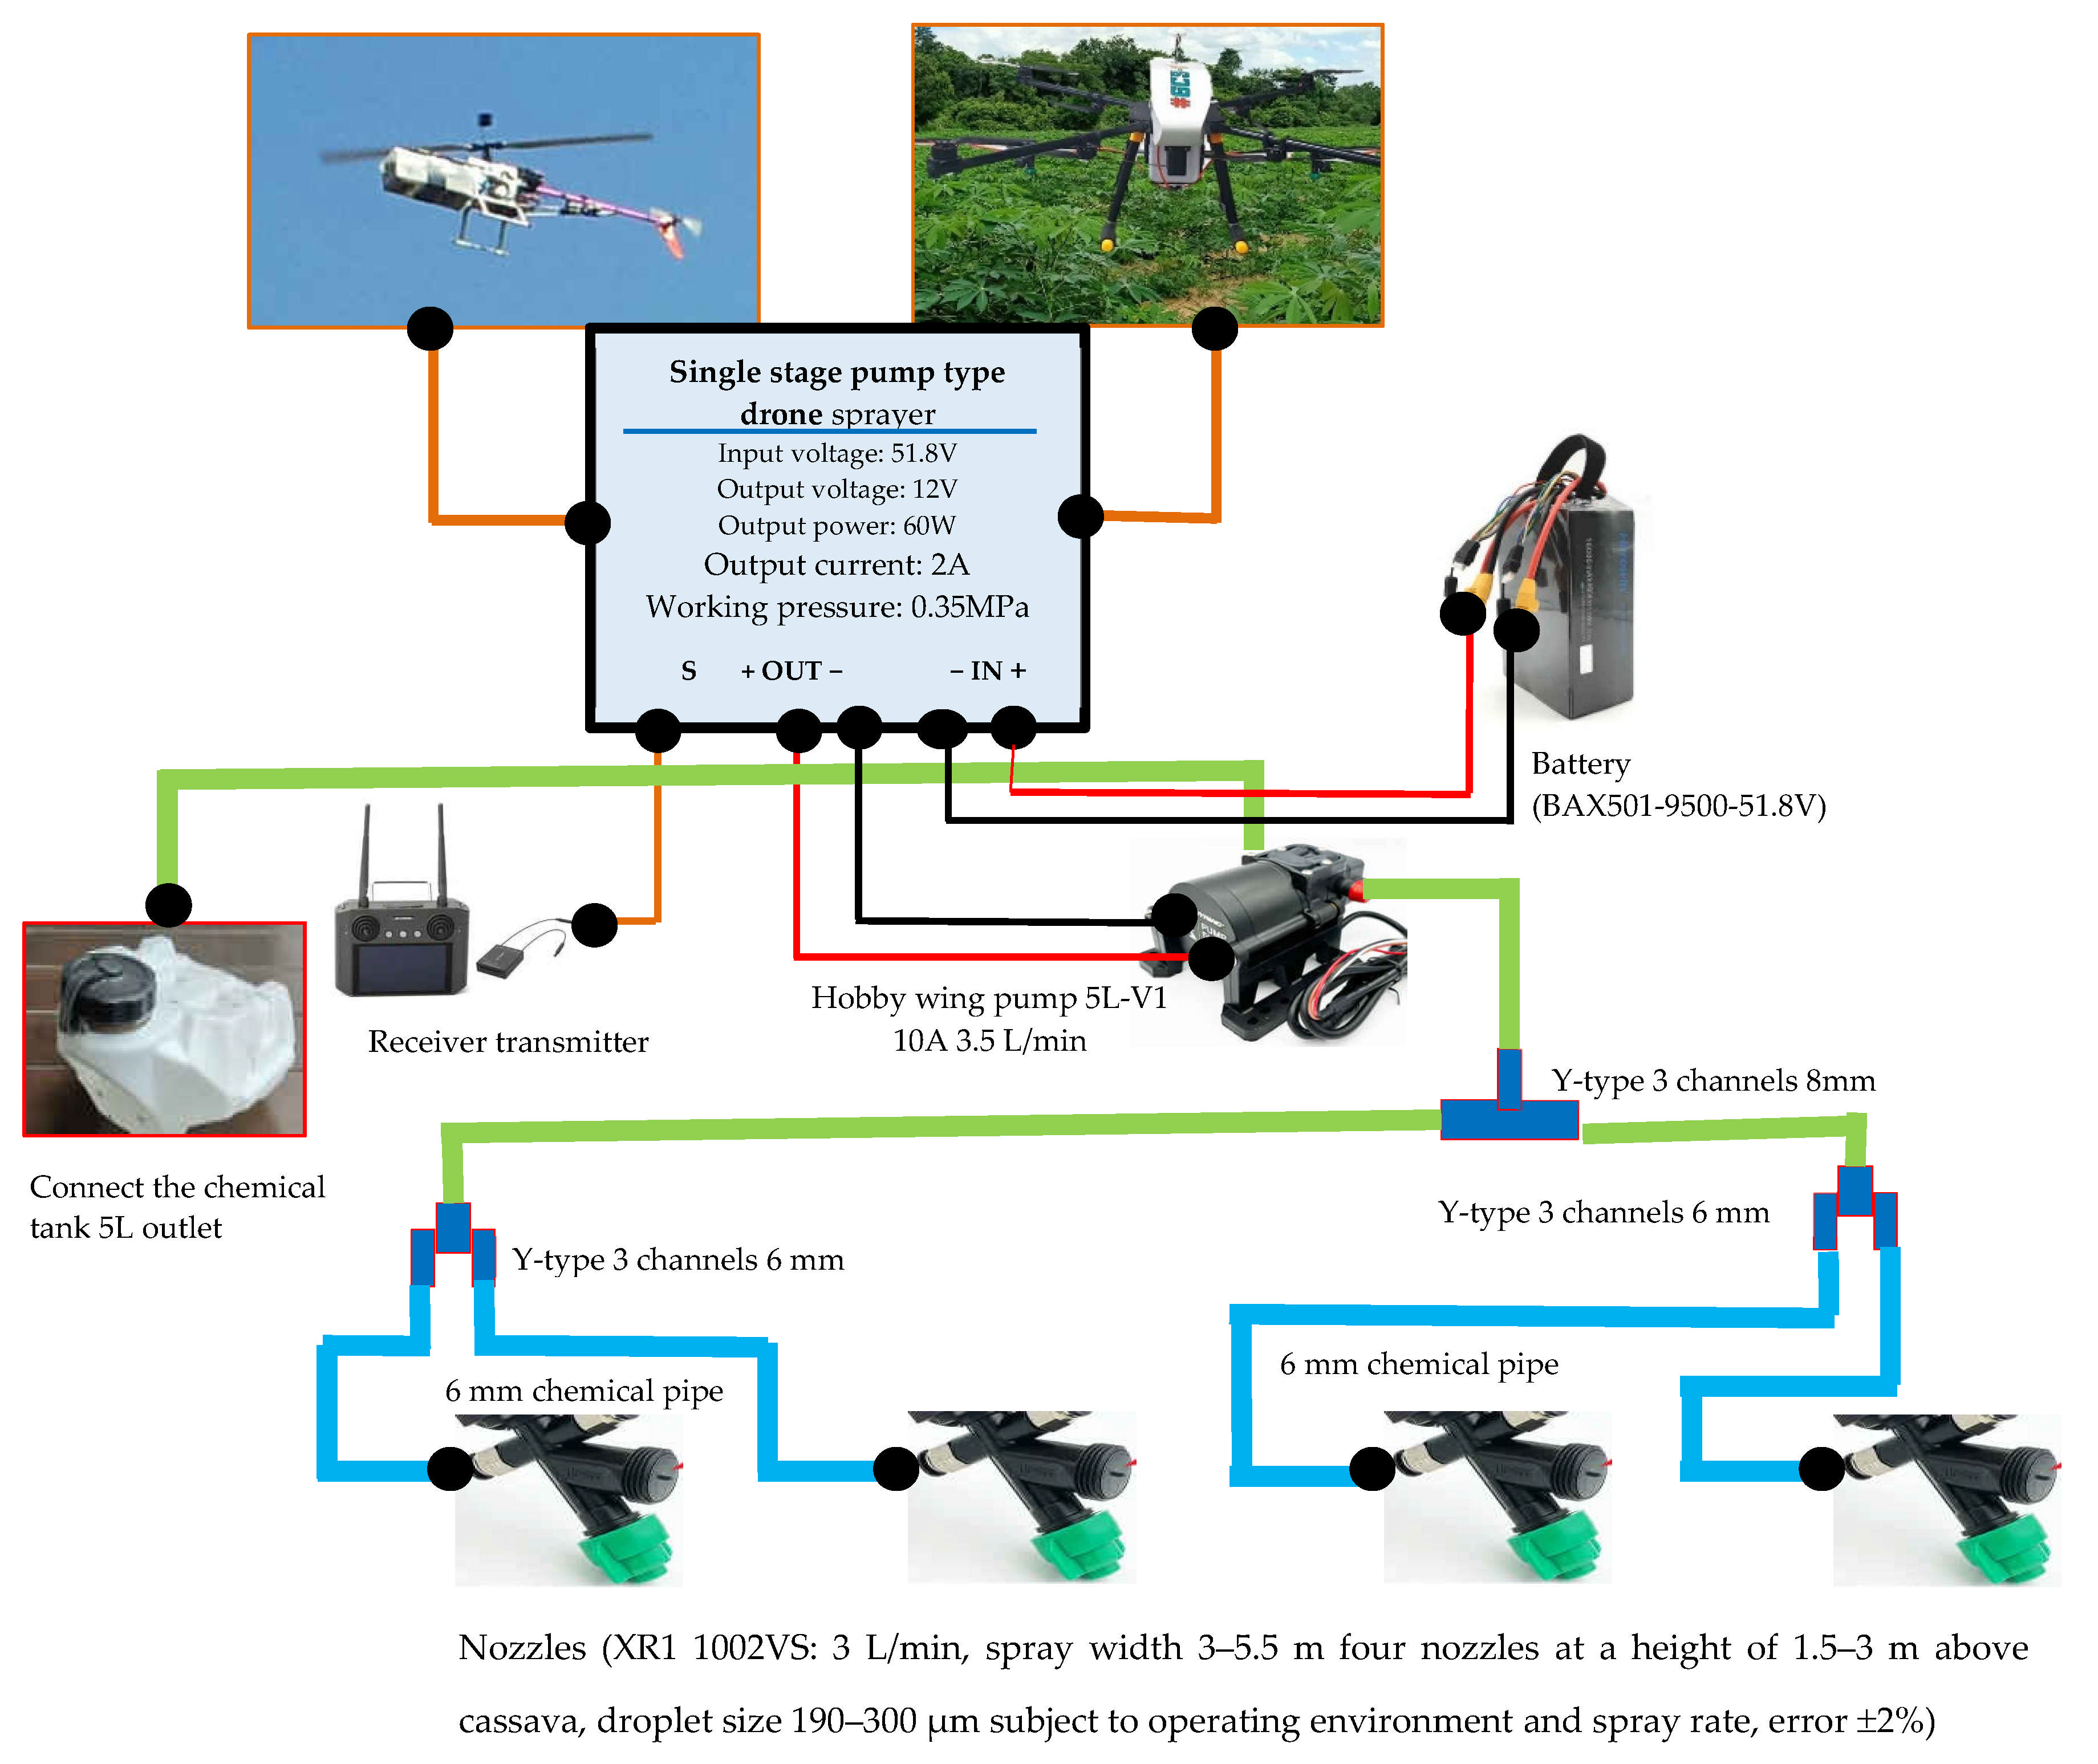
2.2. Design and Fabrication of Variable Rate Sprayer Systems
The sprayer systems are designed to optimize the application of chemicals by adjusting pump pressure based on the density of the cassava canopy. This method reduces the use of excess chemicals and ensures precise application. The system includes a four-nozzle sprayer, a pump, and an 8 L chemical tank, with the capability to cover 0.352 ha/h having a throw of 4–7 m.
2.2.1. Vegetation Indices Calculation
The Normalized Difference Vegetation Index (NDVI) and Green Normalized Difference Vegetation Index (GNDVI) are widely used in agricultural research to assess crop health and chlorophyll content [
4]. These indices were calculated using data obtained from the RC helicopter and drone systems. The intensity of sunlight during the experiment was measured and recorded using a light sensor (Spectrum Technology Inc., Suite F, Haltom City, TX, USA), and the average chlorophyll content of cassava leaves was calibrated using a leaf chlorophyll meter (Minolta SPAD 502; Konica Minolta Sensing Inc.: Osaka, Japan).
These vegetation indices (
Table 2) measure the level of greenness and represent the chlorophyll content, as expressed by the radiance at the cassava leaf surface, are important indicators for distinguishing mature, healthy, or infected cassava plants from diseased ones [
25]. Cassava mosaic disease is caused by the Cassava mosaic virus (CMV). The symptoms include yellowing and curling of the leaves, along with noticeable deformities throughout the plant. This disease can lead to a yield reduction of 40–80%. To prevent and eliminate whiteflies in cassava plantations, spray the chemical Dinotefuran 10% SL at a rate of 20 mL per 20 L of water (
https://www.doa.go.th).
2.2.2. Image Data Acquisition
The imaging system consisted of an RGB (red–green–blue) camera (Canon Inc., Bangkok, Thailand) and a near-infrared (NIR) camera (ADC Tetracam Inc., Chatsworth, CA, USA), both equipped with wireless control (Jelsoft Enterprises Ltd., El Segundo, CA, USA), altitude sensor (Seagull Wireless Dashboard Flight System FCC 900 MHz version; Jelsoft Enterprises Ltd., El Segundo, CA, USA), and illumination sensor (two channels; central bands at 660 and 730 nm; Skye Instruments, Powys, Wales, UK). The cameras captured aerial images, which were processed to measure crop growth, density, and disease infestation. A created algorithm and a specially developed data acquisition system were used with the sprayer system. The created algorithm used in the system provided functions such as image orientation correction, geo-referencing, and analysis of GNDVI and NDVI. Calibration involved setting a one-square-meter area and scattering red-painted wood pieces at varying heights of 5 m, 10 m, 15 m, and 20 m. This method helped in calibrating the image processing system to ensure accurate data collection.
2.2.3. Modified Camera
To monitor the cassava leaf targets and record spray images, an IP camera (Advice Co., Ltd., Bangkok, Thailand) was used in this research. The camera (Smart IP Camera VSTARCAM C90S-A0131296, Advice Co., Ltd., Bangkok, Thailand) comes with an HLC-GC2053-V40-V2.0 module, 2.4 GHz/IEEE 802.11 b/g/n connectivity, and a Wi-Fi system. The camera is capable of transmitting real-time images to mobile devices with a resolution of 1080p. The camera weighs merely 128 g, and its dimensions are 126 mm × 98 mm × 45 mm, with a built-in battery. The camera was modified with two small pieces of black photographic negative filters—enabling it to capture NIR images (>700 nm).
2.2.4. Spray Nozzle and Spraying Calibration
When choosing a spray nozzle for fertilizers and chemicals, it is important to consider durability and the ability to distribute the substances effectively.
The nozzles were evaluated for correlation between the height and the distribution of liquid fertilizer and chemical spraying. The experiment was conducted using spraying quantities of 20 cc, 60 cc, and 100 cc. The variable rate sprayer was tested at four different levels of nozzle height installation, namely 1 m, 2 m, 3 m, and 4 m, and the distribution of fertilizer and chemical spraying was measured on the top of the cassava leaf surface area.
2.2.5. GPS Receiver
To create cassava plantation maps, a handheld GPS receiver is used (Garmin eTrex Venture HC; WAAS-enabled GPS receiver, Garmin (Thailand) Ltd., Bangkok, Thailand). It measures 5.1 × 11.2 × 3.0 cm and weighs 150 g with batteries, making it easy to carry around. It runs on 2 AA batteries and has a battery life of up to 17 h. Additionally, it can store up to 500 waypoints in memory, which makes it easy to retrieve your data when needed.
2.3. UAV Image Processing and Calibration
A suitable algorithm is essential to enable an aerial imagery system for surveying, measuring, and monitoring the growth of cassava plantations. The system will use RC helicopter and drone with variable-rate sprayer to take images through its image data acquisition module. The imagery system will rely on natural sunlight rather than artificial illumination. Different spectral bands, such as near-infrared (NIR), thermal infrared bands, and visible bands (green and red), can be used to access crop and soil parameters. For example, ref. [
16] used a multi-spectral camera mounted on an unmanned helicopter platform to correlate nitrogen rate with NDVI values for rice cropping. However, the cost of a multi-spectral camera is high, and cheaper options such as normal digital and near-infrared (NIR) cameras can be used to acquire an image and compare the performance in terms of crop growth and weed control.
Variations in sunlight levels can affect the models as well as the final recommendations for monitoring crops. It is necessary to keep track of the sunlight illumination level during the experiment by mounting a sensor on the platform to keep a continuous record of illumination levels. The effect of the illumination level can be minimized by estimating indices between the values of individual spectral bands of an image at a particular time. An illumination sensor (SKR 1800) is used for this purpose. For the two different cameras used (RGB and NIR), the following two image processing algorithms are developed:
- (a)
The RGB camera algorithm begins with receiving image data. The program processes the red, green, and blue bands, converts the concentration values, and transforms them into the HSV color space. Then, the program identifies the color and segments it out. It then calculates the proportion of the pixels of interest and converts it into a digital number. This number is used to control the rate of chemical spraying.
- (b)
The algorithm used for processing images obtained from the NIR camera starts with a program that converts the data near the infrared–green–blue bands to a grayscale image. The software then computes the surface area of the cassava leaves and displays the pixel density of green leaves per unit of surface area in real-time. The program uses Otsu’s color thresholding to control the time interval, duration, and spraying target corresponding to the proportion of green pixels per area. The solenoid valves are instructed to open or close the nozzles based on the threshold value. The program saves the last captured image to hard disk memory in both gray and bimodal formats.
In selecting a model between a drone and a radio-controlled helicopter, this research will focus on the models that are popular among farmers and have easily obtainable spare parts for maintenance. In calibration, the calibration method for image processing involved setting a one-square-meter area and scattering 100 pieces of 100% red painted wood at varying heights of 5 m, 10 m, 15 m, and 20 m. Both image acquisition modules, near-infrared (NIR) camera and RGB band (RGB camera) digital cameras, are used for calibration.
2.4. Experimental Setup
The experiment was conducted in a 40 m × 40 m cassava field located in Prachinburi Province, Thailand, at coordinates 14.14 °N latitude and 101.48 °E longitude. The planting area was prepared with different varieties of Rayong cassava, and the distance between rows and trees was maintained at approximately 80–100 cm. Fertilizer formulas recommended for cassava (15-15-15 or 16-8-16, application rate of 300–625 kg/ha (N-P
2O
5-K
2O)) were applied at specified intervals (
https://www.doa.go.th, accessed on 9 November 2024). The physical and chemical properties of the soil in the experimental area are detailed in
Table 3.
RC helicopters and drones equipped with variable-rate sprayer systems were tested at different altitudes (5 m, 10 m, 15 m, and 20 m), with three repetitions of the test to evaluate the quality of captured images in both RGB and NIR formats. The image data were segmented, and the resulting digital values (DN) were used as thresholds to control solenoid valves, enabling precise on–off control of the chemical pumps.
The machine capacity of the designed RC helicopter and drone with variable-rate sprayer systems was evaluated in a cassava field. The evaluation considered the system’s ability to operate at different altitudes, the actual working capacity of the sprayer (ha/h), the fuel consumption of the sprayer (L/h), and the electricity consumption of the sprayer (kWh).
2.5. Statistical Analysis
The research involved a three-way ANOVA followed by Duncan’s multiple range test to determine the effects of three factors: spraying altitude, sample density, and camera type. The study also analyzed interactions between these variables on the spraying footprint of RC helicopters and drones with variable-rate sprayer systems. Data collected using the variable rate sprayer were analyzed using the same statistical procedures. The analysis focused on evaluating the characteristics of the spraying footprint, including its diameter, and calculating the correlation between chlorophyll content and NDVI/GNDVI values [
2,
5].
2.6. GIS Application Mapping
Geostatistical analysis and mapping were conducted using the inverse distance-weighted (IDW) interpolation algorithm. This algorithm calculates cell values by creating a linearly weighted combination of sample points, with weight assigned based on distance from the cell being evaluated. In this study, field images were acquired using RC helicopters and drones with variable-rate sprayer systems while simultaneously recording GPS data. The images obtained from the RC helicopter and drone cameras were combined manually using methods. Excess areas beyond the ground margins were masked, altitude corrections were made, and the images were converted into GIS map layers for further analysis.
To combine all of the images into a matrix, the true ground coordinates were used as reference points. This matrix was then used to create a final land image. The image was converted into GIS map layers using the ArcGIS software (ArcMap 10.4.1)for further analysis [
27,
28].
3. Results and Discussion
The study results from the test conducted on the cassava plantation can be organized by topic. The research team discussed the relationship between the study variables and previous research findings.
Section 1 focuses on variable rate sprayer systems.
Section 2 covers several aspects including the performance of image processing algorithms, camera calibration, altitude effects, nozzle calibration, and the relationship between reflectance vegetation indices, cassava crop growth, and altitude. Key topics include the impact of altitude on estimation accuracy, the effects of chlorophyll content and NDVI values on accuracy, the influence of soil compaction values and NDVI on estimation accuracy, as well as the effects of chlorophyll content and GNDVI values on estimation accuracy.
Section 4 presents the results of statistical analyses and discusses GIS application mapping.
Section 3 is divided into sub-topics: soil compaction maps in cassava plantations, variations in chlorophyll content with leaf reflectance in cassava fields, and crop growth variations in cassava fields using an RC helicopter-based system and a drone-mounted system [
6,
7,
8,
9].
3.1. Variable Rate Sprayer Systems
The variable-rate sprayer systems (with an RC helicopter and a drone), including a 5 L spray tank, four nozzles, and a two-channel electromagnetic flow meter, was successfully assembled in
Figure 2. These systems allow for even and precise spraying, reducing the use of chemicals and fertilizers, and ultimately lowering operating costs. The systems’ ability to perform variable-rate fertilization by importing GIS-based prescription maps into the remote controller was validated in cassava fields.
3.2. Image Processing Algorithm Performance
An advanced image processing system for low-altitude aerial images was developed in
Figure 3, enabling users to extract specific data for analysis. The program divides the region into smaller sub-images, detects the presence of vegetation, and quantifies the amount of vegetation present.
The algorithm features three main capabilities [
16,
29,
30,
31]:
- (a)
extracting data from a database and displaying it in the program window, processing images to determine vegetation levels;
- (b)
converting color images to grayscale for further analysis;
- (c)
saving he processed image data in gray or bimodal formats for future reference.
This system allows for real-time monitoring of cassava crop health and facilitates precise agricultural management.
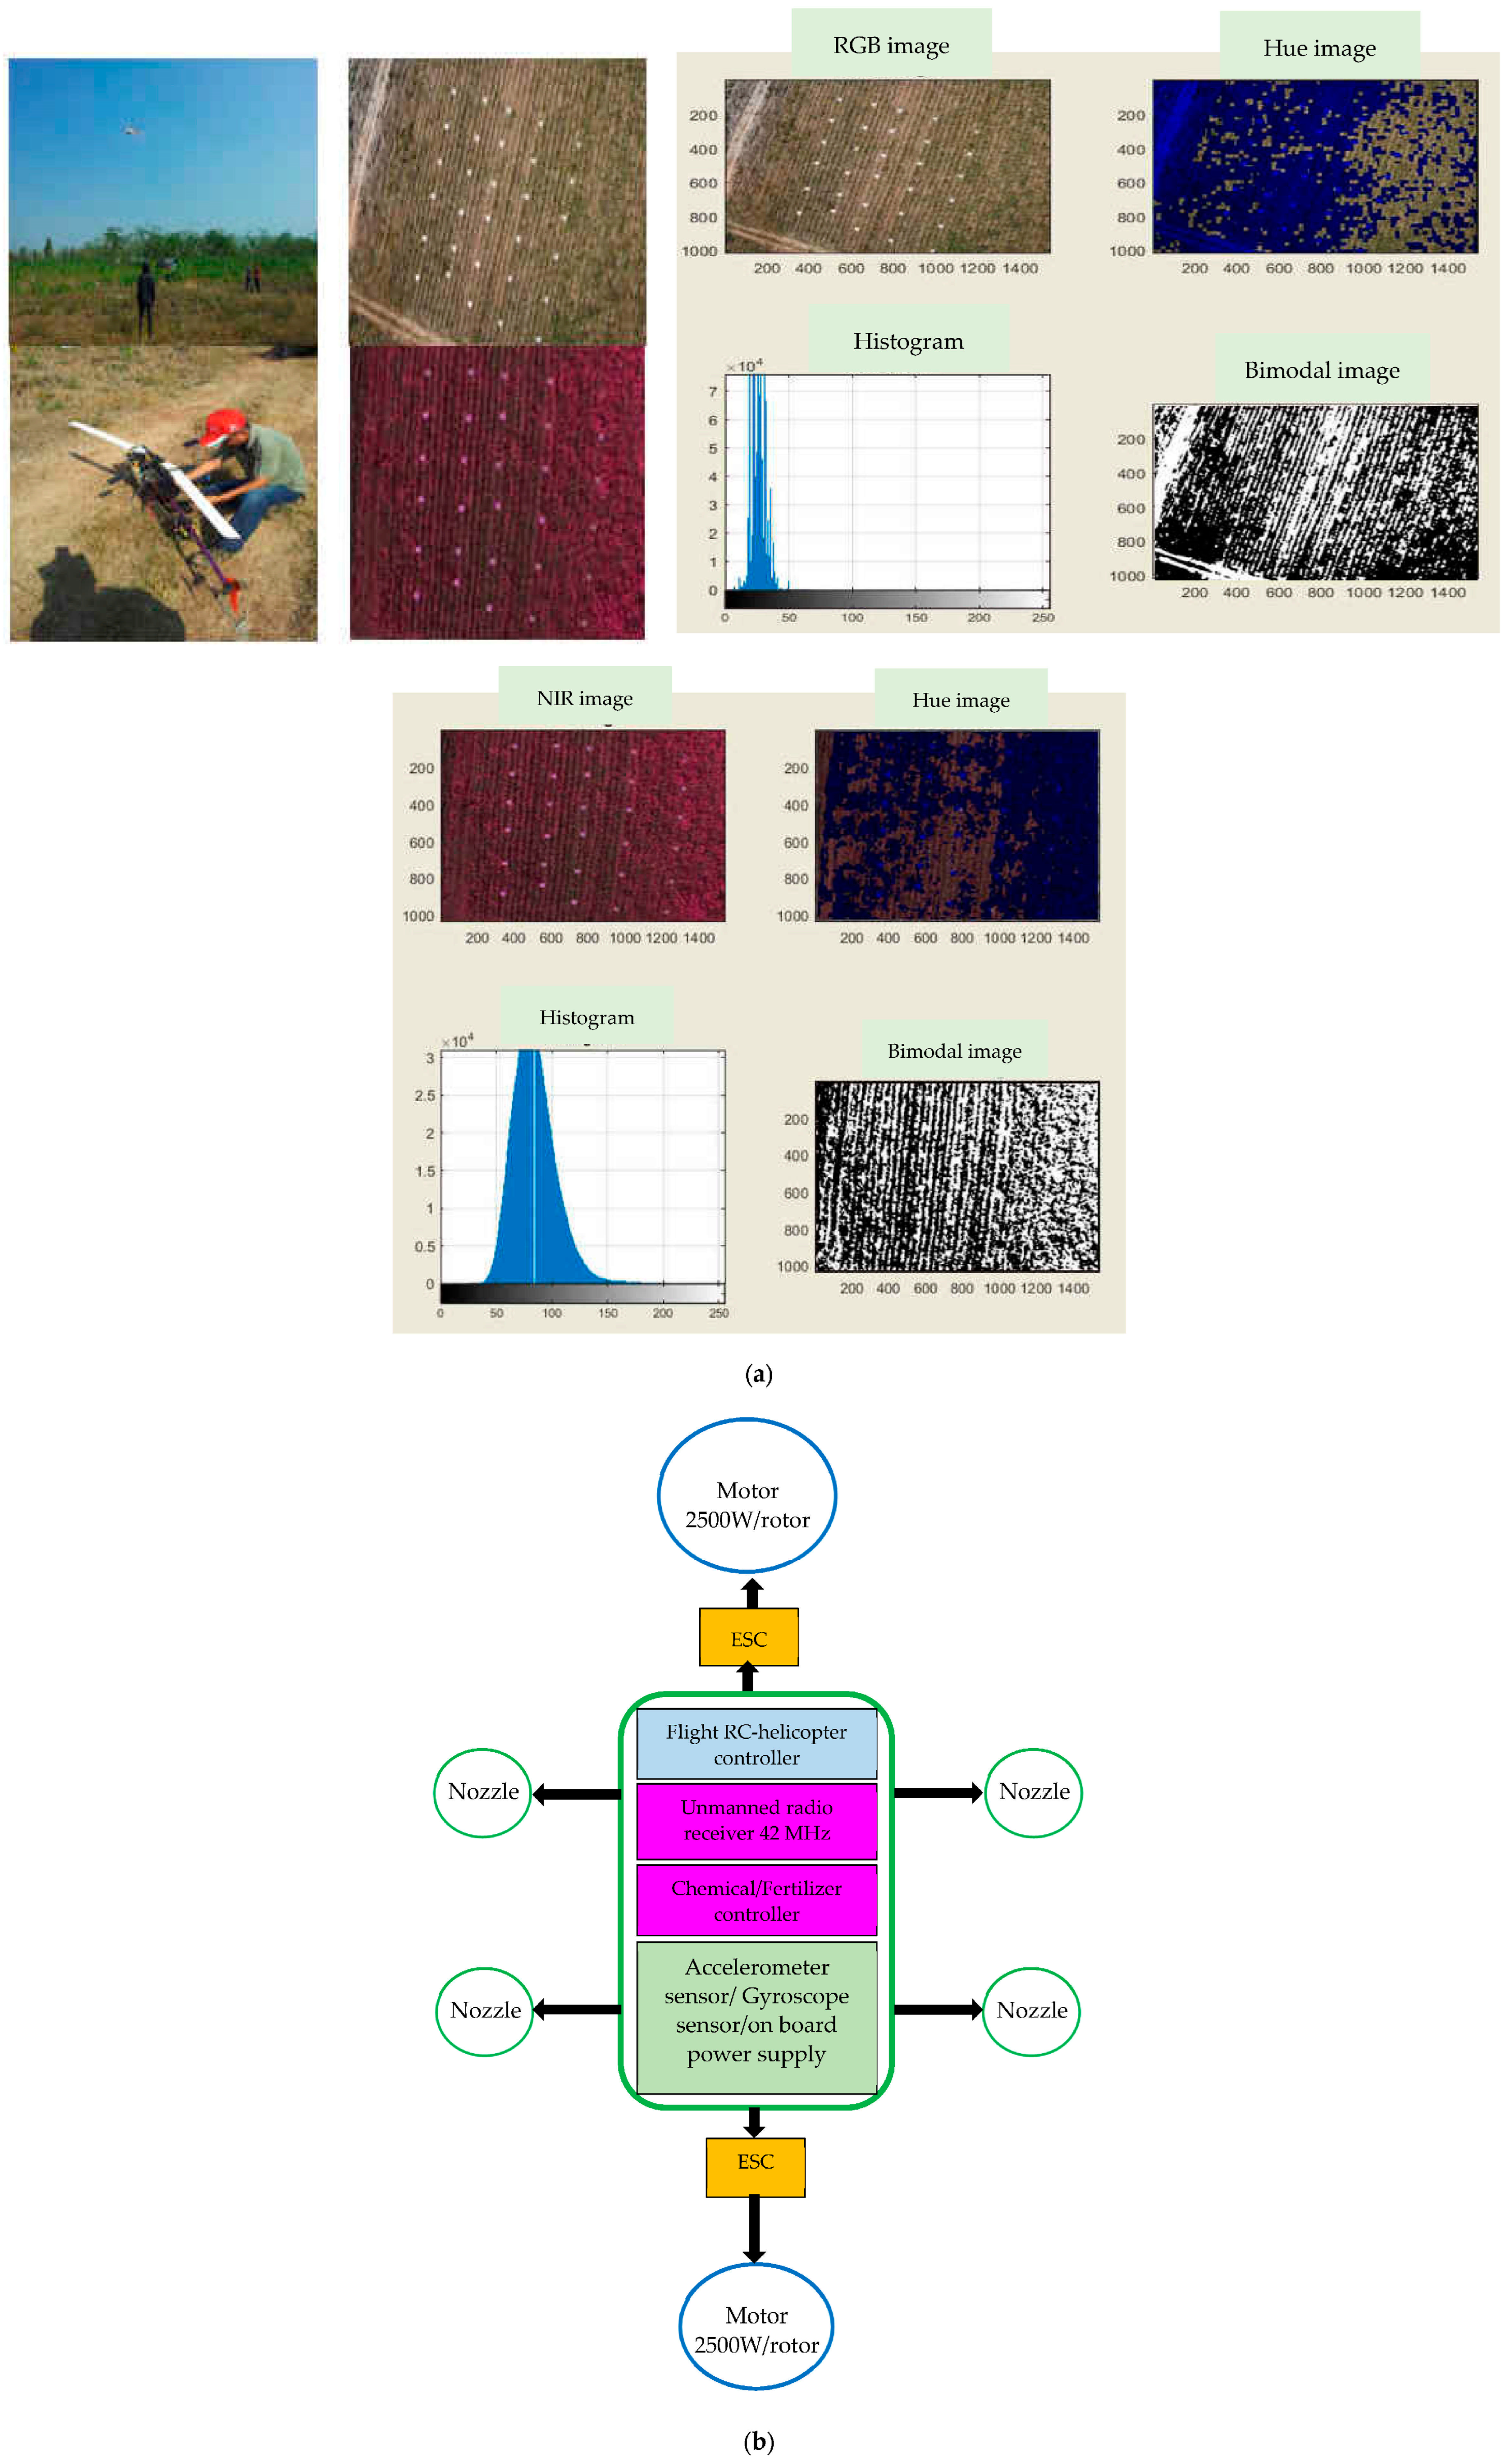
From
Figure 4, when we capture high-angle photos above the cassava plantation—using either a remote-controlled helicopter or a drone—the initial images we collect consist of RGB color values, or primary colors, which range from 0 to 255 (8 bits for each color). By mixing these primary colors, we can obtain various desired colors. To separate objects based on color, we can utilize image processing techniques. In particular, we can filter HSV color features, where H stands for Hue, S for Saturation and V for Value. In OpenCV, each of these values is also in the range of 0 to 255. To filter for specific colors, we define two value sets: Lower and Upper [
6].
Separating image areas involves distinguishing the object of interest from the background or unwanted elements. This can be achieved using various techniques, such as thresholding. The basic principle of thresholding is to convert a grayscale (grayscale) image into a binary image with values of either 0 or 1 based on a defined threshold. If a pixel’s value is greater than or equal to the threshold, it will be assigned a value of 0 (black). Conversely, if the pixel’s value is less than the threshold, it will be assigned a value of 1 (white). Finding the optimal threshold value typically requires analyzing the image histogram, which can be challenging in real-world settings.
Variations in lighting can make it difficult to establish a consistent threshold. To address this, we can use Otsu’s Thresholding method, which automatically determines the threshold value. Once the threshold is identified, we can count the pixels of the object of interest and use this information to decide on the steps for variable rate spraying.
In additionally,
Figure 5 illustrates a test flight over a cassava field using an RC helicopter system. It also displays the processing of high-angle photographs taken with RGB color and near-infrared color cameras. Similarly,
Figure 6 depicts a test flight over a cassava field with a drone-mounted system, accompanied by the processing of high-angle photographs from both RGB color and near-infrared color images.
The calibration method used to calibrate image processing, involved a one-square-meter area having sprinkling red paint on it at one-inch intervals. The calibration was performed at heights of 10 m, 15 m, and 20 m using different systems, including the near-infrared band and RGB band installed on RC helicopters and drones, respectively.
Figure 5a and
Figure 6a illustrate an algorithm for processing low altitude images taken from both RGB and near-infrared bands of RC helicopters and drones. This algorithm segments the target images into bimodal images and calculates the percentage of the digital numbers for each sub-image. Once we create a mosaic of the entire cassava plot using the coordinates of the plot, we will be able to determine which areas have high or low growth rates. This information can be related to potential outbreaks of cassava plant diseases in the plot or the quality of the soil preparation, among other factors.
3.3. Camera Calibration and Altitude Effects
Calibration tests were conducted to evaluate the performance of the RGB and NIR cameras mounted on the RC helicopter and drone platforms (
Figure 7). The tests involved detecting 52 pieces of red-painted wood chips as 100% and conducting trials at different altitudes (5 m, 10 m, 15 m, and 20 m). The NIR camera detected a higher percentage of wood pieces compared to the RGB camera, particularly at lower altitudes. The NIR camera was found to be more suitable for detecting data at all tested altitudes, with detection rates ranging from 87.33% at 10 m to 73.86% at 20 m as illustrated in
Table 4.
To assess the accuracy of the spray coverage, a standard reference frame measuring 1 m × 1 m was used. The trial involved determining the appropriate spraying footprint (diameter, cm) and nozzle altitude levels (m). Red cards (2.54 cm by 2.54 cm) representing areas affected by diseases and pest infestations were placed at varying distances (1 m, 2 m, 3 m and 4 m) from the nozzle, and the calibration process accounted for variations in illumination levels [
4,
16,
32,
33,
34,
35].
3.4. Nozzle and Altitude Calibration
The calibration aimed to examine correlation between nozzle height and the distribution of liquid fertilizer and chemical spraying. The experiment was conducted at altitudes of 1 m, 2 m, 3 m, and 4 m, using spraying quantities of 20 cc, 60 cc, and 100 cc.
The spray footprint (in centimeters) of the RC helicopter and drone systems was measured at different nozzle altitudes and pressures of 1 bar as illustrated in
Table 5. The results indicated that the spray footprint and application rates increased with altitude, with drone systems exhibiting larger footprint and higher application rates compared to RC helicopter systems [
4,
16,
35]. The data obtained provided valuable insights into optimizing spraying techniques for cassava fields.
The NDVI of cassava at 3 months and 6 months old varies according to the reflectance of their leaves in the designed system as illustrated in
Table 6. The month count obtained from high-angle photos is dependent on the brightness level at the time of clicking. However, there is not much variation in the values between 10:30 am and 2:30 pm, which makes this window an ideal duration for image acquisition.
3.5. Relationship Between Reflectance Vegetation Indices, Cassava Crop Growth and Altitudes
3.5.1. Effect of Altitude on Estimation Accuracy
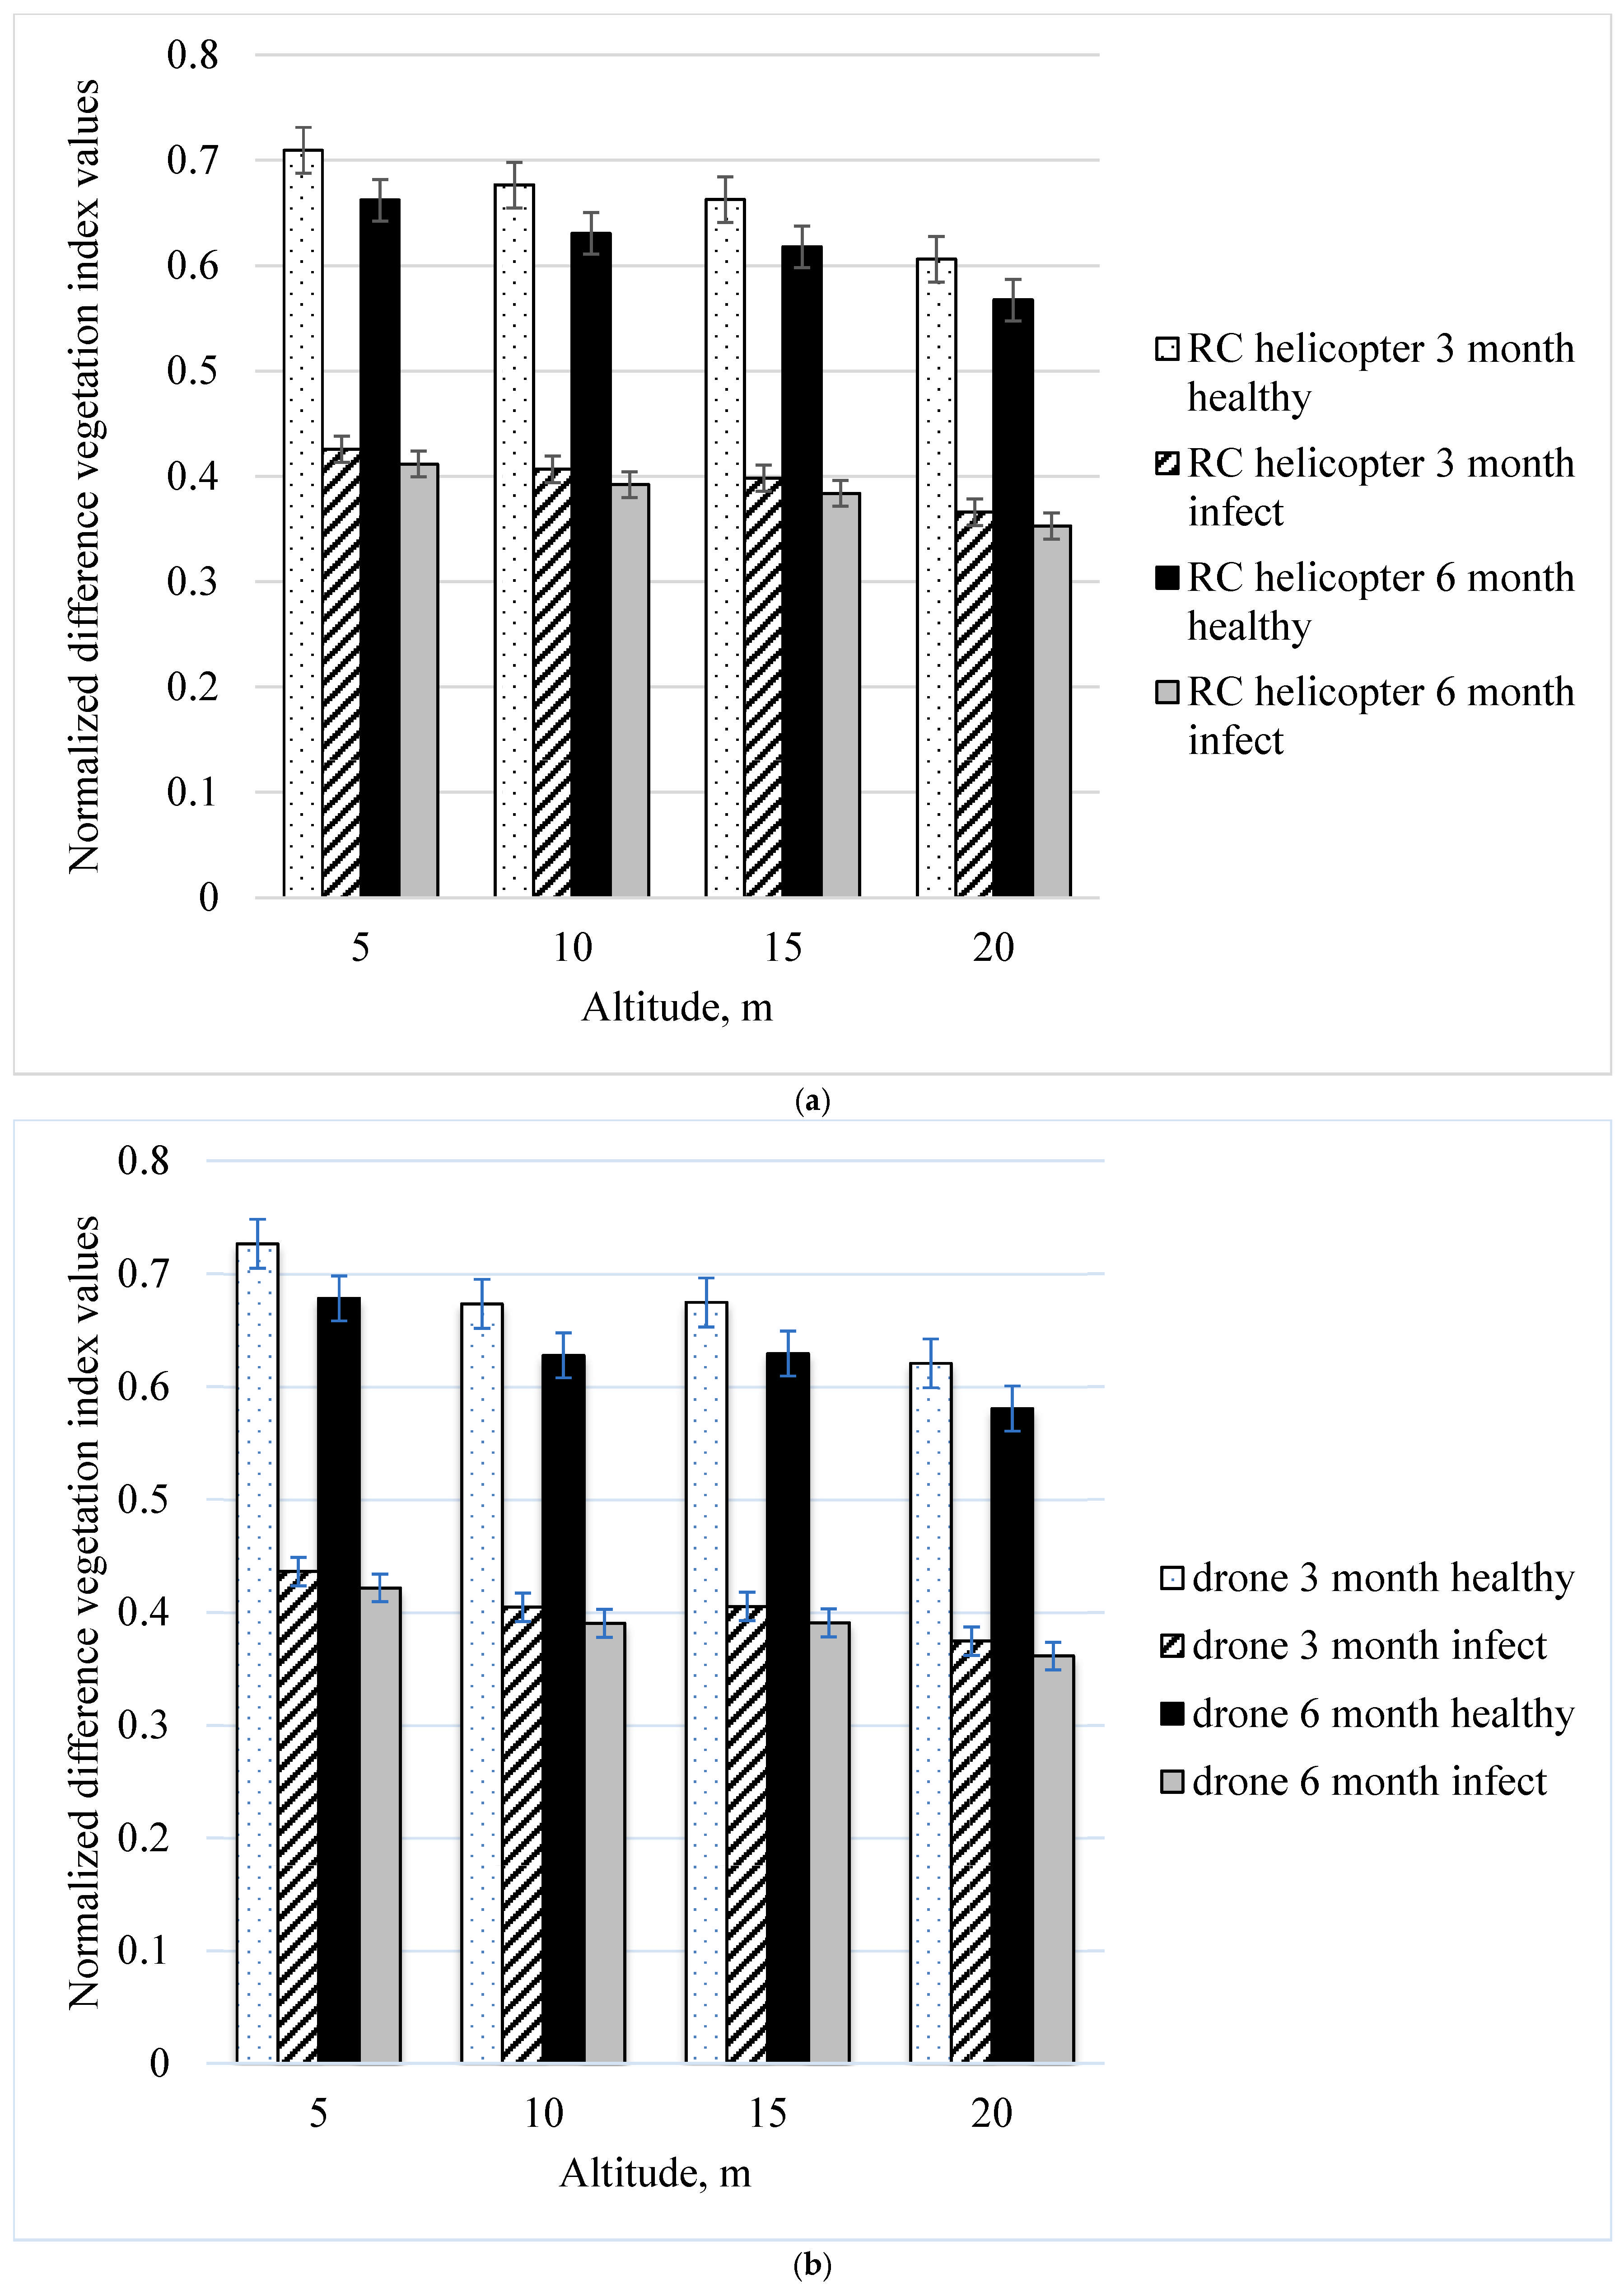
The effect of altitude on the estimation accuracy of vegetation indices was analyzed using NDVI values obtained from 16 replications across four altitudes (5 m, 10 m, 15 m, and 20 m). The data collection was performed using eight combinations of image data acquisition systems, including RC helicopters and drones, both for healthy and infected cassava plants at 3 and 6 months (
Figure 8).
The study revealed that NDVI values exhibited a clear downward trend as the altitude increased, which was consistent for both healthy and infected plants. Specifically, for 3-month-old cassava plants, the NDVI values showed a decrease from 0.709 at 5 m altitude to 0.352 at 20 m altitude for the RC helicopter system (
Figure 8a). Similarly, the drone system showed NDVI values decreasing from 0.726 at 5 m to 0.361 at 20 m. This trend exhibits the importance of selecting an appropriate altitude when conducting aerial surveys (
Figure 8b), as higher altitudes may lead to a reduction in the precision of NDVI measurements, particularly in distinguishing between healthy and diseased crops.
The data also indicated that the image acquisition systems maintained a higher than 40% greenness across the four altitudes tested, making these systems reliable for monitoring vegetation health. However, the decreasing trend in NDVI values with increasing altitude suggests that lower altitudes provide more accurate assessments, particularly when distinguishing subtle differences in crop health.
3.5.2. Effect of Chlorophyll Content and NDVI Values on Estimation Accuracy
Chlorophyll content, an essential indicator of plant health, was measured using the SPAD 502 m and compared with NDVI values obtained from the LARS platforms. The study found a strong correlation between the SPAD-derived chlorophyll content and NDVI values, with R
2 values exceeding 0.78 for 3-month-old and 0.77 for 6-month-old cassava crops. This high correlation indicates that LARS platforms, including both RC helicopters and drones, can effectively monitor chlorophyll content, providing a reliable assessment of crop health (
Figure 9a).
For 3-month-old healthy cassava plants, the RC helicopter system showed an upward trend in R
2 values, ranging from 0.877 to 0.878, while for infected plants, the values were slightly lower but still significant. Similarly, the drone system exhibited R
2 values that were higher than 0.77, confirming that both systems are capable of providing accurate chlorophyll measurements, which are critical for assessing the nutritional status of crops and detecting early signs of stress or disease. A similar result (with R
2 > 0.75) was also reported by [
19] for the spinach crop grown under greenhouse conditions (
Figure 9b).
These results reinforce the utility of NDVI as a key vegetation index in precision agriculture, particularly when used in conjunction with chlorophyll content measurements to monitor the health and vigor of cassava crops [
6,
7,
8].
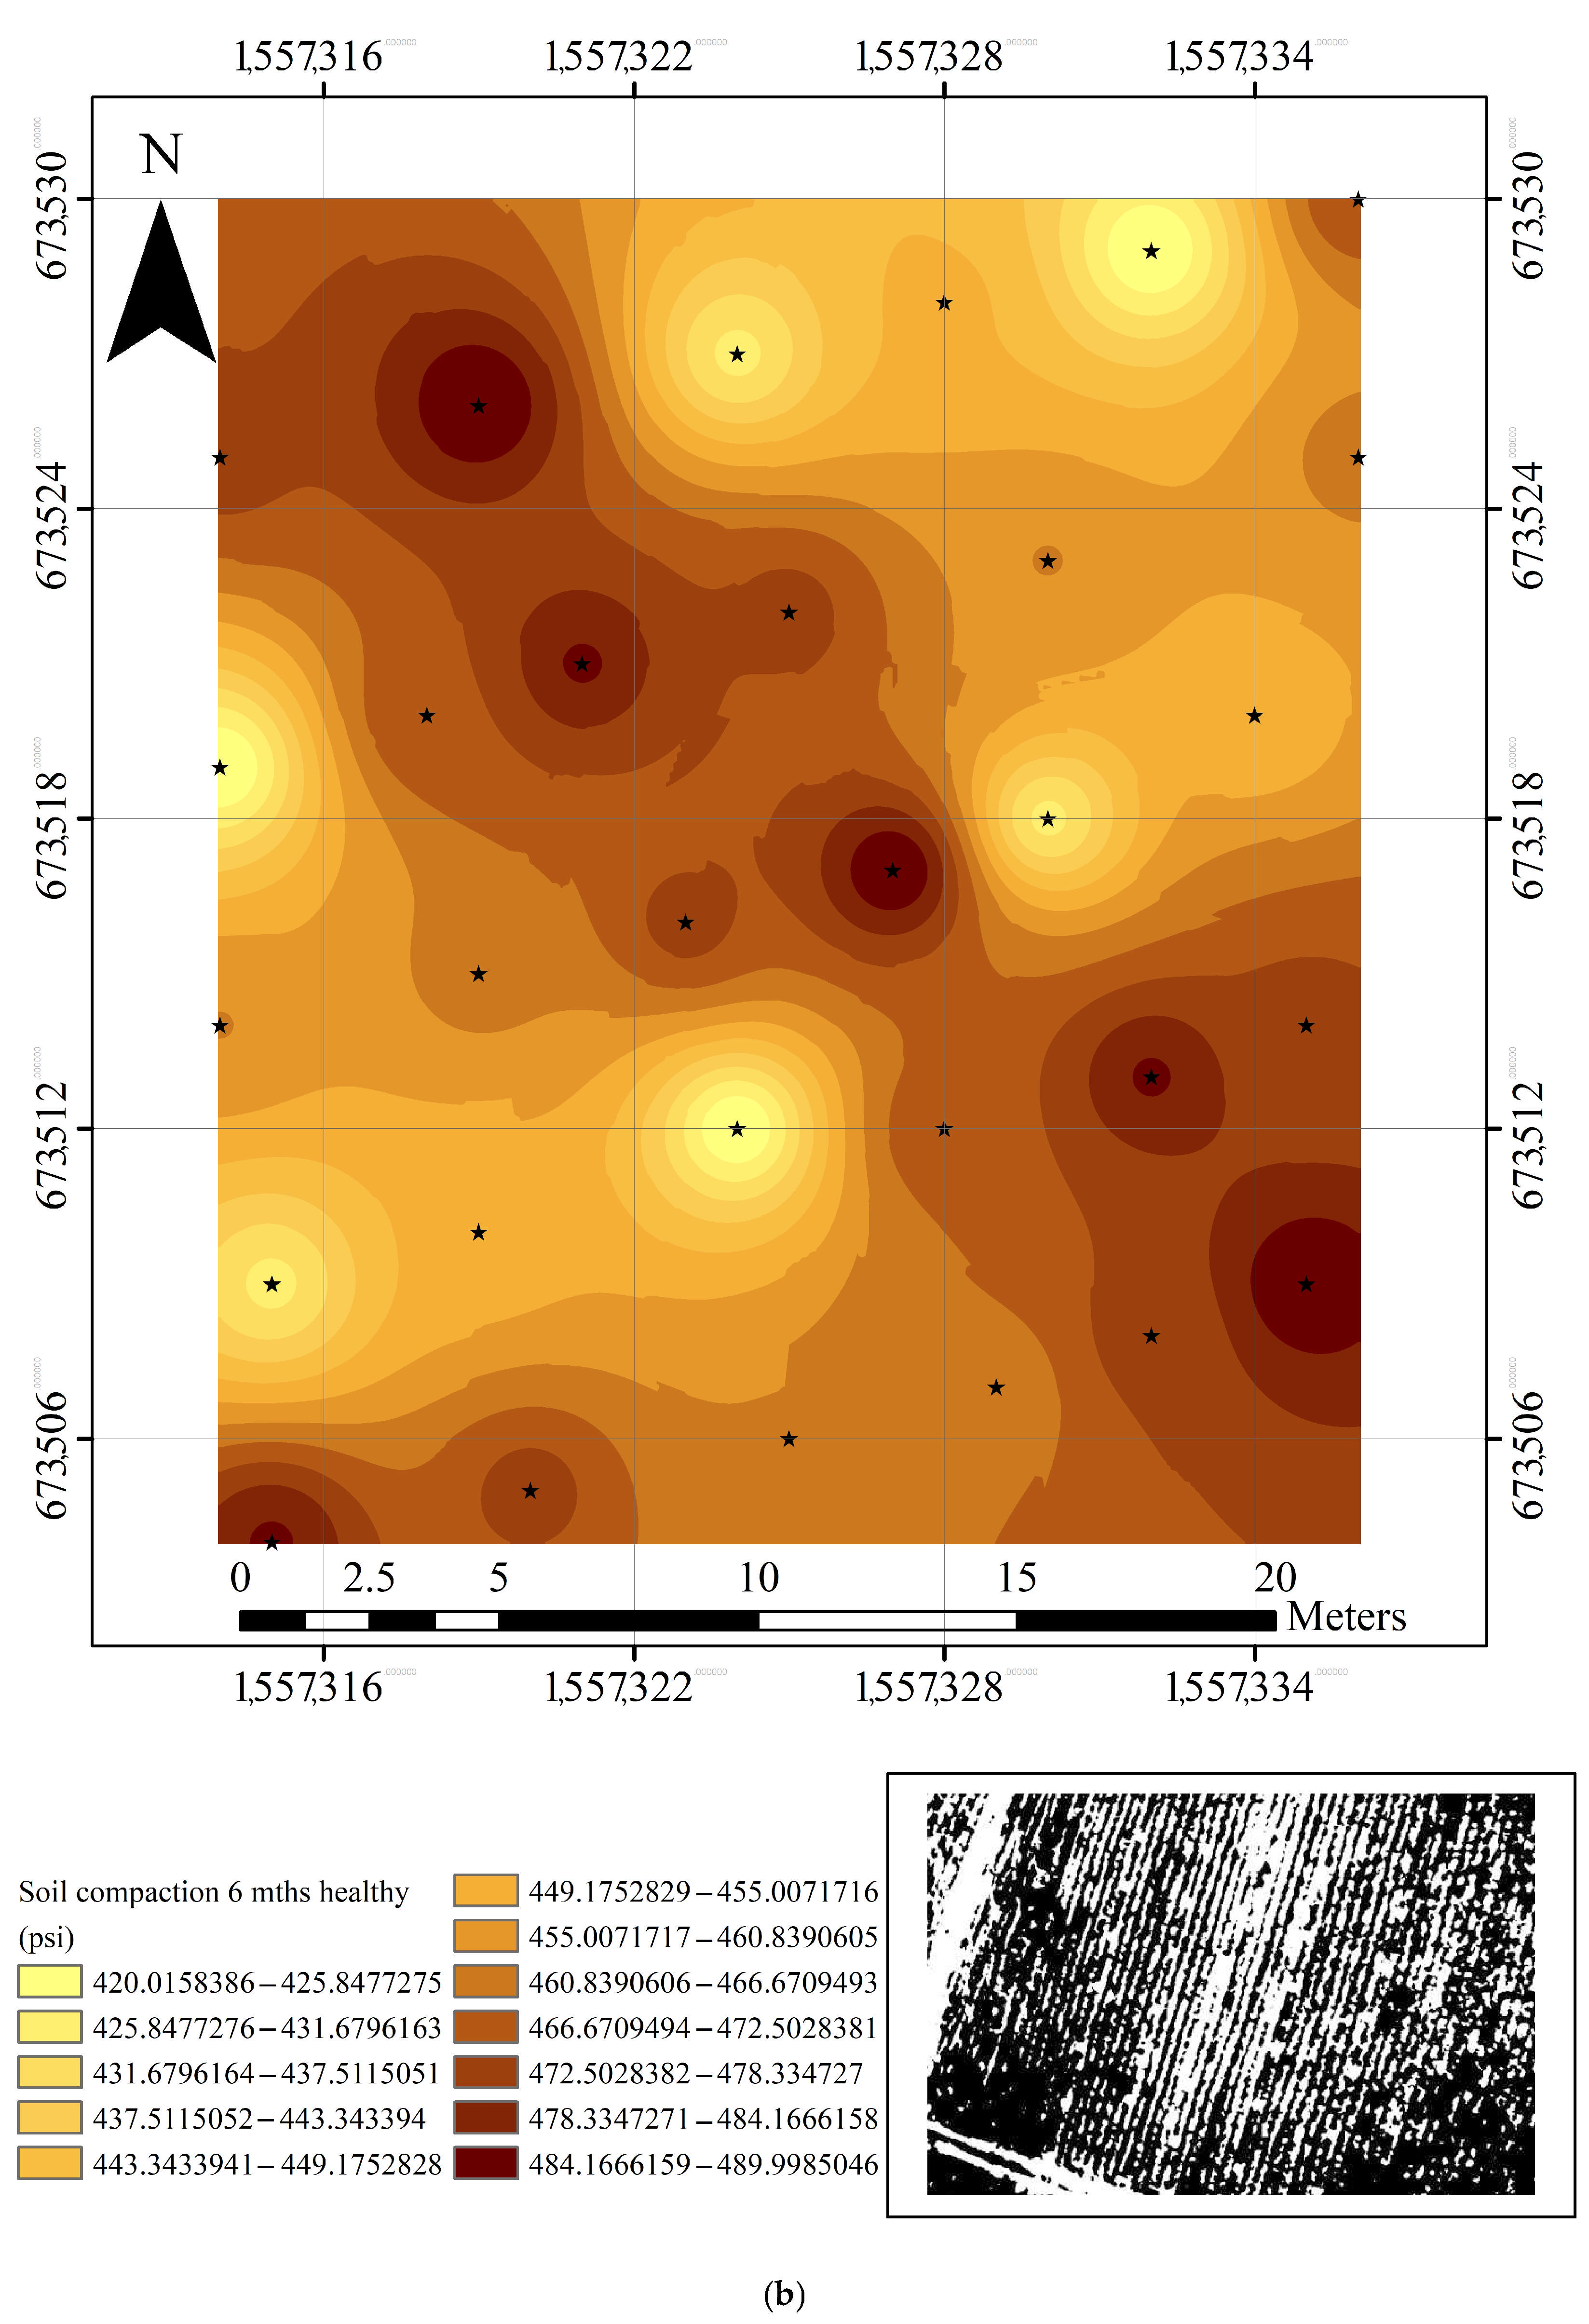
3.5.3. Effect of Soil Compaction Values and NDVI Values on Estimation Accuracy
The study also explored the relationship between soil compaction, measured using the Field Scout SC 900 soil compaction meter, and NDVI values obtained from the LARS platforms. Soil compaction plays a crucial role in plant growth, affecting root development, water infiltration, and nutrient availability. The study revealed that soil compaction readings were significantly correlated with NDVI values (R
2 > 0.70) for both healthy and diseased cassava plants at 3 and 6 months (
Figure 10a).
For instance, at a soil compaction level above 321 psi, the growth rate of cassava plants was notably higher, indicating that optimal soil compaction is essential for healthy crop development. The study found that healthy 3-month-old cassava plants exhibited compaction values ranging from 225 to 329 psi, while diseased plants showed slightly higher compaction values, ranging from 255 to 370 psi (
Figure 10b). Similarly, 6-month-old plants demonstrated a clear correlation between compaction values and NDVI, with healthy plants showing values between 420 and 489 psi and diseased plants between 420 and 533 psi. These findings suggest that NDVI can be a valuable tool for monitoring soil conditions and making informed decisions about soil management practices in cassava fields [
24,
25].
3.5.4. Effect of Chlorophyll Content and GNDVI Values on Estimation Accuracy
The study found a stronger correlation between the green normalized difference vegetation index (GNDVI) and the chlorophyll content of cassava leaves compared to NDVI. For the RC helicopter system (
Figure 11a), R
2 values were as high as 0.87 (healthy) and 0.93 (infected) for 3-month-old crops, and similar high correlations were observed with drone systems (
Figure 11b). The reason for this could be because there is a strong correlation between the ‘G’ spectral band value and the greenness of healthy young and infected mature cassava leaves [
6,
25,
30]. This highlights the importance of GNDVI in accurately assessing the greenness and health of cassava crops, particularly in distinguishing between healthy and infected plants [
9,
25].
3.6. Discussions
This research will utilize a low-altitude remote sensing platform to monitor plant growth and disease outbreaks in cassava. The study compares the efficiency, cost, and quality of algorithms processing images from RGB (Red, Green, Blue) and NIR (Near-infrared) cameras. It will also examine the spraying characteristics at different altitudes for both RC helicopter-mounted and drone-mounted systems.
The following factors will be considered to determine the most effective system to use:
The structure, parameters, or decision-making process of the algorithms
Results from statistical analysis
GIS (Geographic Information System) application mapping
Criteria related to the rate of spraying
Soil compaction maps in cassava plantations
Variations in chlorophyll content based on leaf reflectance in cassava fields
Crop growth variations in cassava fields
By assessing these elements, the study aims to identify the optimal method for monitoring cassava crops.
3.6.1. The Structure, Parameters, or Decision-Making Process of the Algorithms
Image data captured at different altitudes using True Color Digital (RGB) cameras and G-R-NIR Color Infrared (CIR) cameras, both mounted on remote-controlled helicopters and drones, were processed with a specially designed algorithm. The separation of image areas involves distinguishing the object of interest from the background and any unwanted elements. This can be achieved through various techniques, including thresholding. The basic principle of thresholding is to convert a grayscale image into a binary image with values of either 0 or 1, based on Otsu’s Thresholding method. The resulting numerical values are then used to determine the variable rate of chemical spraying. This also allows for the creation of a GIS application map for variable-rate chemical spraying, utilizing big data collected from cassava plantations.
Interestingly, young and vigorous cassava plants tend to be less healthy than older vigorous ones, as indicated by higher R
2 values, despite potential errors due to smaller canopies. Additionally, high soil compaction levels lead to reduced planted surface areas. However, images from both cameras provide near real-time results that are sufficiently accurate to develop a plant index and differentiate between growth density and infected plants, regardless of their growth stage. Compared to other methods, this approach could be particularly beneficial for medium to large-scale cassava growers and shows promise for application in other crops as well [
19,
20,
21,
22].
3.6.2. Results from Statistical Analysis
A three-way ANOVA on an artificial test plot for image processing calibration revealed significant interactions between spraying altitude, sample density, and camera type. The analysis indicated that the NIR camera provided the highest segmentation quality at all tested altitudes, particularly at 5 m and 10 m, where it outperformed the RGB camera in detecting vegetation density [
4,
5]. These findings emphasize the importance of selecting the right camera type and altitude for accurate crop monitoring in cassava fields.
There is no interaction between the image data acquisition systems (RC helicopters and drones mounted) and the density of the samples (100 pieces per m2) with the RGB and NIR cameras.
Interestingly, at the altitude levels of 5 m and 10 m, the effect of the sample density of the NIR camera was significant, whereby only the density of 100% gave a high segmentation performance (74.08–80.86 pieces from RC helicopters and 73.80–82.86 pieces from drones mounted,
Table 4). This may be due to the low resolution of the camera, which reduces the image segmentation efficiency at low density. Overall, the highest segmentation quality from both systems was generated using the following conditions: at altitude levels of 5 m, 10 m, 15 m, and 20 m, with 100% density, and using the NIR camera. These conditions produced the highest segmented (80.86–82.86 pieces, 73.80–74.08 pieces, 73.37–74.76 pieces, and 69.53–71.21 pieces, respectively) [
16,
24,
30,
36].
3.6.3. GIS (Geographic Information System) Application Mapping
To apply variable-rate fertilizer and chemicals, an injection system was precisely moved overhead with a straight alteration pattern above the cassava plantation. The system was controlled by RGB/NIR-modified cameras, which had the best resolution of 1 m × 1 m at 1.2 m above the plantation. The flight height was selected based on an appropriate coverage of the region of interest (ROI) on the field with plants.
Georeferencing methods involve combining plot-based images from an RGB/NIR-modified camera with information from a GPS receiver sensor. The images were acquired by RC helicopters and drones and may have inaccuracies due to GPS signal strength and accuracy. From
Figure 12, to address this issue, each frame of the image (1, 2, 3, 4) is manually combined using markers (Xi,Yi). The algorithm then trims excess areas beyond the ground margins and corrects the images for altitude (5). The true ground coordinates serve as reference points to combine all images into a matrix (6), which generates a combined image [
24,
27]. This final image is used for further analysis and converted to GIS map layers.
3.6.4. Criteria Related to the Rate of Spraying
The experiment was conducted at altitudes of 1 m, 2 m, 3 m, and 4 m, utilizing spray quantities of 20 cc, 60 cc, and 100 cc. Leaf reflectance from the drone-mounted system varied between 348 and 662 µmol m
2 for 3-month-old infected cassava [
24,
26]. Similarly, the chlorophyll content distribution for the infected cassava ranged from 131 to 374 µmol m
2. The original image had dimensions of 1536 × 1536 pixels (height × width), with a threshold value of approximately 179 pixels. The crop pixel values ranged from 8.003 to 71.999, as calculated from the image data [
16,
21]. A similar RC-helicopter flight was employed to capture data from a near-infrared (NIR) camera for crop growth values, where the calculated crop pixel values ranged from 18.005 to 77.995 [
2,
24,
36].
Separately, a prototype of a precision sprayer was developed and calibrated for accurate fertilizer and chemical injection. Key parameters optimized included nozzle size, boom arm length, pump pressure, and appropriate connections to the control unit, ensuring an exact injection quantity per cycle covering the area of interest (ROI). Subsequently, an algorithm was created to control the volume per working cycle, which was based on the plant-to-disease density ratio in terms of pixel areas (evaluated pixel by pixel).
Field tests were conducted with this automatic pesticide and chemical spraying system, leading to improvements in the prototype until its performance met satisfactory standards. The key variables affecting the operation of the spraying system were identified as the relationship between the disease density ratio of plants per area and the injection quantity, as well as the relationship between spraying frequency and the concentration of the injected dose. The spraying system comprised a series of solenoid valves, injectors, electric pumps, a microcontroller board, and relay modules.
3.6.5. Soil Compaction Maps in Cassava Plantations
Soil compaction data, mapped using geostatistical analysis, revealed that optimal cassava growth occurs at soil compaction levels above 321 psi (
Figure 13a). At this soil compaction, the recorded values for healthy and infected levels fall in the range of 225 to 329 psi and 255 to 370 psi, respectively, after 3 months [
24,
26]. Similarly, at this soil compaction, the recorded values for healthy and infected levels fall in the range of 420 to 489 psi and 420 to 533 psi (
Figure 13b), respectively, after 6 months. The study confirmed a direct relationship between soil compaction and cassava growth, with healthy plants showing higher growth rates at these compaction levels. This finding is crucial for effective pest control and agricultural management.
3.6.6. Variations in Chlorophyll Content Based on Leaf Reflectance in Cassava Fields
The correlation between chlorophyll content and leaf reflectance was mapped, revealing significant variations between healthy and infected cassava plants (
Figure 14a). Drones equipped with NIR cameras captured these variations effectively, providing a detailed assessment of crop health across the plantation.
At an altitude of 20 m, leaf reflectance from the drone mounted system varied from 781 to 1220 µmol m
−2 for 3-month-old healthy cassava, and 348 to 662 µmol m
−2 for 3-month-old infected cassava [
24,
26]. Similarly, the chlorophyll content distribution for 6-month-old healthy cassava was recorded between 1012 and 1430 µmol m
−2, and for infected cassava, it was between 131 and 374 µmol m
−2 (
Figure 14b).
3.6.7. Crop Growth Variations in Cassava Fields
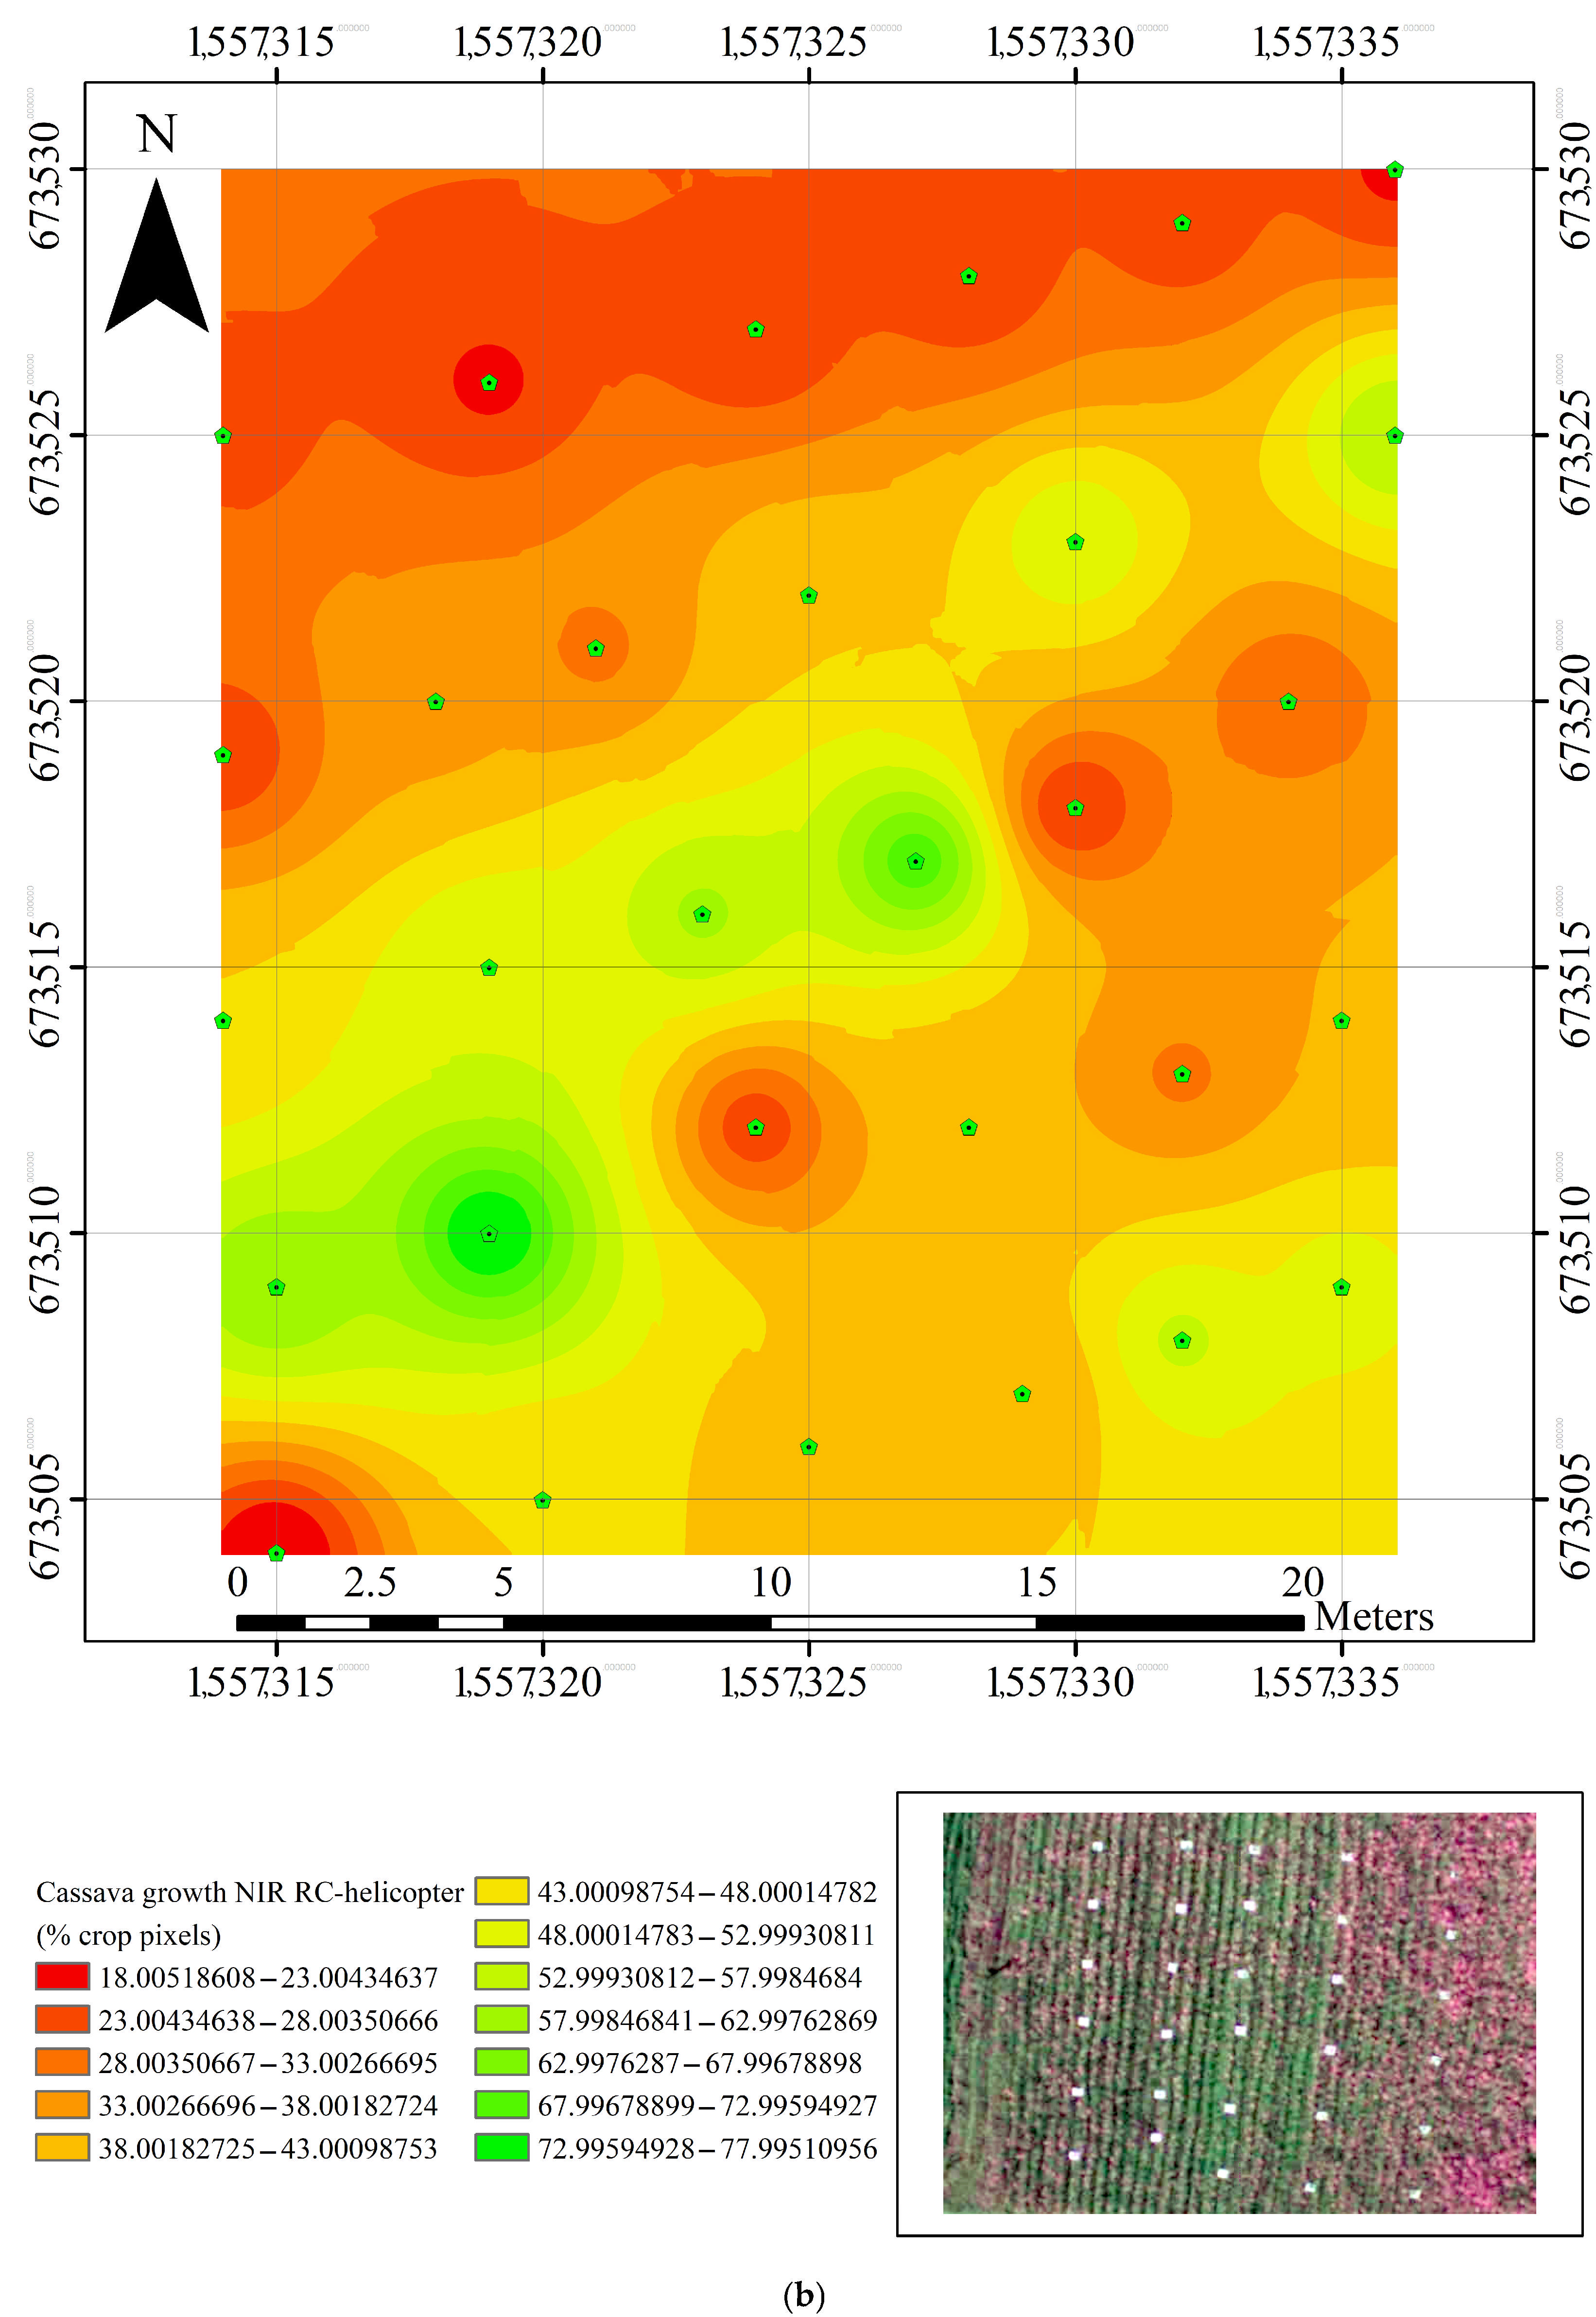
RC Helicopter-Based System
Images captured by RC helicopters and drones equipped with RGB and NIR cameras were used to map crop growth variations in cassava fields. The data showed that crop pixel values varied significantly depending on the camera type and altitude, with NIR cameras providing more accurate assessments of crop health (
Figure 15a).
The original image had dimensions of 1536 × 1536 (height × width) at 20 m height, and a threshold value of approximately 179 pixels. The crop pixel values ranged from 8.003 to 71.999, as calculated from the image data [
16,
21]. A similar RC-helicopter flight was used to capture data from a NIR camera for the crop growth values, as shown in
Figure 15b. The calculated crop pixel values ranged from 18.005 to 77.995 [
2,
24].
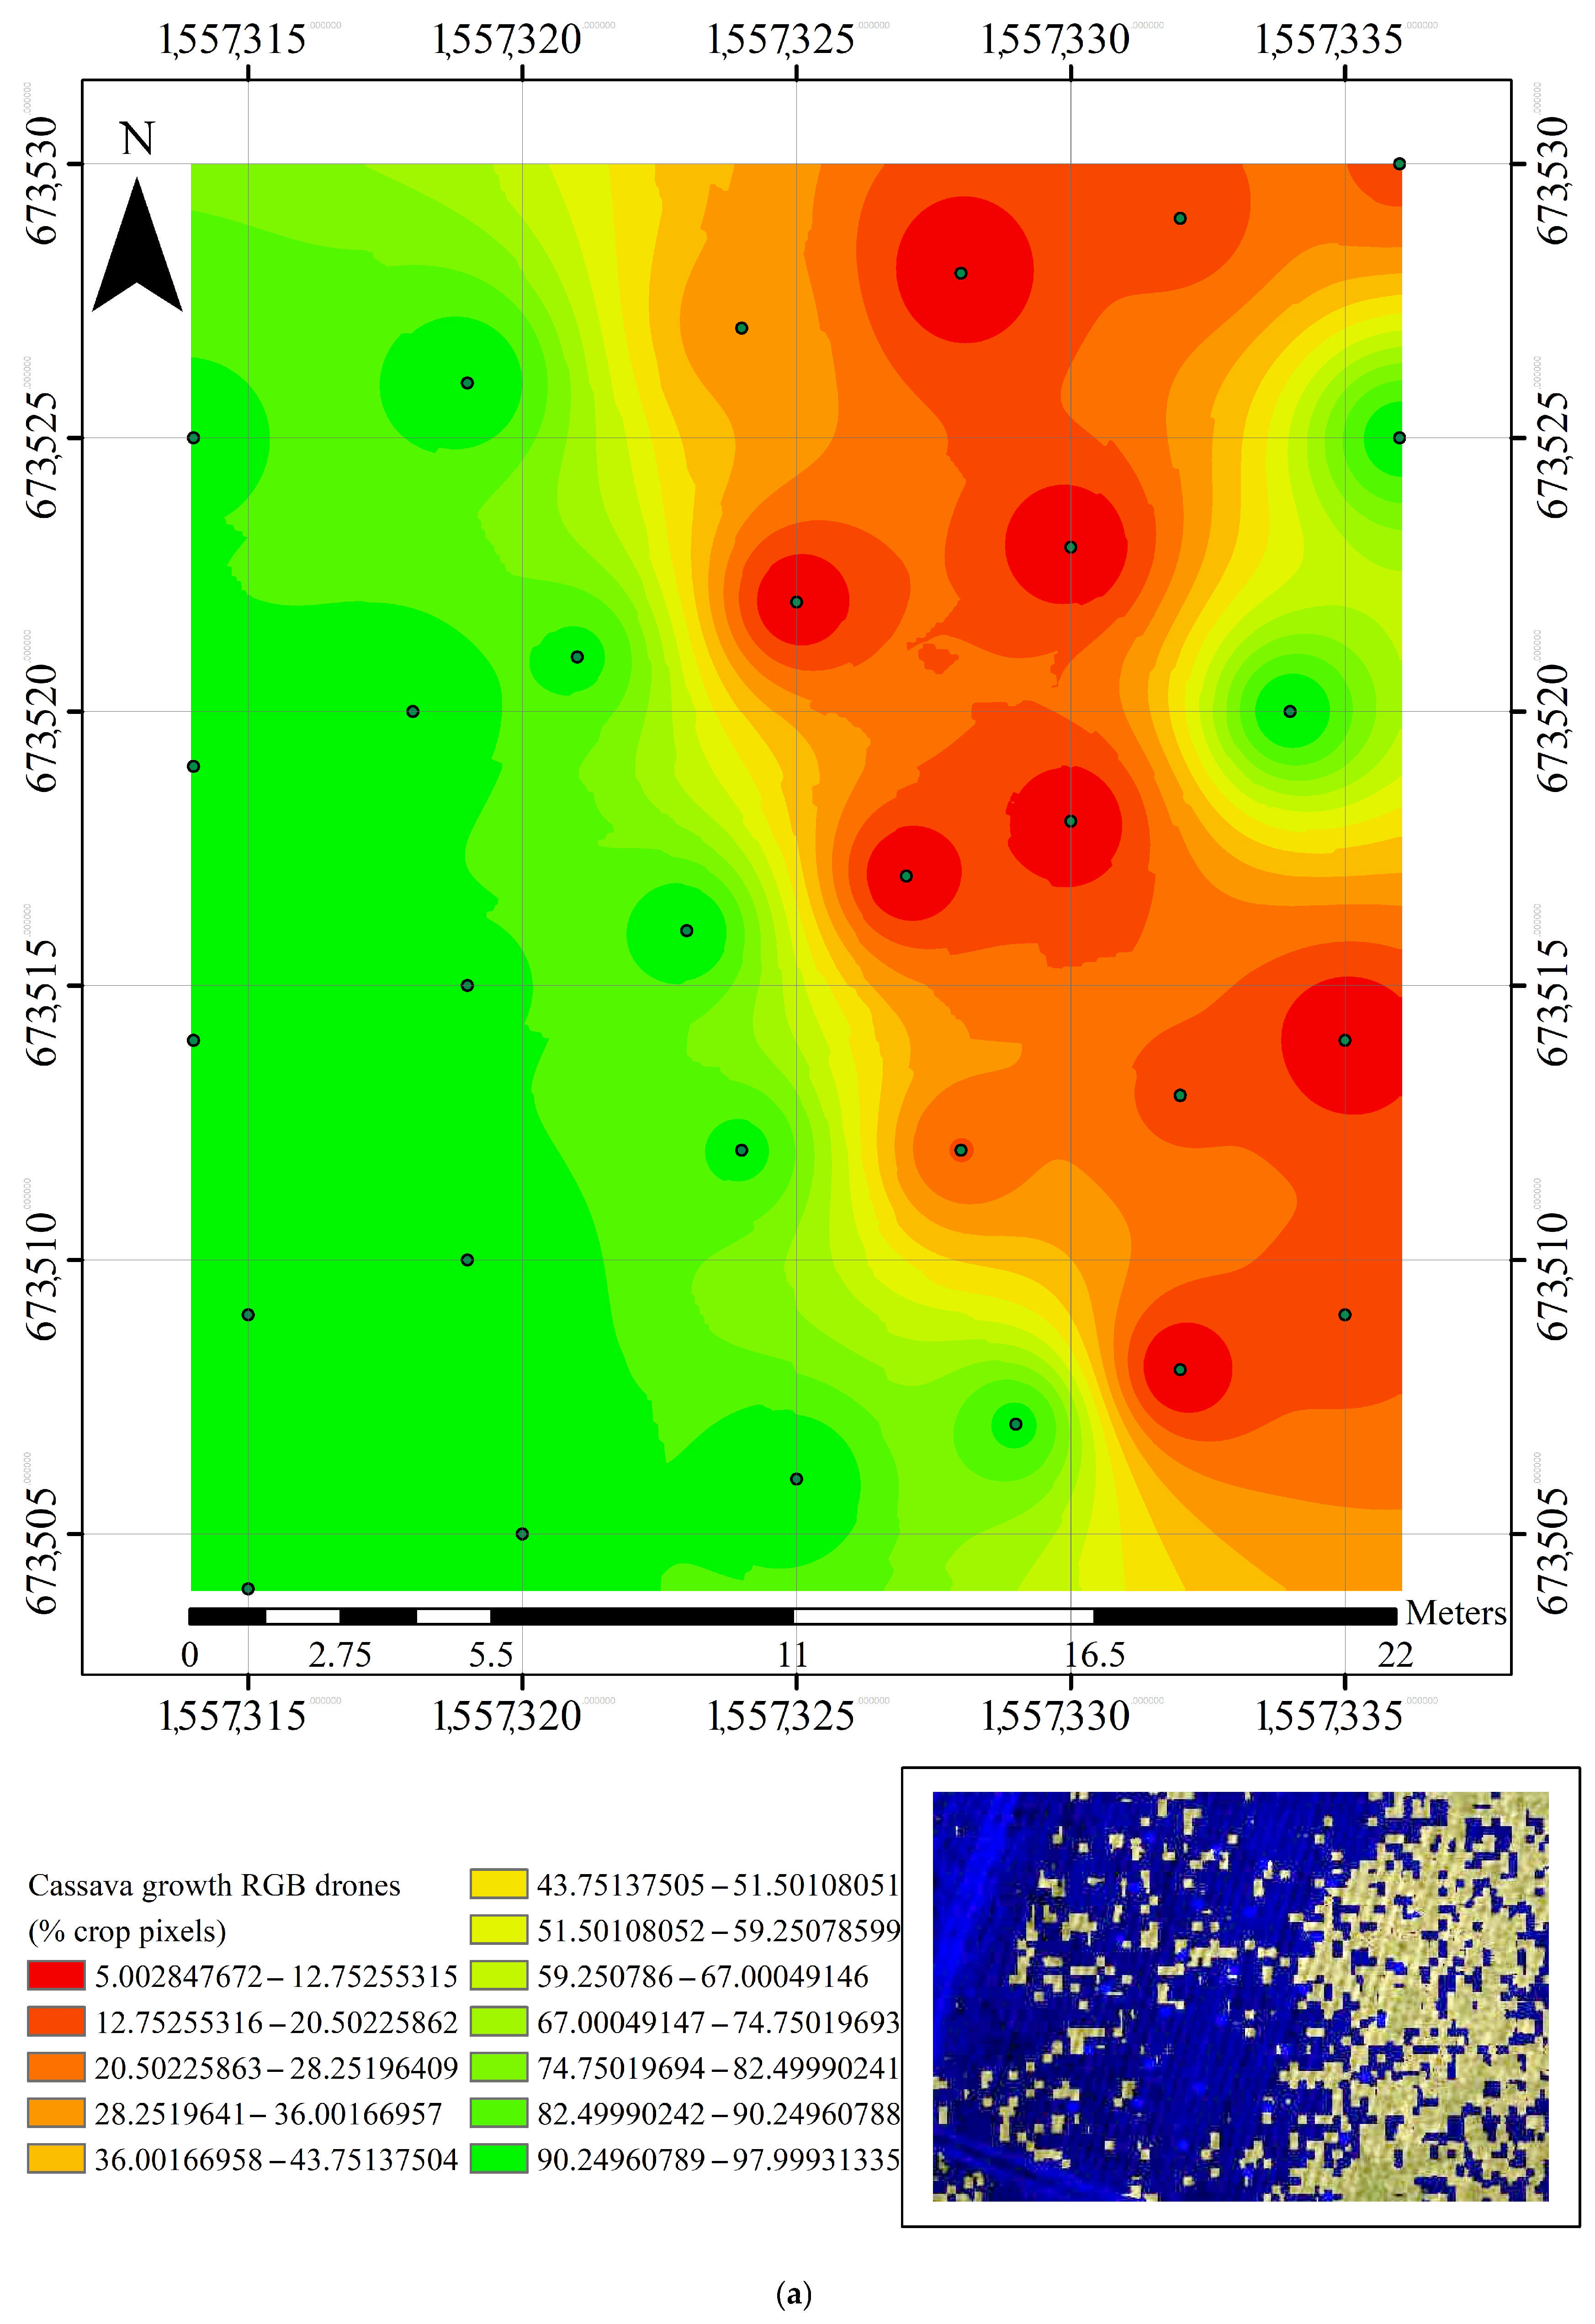
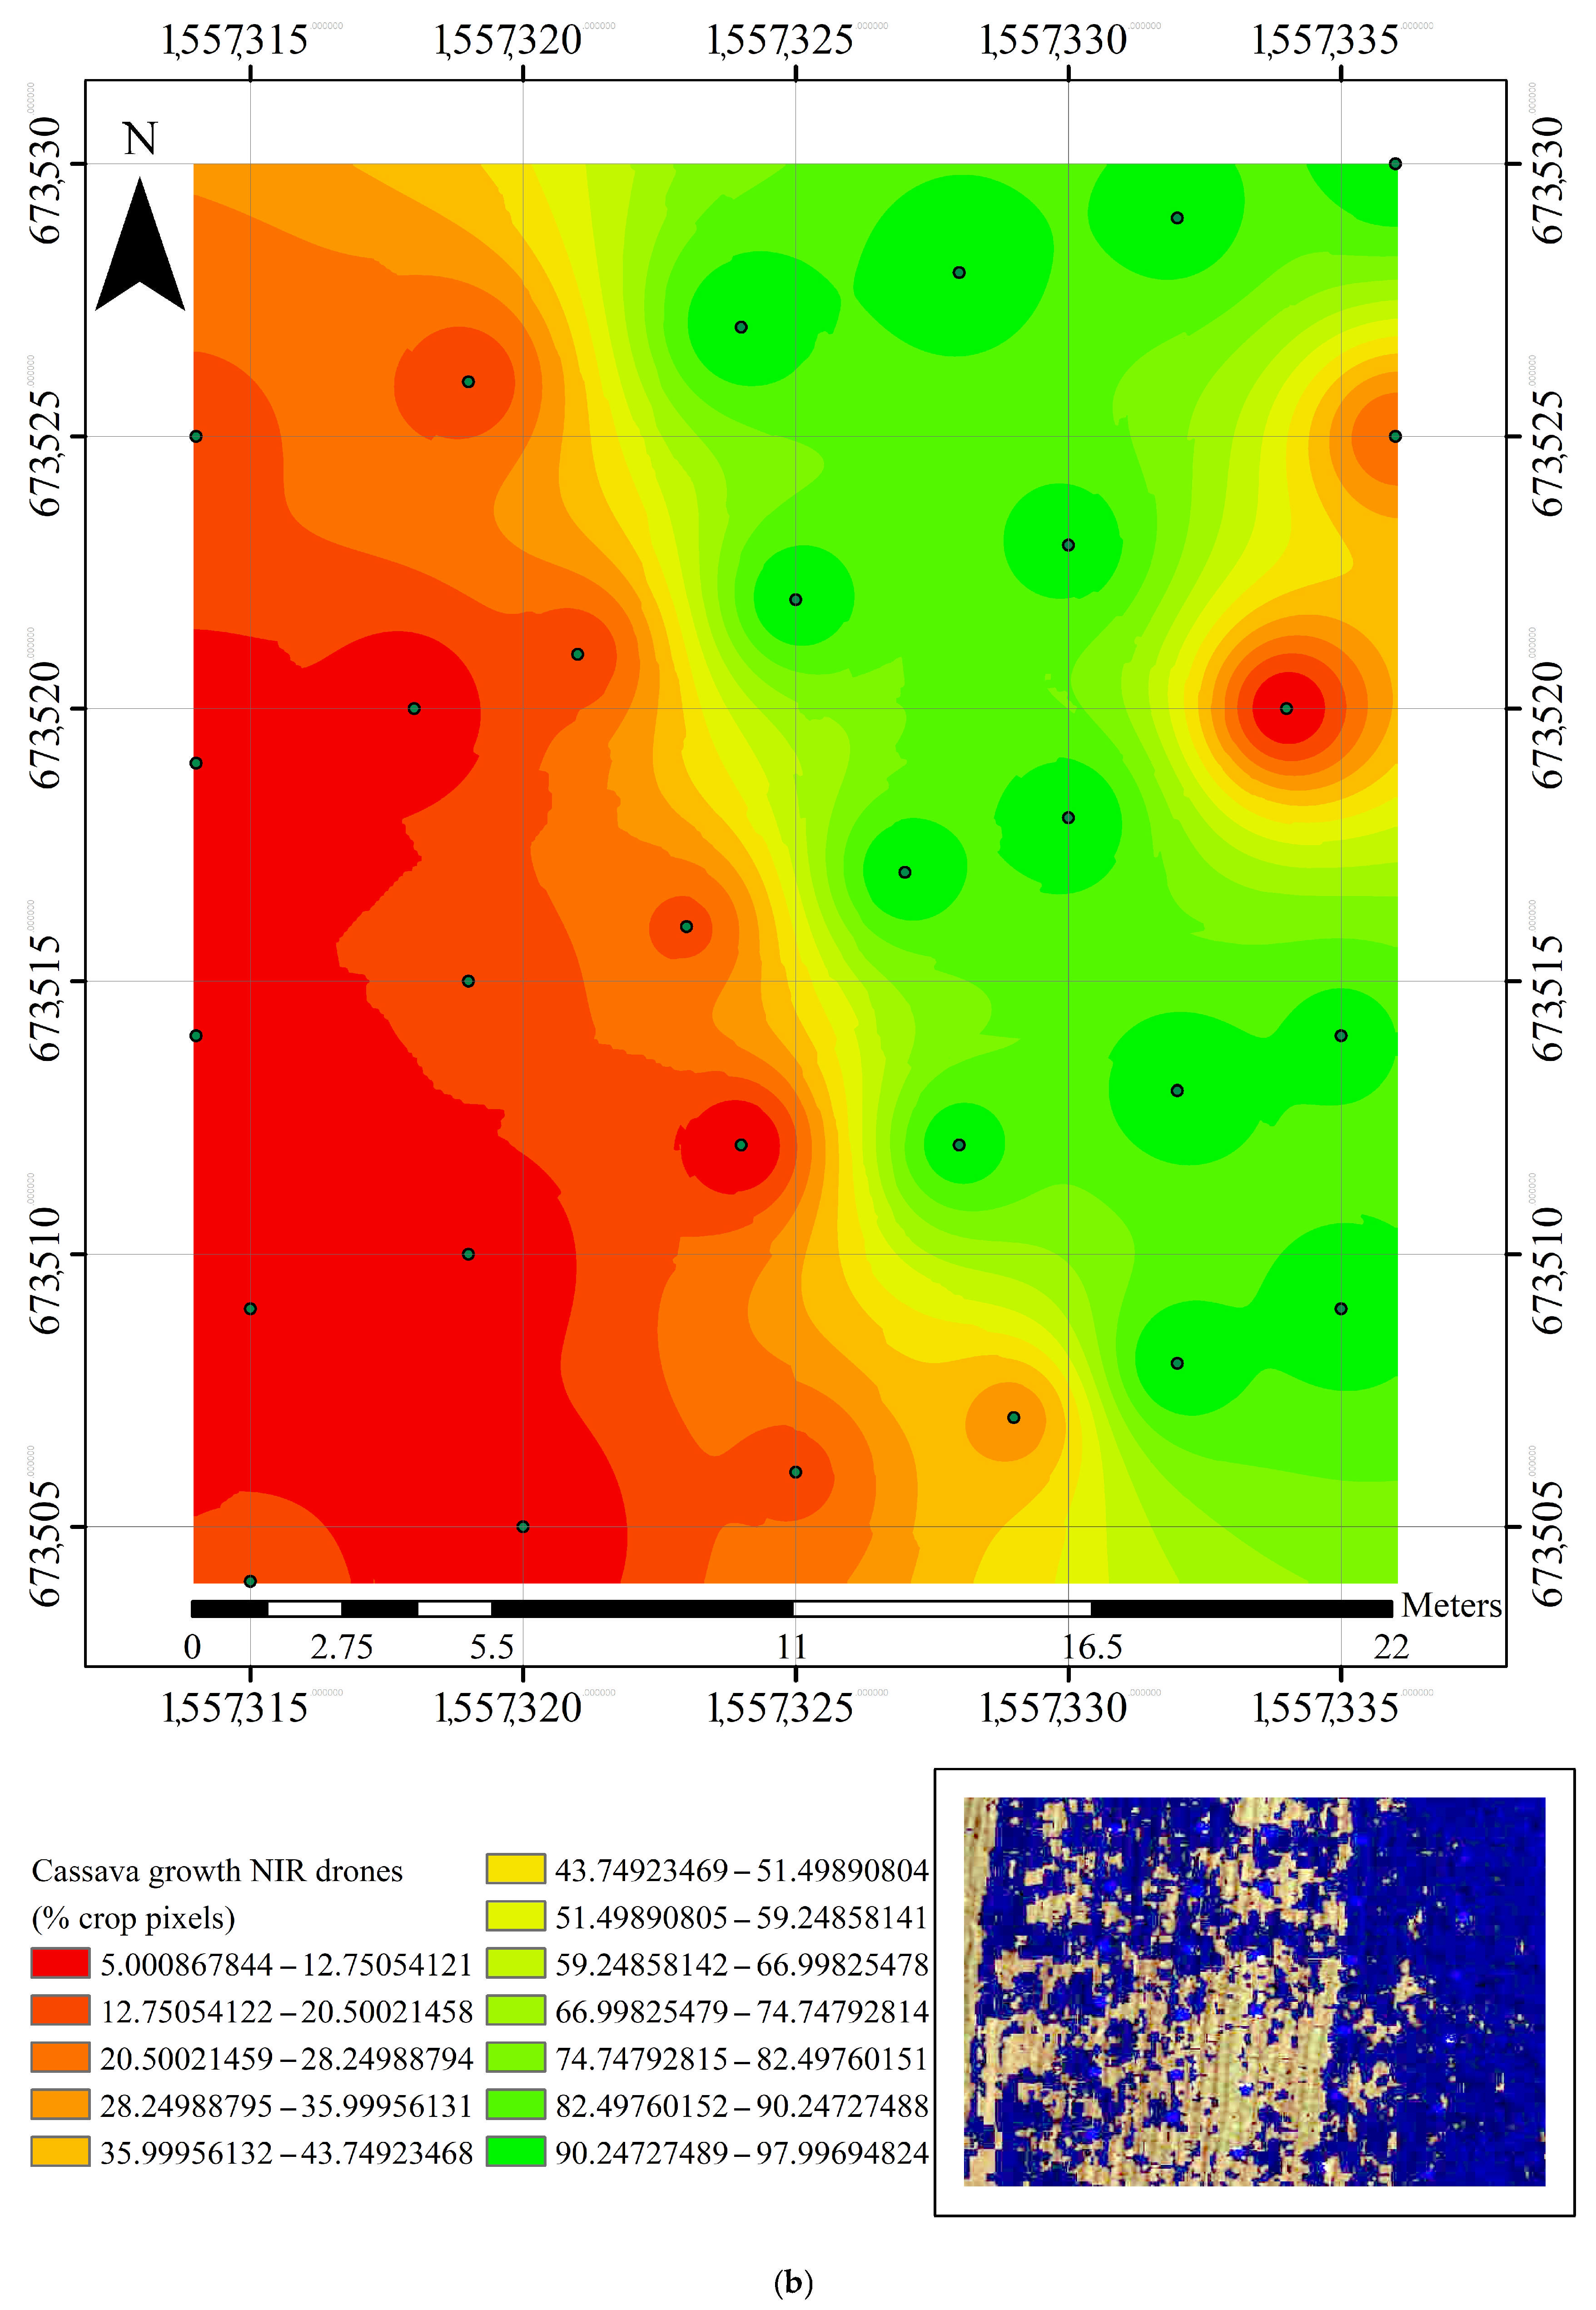
Drones Mounted System
The RGB camera mounted on the drone also captured the distribution of crop growth values in cassava plantations (
Figure 16a), at 20 m height, and provided similar dimensions of the original image (1536 × 1536; threshold value of 179 pixels). The calculated crop pixel values ranged from 5.002 to 97.999, as determined from the image data [
7,
16]. Similarly, data collected from an NIR camera mounted on the drone (
Figure 16b) showed the calculated crop pixel values ranged from 5.008 to 97.996 [
4,
10,
13].
4. Conclusions
The integration of LARS platforms, including RC helicopters and drones equipped with variable-rate sprayer systems and advanced imaging technologies, offers a cost-effective and accurate method for monitoring cassava crops. These systems effectively replace expensive satellite imagery, providing real-time data on crop health, soil compaction, and chlorophyll content. The study demonstrates that by using NDVI and GNDVI indices, along with chlorophyll measurements, these platforms can precisely monitor cassava growth and disease infestation.
When comparing the performance of RC helicopters and drones equipped with variable rate sprayer systems in modern cassava fields at different altitudes, it was observed that the percentage of cassava density, as captured by both NIR and RGB cameras, decreased when the altitude exceeded 10 m. Regarding the quality of the image processing algorithm, the value obtained through calibration was found to be acceptable. Furthermore, the drone equipped with a variable rate sprayer system was found to have a higher value in terms of system quality as compared to the RC helicopter-mounted system. The findings support the adoption of these technologies for precision agriculture, ensuring higher yields and more efficient pest management in cassava plantations.
This study suggests that academic advancements may play a significant role in adopting intelligent precision agriculture. Through a thorough research process and appropriate methodology, the findings offer a detailed analysis that contributes new insights beyond the original work. This knowledge can be widely used to assess the benefits of an aging economy and society.


 ,
, 


