1. Introduction
The quality of soybeans in the post-harvest market is determined by physical classification. Accordingly, soyabean grains can be divided into group I (suitable for consumption in nature), which is categorized into type I and type II according to quality levels, and group II (intended for other purposes), categorized into standard basic and out-of-type samples (discarded or relocated). The quality of each category (type I, type II, and standard basic) is defined based on the percentage of tolerance established by the technical regulations for soybeans [
1,
2]. Defects in soybean grains can occur because of factors such as inadequate crop management, pest attacks, adverse weather conditions, and failures in post-harvest processes such as drying at high temperatures.
According to the technical regulations for soybeans [
1,
2], defects in soybeans are grouped into serious and minor defects. Serious defects include burned, sour, and musty beans, while minor defects include crushed, damaged, fermented, germinated, immature, greenish, shriveled, split, and broken beans. In general, these defects devalue a product, impact its legal classification, and result in discounts on purchase and sales contracts.
Soy is one of the main agricultural products worldwide and is highlighted as a source of protein for humans and other animals [
3]. The soybean grain is composed, on average, of 40% protein, 20% lipids, 5% fiber, and approximately 35% carbohydrates [
4,
5,
6]. Owing to their diverse macronutrient composition, soybeans are important ingredients in the production of several commodities, including biodiesel [
7], plant-based meat [
8], animal feed [
9], and other derivatives.
The physical appearance and chemical composition of soybeans are determining factors of their quality [
10]. With advancements in the economy and science, it is essential to invest in technologies that improve the determination of grain compositions. Traditional analysis methods, although widely used, have disadvantages such as high cost of specialized labor, long analysis time, and risks of environmental contamination due to the use of chemical reagents [
10].
Near-infrared (NIR) spectroscopy is an efficient alternative for assessing the quality of soybean grains. This technology enables the quick determination of a sample’s chemical composition through the absorption and vibration of organic matter in the infrared region [
11]. However, its implementation is hindered by the high initial cost of equipment and the need for extensive calibration [
12]. Shi et al. [
13] developed models for NIR calibration to predict the gross protein and amino acid contents in soybean. In addition, researchers have explored the impact of particle size, fat content, and type of NIR spectroscopy on the predictive capacity of the models. The results demonstrate that the accuracy of the predictions increased when the grains were milled and the lipids were removed; however, the high cost of this sample preparation procedure should be considered. Ferreira [
14] predicted that techniques such as mid-infrared spectroscopy and NIR spectroscopy could be applied as analytical tools in industries to monitor soybean quality and simultaneously measure several quality parameters. NIR spectroscopy reveals chemical composition and spectral data, allowing the development of multivariate calibration models.
Multivariate analysis allows multiple variables to be examined simultaneously. Among the most used multivariate analysis methods, principal component analysis (PCA), which reduces the dimensionality of data by predicting more relevant information, is becoming an essential data interpretation tool [
15]. This technique identifies variables or combinations of variables that produce underlying patterns in the data, allowing them to be analyzed and interpreted in chemical and physicochemical terms [
16].
Another widely used multivariate analysis method is clustering, which classifies homogeneous data based on their similarities. This method is used to classify data into cluster types and to measure similarities across different sources [
17]. Pearson correlation is a method that assesses the degree of linear relationship between two continuous variables, represented by r, which ranges from −1 to 1. A value of −1 indicates a perfect negative correlation; 1 indicates a perfect positive correlation; and 0 indicates no linear correlation between the variables.
The physicochemical characterization of soy grains is essential for evaluating their quality for human and animal consumption and for biofuel production. Given the growing global demand for grains, it is essential to improve the analytical methods that guarantee quality and efficiency in production. Therefore, the present study aimed to determine the physical and physicochemical properties of soybean grains through NIR spectroscopy and multivariate analysis.
2. Materials and Methods
This study was carried out at the Post-Harvest Laboratory of the Federal University of Santa Maria (Cachoeira do Sul Campus) in conjunction with the Physical–Chemical Analysis Laboratory located at the Food Research Center of the University of Passo Fundo.
2.1. Obtaining Samples
Soybean samples from the harvest of 2022/2023 were obtained after grain processing (without storage) at the Tritec Cereais storage units in Bianchini, both located in the municipality of the Waterfall of South, in the Center of Rio Grande of South, in the physiographic Depression Central region. The city is located beside the River Jacuí, with the geographic coordinates latitude 30°0′45″ S, longitude 52°55′11″ W, and an altitude of 73 m. Cachoeira do Sul is the largest city located in the Jacuí Valley, covering an area of 3735.164 km2, and is the ninth largest municipality in the state.
2.2. Sample Preparation
The samples were separated according to Classification Normative Instructions No. 11 [
1] and No. 37 [
2], which govern the technical regulation of soybeans, where group I is intended for consumption in natura and group II for other purposes. Type I, type II, and basic standard are defined for the purpose of classifying the product’s quality.
The samples for product typing were composed with the maximum number of defects permitted by IN MAPA regulation No. 11/2007, in which type I grains may have a maximum of 4% of damaged grains (burned, moldy, immature, shriveled, fermented, and germinated), type II grains 6%, basic standard 8%, and off-type 12% or more. The samples were also composed of greenish, broken, and crushed grains: 2% (type I), 4% (type II), and 8% (basic standard) of green grains and 8% (type I), 15% (type II), and 30% (basic standard) of broken and crushed grains were added. The samples were quantified in grams (
Table 1 and
Table 2) for a better interpretation of the quantity of defects used in the samples (type I, type II, basic standard, and out of type).
2.3. Defects and Healthy Grains
To characterize individual samples of defective and healthy grains, 100 g of each category was separated. The defects in the soybean grains were as follows: burned, sour, musty, fermented, germinated, damaged, immature, and shriveled.
2.4. Group I, Group II, and Out-of-Type Samples
The samples in group I belonged to types I and II, whereas those in group II corresponded to the basic standard type. The out-of-type samples did not fit the established groups. These classifications were determined based on the maximum limits of tolerated defects according to the classification standard IN MAPA No. 11/2007 [
1,
2]. Next, 2 kg samples were prepared for group I, group II, and out-of-type soybeans (
Table 1 and
Table 2).
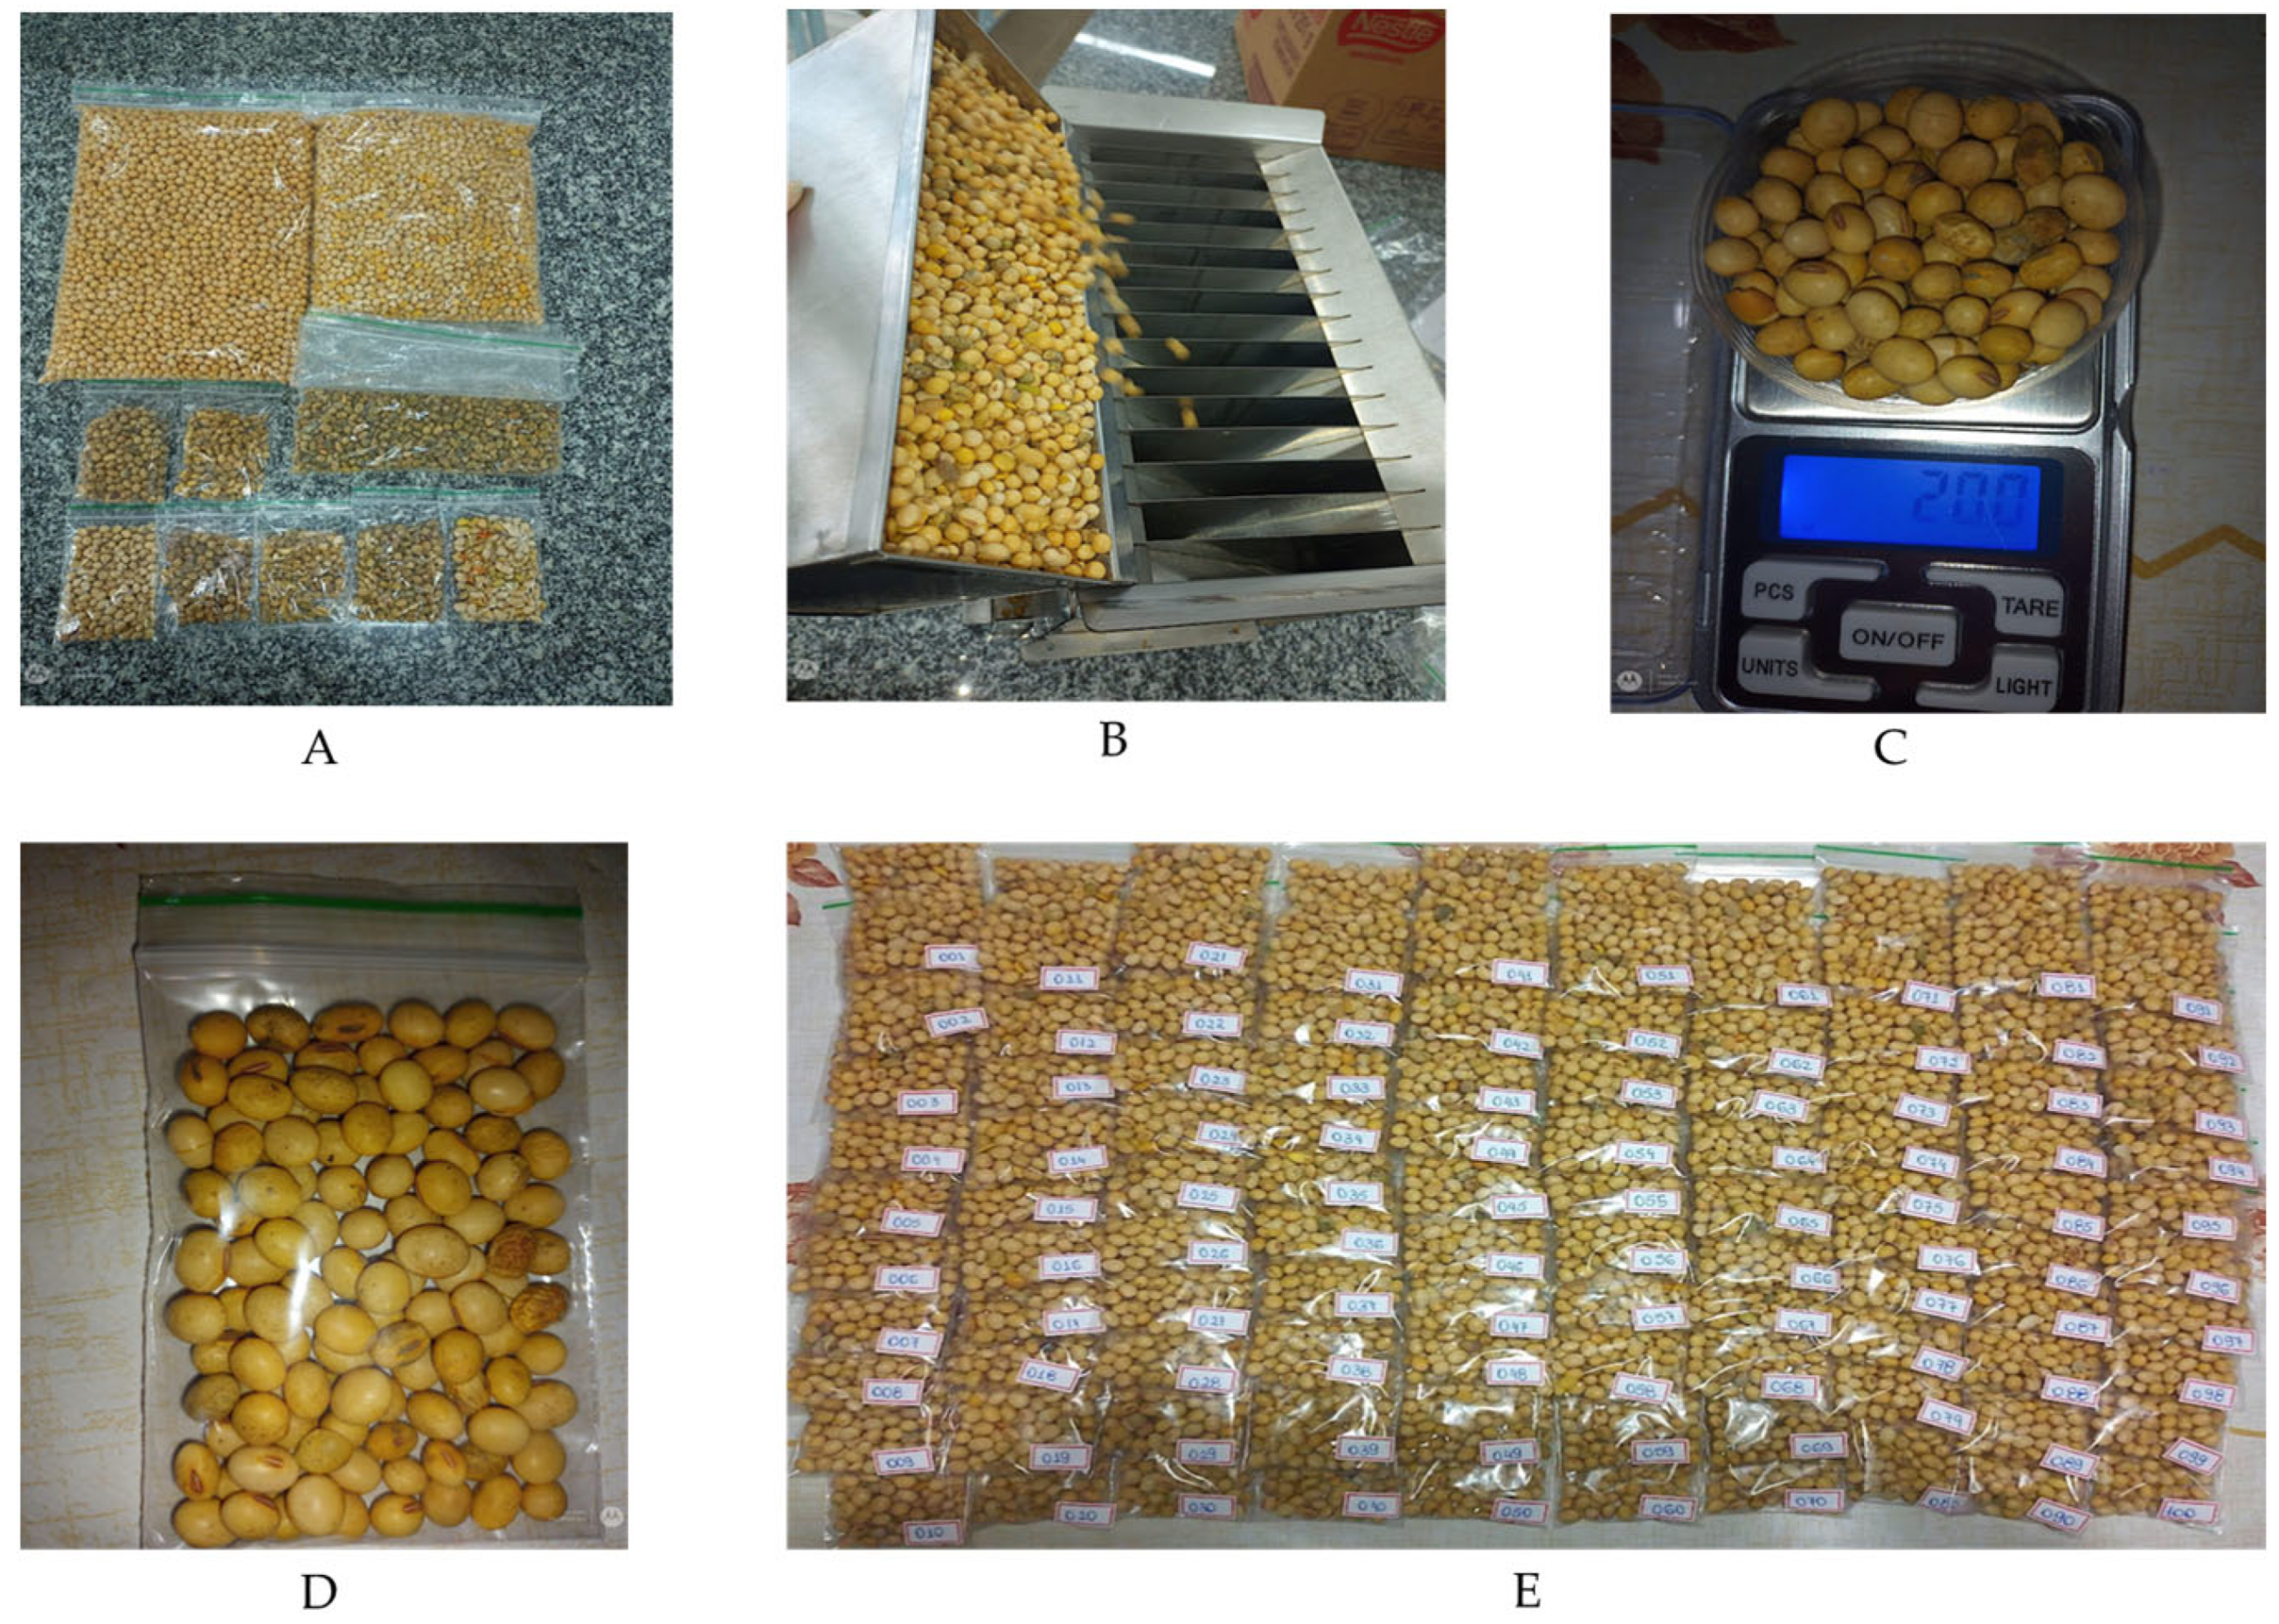
After selecting the number of defects to compose each category, the grains were homogenized using a quartering machine according to the maximum defect tolerances allowed. Subsequently, the 2 kg samples were divided into 100 subsamples of 20 g in airtight plastic bags, as shown in
Figure 1.
The type I and type II, basic standard, and out-of-type samples were homogenized, packaged, and identified according to their category. Subsequently, they were subjected to an analysis of their centesimal composition by means of near-infrared spectroscopy (NIR). After the analysis, the samples were packaged and stored according to their identification for future studies.
2.5. Proximate Composition
The percentages of crude protein (CP), water content (WC), lipids (LIPs), crude fiber (CF), ash (ASH), and starch (ST) in individual defects and healthy grains from the type I, type II, standard basic type, and out-of-type samples were determined using NIR spectroscopy (FOSS, DS2500 spectrometer, Hillerød, Denmark). This method is based on the interaction between light and the sample, where the sample is illuminated by radiation of a specific wavelength in the NIR region. The samples are placed in a sampling capsule in which the light interacts with the sample. Then, the amount of reflected energy emitted by the spectrometer is reflected by the sample to the detector.
This technique allows for the rapid and accurate analysis of multiple grain constituents (CP, WC, LIPs, CF, ASH, ST). For better accuracy, the analyses were performed in triplicate and conducted in reflectance mode. Spectral data were recorded in the spectral range of 400 to 2500 nm. After collecting the spectral data of the centesimal composition of the soybean grain, an analysis of variance ANOVA (Sisvar version 5.8 software) was performed using the F test to verify the existence of significant differences between the experimental categories (defects and soybean type classifications). The grouping of the means was performed using the Scott-Knott test at 5% probability [
18].
2.6. Statistical Analysis
All the statistical analyses were performed using a completely randomized design (CRD) experiment. To evaluate the defects, 11 experimental categories were employed (germinated, shriveled, burned, crushed, fermented, immature, healthy, broken, damaged, moldy, burned), each with three replicates. The obtained data were statistically analyzed using RStudio (Software version 1.0). Four categories were evaluated to classify the type I, type II, basic standard, and out-of-type samples, with 100 repetitions in triplicate, resulting in a total of 1200 analyses. The data were evaluated using the RStudio program, and the averages were compared using the Scott-Knott test with 5% probability. In addition, PCA and Pearson correlation were performed using the Rbio software (Software version 2.0), allowing for a more detailed evaluation of the relationships between the variables analyzed.
2.6.1. Principal Component Analysis
Principal component analysis (PCA) was used as a tool to visualize the data structure, while the k-means algorithm was applied to identify patterns of similarity between the samples. Then, PCA was applied; the first two principal components (PC1 and PC2) were used to construct biplots. PC1 refers to the principal component of greatest importance, as it explains the greatest variability in the data, followed by PC2. The k-means algorithm was then applied to the standardized data, and the obtained clusters were visualized in the biplots generated from the PCA. The number of clusters was defined empirically, based on the interpretation of the data and the explained variability.
In
Table 3, each codification (1 to 11) represents a sample composed exclusively of grains with a specific type of defect. The samples related to the defects were used to analyze the separation between the different types and to identify the natural grouping based on their multivariate characteristics. In
Table 4, each sample was coded (1 to 400) and classified into four categories (type I, type II, basic pattern, and out of type). One hundred samples of each type were analyzed, totaling 400 observations. These data were used to verify whether the types presented a defined separation in the principal components and to validate the groupings obtained by k-means. All the analyses were conducted in R software with the help of the packages “ggfortify”, “factoextra”, and “FactoMineR” [
19,
20].
2.6.2. Pearson Correlation
Pearson correlation was carried out in two stages: the correlation matrix was first created between the variables; then, a correlation network was created to facilitate the visualization of the interrelationships. The Pearson correlation matrix can assume node interval values between −1 and 1, indicating the degree of correlation and the direction of linear relationships. A value closer to 1 indicates a strong correlation between the variables, and a value closer to 0 indicates a weaker correlation [
21].
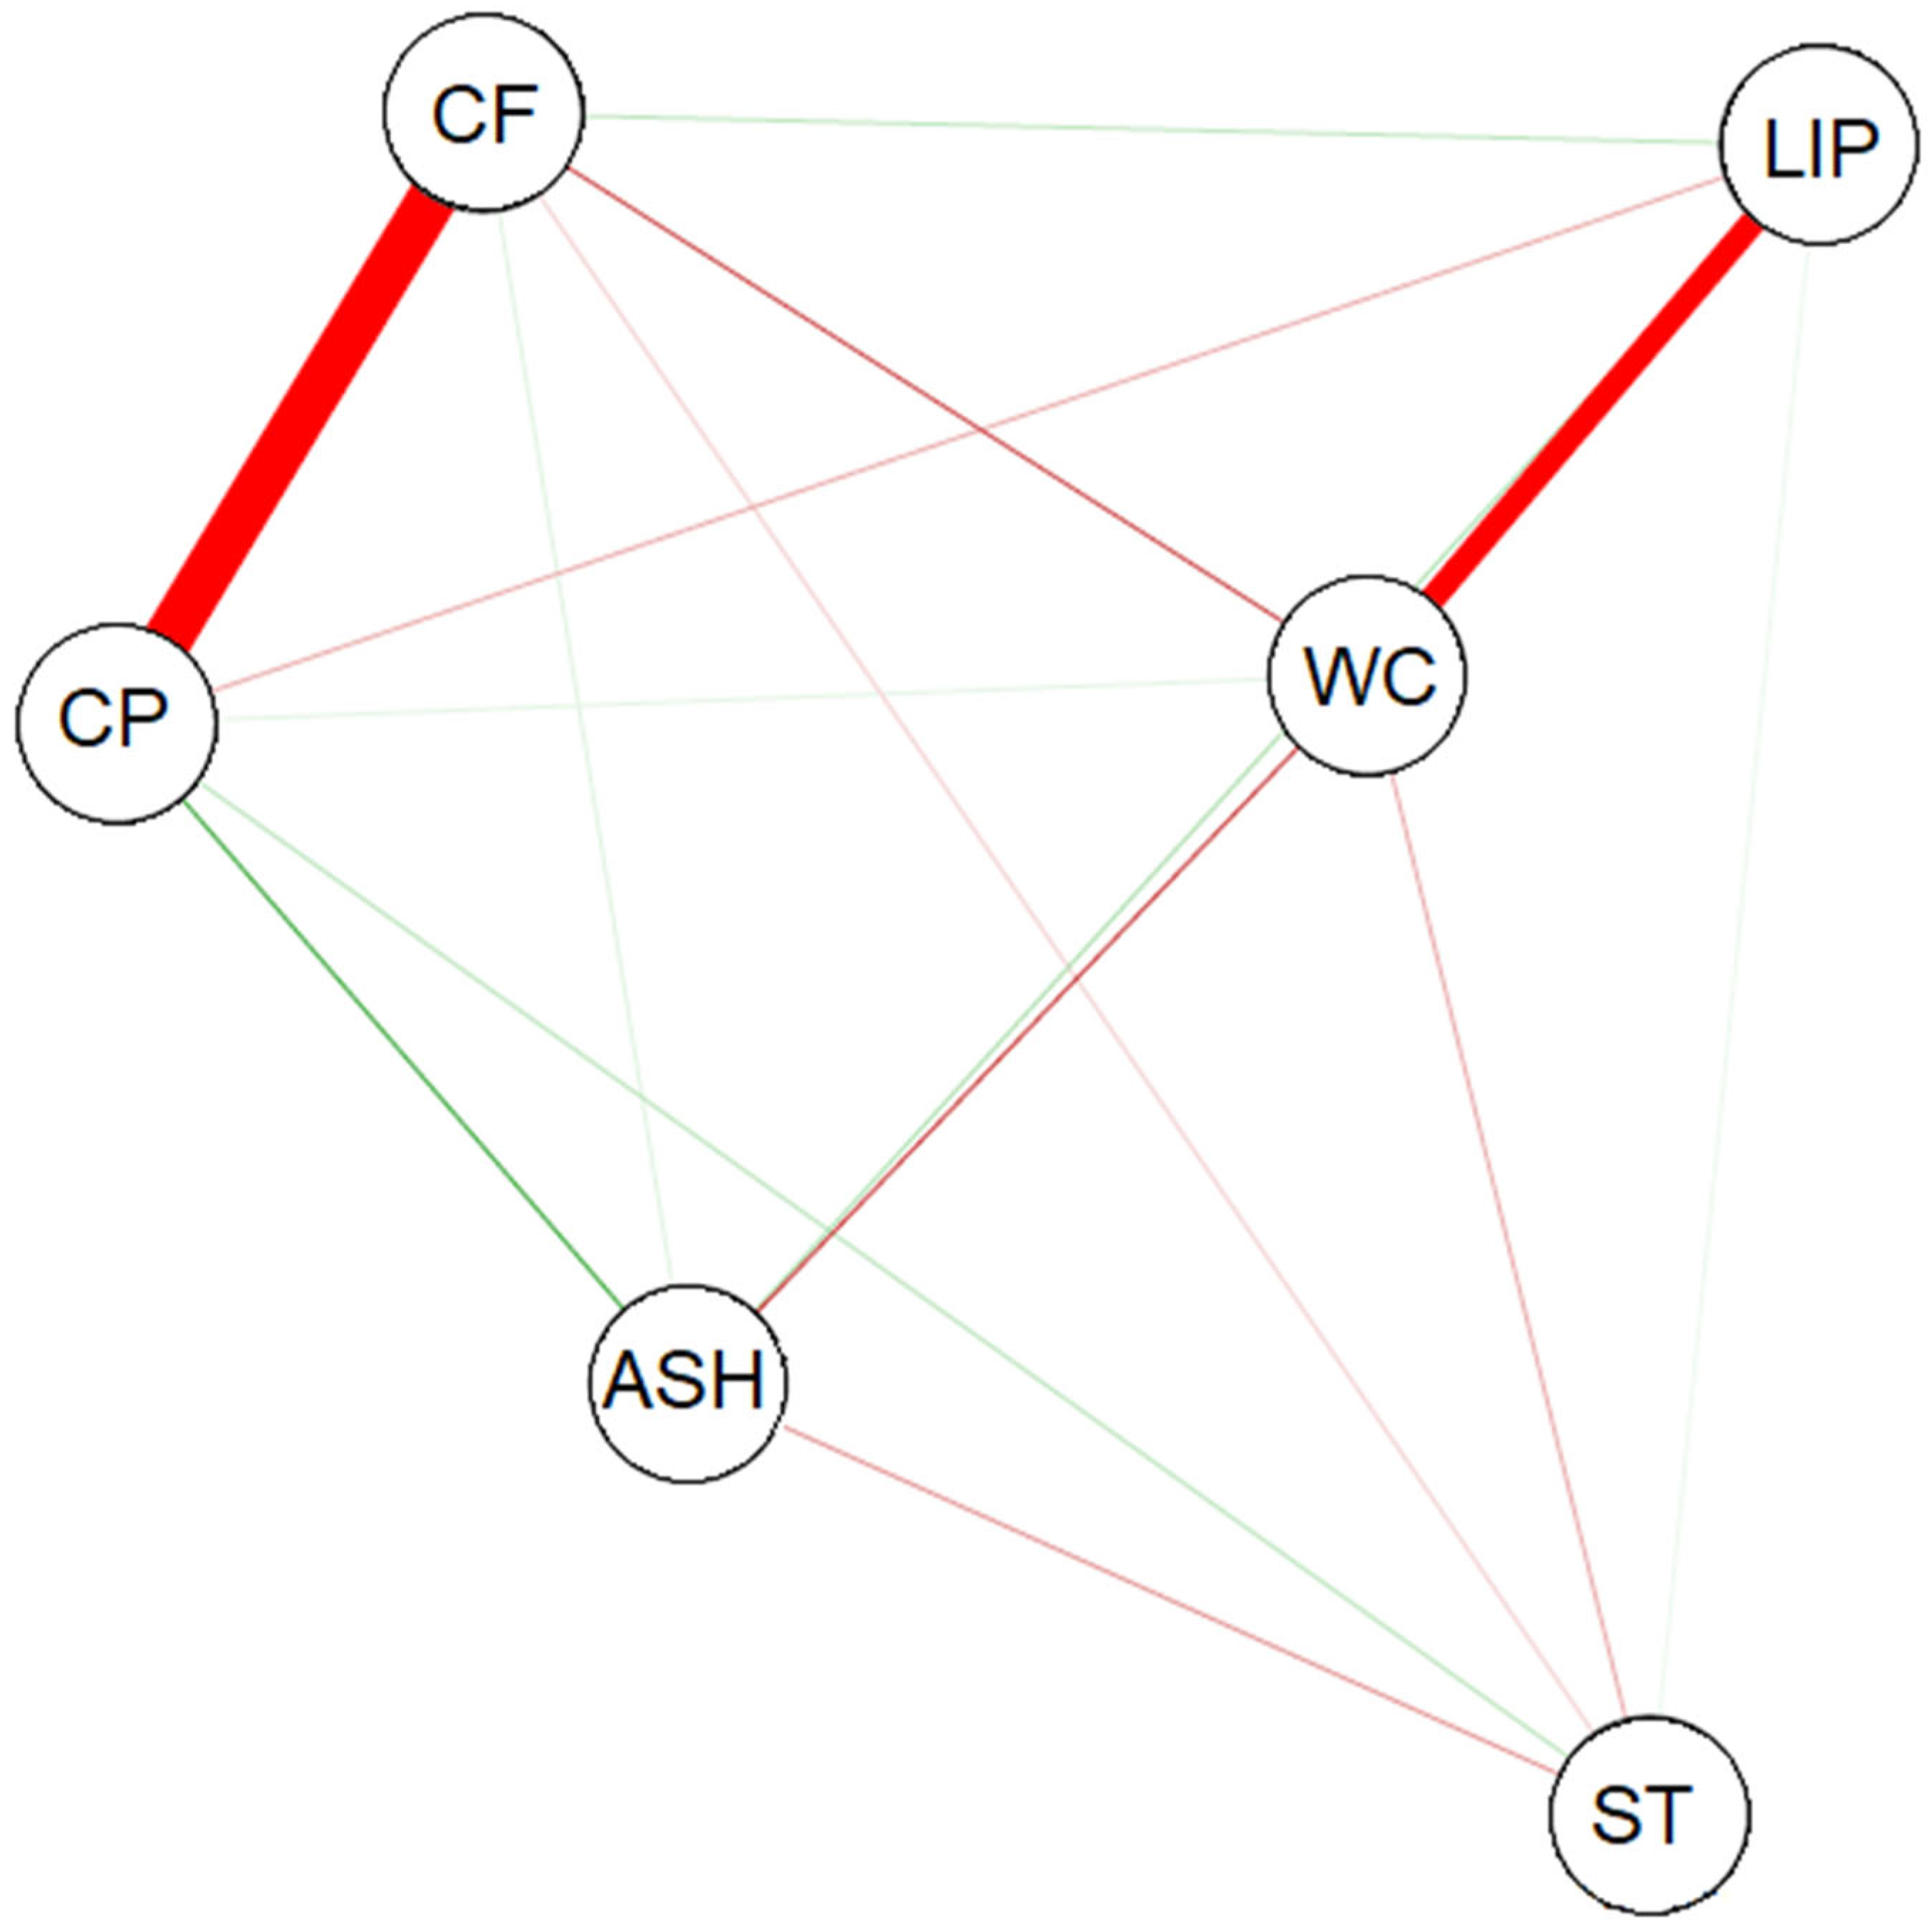
The correlation network visibly defines the intensity of the correlations between the variables analyzed. Thick red lines indicate a strong negative correlation, whereas thick green lines indicate a positive correlation. The closer the value is to the ends, the thicker the lines become. As the values move away from the ends, the lines become thinner, demonstrating a weak correlation. The analyses were performed using the Rbio software [
22].
3. Results and Discussion
The results and discussions were obtained through the physical–chemical analysis of soybean grains, considering both the different defects and the commercial classifications (type I, type II, basic standard, and out of type). The variables analyzed were the contents of water, crude protein, lipids, starch, fiber, and ash, estimated by near-infrared spectroscopy (NIR). Then, statistical analyses such as ANOVA, Scott-Knott test, principal component analysis, k-means clustering, and Pearson correlation were employed for data interpretation.
Table 5 presents the characterization results of the analyses conducted in this study. The analysis of variance (ANOVA) provided data on the variations in the physicochemical properties of soybean grains as a function of defects. Statistically significant differences (
p < 0.05) were observed for all the variables analyzed.
The coefficient of variation (CV) expresses the dispersion of data relative to the mean. A low CV indicates that the analyzed data were less dispersed around the mean, whereas a high CV indicates greater dispersion between values. In the analyzed data regarding grain defects, WC had an overall mean of 10.64% with a CV of 0.77%, demonstrating low dispersion. The overall mean for CP was 37.58%, and its CV was 0.39%, which also demonstrates low dispersion. The same was observed for LIPs, which had a 0.32% dispersion relative to the general average of 16.20%. The CF content showed low dispersion, with a CV of 2.44% and an overall average of 5.48%, similar to ASH, which presented a CV of 2.45% and an average of 6.14%. In contrast, ST demonstrated high dispersal, with a CV of 13.33% compared to the general average of 0.65%.
The mean test analyses performed on grains with defects showed a variance in the results between the defects and the physicochemical properties of soybean grains. However, despite the variation in the results, the physicochemical properties in relation to the defects maintained a similar behavior for each variable studied.
The different physical defects in soybean grains significantly influenced the centesimal composition. Germinated grains stood out with the highest crude protein content (41.40%), possibly due to the mobilization of reserves during germination, which increases enzymatic activity and protein solubility [
23]. In contrast, broken grains presented the lowest protein concentration (33.17%) and highest fiber content (13.64%), which can be explained by the exposure of the tegument to air and oxidation reactions [
24]. The water content also varied, with damaged and crushed grains showing values above 12%, probably because they have a greater capacity to absorb moisture [
25]. Broken grains, on the other hand, had the lowest water content (8.44%), due to the greater exposure of the endosperm to air, facilitating water evaporation and grain dehydration [
26]. These variations directly impact stability during storage and the final nutritional quality of the grain.
To better understand the characteristics of soybean defects, a similarity-based analysis was performed using PCA and k-means clustering. During k-means clustering (
Figure 2), the defects were grouped into three subgroups. In addition, the program renamed the analyzed data by assigning numbers to each soybean defect, where 1 referred to germinated grains, 2 to shriveled grains, 3 to sour grains, 4 to crushed grains, 5 to fermented grains, 6 to immature grains, 7 to healthy grains, 8 to broken grains, 9 to damaged grains, 10 to musty grains, and 11 to burned grains.
In group I, the defects (shriveled, burned, crushed, immature, damaged) stood out, with healthy grains having a lower impact. Group II comprised only broken grains, and in group III, germinated, fermented, moldy, and burned grains remained, with a higher ash content and protein alterations. Thus, it can be seen that the PCA transformed the original variations in the soybean grains into new axes, reducing the complexity. The first two PCs explain 66.6% of the total variation in the centesimal composition of samples with soybean defects, with PC1 and PC2 accounting for 36.5% and 30.1%, respectively. According to Oliveira et al. [
27], the sum of the first two PCAs should exceed 70%. However, the value found was sufficient to separate the defects in the soy grains for the next analyses.
In the Pearson correlation matrix (
Table 6), the interactions between the variables studied were numerically demonstrated, where each row of the matrix represents a sample of the 11 defects with the centesimal composition measured through NIR spectroscopy. The strong negative correlation between crude protein and crude fiber (r = −0.735) indicates that the increase in fiber is associated with a reduction in protein, a common effect in grains with structural damage such as cracked or moldy grains. The negative correlation between water content and lipids (r = −0.665) indicates that wetter grains tend to contain less fat, possibly due to moisture-induced lipid degradation processes. The values range from −1 to 1, indicating the intensity of the correlation between the variables. Negative correlations are shown in red, and positive correlations are shown in green (
Figure 3).
The variables analyzed for soybean grain defects were correlated (
Figure 3), which is consistent with the results shown in
Table 6. The LIPs and WC were strongly and negatively correlated with each other, as were CP and CF. The WC showed a weak negative correlation with ST, CF, and ASH. CP was negatively correlated with LIPs and positively correlated with WC, ST, and ASH. CF showed a weak negative correlation with ST and a positive correlation with LIPs and ASH.
Statistical analyses indicate that gross protein reduction was accompanied by an increase in CF, as evidenced by the pattern in the Pearson correlation coefficient network (
Figure 3), which demonstrates the inverse relationship between the variables. Ziegler et al. [
23] studied the effects of water content (12% and 15%) and storage temperature (11, 18, 25, and 35 °C) on the functional properties of soy protein for 12 months. They reported that a water content of 12% combined with storage at 25 °C and 32 °C reduced the protein solubility by 14.1% and 20.6%, respectively.
Cañizares et al. [
26] evaluated the effect of different percentages (0, 15%, 30%, and 35%) of broken grains in soybean samples stored for 12 months and concluded that the presence of 15% broken grains did not affect the quality of the sample. However, when the percentage of broken grains was 30%, the quality of the sample was negatively affected, with an increase of up to 75% in moldy grains.
NIR spectroscopy of the grain samples was performed to assess their composition and physicochemical properties. This analysis was carried out using grain integers, making it possible to quantify the CP, WC, CF, ST, LIPs, and ASH present in various types of soybean grains.
Table 7 presents the results of the analysis performed in this study. An analysis of variance provided data on the variations in the physicochemical properties of soy grains as a function of classification type. For all the parameters analyzed for classifying the soybean grains, the probability of error was lower in relation to the calculated F, indicating significant differences between the groups analyzed. Thus, NIR spectroscopy showed that the defects in the soybean grains had a considerable influence on their physicochemical composition.
The coefficients of variation presented similar values between 1.19% and 5.71%. The general averages of the variables studied were 35.39% for CP, 16.79% for LIPs, 11.32% for WC, 5.24% for CF, 4.93% for ASH, and 1.07% for ST.
When a soy grain sample containing the maximum allowed defects was analyzed, a significant variation was observed in its physicochemical properties based on the type of soy grain (
Table 7). The WC ranged between 11.08% and 11.54%, with type I and outside-of-type samples demonstrating the best values. Basic standard samples showed the highest CP content of 35.88%. Additionally, basic standard and out-of-type samples demonstrated high LIP contents of 16.89% and 17.02%, respectively. Type II showed better results for ST and CF contents. The ASH content varied between 4.91% and 4.95%, with higher values observed in type I, type II, and out-of-type samples.
The samples were classified according to their similarities using PCA and k-means clustering. To facilitate the understanding of the data, k-means clusters (
Figure 4) were divided into four large groups: type I (1–100), type II (101–200), basic standard (201–300), and out of type (301–400). Group I contained 130 samples, group II contained 61 samples, group 3 contained 65 samples, and group 4 contained 144 samples, totaling 400 soybean grain samples. The first two PCs accounted for 52.2% of the total variation in the centesimal composition of the samples, with PC1 accounting for 29.5% and PC2 accounting for 22.7%.
The Pearson correlation matrix shown in
Table 8 was constructed based on 400 observations corresponding to the samples of soybean grains classified between types I, II, basic standard, and out of type. The columns of the matrix used six physical–chemical variables (ASH, WC, ST, CP, CF, LIPs). The correlation between the studied variables, referring to the types of classification of the soybean grain, is numerically demonstrated in the table.
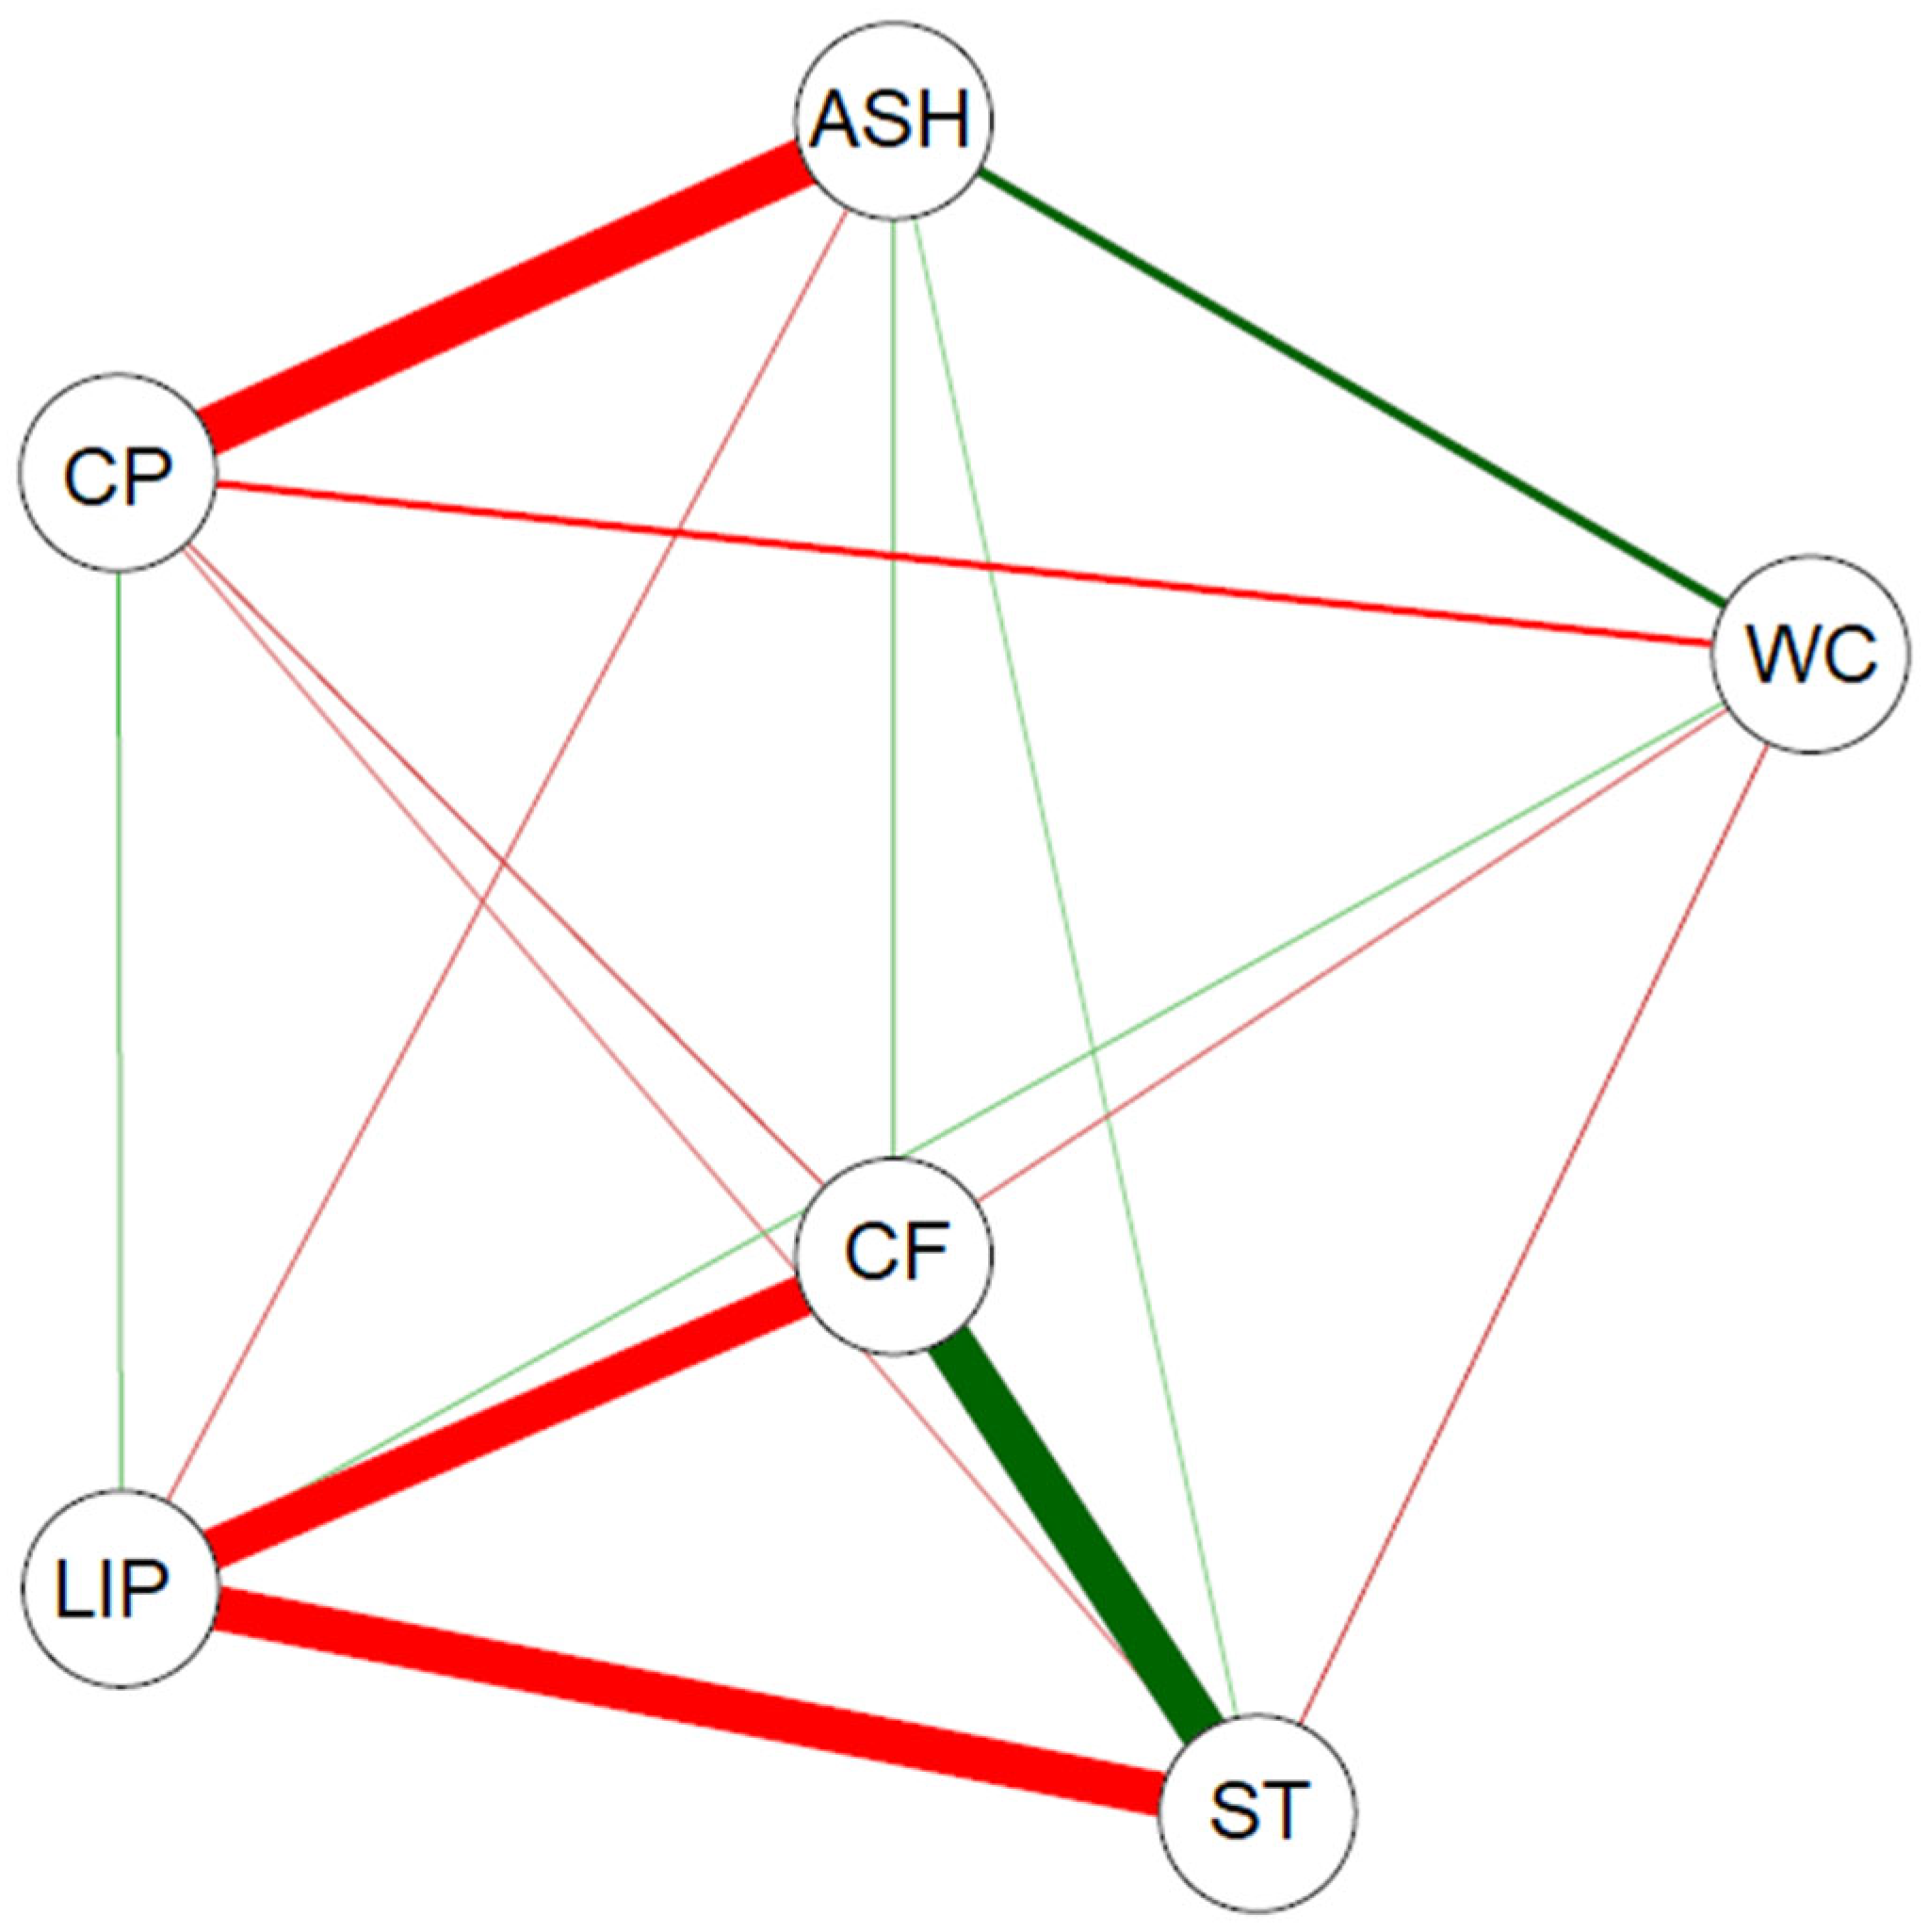
The variables analyzed for the types of soybean samples were correlated (
Figure 5), consistent with the results shown in
Table 8. CP showed a strong negative correlation with ASH (r = −0.9953), indicating that ash accumulation is indicative of protein degradation in lower-quality types [
23]; weak negative correlations with WC, CF, and ST; and a weak positive correlation with LIPs. LIPs demonstrated a strong negative correlation with CF (r = −0.931) and ST (r = −0.955) indicating that grains with a higher energy content (lipids) tend to have fewer structural and digestive carbohydrates [
6,
28]. In addition, LIPs demonstrated a weak negative correlation with ASH and a positive correlation with WC. ST and CF showed a strong positive correlation. ST showed weak negative and weak positive correlations with ASH and WC, respectively. CF showed a weak negative correlation with WC and a weak positive correlation with ASH.
The correlation network demonstrated a high negative correlation between CP and ASH, LIPs and ST, and LIPs and CF. In contrast, CP showed a strong positive correlation with ST. In addition, CP showed a weak negative correlation with WC, while ASH showed a weak positive correlation with WC. Ziegler et al. [
28] and Coradi et al. [
29] observed an increase in the ASH contents of soybeans stored with water contents of 9%, 12%, 15%, and 18% at 11, 18, 25, and 32 °C for 12 months. After storage at 32 °C, the ASH content increased from 5.1% to 6.1%. The authors attributed these changes to inadequate storage practices, because, after 12 months of storage at 32 °C, the ash content increased, and the protein and lipid contents decreased. These conditions facilitate fermentation and lead to the degradation of compounds, which also contributes to the increase in ash content.
Different types of soybean grains were compared in terms of quality, and the parameters analyzed (CP, ASH, WC, CF, ST, and LIPs) showed similarities without significant variation. The same was observed for defects.


