Article

Smart Edge Computing Framework for Real-Time Brinjal Harvest Decision Optimization

by
T. Tamilarasi
1,*,
P. Muthulakshmi
1 and
Seyed-Hassan Miraei Ashtiani
2,*
1
Department of Computer Science, Faculty of Science and Humanities, SRM Institute of Science and Technology, Kattankulathur 603203, India
2
Faculty of Agriculture, Dalhousie University, Truro, NS B2N 5E3, Canada
*
Authors to whom correspondence should be addressed.
AgriEngineering 2025, 7(6), 196; https://doi.org/10.3390/agriengineering7060196
Submission received: 20 May 2025 / Revised: 9 June 2025 / Accepted: 13 June 2025 / Published: 18 June 2025

Abstract

:
Modernizing and mechanizing agriculture are vital to increasing productivity and meeting the growing global food demand. Timely harvesting decisions, traditionally based on farmers’ experience, are crucial for crop management. This study introduces the Brinjal Harvesting Decision System (BHDS), an automated, real-time framework designed to optimize harvesting decisions using a portable, low-power edge computing device. Unlike conventional object detection models, which require substantial pre-training and curated datasets, the BHDS integrates automated data acquisition and dynamic image quality assessment, enabling effective operation with minimal data input. Tested on diverse farm layouts, the BHDS achieved 95.53% accuracy in data collection and captured quality images within an average of 3 s, reducing both time and energy for dataset creation. The brinjal detection algorithm employs pixel-based methods, including background elimination, K-means clustering, and symmetry testing for precise identification. Implemented on a portable edge device and tested in actual farmland, the system demonstrated 79% segmentation accuracy, 87.48% detection precision, and an F1-score of 87.53%, with an average detection time of 3.5 s. The prediction algorithm identifies ready-to-harvest brinjals with 89.80% accuracy in just 0.029 s. Moreover, the system’s low energy consumption, operating for over 7 h on a 10,000 mAh power bank, demonstrates its practicality for agricultural edge applications. The BHDS provides an efficient, cost-effective solution for automating harvesting decisions, minimizing manual data processing, reducing computational overhead, and maintaining high precision and operational efficiency.

Graphical Abstract

1. Introduction

Brinjal (Solanum melongena L.), commonly known as eggplant, is a staple in Indian agriculture and cuisine, with India producing approximately 12 million metric tons of brinjal annually, accounting for about 27% of global production. Despite this significant output, brinjal production in India has remained relatively stable from 2015 to 2023 [1] due to obstacles such as high farming costs, climate change, and labor shortages. To address these issues, the agriculture sector must embrace modernization and mechanization. Modernization, often synonymous with precision agriculture, aims to enhance both the quality and quantity of agricultural products, while mechanization reduces labor costs and positively impacts income [2]. Consequently, researchers are increasingly focusing on these advancements. In horticulture, the adoption of mechanization, particularly robotics, is progressing slowly, especially in the harvesting of fruits and vegetables [3,4]. The complexity of distinguishing objects from cluttered backgrounds complicates the accurate prediction of vegetable and fruit maturity [5]. Therefore, automatic harvesting systems rely heavily on vision systems for object recognition, segmentation, and detection as part of the modernization process [6,7,8].
Image processing techniques are crucial in the initial stages of agricultural modernization, as they enable the accurate recognition and segmentation of products from their backgrounds [9]. Techniques such as median filtering, erosion operations, and area thresholding, combined with pixel discrimination based on spectral bands, achieved a detection rate of 70–85% for green citrus in hyperspectral images across various citrus varieties [10]. The HSV (Hue, Saturation, Value) color space and watershed segmentation method detected ripe tomatoes with an accuracy of 81.6% [11]. However, these methods often fall short in real-world harvesting applications due to their sensitivity to variations in lighting, occlusion of fruits by foliage, and the diverse and complex nature of agricultural environments. Recently, the integration of computer vision (CV) with artificial intelligence (AI) in precision farming has shown promising results. Faster Region-based Convolutional Neural Network (R-CNN) achieved a detection accuracy of 92.71% for passion fruit [12] and an average precision of 88.12% for apples [13] from curated datasets. RGB-Depth feature fusion with the Mask R-CNN method recorded an average precision of 95.2% in detecting mature pomegranates [14]. Unlike two-stage object detection approaches such as R-CNN, the You Only Look Once (YOLO) model treats object detection as a single regression problem. The Darknet-based YOLOv3 and YOLOv4 models successfully detected kiwifruit, with YOLOv4 achieving a mean Average Precision (mAP) of 91.9% on a GPU [15]. Improved versions such as YOLOv5 [16,17], YOLOv7 [18,19], and YOLOv8 [20] were used to detect mature tomatoes with acceptable accuracy for real-time harvesting environments. However, these models often require significant computational resources. To address this, researchers have started to focus on lightweight models that can function efficiently in resource-limited settings. In a study by [4], a lightweight YOLOv5 model was proposed, which replaced the backbone DarkNet with MobileNetV3 for the real-world tomato detection in a CPU environment. This model achieved a mAP of 96.9% with a detection speed of 42.5 ms on a mobile device. This model was trained on an NVIDIA V100 16 GB GPU, while detection was performed on a CPU. Additionally, a compressed YOLOx-based deep learning model successfully detected litchi with an average precision of 94.9% on an NVIDIA Jetson Nano, providing a more cost-effective solution [5]. This model was trained on an NVIDIA RTX 3070 8 GB GPU. Despite the practicality of models designed for efficient target detection, the high-accuracy deep learning models heavily depend on GPUs or TPUs during the training period and suffer from high power consumption and costs.
To the best of the authors’ knowledge, research on precision farming for brinjal is limited. Hayashi et al. [21] developed a method to detect purple brinjals in the RGB color space by eliminating the background and leaves. The background was removed by subtracting the green channel from the red channel (R-G), while leaves were eliminated by subtracting the blue channel from the green channel (G-B). Furthermore, to avoid the misclassification of the leaves or stems as brinjals, the vertical division operations were performed using two predetermined templates. The vision algorithm proposed by Hayashi et al. [21], tested on a harvesting robot, achieved a 62.5% harvesting rate and took 64.1 s per brinjal [22]. Chong et al. [23] designed a mobile brinjal grading robot vision system that detected brinjals based on the contour area from binary images. The largest contour was considered a brinjal, and morphological operations were performed to segment it. Jian [24] further refined this approach by segmenting brinjals from gray images using a subtraction operation between the G-B channels. The robot’s end effector then grabbed the brinjal based on the contour grab point. Miraei Ashtiani et al. [25] analyzed the mechanical properties of brinjals and recommended an enhanced end effector design to reduce damage during robotic harvesting. More recently, Kahya et al. [3] trained the YOLOv5 family of deep learning models to detect brinjals using a dataset labeled in the Roboflow software (Version 3.0). Among the nano, small, medium, and large models, YOLOv5m was the most successful, achieving a detection precision of 95.65%. Unlike many fruits that indicate ripeness through color, brinjal maturity is primarily determined by size. Workers typically estimate brinjal maturity empirically, considering growth patterns, market trends, and varietal characteristics [22,26]. Traditional agricultural machinery struggles with such nuanced assessments, leading to the development of harvesting robots that can pick brinjal without predicting maturity [23,24]. Machine vision algorithms have begun to bridge this gap by detecting brinjal maturity through pixel clustering, region merging, and spatial features. Tamilarasi and Muthulakshmi [26] reported a statistical method executed on a cloud platform that achieved 96% accuracy in predicting ready-to-harvest brinjals.
While such results are promising, the performance of CV models heavily depends on high-quality training and testing datasets [27,28]. Creating an optimal dataset for image processing is often time-consuming and labor-intensive. For instance, Wakchaure et al. [29] collected 2275 images but ultimately used only 455 for classification, demonstrating the significant effort required to develop a perfect dataset. To address these difficulties and improve efficiency, this study presents the Brinjal Harvesting Decision System (BHDS). This system aims to streamline data collection issues, achieve high accuracy with a limited dataset, reduce the computational resources needed for brinjal detection, enable instant data collection for empirical size estimation, and conduct maturity prediction to determine market-ready brinjals using edge devices. The BHDS delivers a vision model tailored for harvesting robots and is designed to address the limitations of conventional data collection and maturity assessment methods. A handheld prototype was developed to predict partially mature brinjals in real time, enabling prompt and accurate harvesting decisions. To improve image quality and minimize preprocessing requirements, a specialized module was designed to capture clear, non-blurry images even in complex field environments. The system also incorporates ultrasonic and Light Emitting Diode (LED) sensors to guide data collectors, ensuring that images are captured at optimal distances. Additionally, an automated module was implemented to collect valid training datasets without human intervention, significantly enhancing data reliability and reducing labor input. Finally, the model was successfully integrated into a Raspberry Pi 4, demonstrating its feasibility for use in low-cost, energy-efficient harvesting robots.

2. Materials and Methods
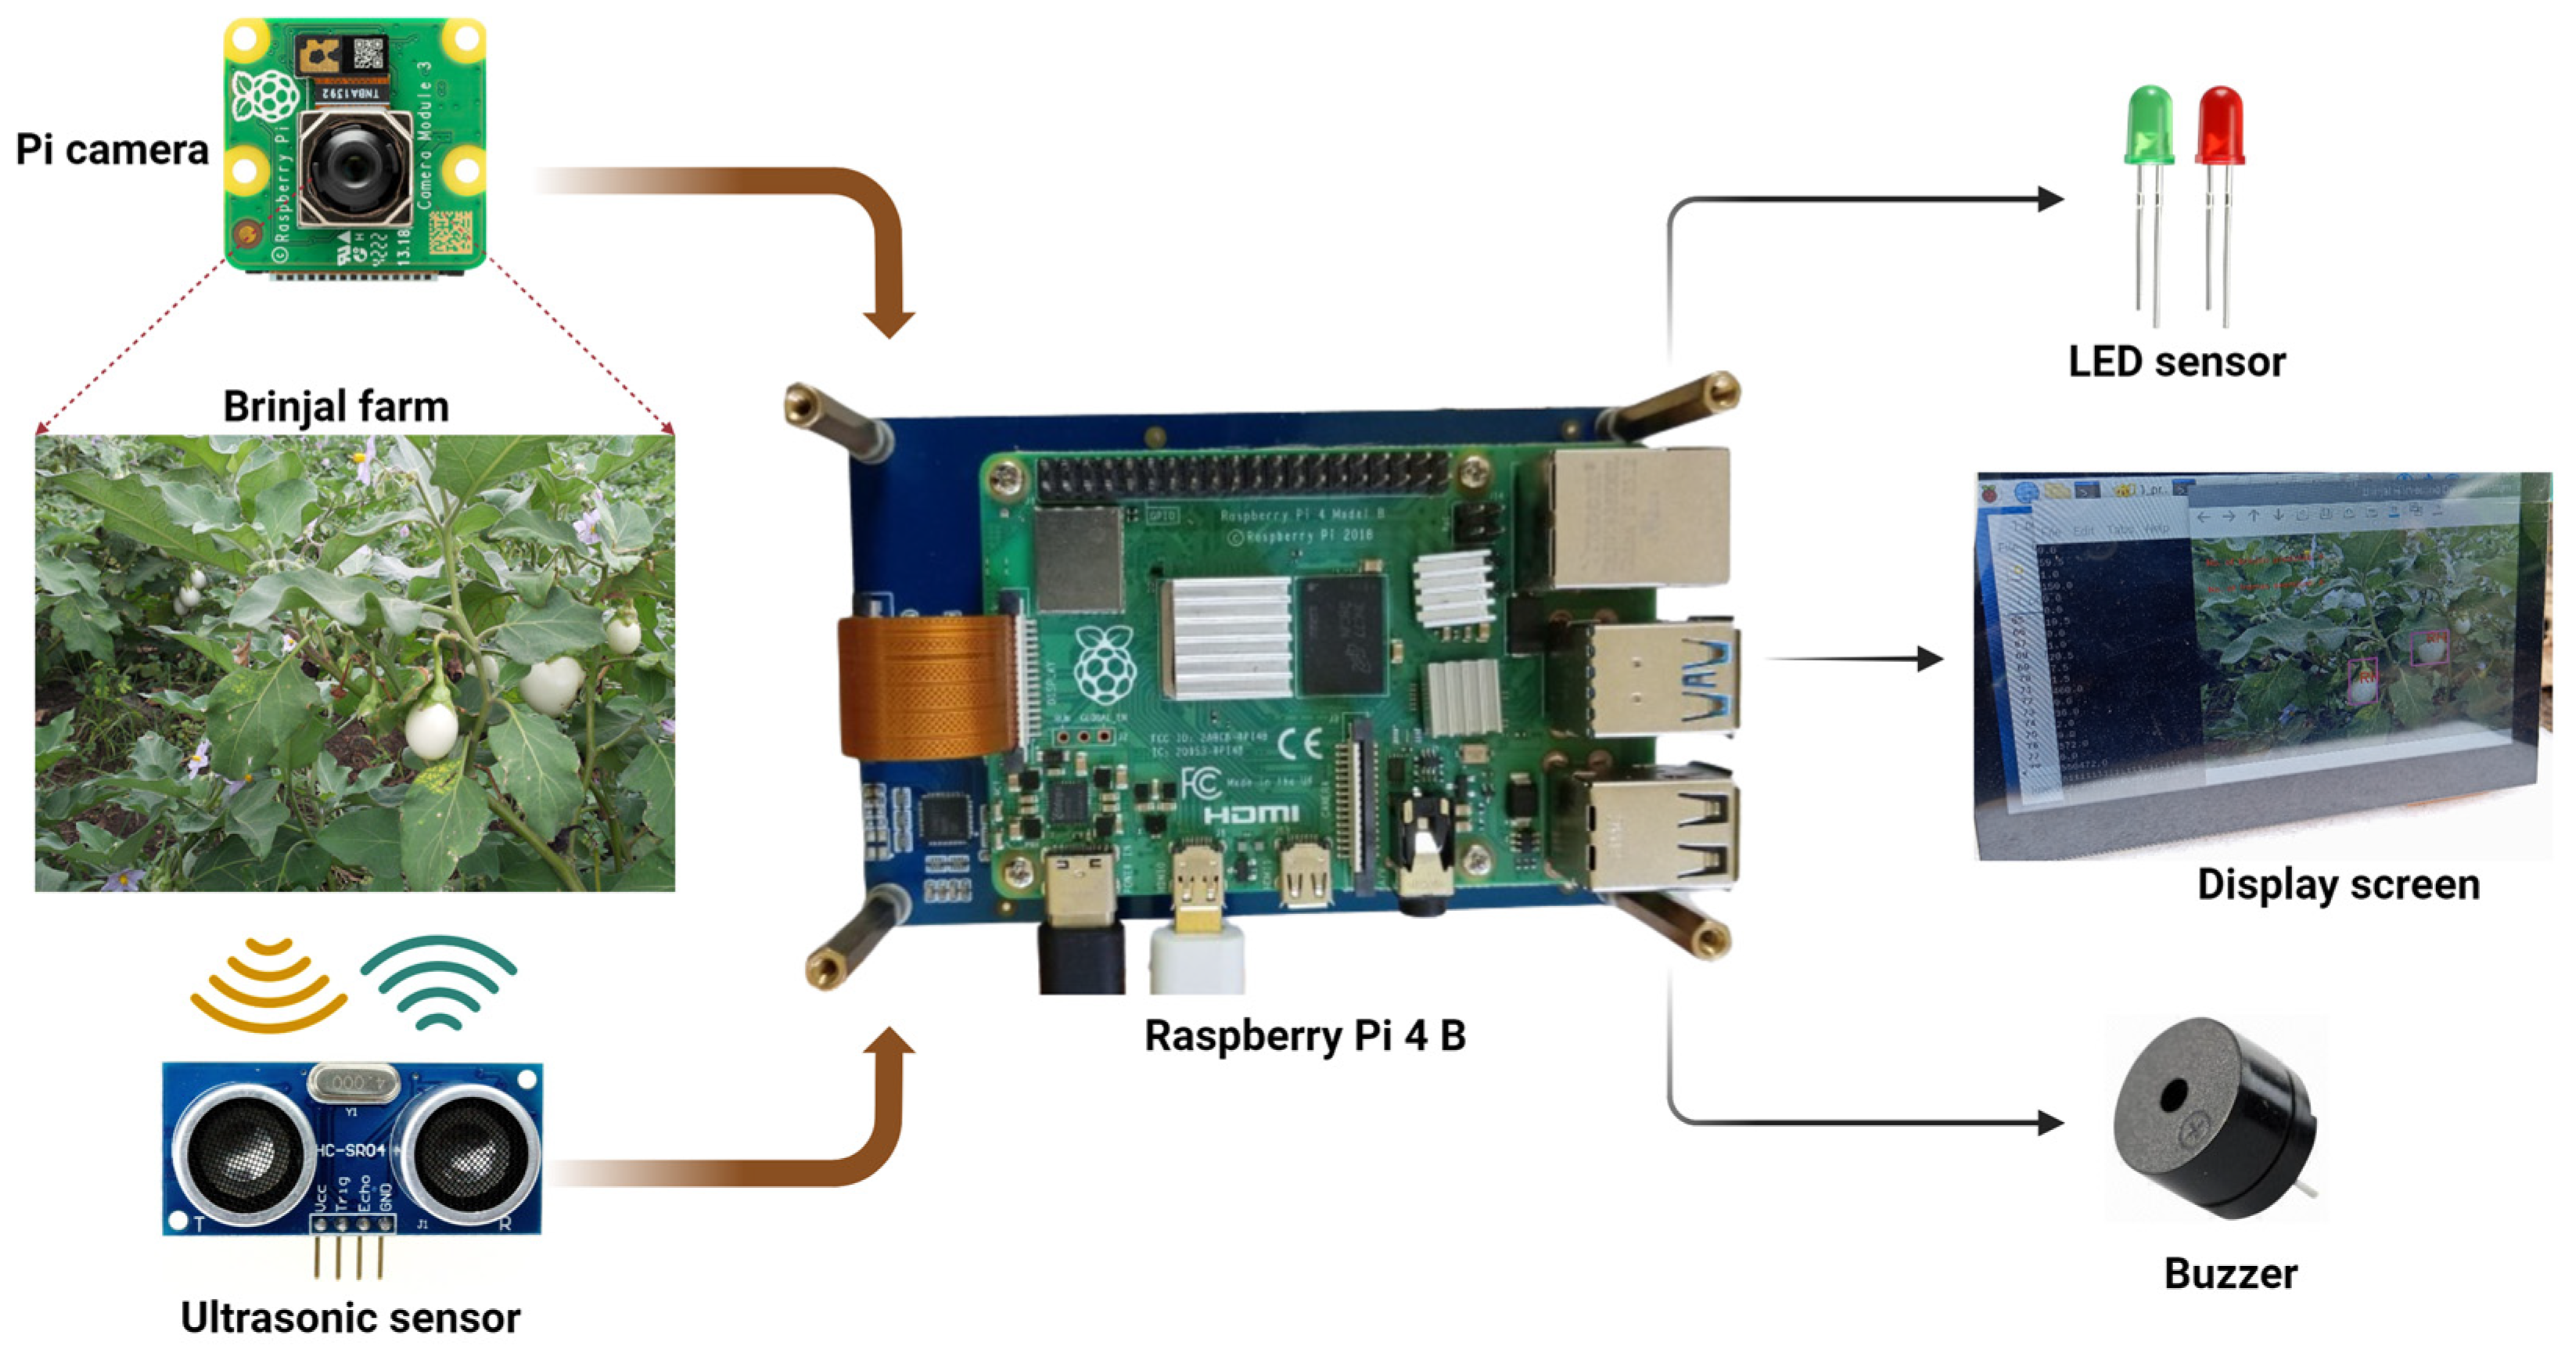
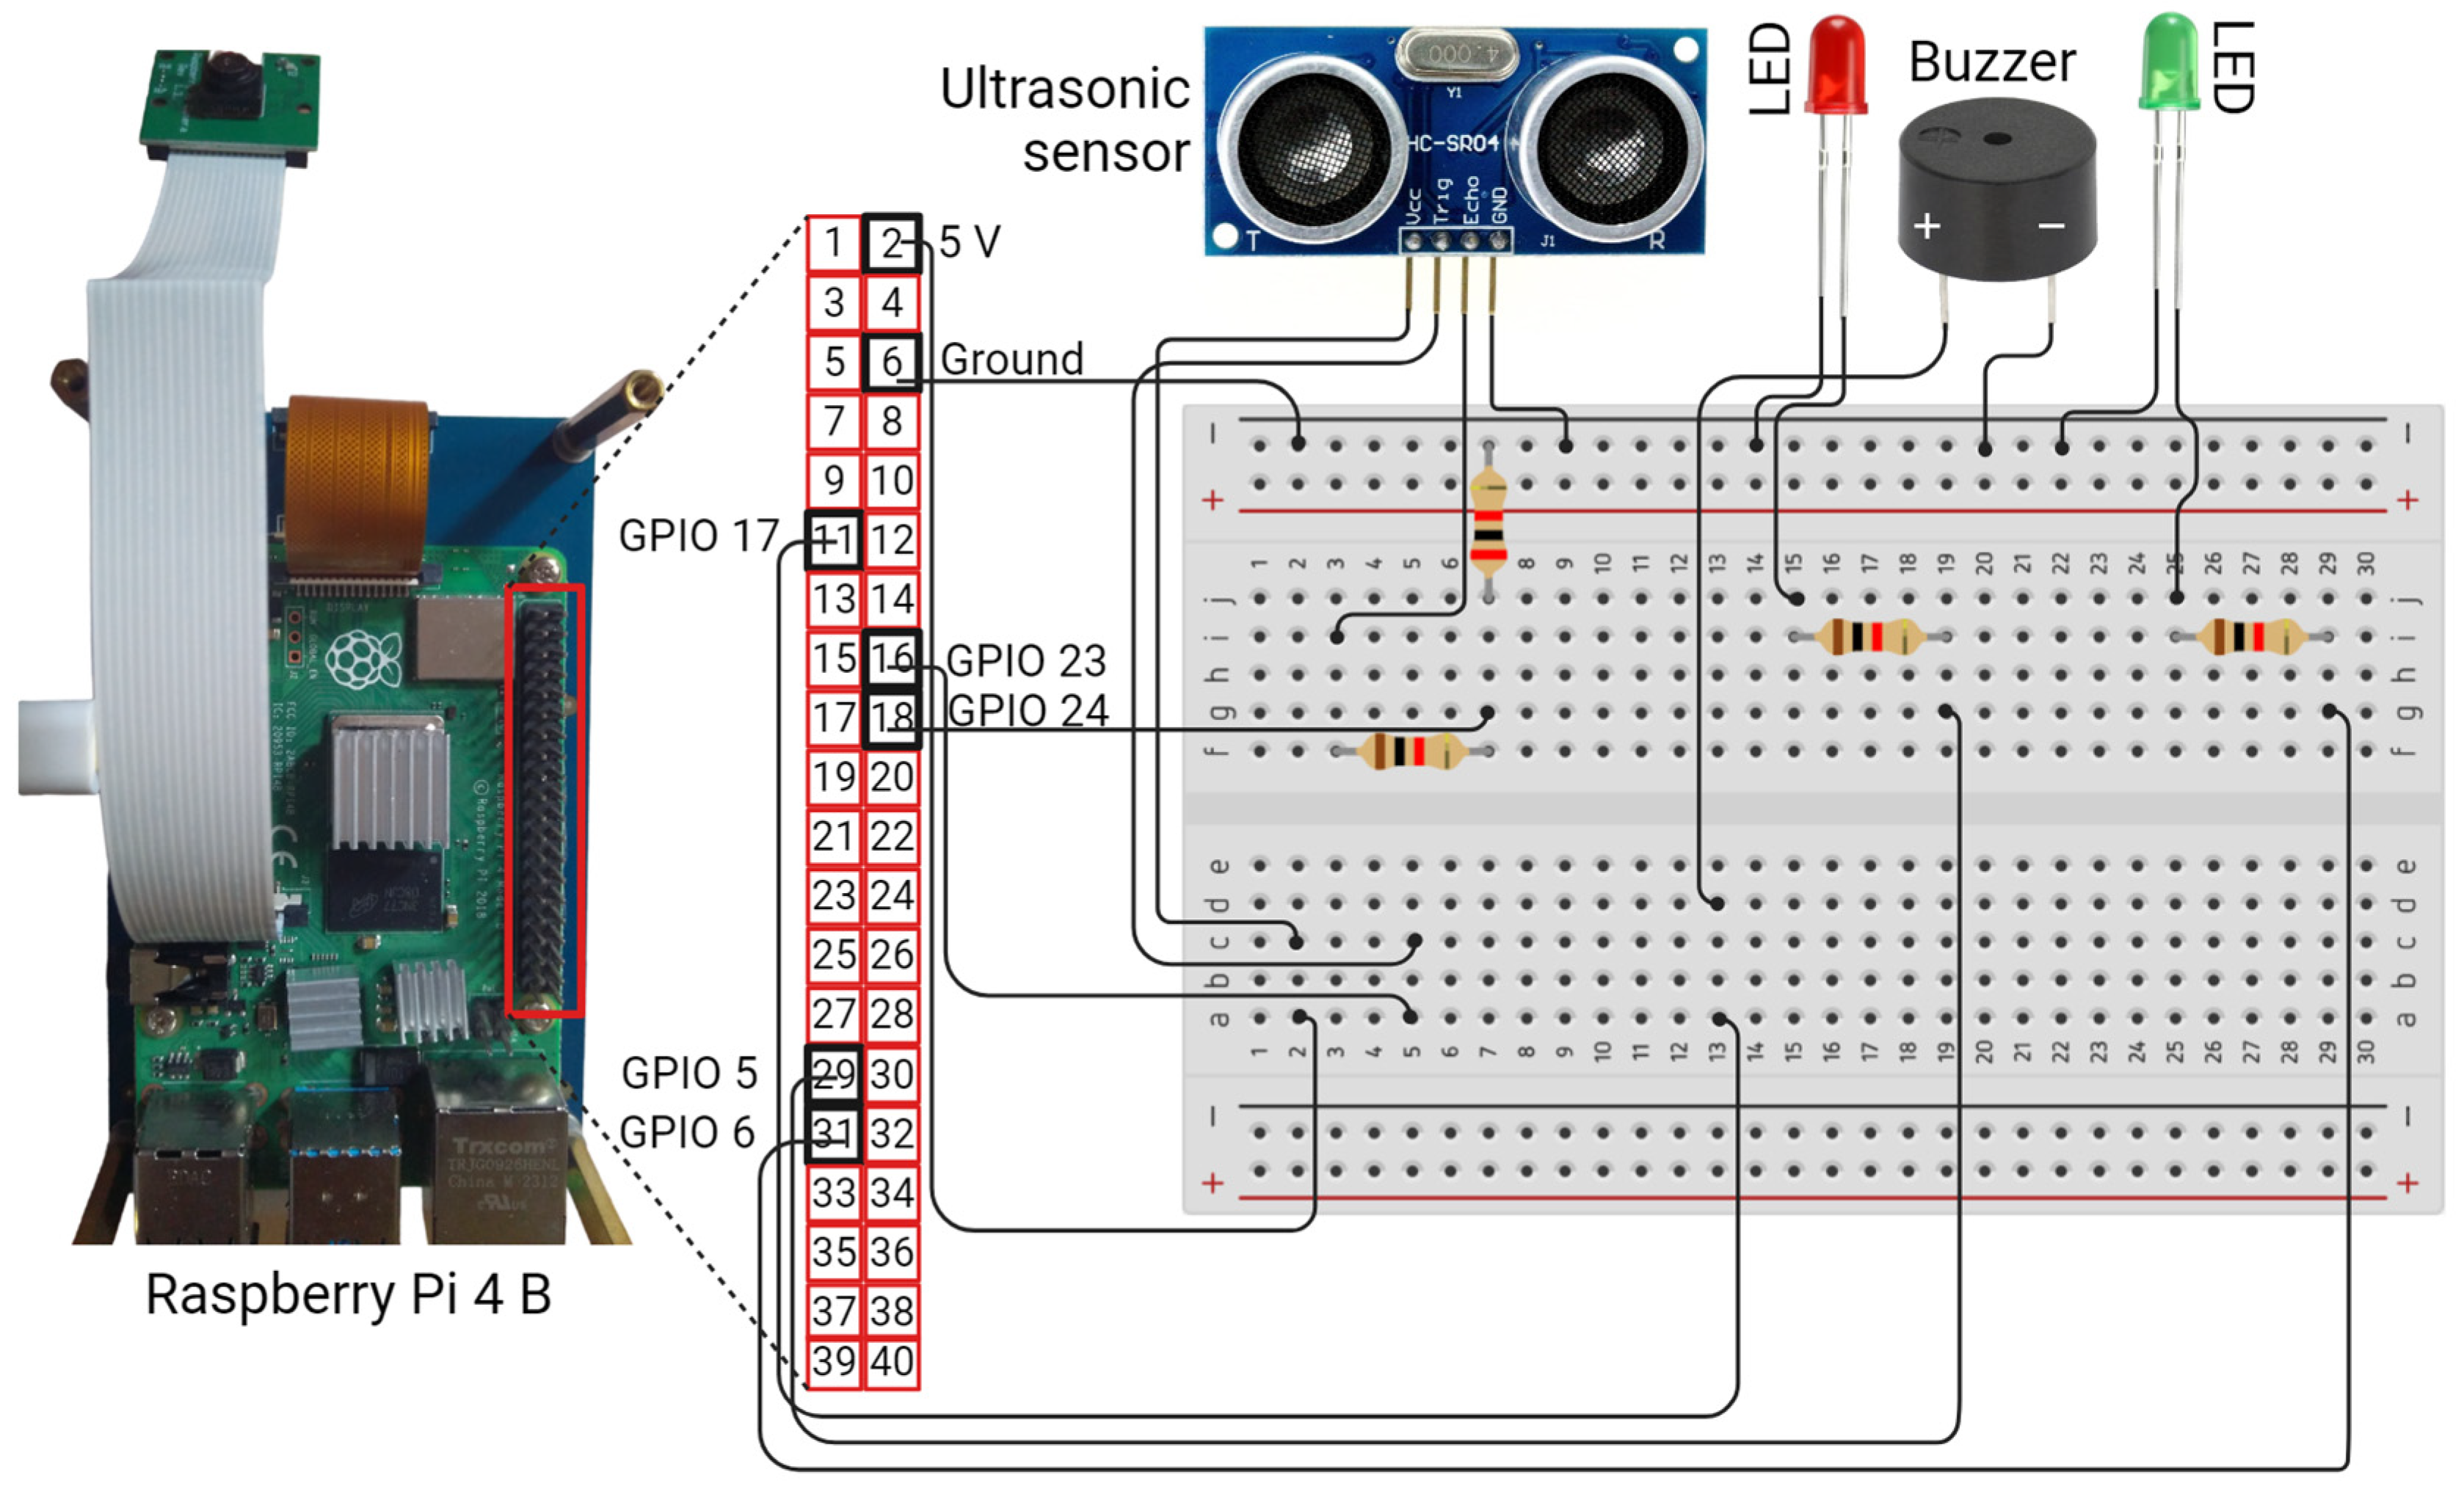
The objective of this study is to test the performance of the proposed BHDS in a brinjal farm located in Tenkasi District, Tamil Nadu, India. This section explains the behavior of the automated machine vision prototype, image acquisition, machine training, and decision-making capability of the BHDS. Figure 1 illustrates the overall framework of the proposed handheld system.

2.1. BHDS Prototype

The BHDS prototype comprises an edge computing device (the Raspberry Pi 4 B, Raspberry Pi Ltd., Cambridge, UK), an image-capturing device (a Pi camera, Raspberry Pi Ltd., UK), a distance-measuring sensor (an ultrasonic sensor (model HC-SR04), Sound Land Corp., Taoyuan, Taiwan), two LEDs (Everlight Electronics, New Taipei, Taiwan), a buzzer (Bombay Electronics, Mumbai, India), and a display screen (Waveshare Electronics, Shenzhen, China). To illustrate the system’s operational sequence, Figure 2 provides a flow chart of the BHDS prototype. It outlines the logical steps from component initialization and distance measurement to image capture, object detection, readiness classification, and output display.
The Raspberry Pi 4 B is a compact onboard computer whose processing power is used to detect and predict brinjal readiness using CV technology. A Pi 3 camera with a 12MP Sony IMX708 sensor digitalizes the farm environment. The HC-SR04 ultrasonic sensor quantifies the distance between the camera and various on-farm items, including the leaves, the stems, and brinjals. The LEDs help capture perfect images at the correct distance, while the buzzer signals when a perfect image is captured. Brinjals ready for harvest are identified using bounding boxes and displayed on the screen. The display also shows the total number of images examined, detected brinjals, and brinjals ready for harvest. Figure 3 depicts the pinout diagram of the hardware configuration.

2.2. Automated Image Acquisition

The efficacy of the vision-based prediction or classification model depends on the quantity and quality of the training and testing datasets [27,28]. Dataset creation is a laborious procedure that starts with data collection. Even when a substantial volume of data is gathered, assessing image quality can be time-consuming. To minimize human involvement in data gathering, the proposed prototype automates high-quality image acquisition from the farm. The effectiveness of the proposed automation technique depends on two crucial factors: (i) the distance between the camera and an object and (ii) the focus measure of the image (capturing a non-blurry image). Section 2.2.1 and Section 2.2.2 explain the computation of these two factors to obtain high-quality images.

2.2.1. Determination of Distance

The brinjal’s size indicates its readiness for harvest. The distance between an object and the camera affects the size of the components in the captured image. Therefore, capturing images within a specific distance range is essential. The HC-SR04 ultrasonic sensor affixed to the BHDS estimates the distance between the object and the camera, similar to the echolocation behavior of bats and dolphins. The HC-SR04 sensor module consists of a transmitter, a receiver, and a control circuit. The transmitter emits sound at 40,000 Hz, which bounces back when it encounters an object. The distance is calculated using the time taken for the sound to travel to the object and back. This is recorded by utilizing the trigger and echo pin values of the sensor. The HC-SR04 sensor measures distances ranging between 2 cm and 4 m. The proposed method uses a range between 30 cm and 50 cm to capture images. This distance is ensured by the sensor’s echo pin’s stability in the HIGH position. The distance is calculated using Equation (1).
D = (v × t)/2
where v is the speed of sound in air (m/s), and t is the time taken for the signal to travel to the object and back (s). When the distance between the camera and the object is between 30 cm and 50 cm, image recording begins. If the distance is less than 30 cm, then the red LED turns on, indicating the camera is too close. If the distance is greater than 50 cm, then the green LED turns on, indicating the camera is too far. This cue helps capture images at the correct distance.

2.2.2. Computation of Focus Measure

The image acquisition module influences the robot vision’s performance [30]. The natural ecosystem of farmland, impacted by wind and sunlight, affects image quality. Despite the autofocus and lens management mechanisms in most advanced cameras, contrast detection cameras still struggle with collecting high-quality images. Therefore, this study emphasizes acquiring good-quality images through a focus measure operator. The performance of several focus-measuring operators is assessed [31], and the Laplacian operator, a simple and straightforward second-order derivative, is chosen for quantifying edges in the image. Images were collected over time, and their focus measures were calculated. The average focus measure is considered the threshold ‘fm’. Algorithm 1 indicates the focus measure threshold calculation.
Algorithm 1. Focus measure threshold calculation
Input: Video frames from the Pi camera
Output: Threshold value ‘fm’
Steps:
    1. Initialize focus_measure = 0;
    2. For i = 1 to 25:
    3.       If (time elapsed = 10 s) and (30 cm <= distance between object and camera <= 50 cm);
    4.             Image = current frame;
    5.                focus_measure= focus_measure + Laplacian(image);
    6.        End If;
    7. fm = focus_measure/25;
    8. End For;
    9. Return fm.

2.2.3. Good-Quality Image Acquisition

Good-quality images are collected based on the following criteria: (i) the distance between the camera and object, and (ii) focus measure. The quality of the image is validated based on the threshold value (‘fm’) obtained using the focus measures of images captured when the distance between the camera and object is between 30 and 50 cm.

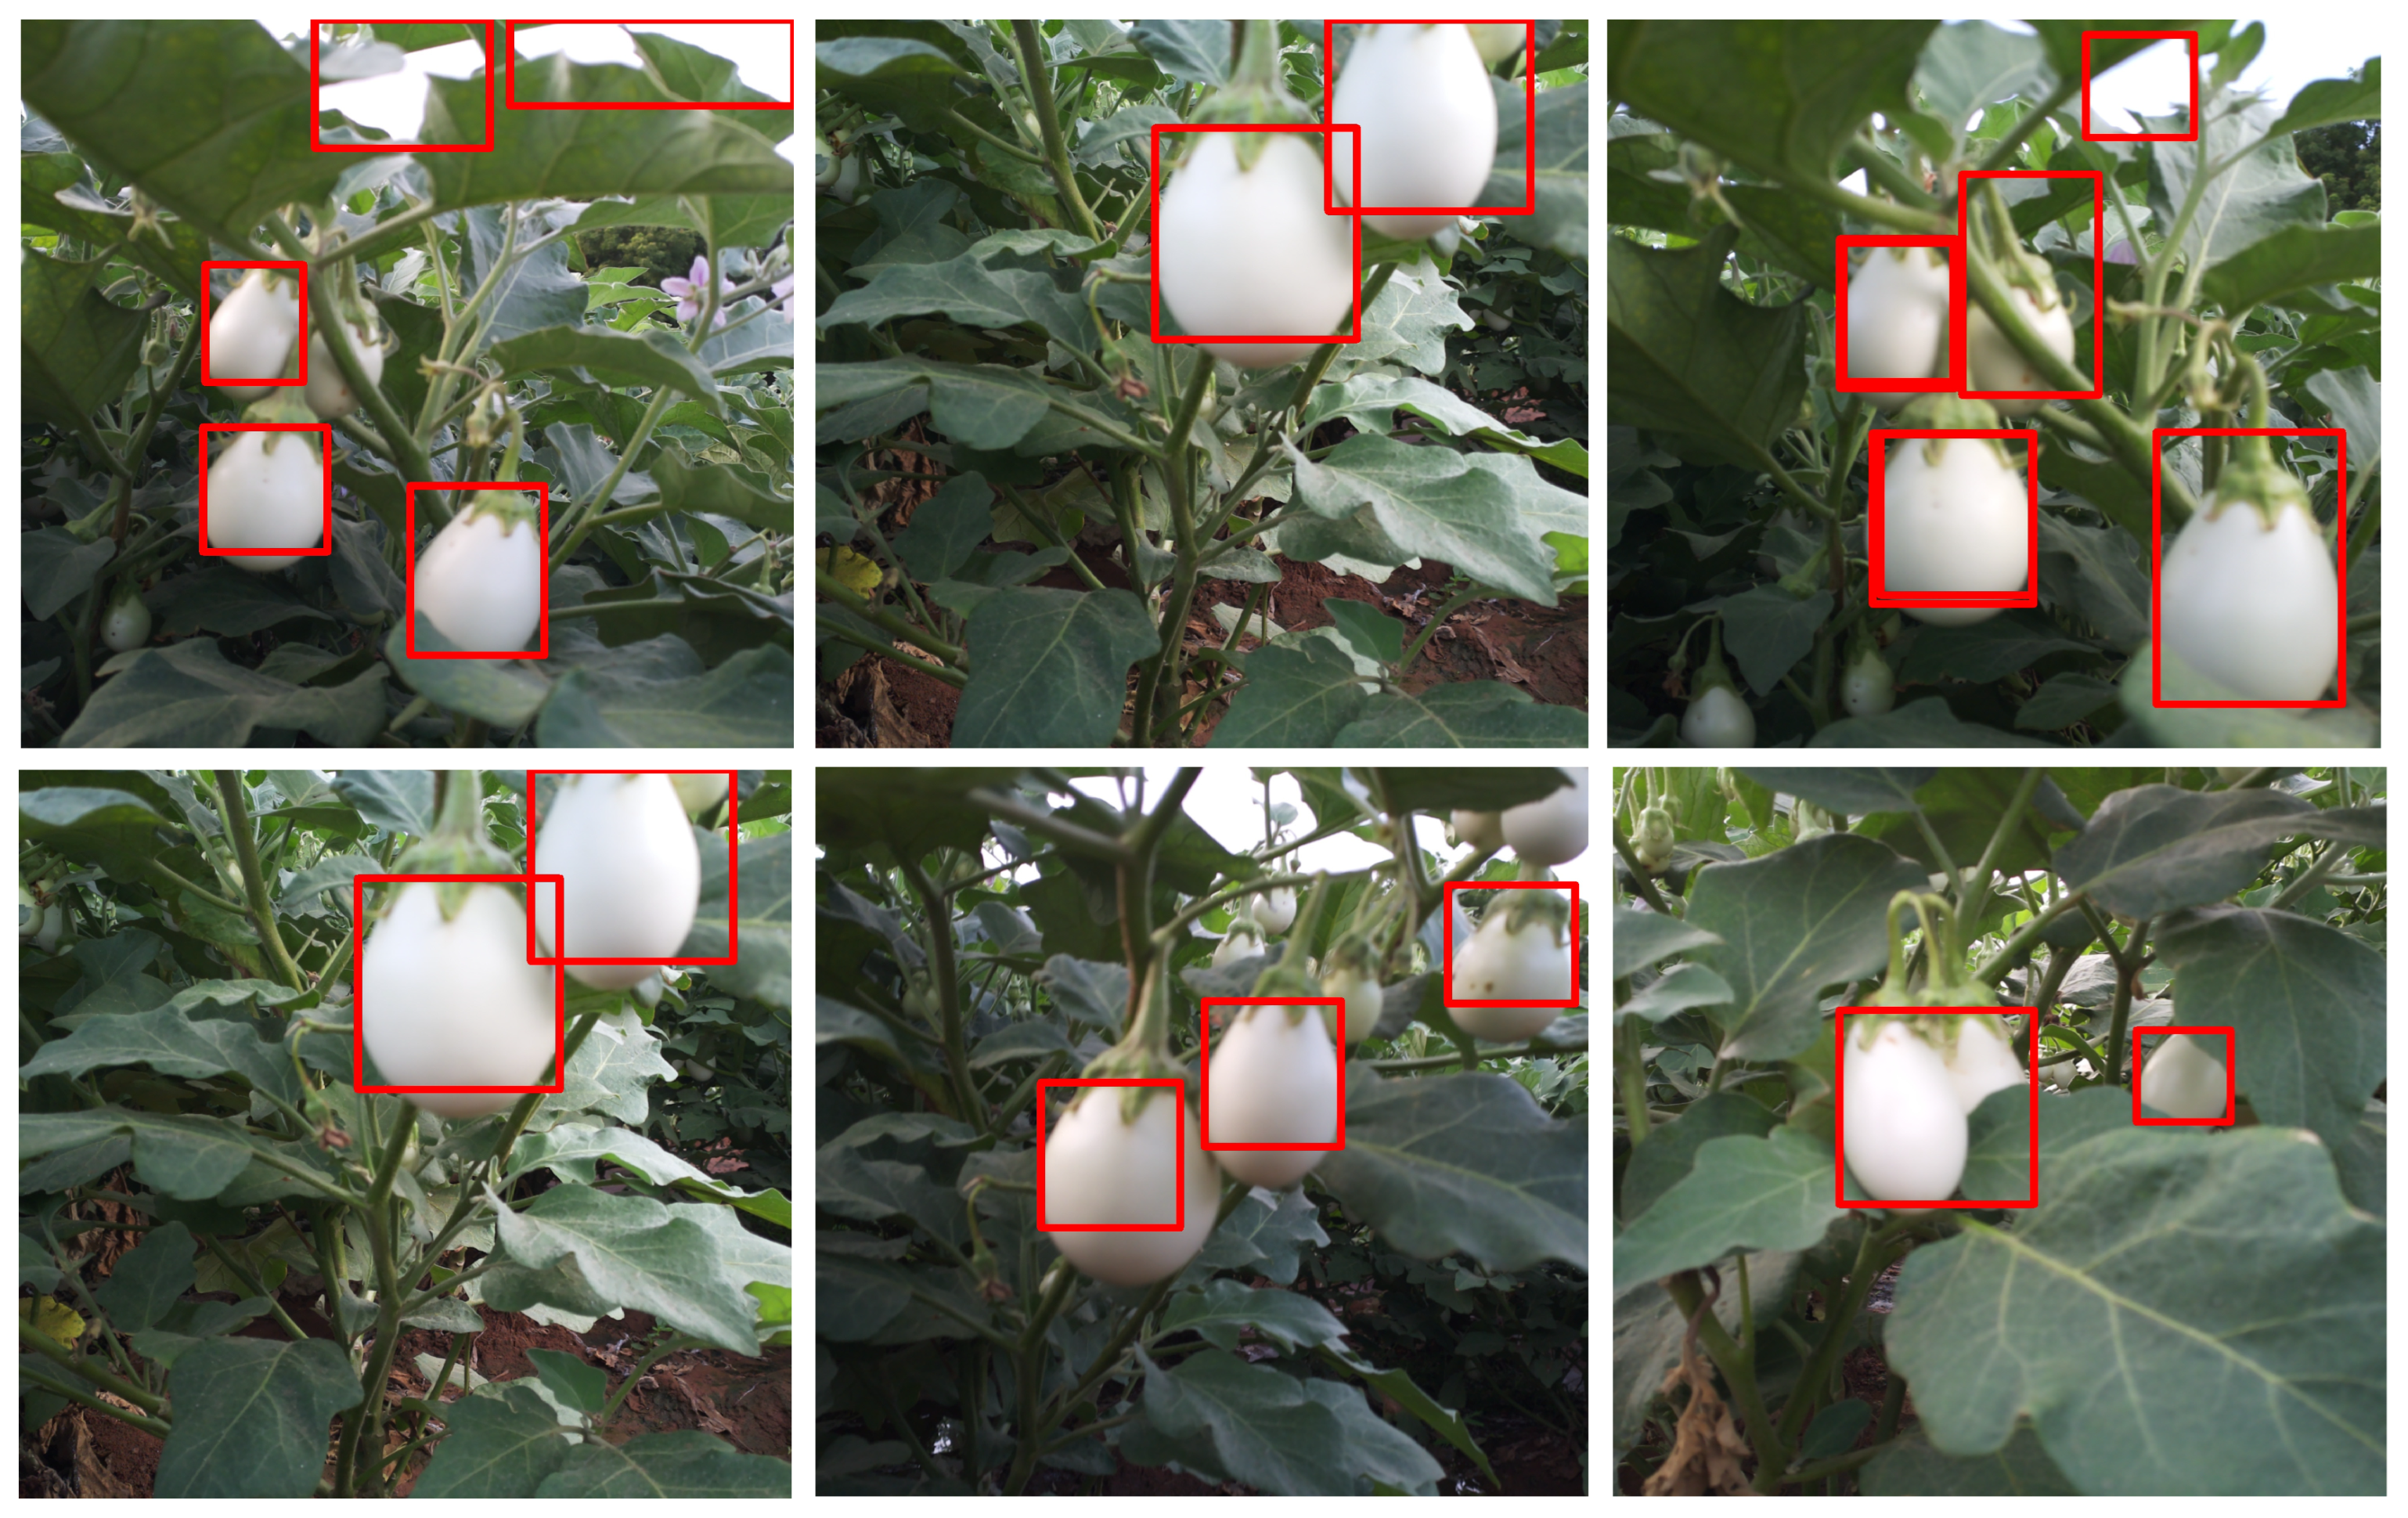
2.3. Brinjal Detection

The proposed brinjal detection method employs elimination and clustering techniques to identify brinjals from captured images. The process begins by eliminating the background and non-brinjal regions based on the brinjal’s properties. The remaining pixels in the image are designated as Regions of Interest (RoIs). These RoIs are clustered, and the resulting blobs are further examined to detect the brinjals.

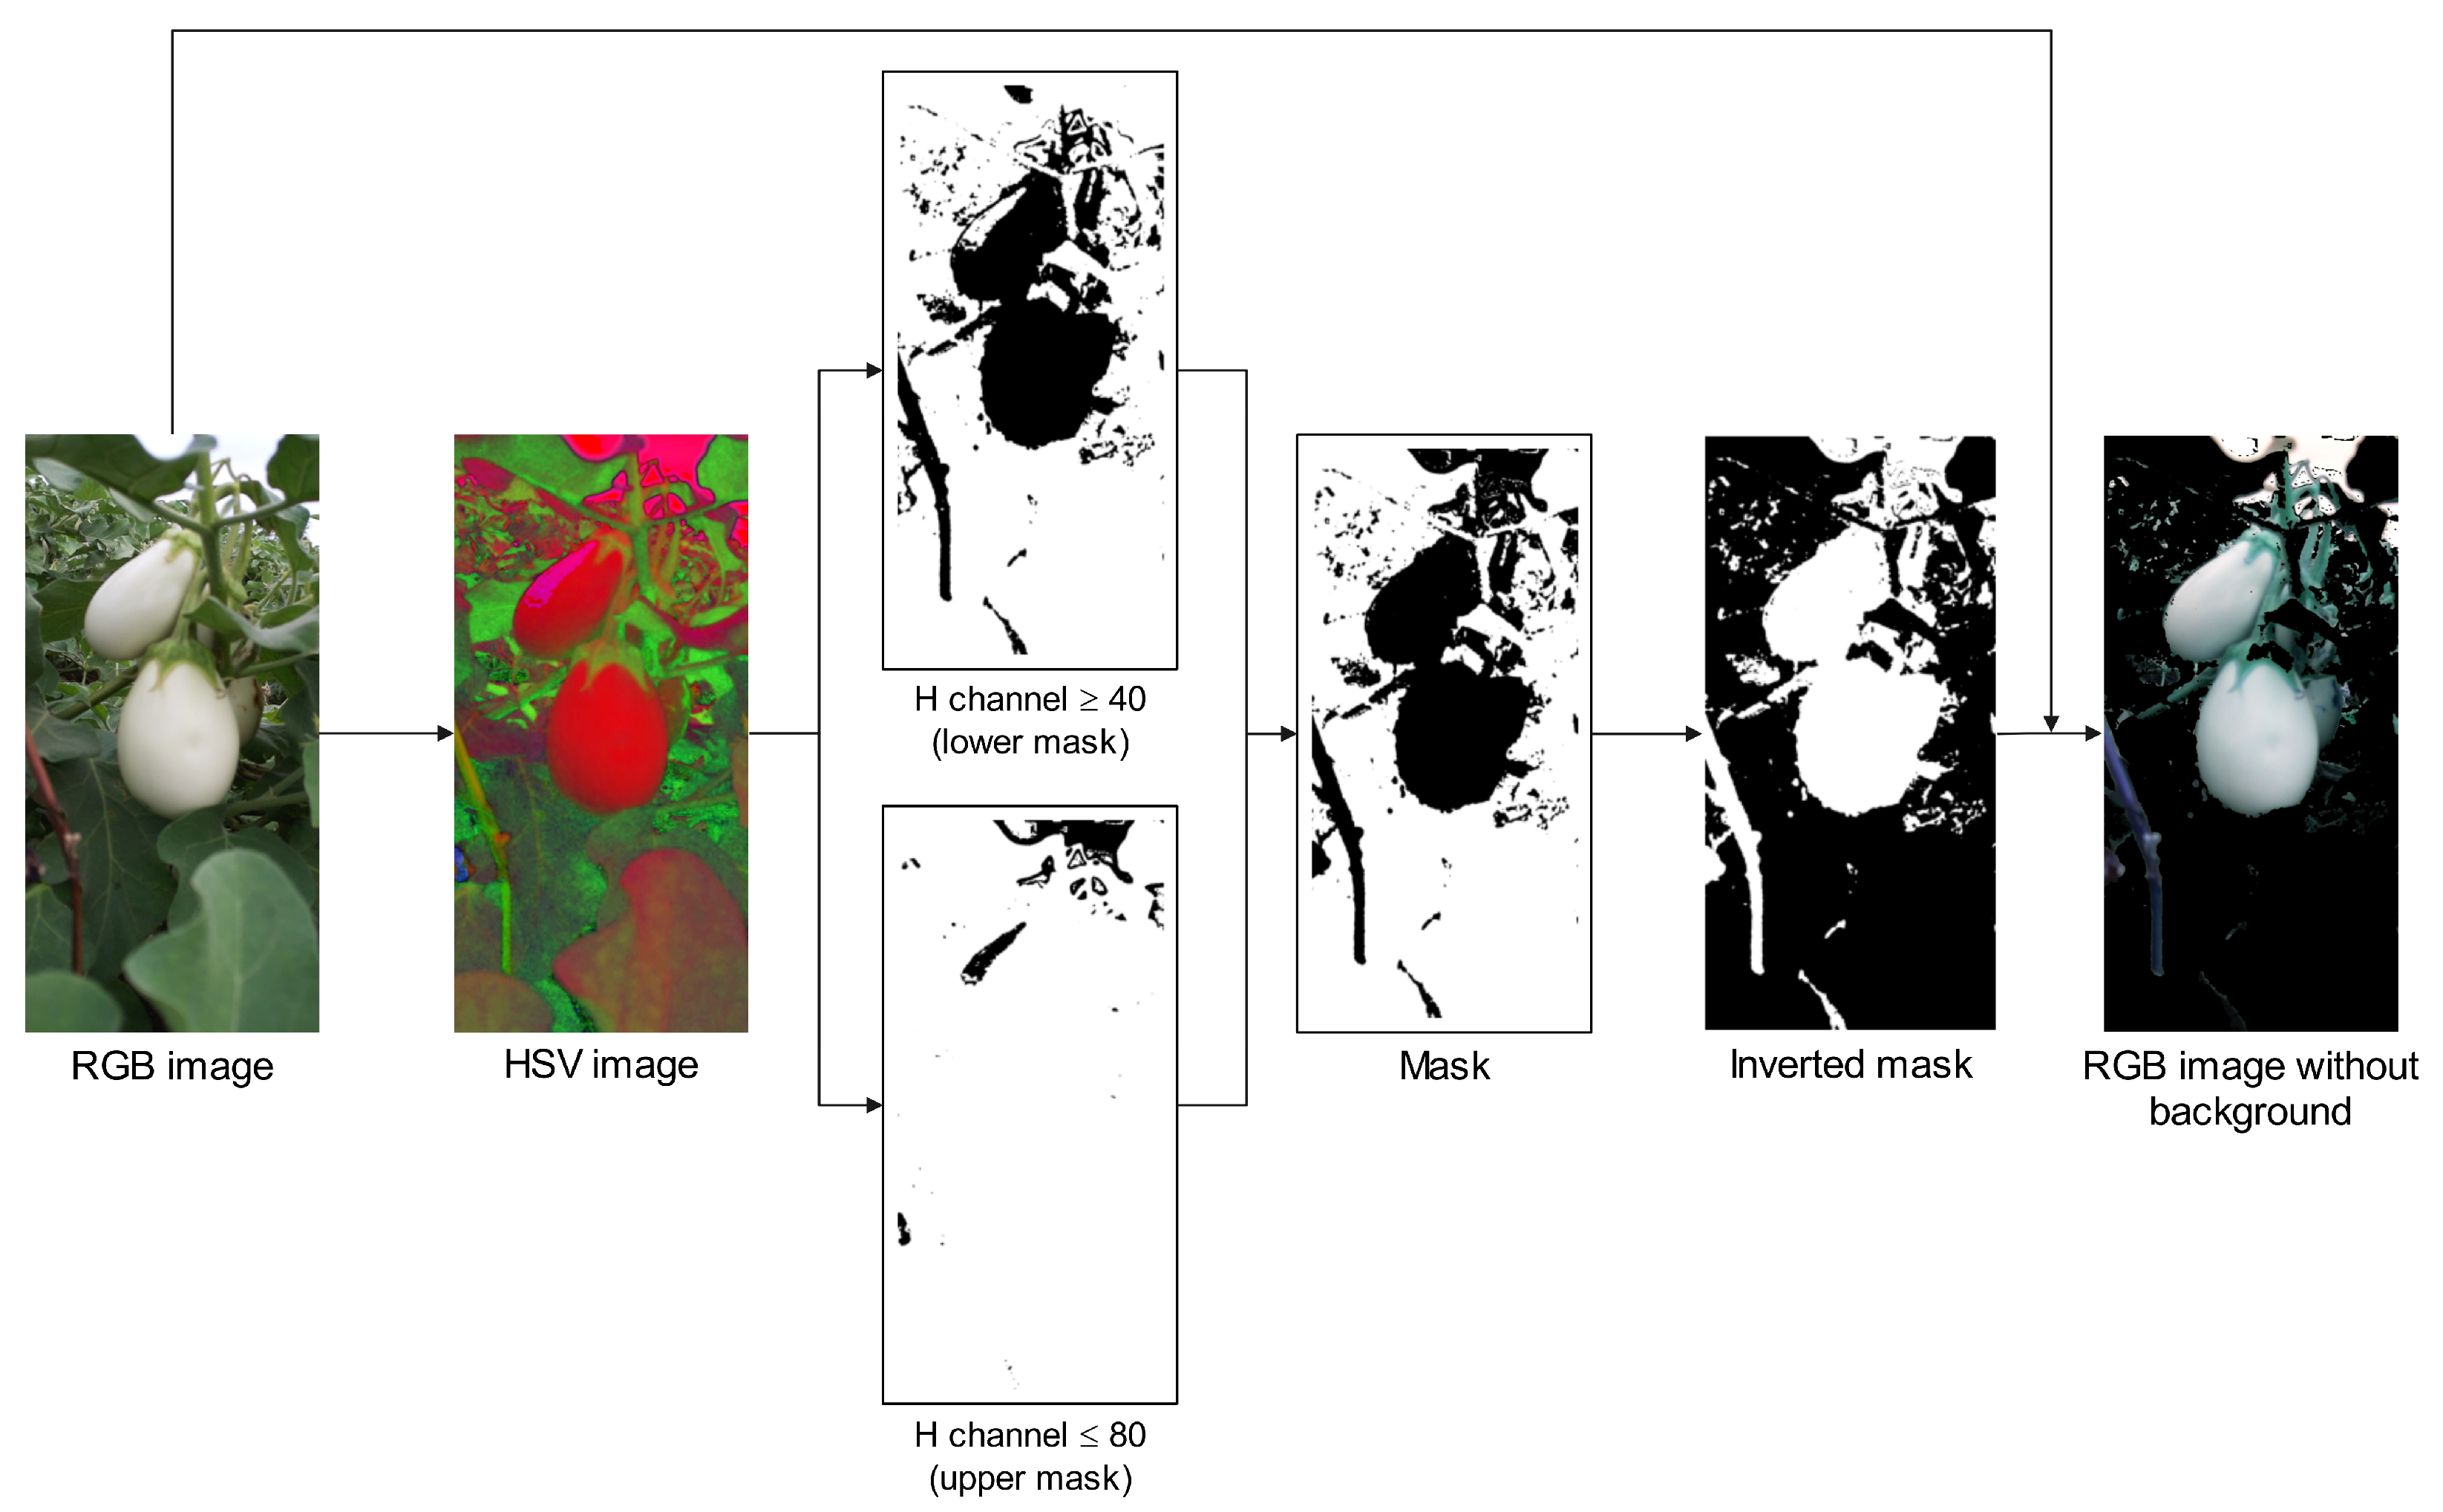
2.3.1. Elimination of Background

Color is an important visual cue in machine vision, and color segmentation is an effective method for distinguishing biological targets [21,30]. Images captured from the farm typically contain more background details (i.e., the leaves and stems) than brinjals. Since the leaves and stems are green, green color-based segmentation is sufficient to isolate the background. The HSV color space, which uses the hue channel (H) to describe color, has advantages over other color spaces in terms of background removal, reducing detection time, and improving efficiency [32]. Therefore, the captured RGB images are converted into the HSV color space. Analysis indicates that the green hue in the HSV color bar of OpenCV ranges from 40 to 80. Equations (2) and (3) produce the lower and upper mask Boolean arrays using these two values. These Boolean arrays are then element-wise multiplied and inverted. The inverted array is subsequently multiplied with the RGB image’s R, G, and B channels to remove the background. Figure 4 illustrates the process of background elimination.
Lower_mask(I) = True, if I(H) ≥ 40; otherwise, False
Upper_mask(I) = True, if I(H) ≤ 80; otherwise, False
where I is the HSV image, and H is the hue value of the image I.

2.3.2. Removal of Non-Interested Regions

After the background is removed, the image is converted to grayscale, and a binary threshold method is applied to accurately find the contours, which are bound areas of objects. Small contours are considered non-interested regions and are removed based on two features of brinjals: area and major axis. The criteria for elimination include the following: (i) contour area less than the average contour area in the image, and (ii) the major axis of the contour less than one-tenth of the input image height. The remaining contours are considered RoIs, and the image is split into portions. Figure 5 shows the steps involved in the removal of non-interested areas.

2.3.3. Clustering Pixels to Detect Brinjals

The portions of the image are further segmented using K-means [33] clustering to detect brinjals. For better results, images are clustered into five regions with 10 attempts of random center labeling, repeating the clustering process 100 times or until achieving 100% clustering accuracy. Clusters are merged to identify brinjals and their shadows. Initially, the non-interested regions are eliminated using the method described in Section 2.3.2, and further eliminated based on the shape and symmetric features of brinjals. Brinjals, being egg-shaped, are approximated using the Ramer–Douglas–Peucker algorithm [34,35]. Contours that remain with more than nine points after approximation are considered to represent a half circle. The contours are further tested for symmetry [26]. Symmetric contours are considered brinjals and are localized in the source image using a red bounding box, while other contours are ignored. Figure 6 depicts the process of locating the brinjals in the image.

2.4. Training Data Acquisition and Brinjal Area Calculation

Deep learning requires substantial data for accurate detection and prediction [36], while transfer learning models require less data [37,38]. The article by Tamilarasi and Muthulakshmi [26] demonstrates that brinjal maturity can be accurately predicted with limited training data. This study collects 50 good-quality images from the farm to detect brinjals and calculate their areas. Algorithm 2 outlines the methodology for acquiring training images and determining the brinjal area.
Algorithm 2. Training data collection and area calculation
Input: Video frames from the Pi camera and receiver response time from ultrasonic sensor.
Output: b_area.csv file.
Steps:
    1. Initialize image_count = 0;
    2. While (image_count < 50):
    3.         Capture the valid image using the Section 2.2.3;
    4.         Detect the brinjals using the Section 2.3;
    5.         If (number of brinjals > 0):
    6.                  For (each brinjal):
    7.                             Calculate the area of the brinjal and save it in
                                    b_area.csv file;
    8.                  End For;
    9.                  Increase the image_count by 1;
    10.           Else:
    11.                  Go to step 2;
    12.           End If;
    13.    End While;
    14.    Return b_area.csv

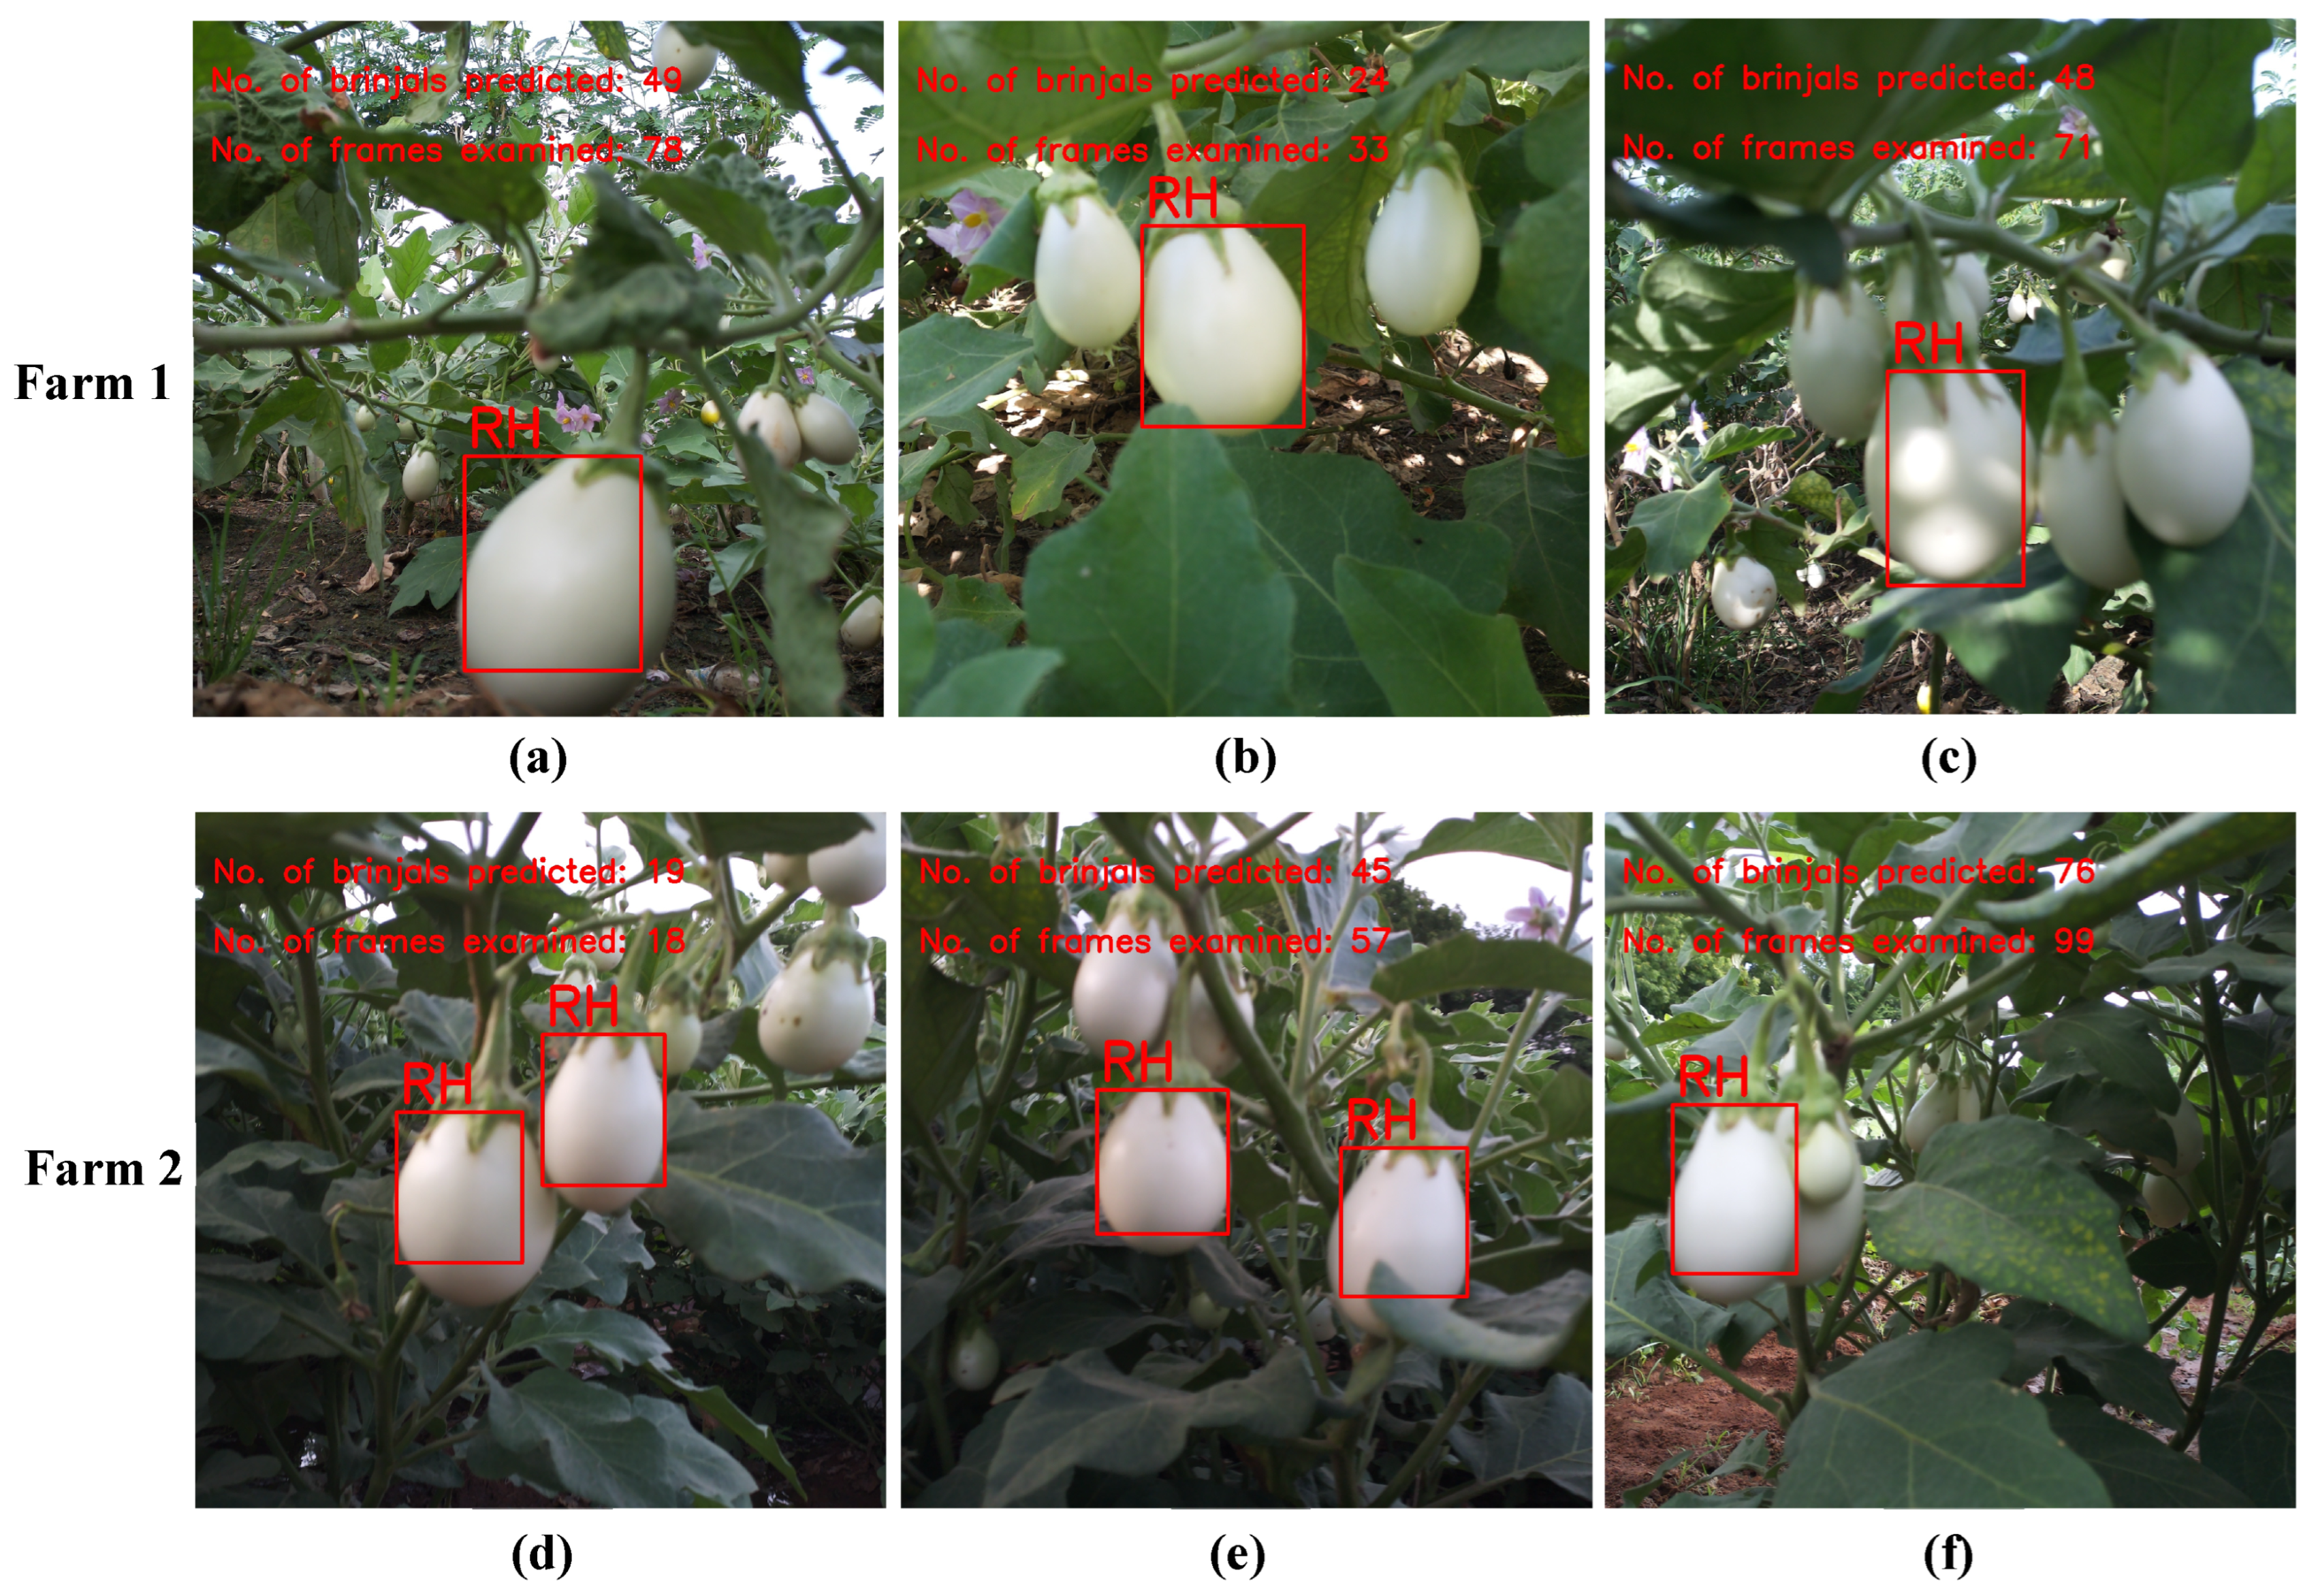
2.5. Brinjal Maturity Prediction

Predicting brinjal readiness for harvest is demanding. Human experts use cognitive knowledge to predict readiness based on size. This study attempts to transfer that knowledge to machines using a vision module. The sample brinjal area is calculated and stored in the b_area.csv file. The prediction procedure outlined in [26] predicts overlapped immature brinjals as single mature brinjals. The contour area follows a normal distribution with some outliers in the b_area.csv file. Removing outliers and fixing the range of mature brinjal size resolves this issue. Since the data follow a normal distribution, the Z-Score method is employed to remove all outliers. The Z-Score value of the current contour area is computed using the following formula [39]:
Z Score = X μ σ
where X represents the observed brinjal area, μ denotes the mean area, and σ represents the standard deviation of the list of values in the b_area.csv. Once the Z-Score value has been calculated, a threshold value of 1 is chosen instead of the standard Gaussian value of 3 that is defined in order to eliminate all outliers from the CSV file. Subsequently, the median value of the data in the CSV file is used to determine the minimum size required for harvesting mature brinjal, which is represented by the variable ‘min_h’. Similarly, the upper limit for harvesting is indicated by ‘max_h’, which is the biggest value found in the CSV file. The threshold values ‘min_h’ and ‘max_h’ play a crucial role in predicting the maturity of the brinjal. Algorithm 3 illustrates the procedure for predicting which brinjals are ready for harvest.
Algorithm 3. Predict the ready to harvest brinjal
Input: Frames from the Pi camera, receiver response time from ultrasonic sensor, and the threshold values ‘min_h’ and ‘max_h’ to predict the ready to harvest brinjal.
Output: Ready to harvest brinjals are marked with bounding boxes and returns the total number of brinjals ready to harvest.
Steps:
    1. RH_count = 0;
    2. Do:
    3.            Capture the valid image using the Section 2.2.3;
    4.            Detect the brinjals from the image using the brinjal detection
                   method derived in the Section 2.3;
    5.            For (each brinjal in the image):
    6.                        Calculate the area;
    7.                           If (min_h <= area of the brinjal <= max_h):
    8.                                    Mark the brinjal “READY to HARVEST”
    9.                                    Increase the RH_count by 1;
    10.                     Else:
    11.                               Ignore the brinjal;
    12.                     End If;
    13.            End For;
    14.     Until (the entire farm is navigated to capture the images);
    15.     Return RH_count.

2.6. Hardware and Software Configurations

The BHDS hardware and modules are managed by the 64-bit Raspbian operating system, Bookworm version 12. The BHDS program modules are developed using Geany 1.38, a lightweight text editor, and executed using Python 3.11.2. The libraries used for development include OpenCV 4.7.0 (cv2), NumPy 1.23 (np), Pandas 2.1.3 (pd), time, RPi.GPIO 0.7.1, and PiCamera2 0.3.12. The model is tested on a quad-core Cortex-A72 processor (NXP Semiconductors, Eindhoven, The Netherlands) with a clock speed of 1.8 GHz and 8 GB of LPDDR4-3200 SDRAM.

2.7. Evaluation Metrics

The efficiency of the BHDS model is assessed through its training image collection, brinjal detection, and mature brinjal prediction ability. The efficiency of collecting training image for the BHDS model is evaluated using the training data collection accuracy rate (TDCAR). The model’s prediction performance is assessed using the following metrics: (i) true ready to harvest detection rate (TRHDR), (ii) missed ready to harvest detection rate (MRHDR), and (iii) false ready to harvest detection rate (FRHDR). The TRHDR indicates the rate of accurate detection, whereas the MRHDR denotes the inability to detect mature brinjals. The FRHDR returns an inaccurate prediction rate; for example, sometimes, immature brinjals, soil, sky, and leaves are misclassified as ‘ready to harvest’. The evaluation metrics are calculated as follows:
TDCAR = NPI/TNI
TRHDR = NBtd/NBgt
MRHDR = NBmd/NBgt
FRHDR = NBfd/NBad
where ‘NPI’, ‘TNI’ ‘NB’, ‘td’, ‘md’, ‘gt’, ‘fd’, and ‘ad’ represent the number of perfect images, the total number of images, the number of brinjals, true detection, missed detection, ground truth, false detection, and the total number of brinjal detected by the model, respectively.

2.8. Roboflow 3.0 Configuration for Brinjal Detection

This configuration was applied to systematically evaluate and compare the performance of the BHDS with YOLOv8, using an identical dataset. Brinjal detection data, collected from Farm 1 and Farm 2 by the BHDS, were uploaded to Roboflow for annotation, preprocessing, and model training to ensure consistency and efficiency throughout the evaluation process. The dataset comprised 100 images from Farm 1 and 50 images from Farm 2, and each image was manually annotated with bounding boxes identifying the brinjals. The dataset was split into training (70%), validation (20%), and testing (10%) sets using Roboflow’s automated dataset-splitting feature. No data augmentation techniques were used to maintain consistency between both models. YOLOv8 was chosen from Roboflow’s pre-configured models for its balance between detection accuracy and inference speed. The input image size was reduced to 640 × 640 pixels to optimize detection precision and minimize computational load. Key hyperparameters were tuned, including a batch size of 16, a learning rate of 0.001, and a confidence threshold of 50%, using Roboflow’s automated hyperparameter optimization tool. The YOLOv8 model was trained on Roboflow’s cloud-based GPU infrastructure for 300 epochs to enhance model robustness [40].

3. Experimental Results

3.1. Field Evaluation Sites and Conditions

The proposed BHDS was evaluated on two traditional brinjal farms located in the Tenkasi District, Tamil Nadu, India. The first farm, situated near Keezhapavoor (coordinates: 8.9133631, 77.4185584), cultivated a white, oblong-shaped hybrid brinjal variety. The plants were six months old at peak production. The evaluation took place on 25 August 2024, from 6:30 a.m. to 9:30 a.m., under temperatures ranging from 30 °C to 34 °C, with a consistent southwest wind at 21 km/h. The second farm, situated near Pavoorchatram (coordinates: 8.914920, 77.382889), cultivated the white, egg-shaped ‘KKM-1’ variety. The plants were two months old and had recently begun producing. The evaluation occurred on 27 August 2024, from 6:30 a.m. to 8:30 a.m., with temperatures between 28 °C to 30 °C and a southwest wind at 15 km/h. All evaluations were conducted during early morning hours to mitigate the effect of specular reflection from the brinjal surface, which could compromise visual detection accuracy. The layout of the test farms is illustrated in Figure 7.

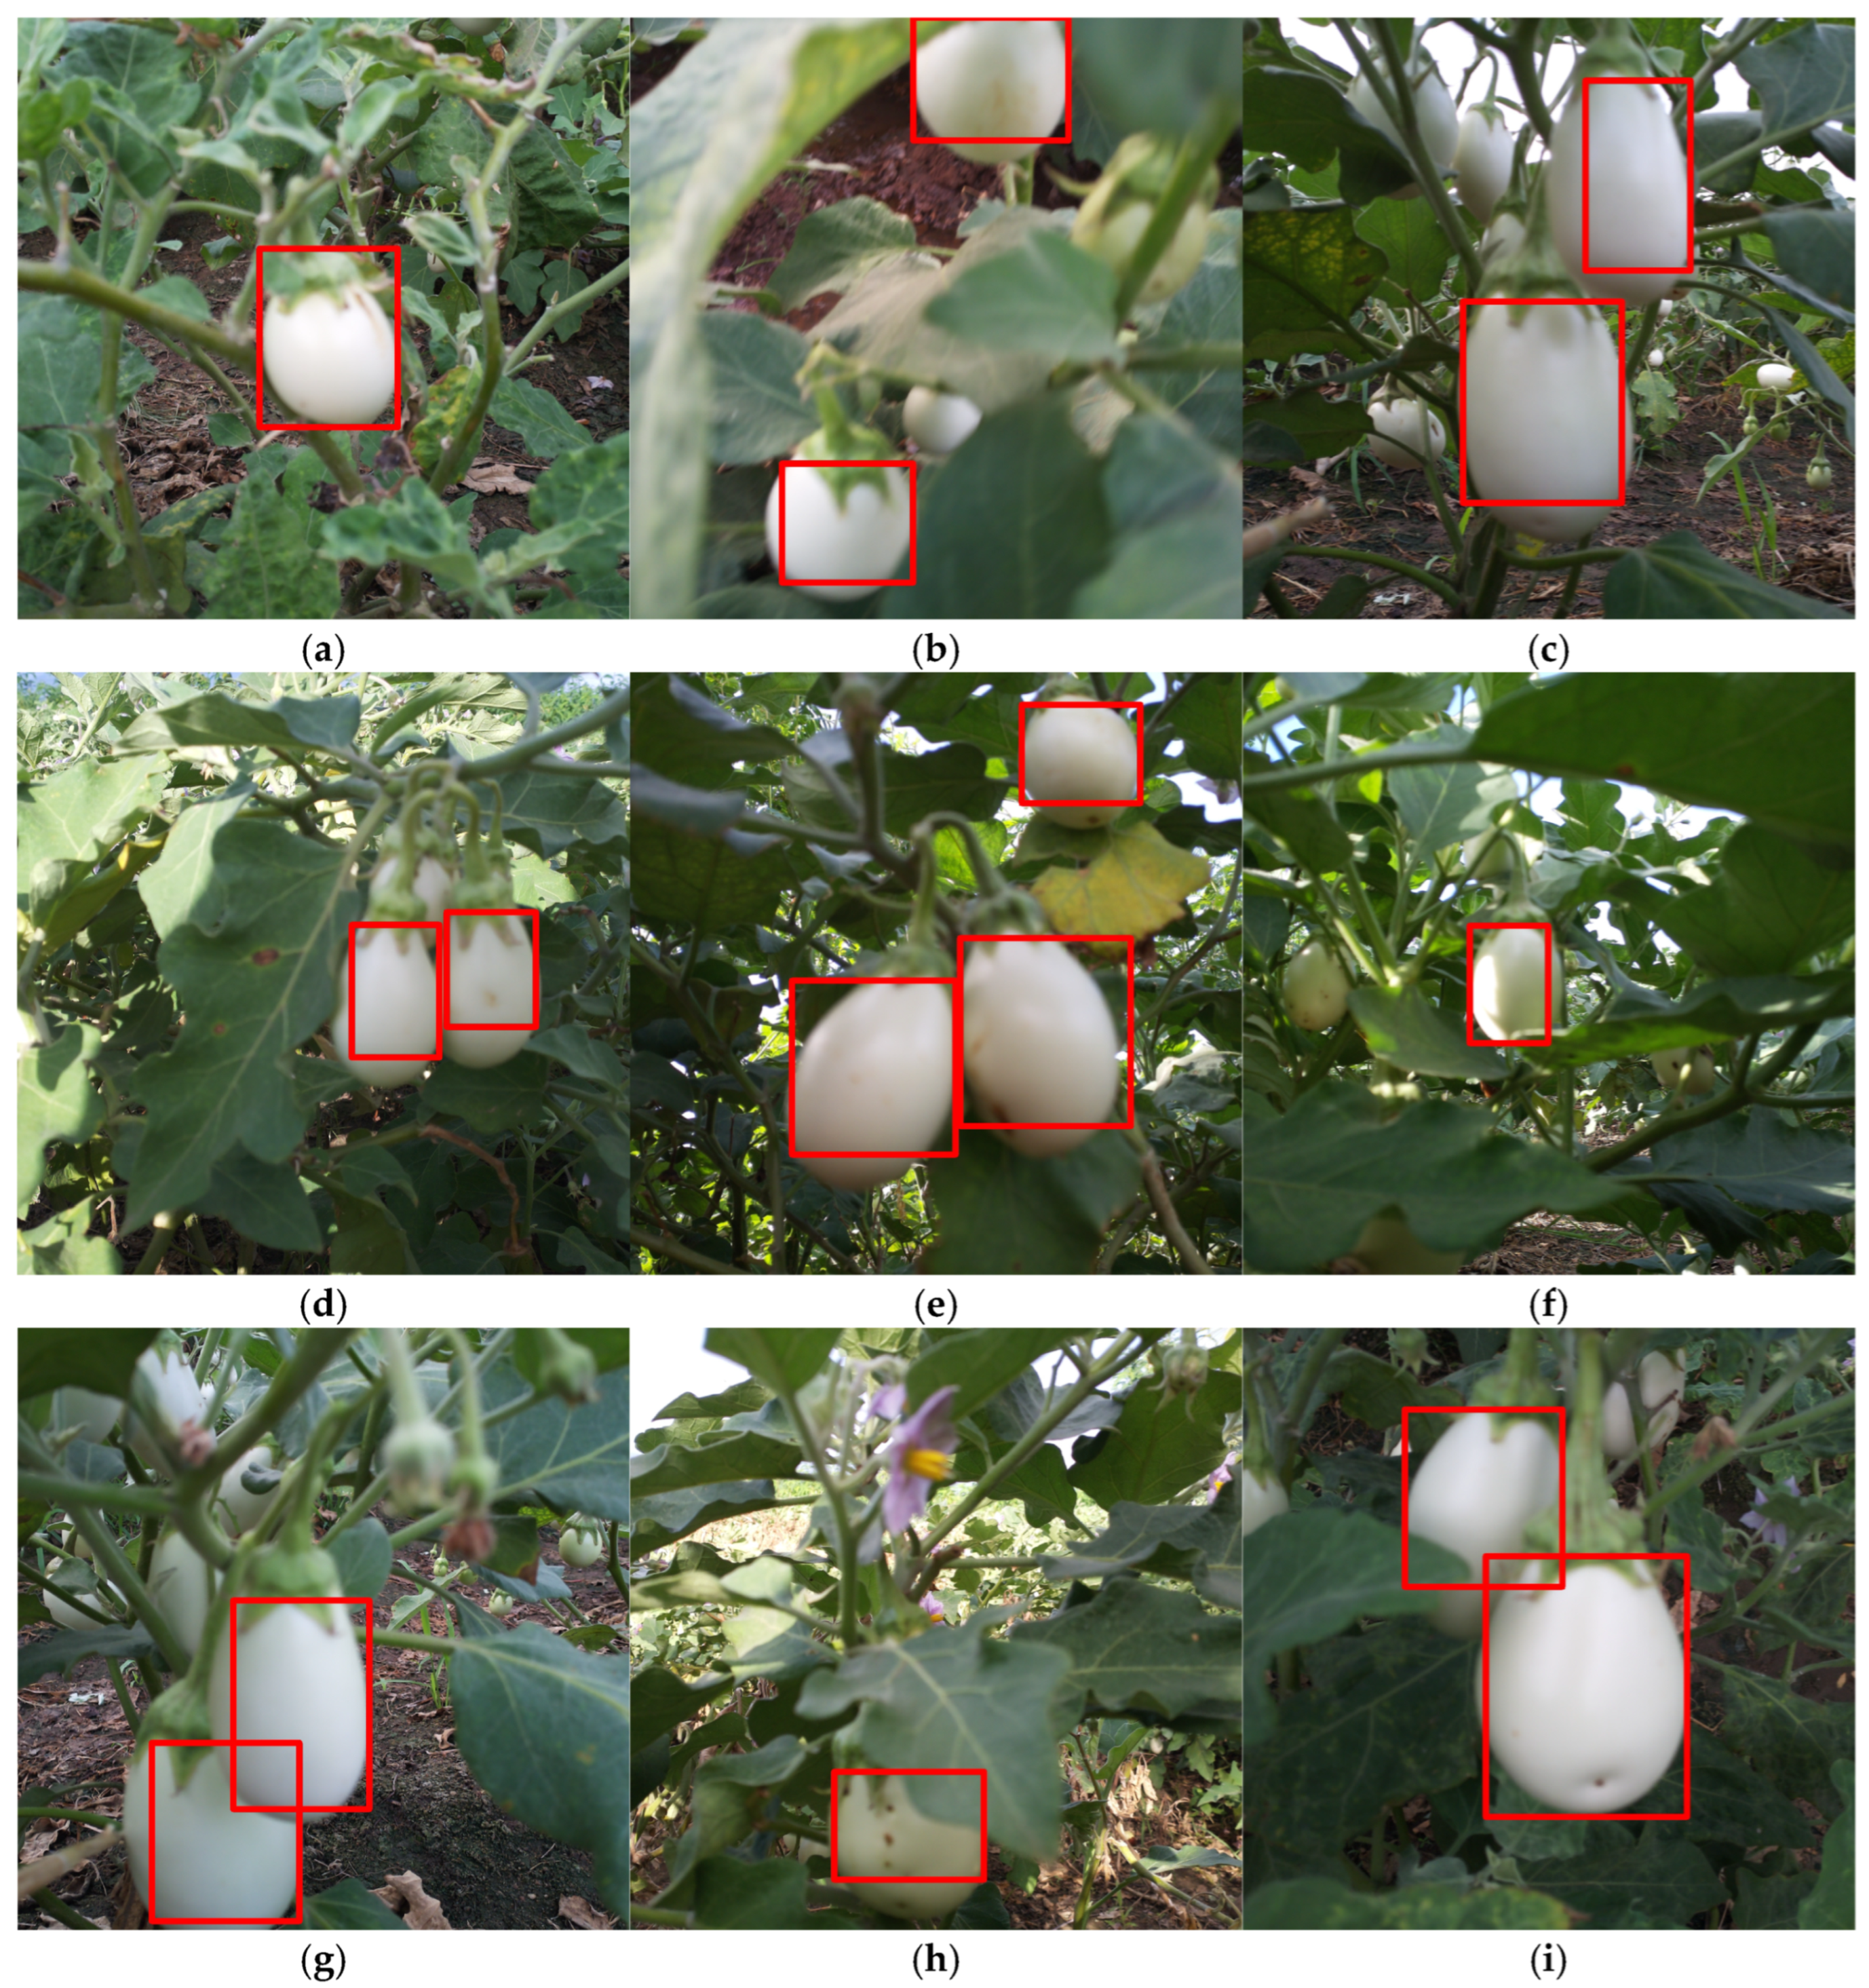
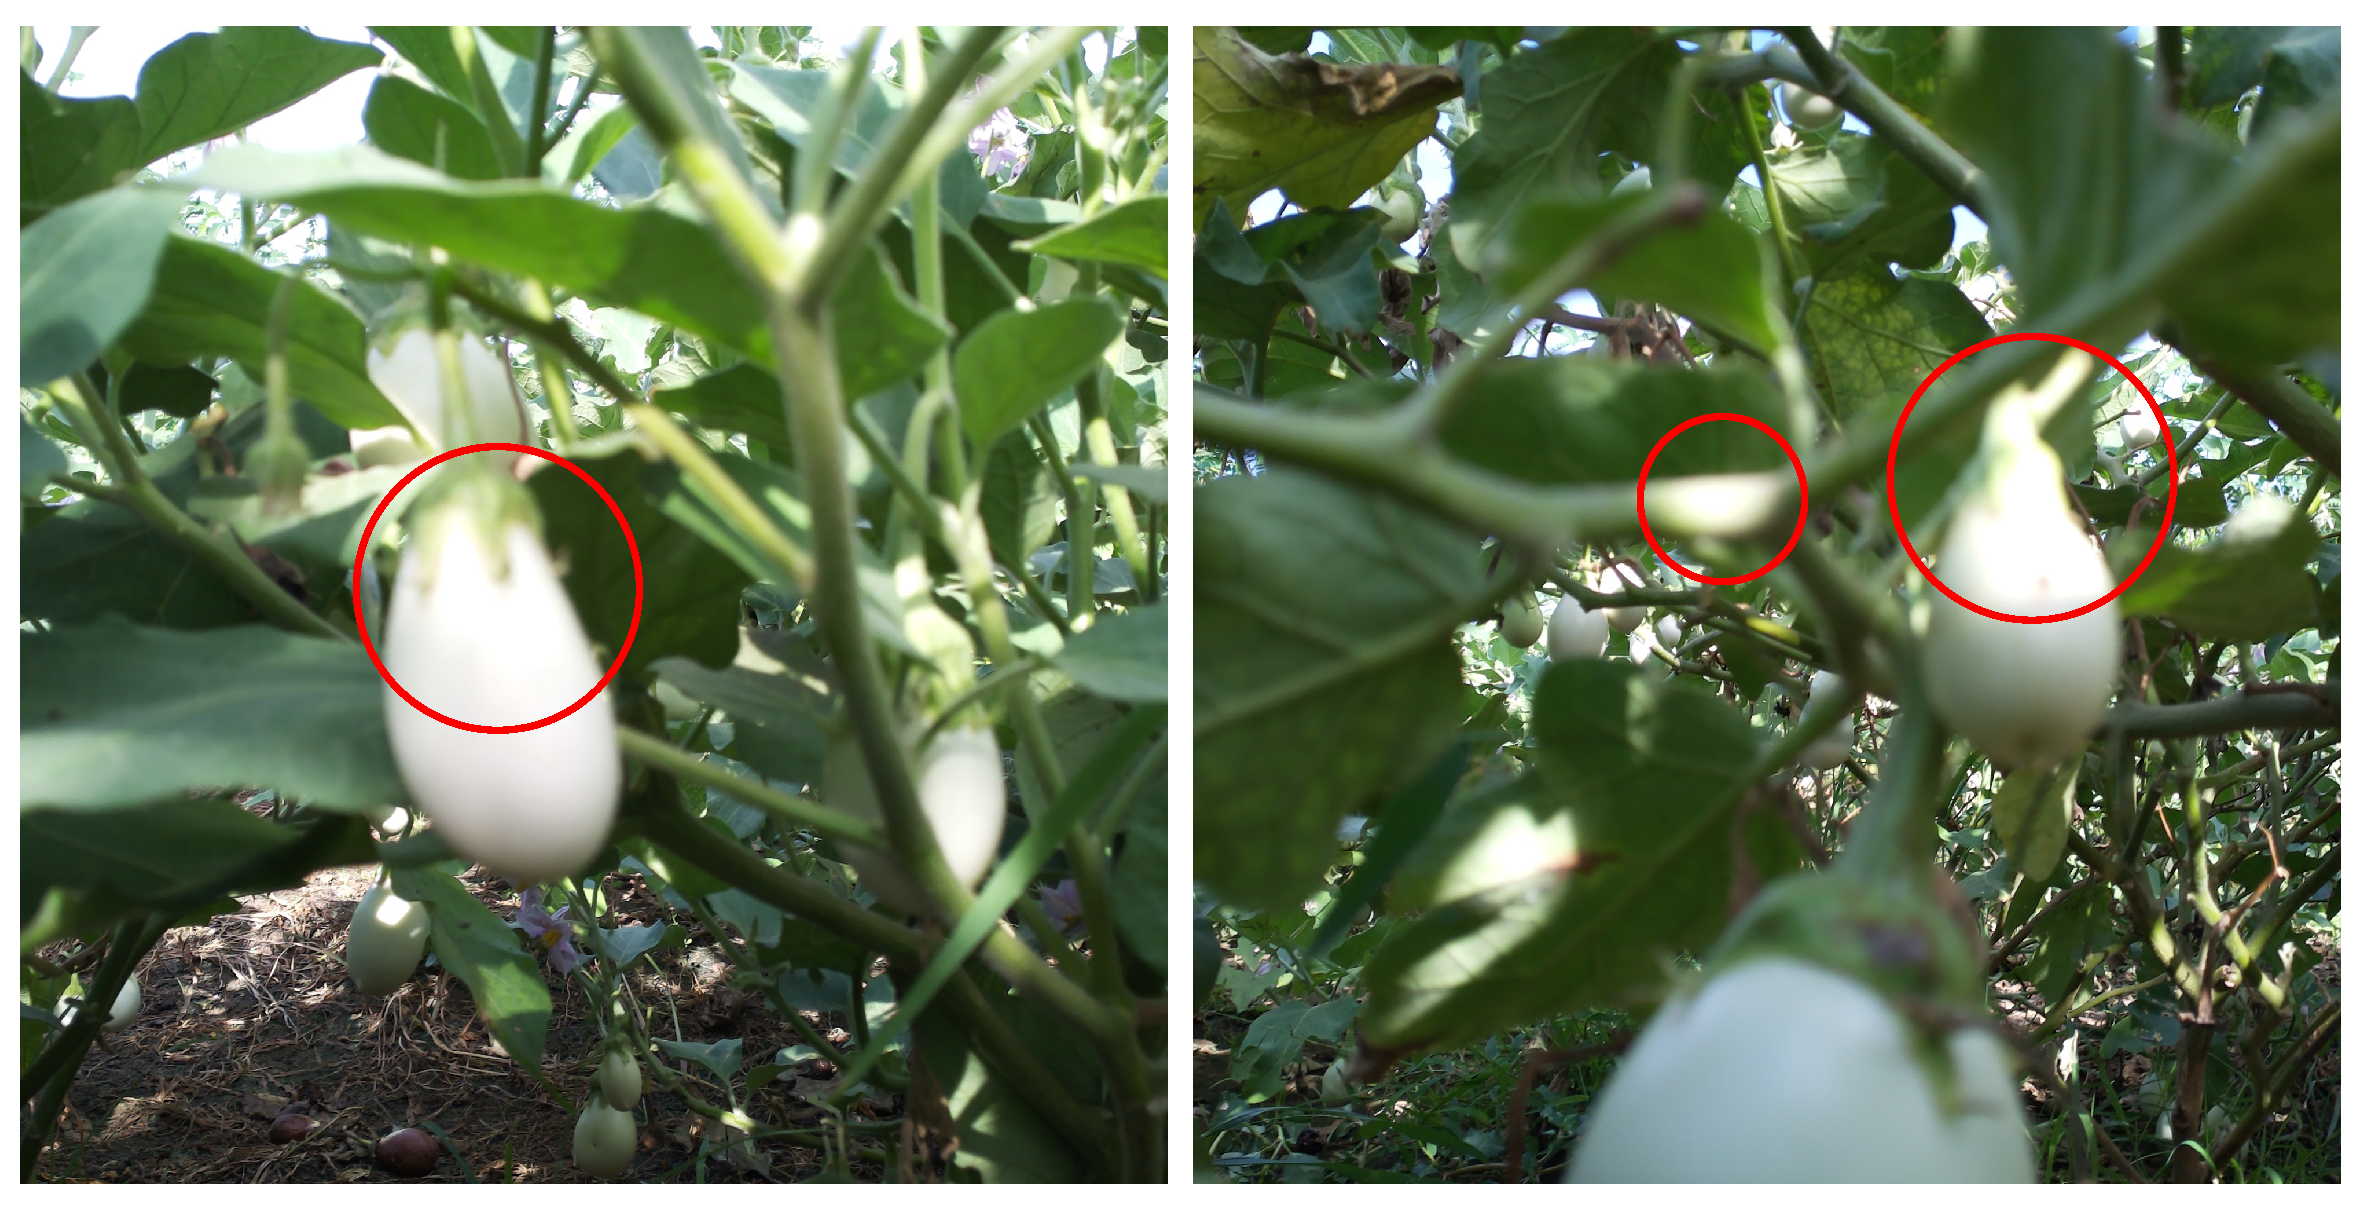
3.2. Evaluation of Brinjal Detection

The effectiveness of the proposed brinjal detection method was evaluated using 100 images from Farm 1 and 50 images from Farm 2. The evaluation focused on four key aspects: (i) background elimination, (ii) pixel-level segmentation accuracy, (iii) brinjal-level detection accuracy, and (iv) inference time. Firstly, the algorithm’s ability to eliminate background details was assessed. On average, 3,968,000 pixels were present in each source image, with 727,447 pixels retained for further processing, effectively reducing about 80% of irrelevant pixels. This reduction enhances the algorithm’s focus on relevant regions while significantly decreasing computational time and costs (Figure 8).
Secondly, the remaining pixels were segmented into RoIs using the K-means clustering technique, as detailed in Section 2.3.3. The effectiveness of this segmentation was measured using the Intersection over Union (IoU) metric, which quantifies the accuracy of predicted regions by dividing the area of overlap between predicted and ground truth segments by the total area covered by both [41]. The segmented areas were compared with ground truth data marked by an expert using the ‘Make Sense’ 1.9.0 AI tool. Figure 9 shows the ground truth (green) versus the segmented areas (red).
The results demonstrated that the algorithm effectively segmented brinjal regions, achieving an accuracy of 77% in Farm 1 and 81% in Farm 2. The slightly lower accuracy in Farm 1 was attributed to shadows in the captured images (Figure 9b). The IoU frequency and standard error are shown in Figure 10, revealing a standard error of 1.9% for Farm 1 and 2.5% for Farm 2, which is acceptable given the varying farm conditions.
It should be noted that a total of 100 curated images were selected for analysis for Farm 1; however, the filenames displayed on the x-axis reflect their original capture order and are not sequentially numbered from 1 to 100. This is due to the automatic image curation logic embedded within the BHDS system, which retains original image identifiers during selection. The errors are primarily due to the presence of shadows within the brinjal regions, which occur because of the varying angles of image capture in outdoor environments. The algorithm was further evaluated at the brinjal level, successfully detecting single, multiple, overlapped, partially occluded, and clustered brinjals. Figure 11 illustrates the detection under different growing conditions.
The model’s performance was assessed using recall, which measures how many actual brinjals were correctly identified; precision, which indicates the proportion of identified brinjals that were correct; and the F1-score, a combined metric that balances both precision and recall. The total number of brinjals detected by the model was compared with the ground truth data. To evaluate the efficiency of the proposed algorithm in comparison with well-established methods, the dataset collected using the proposed model was also used to test the algorithms reported in [26] on the edge device. The results, summarized in Table 1, indicate that the proposed algorithm achieved a precision of 88.59% in Farm 1, with occasional false positives due to high illumination on small furs.
This precision suggests that, when deployed in a real-time harvesting system, the model will minimize unintended damage, reducing the likelihood of harvesting the leaves or stems. The average recall was 86.44%, indicating a higher false negative rate, where a few brinjals are missed. This has minimal impact on harvesting decisions, as the missed detections are primarily due to poor lighting at the plant’s bottom. In Farm 2, the precision was slightly lower at 86.36%, compared to Farm 1. This difference is attributed to the farm conditions, where the camera had to focus slightly upwards to capture images of the younger plants. Consequently, the sky visible between the leaves met the symmetry criteria, leading to occasional misdetections. However, fewer brinjals were missed by the model, as indicated by the achieved recall of 88.78%. The reasons for the higher recall and slightly lower precision compared to the results from Farm 1 are depicted in Figure 12. Despite these hurdles, the proposed model’s F1-score supports its deployability in real-time applications.
The F1-score obtained in both farm tests is comparable to the 85.66% achieved by the YOLOv5m brinjal detection model [3] and 85.4% by the NVW-YOLOv8s in tomato detection [20]. Finally, the inference time of the proposed detection method was evaluated to determine its suitability for real-time harvesting decisions. The evaluation considered the time required for several key tasks: eliminating the background and irrelevant areas, identifying the RoI, performing clustering, confirming the detected region as a brinjal, and determining the total time to localize the brinjal. The average times for these tasks are summarized in Table 2. The inference time of the YOLOv8 model was excluded from this table due to discrepancies in the hardware environments used for evaluation. Specifically, YOLOv8 was executed in the Roboflow environment, while the other two models were run on a Raspberry Pi platform.
While the proposed algorithm significantly reduces detection time on an edge device compared to that of the state-of-the-art model described in [26], it remains higher than that of other object detection methods. For example, litchi detection times with Faster R-CNN are 0.652 s, with SSD is 0.03 s, and with YOLOv3 is only 0.026 s on a system with an Intel i7, 8700 (3.20 GHz) quad-core CPU and an NVIDIA GeForce GTX 1080 GPU [42]. It is expected that the detection time of the proposed algorithm could be further minimized on such high-end systems.

3.3. Accuracy of Training Image Acquisition

The automated model for training data acquisition selects images based on two criteria: a focus measure exceeding the average of a random sample of 25 images and the presence of at least one brinjal. The average focus measure was calculated as 14 for Farm 1 and 37 for Farm 2. Images meeting these thresholds are further analyzed by the proposed detection algorithm to confirm the presence of a brinjal. If detected, the image is added to the training dataset. The model’s data cleansing performance was benchmarked against the ground truth, and the results are presented in Table 3. The validity of data collection accuracy and error rates show no significant difference in dataset creation efficiency regarding time and error rate. As a result, it was determined that 50 curated images are adequate for further processing. The model was therefore configured to collect this number from Farm 2. The primary source of error was found to be the image capture angle, particularly when the sky was visible in the image.
In addition to data collection, the model is also designed to calculate brinjal size, which is used to predict maturity. For Farm 1, brinjal sizes ranged from 1479 to 370,970 pixels, with a median size of 92,576 pixels. In Farm 2, brinjal sizes varied from 4840 to 225,705 pixels, with a median size of 89,396 pixels. These size metrics are critical for predicting brinjal maturity.

3.4. Performance of Prediction

To assess for brinjal maturity, the model calculates the average brinjal size after removing outliers. For Farm 1, the minimum and maximum threshold values were established at 117,461 and 208,223 pixels, respectively. For Farm 2, these thresholds were 82,979 and 137,987 pixels. Brinjals with sizes within these ranges are classified as mature. The average time to predict brinjal maturity was 0.028 s for Farm 1 and 0.03 s for Farm 2. The proposed model has demonstrated its capability to identify market-ready brinjals under various growing conditions, as depicted in Figure 13.
Additionally, the performance of the prediction algorithm was evaluated by testing the BHDS on the farm, and the results were compared with the ground truth, as shown in Table 4. The proposed algorithm achieved a maximum TRHDR of 90.38%, a competitive figure when compared to other methods used for fruit detection. For instance, Yu et al. [14] reported a model for detecting mature pomegranates with an average precision of 90.4%. The false prediction rate for Farm 2 was considerably lower than that obtained by the method presented in [26], which reported a false prediction rate of 16%. The causes of false prediction were consistent with those observed in the detection algorithm (Figure 12).

4. Discussion

This study presents a BHDS designed for real-time maturity assessment and detection under actual farm conditions using edge computing. Conventional object detection systems often rely on expensive hardware or require extensive pre-training and struggle to detect small, densely clustered objects, which limits their practical application in agricultural settings [43]. The BHDS overcomes these limitations by combining automated image acquisition, quality validation, and lightweight detection algorithms into a single, low-cost, and portable solution. Its ability to function reliably in unstructured agricultural environments, which involve occlusions, variable lighting, and diverse plant morphologies, makes it well suited for smallholder and resource-limited farming systems. The integration of image capture, preprocessing, detection, and prediction into a unified processing pipeline operating on a Raspberry Pi 4B reinforces the system’s suitability for in-field use. Furthermore, the dataset used in this research is publicly accessible for benchmarking and further development (https://doi.org/10.34740/KAGGLE/DSV/9337948 (accessed on 14 June 2025)).
The performance evaluation of BHDS across different white brinjal varieties and cultivation environments shows consistent results. The model achieved a precision of 87.48%, a recall of 87.61%, and an F1-score of 87.53%. Maturity prediction accuracy was measured at 89.80%, based on reliable size thresholds derived from real-time data. On average, each image was captured in approximately 3 s, and maturity prediction was completed in about 0.03 s, confirming the feasibility of real-time operation. The system was able to function continuously for over 7 h on a 10,000 mAh power bank, demonstrating its energy efficiency. In addition, the automated data collection module achieved a TDCAR of up to 98%, reflecting the system’s effectiveness in acquiring valid, well-framed training images. While these results are promising, some limitations were observed. Figure 14 illustrates cases in which the ultrasonic sensor provided incorrect distance measurements, leading to the capture of images that did not meet framing criteria. This issue likely stems from signal inconsistencies between the analog and digital components of the sensor.
Figure 15 presents the effect of direct sunlight, where specular reflection reduced detection accuracy. Tests were conducted primarily during early morning hours to mitigate this issue. Enhancing the sensor module with alternative distance-measuring technology and incorporating adaptive lighting compensation would help address these concerns. Currently, the system lacks autonomous mobility and requires manual movement, as no unmanned ground platform was employed in this version.
To contextualize the performance of BHDS, Table 5 compares several agricultural fruit detection systems.
Sepulveda et al. [30] used an SVM-based robot vision system for brinjal detection in controlled environments and reported 88.35% precision and 88.10% recall. YOLOv8 has been applied to tomato detection, achieving 73.5% precision and 76.9% recall, with a mAP@50 of 80.8% [44]. Although these systems demonstrate good performance, they rely on resource-intensive setups, including GPU-based training and curated datasets. The BHDS, however, delivers comparable or even higher accuracy while operating entirely on the CPU-based edge hardware. When YOLOv8 was tested on the same dataset collected by the BHDS, particularly in Farm 2, its performance declined, indicating sensitivity to real-time environmental variations. The BHDS’s use of high-resolution images (2000 × 2000 pixels) enhanced segmentation accuracy, albeit with slightly increased inference time compared to YOLO models that use 640 × 640 input sizes. A prior study on custard apple classification using an SVM model reported 100% accuracy [29]; however, this was achieved under strictly controlled lighting conditions. In the present study, the BHDS maintained stable performance in variable, real-world farm conditions, including occlusion and inconsistent lighting. The use of K-means clustering, region merging, and symmetry analysis enables the system to perform reliably without requiring GPU acceleration or large annotated datasets. This approach provides a practical solution for precision agriculture in environments where high-end resources are not available.

5. Conclusions

This study introduces the BHDS, an automated, real-time decision-making framework tailored for brinjal harvesting through edge computing. By integrating automated data collection, dynamic image quality assessment, and pixel-based brinjal detection, the system has demonstrated high precision in detecting harvest-ready brinjals. The proposed algorithm reduces computational demand, enabling real-time detection on a lower-power edge device, such as a Raspberry Pi, making it suitable for practical agricultural settings. The BHDS achieved a detection precision of 87.48%, an F1-score of 87.53%, and a prediction accuracy of 89.80%, while minimizing both time and energy consumption during data collection. The system’s portability and ease of implementation make it a valuable tool for autonomous robotic harvesters. This research provides important insights for the advancement of precision agriculture and highlights the practical application of detection algorithms in field conditions. Future work could focus on improving segmentation accuracy, expanding the system to accommodate other crops, and incorporating advanced machine learning techniques to enhance prediction accuracy and yield estimation, especially for detecting moderately mature brinjals. This study emphasizes the transformative role of edge computing in precision agriculture, presenting a scalable, energy-efficient solution that minimizes human intervention and enhances operational efficiency throughout the agricultural supply chain.

Author Contributions

Conceptualization, T.T., P.M. and S.-H.M.A.; formal analysis, T.T.; investigation, T.T.; methodology, T.T., P.M. and S.-H.M.A.; resources, T.T.; software, T.T.; supervision, P.M. and S.-H.M.A.; validation, T.T., P.M. and S.-H.M.A.; visualization, S.-H.M.A.; writing—original draft, T.T.; writing—review and editing, P.M. and S.-H.M.A. All authors have read and agreed to the published version of the manuscript.

Funding

This research received no external funding.

Data Availability Statement

Data supporting the findings of this study are available from the corresponding authors upon reasonable request.

Acknowledgments

The authors gratefully acknowledge S. Devanesamasilamani and Mahilampoo for generously allowing the testing of the system on their farms.

Conflicts of Interest

The authors declare no conflicts of interest.

References

  1. Sandhya, K. India: Production Volume of Eggplant 2023. Statista. Available online: https://www.statista.com/statistics/1038975/india-production-of-eggplant/ (accessed on 1 August 2024).
  2. Peng, J.; Zhao, Z.; Liu, D. Impact of agricultural mechanization on agricultural production, income, and mechanism: Evidence from Hubei province, China. Front. Environ. Sci. 2022, 10, 838686. [Google Scholar] [CrossRef]
  3. Kahya, E.; Ozduven, F.F.; Aslan, Y. YOLOv5 model application in real-time robotic eggplant harvesting. J. Agric. Sci. 2024, 16, 9. [Google Scholar] [CrossRef]
  4. Zeng, T.; Li, S.; Song, Q.; Zhong, F.; Wei, X. Lightweight tomato real-time detection method based on improved YOLO and mobile deployment. Comput. Electron. Agric. 2023, 205, 107625. [Google Scholar] [CrossRef]
  5. Jiao, Z.; Huang, K.; Wang, Q.; Zhong, Z.; Cai, Y. Real-time litchi detection in complex orchard environments: A portable, low-energy edge computing approach for enhanced automated harvesting. Artif. Intell. Agric. 2024, 11, 13–22. [Google Scholar] [CrossRef]
  6. Tang, Y.; Chen, M.; Wang, C.; Luo, L.; Li, J.; Lian, G.; Zou, X. Recognition and localization methods for vision-based fruit picking robots: A review. Front. Plant Sci. 2020, 11, 510. [Google Scholar] [CrossRef]
  7. Wan, S.; Goudos, S. Faster R-CNN for multi-class fruit detection using a robotic vision system. Comput. Netw. 2020, 168, 107036. [Google Scholar] [CrossRef]
  8. Zhuang, J.J.; Luo, S.M.; Hou, C.J.; Tang, Y.; He, Y.; Xue, X.Y. Detection of orchard citrus fruits using a monocular machine vision-based method for automatic fruit picking applications. Comput. Electron. Agric. 2018, 152, 64–73. [Google Scholar] [CrossRef]
  9. Song, Y. Application of image recognition technology in agriculture. In Proceedings of the International Conference on Electrical Engineering and Intelligent Control (EEIC 2024), Singapore, 11–13 October 2024; pp. 339–342. [Google Scholar]
  10. Dorj, U.O.; Lee, M.; Yun, S.S. An yield estimation in citrus orchards via fruit detection and counting using image processing. Comput. Electron. Agric. 2017, 140, 103–112. [Google Scholar] [CrossRef]
  11. Malik, M.H.; Zhang, T.; Li, H.; Zhang, M.; Shabbir, S.; Saeed, A. Mature tomato fruit detection algorithm based on improved HSV and Watershed algorithm. IFAC-PapersOnLine 2018, 51, 431–436. [Google Scholar] [CrossRef]
  12. Tu, S.; Xue, Y.; Zheng, C.; Qi, Y.; Wan, H.; Mao, L. Detection of passion fruits and maturity classification using Red-Green-Blue Depth images. Biosyst. Eng. 2018, 175, 156–167. [Google Scholar] [CrossRef]
  13. Li, T.; Fang, W.; Zhao, G.; Gao, F.; Wu, Z.; Li, R.; Fu, L.; Dhupia, J. An improved binocular localization method for apple based on fruit detection using deep learning. Inf. Process. Agric. 2023, 10, 276–287. [Google Scholar] [CrossRef]
  14. Yu, T.; Hu, C.; Xie, Y.; Liu, J.; Li, P. Mature pomegranate fruit detection and location combining improved F-PointNet with 3D point cloud clustering in orchard. Comput. Electron. Agric. 2022, 200, 107233. [Google Scholar] [CrossRef]
  15. Suo, R.; Gao, F.; Zhou, Z.; Fu, L.; Song, Z.; Dhupia, J.; Li, R.; Cui, Y. Improved multi-classes kiwifruit detection in orchard to avoid collisions during robotic picking. Comput. Electron. Agric. 2021, 182, 106052. [Google Scholar] [CrossRef]
  16. Rong, J.; Zhou, H.; Zhang, F.; Yuan, T.; Wang, P. Tomato cluster detection and counting using improved YOLOv5 based on RGB-D fusion. Comput. Electron. Agric. 2023, 207, 107741. [Google Scholar] [CrossRef]
  17. Li, T.; Sun, M.; He, Q.; Zhang, G.; Shi, G.; Ding, X.; Lin, S. Tomato recognition and location algorithm based on improved YOLOv5. Comput. Electron. Agric. 2023, 208, 107759. [Google Scholar] [CrossRef]
  18. Guo, J.; Yang, Y.; Lin, X.; Memon, M.S.; Liu, W.; Zhang, M.; Sun, E. Revolutionizing agriculture: Real-time ripe tomato detection with the enhanced tomato-YOLOv7 system. IEEE Access 2023, 11, 133086–133098. [Google Scholar] [CrossRef]
  19. Hou, G.; Chen, H.; Ma, Y.; Jiang, M.; Hua, C.; Jiang, C.; Niu, R. An occluded cherry tomato recognition model based on improved YOLOv7. Front. Plant Sci. 2023, 14, 1260808. [Google Scholar] [CrossRef]
  20. Wang, A.; Qian, W.; Li, A.; Xu, Y.; Hu, J.; Xie, Y.; Zhang, L. NVW-YOLOv8s: An improved YOLOv8s network for real-time detection and segmentation of tomato fruits at different ripeness stages. Comput. Electron. Agric. 2024, 219, 108833. [Google Scholar] [CrossRef]
  21. Hayashi, S.; Ganno, K.; Ishii, Y. Machine vision algorithm of eggplant recognition for robotic harvesting. J. Soc. High Technol. Agric. 2000, 12, 38–46. [Google Scholar] [CrossRef]
  22. Hayashi, S.; Ganno, K.; Ishii, Y.; Tanaka, I. Robotic harvesting system for eggplants. Jpn. Agric. Res. Q. 2002, 36, 163–168. [Google Scholar] [CrossRef]
  23. Chong, V.K.; Monta, M.; Ninomiya, K.; Kondo, N.; Namba, K.; Terasaki, E.; Nishi, T.; Goto, T. Development of mobile eggplant grading robot for dynamic in-field variability sensing: Manufacture of robot and performance test. Eng. Agric. Environ. Food 2008, 1, 68–76. [Google Scholar]
  24. Jian, S. Research on image-based fuzzy visual servo for picking robot. In Proceedings of the International Conference on Computer and Computing Technologies in Agriculture, Boston, MA, USA, 18 October 2008; pp. 751–760. [Google Scholar]
  25. Miraei Ashtiani, S.H.; Golzarian, M.R.; Baradaran Motie, J.; Emadi, B.; Nikoo Jamal, N.; Mohammadinezhad, H. Effect of loading position and storage duration on the textural properties of eggplant. Int. J. Food Prop. 2016, 19, 814–825. [Google Scholar] [CrossRef]
  26. Tamilarasi, T.; Muthulakshmi, P. Machine vision algorithm for detection and maturity prediction of Brinjal. Smart Agric. Technol. 2024, 7, 100402. [Google Scholar]
  27. Top Computer Vision Opportunities and Challenges for 2024. Available online: https://medium.com/sciforce/top-computer-vision-opportunities-and-challenges-for-2024-31a238cb9ff2 (accessed on 2 August 2024).
  28. Valente, J.; António, J.; Mora, C.; Jardim, S. Developments in image processing using deep learning and reinforcement learning. J. Imaging 2023, 9, 207. [Google Scholar] [CrossRef] [PubMed]
  29. Wakchaure, G.C.; Nikam, S.B.; Barge, K.R.; Kumar, S.; Meena, K.K.; Nagalkar, V.J.; Choudhari, J.D.; Kad, V.P.; Reddy, K.S. Maturity stages detection prototype device for classifying custard apple (Annona squamosa L.) fruit using image processing approach. Smart Agric. Technol. 2024, 7, 100394. [Google Scholar] [CrossRef]
  30. Sepulveda, D.; Fernandez, R.; Navas, E.; Armada, M.; Gonzalez-De-Santos, P. Robotic aubergine harvesting using dual-arm manipulation. IEEE Access 2020, 8, 121889–121904. [Google Scholar] [CrossRef]
  31. Eskiciogiu, A.M.; Fisher, P.S.; Chen, S. Image quality measures and their performance. IEEE Trans. Commun. 1995, 43, 2959–2965. [Google Scholar] [CrossRef]
  32. Shiddiq, M.; Arief, D.S.; Defrianto; Dasta, V.V.; Panjaitan, D.M.; Saputra, D. Counting of oil palm fresh fruit bunches using computer vision. J. Oil Palm Res. 2023, 35, 111–120. [Google Scholar] [CrossRef]
  33. MacQueen, J. Some methods for classification and analysis of multivariate observations. In Proceedings of the Fifth Berkeley Symposium on Mathematical Statistics and Probability, Volume 1: Statistics; University of California Press: Berkeley, CA, USA, 1967; pp. 281–297. [Google Scholar]
  34. Douglas, H.D.; Peucker, K.T. Algorithms for the reduction of the number of points required to represent a digitized line or its caricature. Cartographica 1973, 10, 112–122. [Google Scholar] [CrossRef]
  35. Ramer, U. An iterative procedure for the polygonal approximation of plane curves. Comput. Graph. Image Process. 1972, 1, 244–256. [Google Scholar] [CrossRef]
  36. Zhou, X.; Lee, W.S.; Ampatzidis, Y.; Chen, Y.; Peres, N.; Fraisse, C. Strawberry maturity classification from UAV and near-ground imaging using deep learning. Smart Agric. Technol. 2021, 1, 100001. [Google Scholar] [CrossRef]
  37. Parr, B.; Legg, M.; Alam, F. Grape yield estimation with a smartphone’s colour and depth cameras using machine learning and computer vision techniques. Comput. Electron. Agric. 2023, 213, 108174. [Google Scholar] [CrossRef]
  38. Zhang, X.; Toudeshki, A.; Ehsani, R.; Li, H.; Zhang, W.; Ma, R. Yield estimation of citrus fruit using rapid image processing in natural background. Smart Agric. Technol. 2022, 2, 100027. [Google Scholar] [CrossRef]
  39. Mayuri, A.V.R.; Manoharan, R.K.; Subramani, N.; Aridoss, M.; Galety, M.G. Robust facial expression recognition using an evolutionary algorithm with a deep learning model. Appl. Sci. 2023, 13, 468. [Google Scholar]
  40. Roboflow Everything You Need to Build and Deploy Computer Vision Models. Available online: https://roboflow.com (accessed on 24 August 2024).
  41. Carvalho, J.; Cunha, L.; Pinto, S.; Gomes, T. FESTA: FPGA-enabled ground segmentation technique for automotive LiDAR. IEEE Sens. J. 2024, 24, 38005–38014. [Google Scholar] [CrossRef]
  42. Liang, C.; Xiong, J.; Zheng, Z.; Zhong, Z.; Li, Z.; Chen, S.; Yang, Z. A visual detection method for nighttime litchi fruits and fruiting stems. Comput. Electron. Agric. 2020, 169, 105192. [Google Scholar] [CrossRef]
  43. Badgujar, C.M.; Poulose, A.; Gan, H. Agricultural object detection with You Only Look Once (YOLO) Algorithm: A bibliometric and systematic literature review. Comput. Electron. Agric 2024, 223, 109090. [Google Scholar] [CrossRef]
  44. Nahiduzzaman, M.; Sarmun, R.; Khandakar, A.; Faisal, M.A.; Islam, M.S.; Alam, M.K.; Rahman, T.; Al-Emadi, N.; Murugappan, M.; Chowdhury, M.E. Deep learning-based real-time detection and classification of tomato ripeness stages using yolov8 on Raspberry Pi. Eng. Res. Express 2025, 7, 015219. [Google Scholar] [CrossRef]
Figure 1. BHDS framework.
Agriengineering 07 00196 g001
Figure 2. Flowchart of the BHDS illustrating image capture, object detection, and maturity classification steps.
Agriengineering 07 00196 g002
Figure 3. BHDS pinout diagram.
Agriengineering 07 00196 g003
Figure 4. Background removal process using HSV thresholding and mask inversion to isolate brinjal regions.
Agriengineering 07 00196 g004
Figure 5. Elimination of non-target regions through grayscale conversion, binary thresholding, and morphological filtering.
Agriengineering 07 00196 g005
Figure 6. Brinjal detection pipeline including clustering, segmentation, symmetry analysis, and object localization.
Agriengineering 07 00196 g006
Figure 7. Structural layout of farms: (a) Farm 1 and (b) Farm 2.
Agriengineering 07 00196 g007
Figure 8. Efficiency of pixel elimination: (a) source; (b) without background; (c) interested regions.
Agriengineering 07 00196 g008
Figure 9. Pixel segmentation—manual vs. predicted: (a) brinjal without shadow and (b) brinjals with less amount of shadow.
Agriengineering 07 00196 g009
Figure 10. Performance of proposed method at pixel level: (a,b) IoU score and standard error in brinjal detection in Farm 1 and Farm 2, respectively; (c,d) frequency of IoU in Farm 1 and Farm 2, respectively.
Agriengineering 07 00196 g010
Figure 11. Sample images with different growing circumstances and their detection: (a) single brinjal; (b) multiple separated brinjals; (c) multiple brinjals close to each other; (d) clustered brinjals; (e) clustered and separated brinjals; (f) bottom of leaves; (g) occluded by brinjal; (h) occluded by leaves; (i) occluded by leaves and brinjal.
Agriengineering 07 00196 g011
Figure 12. False positives vs. false negatives: (top row) high false positive rate due to sky influence in the image, and (bottom row) low false negative rate due to distinctly visible brinjal.
Agriengineering 07 00196 g012
Figure 13. Mature brinjal prediction in various growing circumstances: (a,d) single and multiple prediction; (b,e) occluded brinjal prediction; (c,f) prediction from cluster.
Agriengineering 07 00196 g013
Figure 14. Examples of images captured outside optimal camera-to-object distance range due to ultrasonic sensor inaccuracies.
Agriengineering 07 00196 g014
Figure 15. Illustration of specular reflection caused by direct sunlight on brinjal surface.
Agriengineering 07 00196 g015
Table 1. Performance evaluation of different detection models on two farm datasets.
ModelDatasetPrecision (%)Recall (%)F1-Score (%)
Proposed methodFarm188.5986.4487.50
Farm286.3688.7887.55
Method from [26]Farm192.2482.9487.34
Farm274.0088.0980.43
YOLO8Farm174.1096.4083.79
Farm259.3062.9061.05
Table 2. Performance evaluation based on average processing time per image.
MethodAverage Time (s)
Farm 1Farm 2
RoITCCBLBTotalRoITCCBLBTotal
Proposed0.341.820.860.033.050.312.890.80.044.04
[26]-22.830.220.1523.2-22.110.260.1422.51
RoIT: region of interest time; C: clustering; CB: confirmation of brinjal; LB: localization of brinjal.
Table 3. Efficiency evaluation of data acquisition.
FarmCaptured ImagesCurated ImagesNPITDCAR (%)Error Rate (%)Avg. Time (s)
Farm 19125249822.33
Farm 111350489642.15
Farm 1162757194.665.342.23
Farm 1252100959552.34
Farm 212050479463.44
NPI: number of perfect images; TDCAR: training data collection accuracy rate.
Table 4. Performance evaluation of prediction method.
Test FieldGround Truth Actual Detection True
Detection
Missed Detection False
Detection
TRHDR (%)MRHDR (%)FRHDR (%)
Farm 15254475790.389.6112.96
Farm 265765871189.2310.7614
TRHDR: true ready to harvest detection rate; MRHDR: missed ready to harvest detection rate; FRHDR: false ready to harvest detection rate.
Table 5. Comparison of fruit detection systems in agricultural applications.
StudySensors UsedHardware PlatformDetection MethodTarget FruitResults
[29]-Raspberry Pi 4BSVMCustard Apple100% accuracy
[30]Prosilica GC2450C, Mesa SwissRangerIntel i7-4790SVMBrinjal88.35% precision; 88.10% recall
[44]Pi cameraRaspberry Pi 4BYOLOv8Tomato73.5% precision; 76.9% recall;
80.8% mAP@50
This workPi camera, ultrasonic sensor, LEDs, buzzerRaspberry Pi 4BK-means clustering, region merging, symmetry analysisBrinjal87.48% precision; 87.61% recall; 87.53% F1-score
Disclaimer/Publisher’s Note: The statements, opinions and data contained in all publications are solely those of the individual author(s) and contributor(s) and not of MDPI and/or the editor(s). MDPI and/or the editor(s) disclaim responsibility for any injury to people or property resulting from any ideas, methods, instructions or products referred to in the content.

