Abstract
Background: The growing global demand for grains and the pursuit of greater efficiency in agroindustrial production processes have fueled scientific interest in technologies for automatic visual inspection of agricultural grains (AVIAG). Despite the increasing number of studies on this topic, few have addressed the practical implementation of these technologies within industrial environments. Objective: This study aims to investigate the technological demands, analyze the potential applications, and identify the challenges for technology transfer of AVIAG technologies to the agroindustrial sector. Methods: The methodological approach combined a comprehensive literature review, which enabled the mapping of AVIAG technology applications and technological maturity levels, with a structured survey designed to identify practical demands, challenges, and barriers to technology transfer in the agricultural sector. Results: The results show that most of the proposed solutions exhibit low technological maturity and require significant adaptation for practical application, which undermines the discussion on technology transfer. Conclusions: The main barriers to large-scale adoption of AVIAG technologies include limited dissemination of scientific knowledge, a shortage of skilled labor, high implementation costs, and resistance to changes in production processes. Nonetheless, the literature highlights benefits, such as increased automation, enhanced operational efficiency, and reduced post-harvest losses, which reinforce the potential of AVIAG technologies in advancing the modernization of the agroindustrial sector.
1. Introduction
The agroindustrial sector plays a critical role in the global economy, especially as agriculture remains essential for food security, employment, and sustainable development worldwide. The projected 25% increase in the global population by 2050, reaching 9.7 billion people, demands a transformation from traditional agricultural methods to advanced, technology-driven systems [1,2,3,4]. This transformation must ensure not only higher productivity but also sustainability across the entire food production chain [2,5,6].
Among the major challenges facing the agroindustrial sector is the need for accurate visual inspection processes. These are essential to ensure product quality and determine commercial value. Currently, inspections are often conducted manually, which introduces subjectivity, inconsistency, and lack of standardization [7,8,9]. In this context, computational tools for automating visual quality inspection offer competitive advantages. They increase throughput, enhance precision, and promote standardization [8,10].
The automation of agricultural processes has become essential with the advancement of Precision Agriculture (PA) and Agriculture 5.0 (A5.0). These paradigms advocate for the use of advanced technologies to optimize decision-making and improve production efficiency, while supporting sustainable practices [11]. PA typically focuses on geolocation and remote sensing to optimize resource use, while A5.0 emphasizes full digital integration. This includes the use of the Internet of Things (IoT), Big Data, Cloud Computing, Artificial Intelligence (AI), and Computer Vision (CV) [12].
In this broader context, AI and CV have enabled the development of intelligent systems for automatic visual inspection of agricultural products throughout the supply chain. A prominent example is the inspection of grains in the post-harvest stage [11].
Grains serve as a nutritional base for billions of people and account for 91% of all crops grown globally. China, the United States, India, and Brazil produce more than 50% of global output. In 2021, grain production exceeded 3 billion tons, with Brazil exporting around 130 million tons—approximately 6% of the global total [7,8,13].
Given this scale, ensuring grain quality is essential to meet market demands and promote economic and social stability. Visual inspection plays a vital role in ensuring compliance with quality standards, which impacts food safety, public health, international trade, and producer competitiveness [7,8,14]. These inspections involve the analysis of physical (e.g., size, color, defects), chemical (e.g., moisture, protein), and biological characteristics (e.g., pests, fungi), as well as adherence to regulatory standards [7,13,15].
Scientific interest in automatic visual inspection of agricultural grains (AVIAG) has increased significantly in recent decades. Although not yet standardized in international literature, the acronym AVIAG is used throughout this study for clarity and consistency. From 2015 to 2024, a literature review conducted by the authors identified 137 studies focusing on AVIAG. These studies explore applications such as grain classification [8,16,17,18,19] and defect detection [8,14], serving as decision support for production processes.
Despite this progress, several gaps persist. Most published studies focus on technical performance, particularly algorithm development, without exploring real-world applicability or the process of transferring these solutions to industrial contexts [7,8,14,20,21,22,23]. Moreover, none of the reviewed studies directly addressed technology transfer. This leads to a disconnect between scientific advances and their implementation at scale.
In this context, critical gaps were identified, including the limited understanding of researchers’ motivations for proposing AVIAG technologies, a potential disconnection between academic research and the actual needs of the agroindustry, as well as possible barriers that prevent effective technology transfer to the agroindustrial sector.
To address the identified gaps, this study combines a literature review, aimed at mapping the main applications and technological maturity levels of AVIAG systems worldwide, with a structured survey to identify the technological demands, potential applications, and challenges for technology transfer to the agroindustrial sector. By integrating these two complementary approaches, the study provides a comprehensive overview of the current development and adoption scenarios of AVIAG technologies, contributing to a better understanding of their role in promoting sustainable, efficient, and innovation-driven agricultural systems.
2. Background and Literature Review
This section presents the main concepts and a detailed literature review on AVIAG technologies, supporting the understanding of the research gaps investigated in this study.
2.1. Automatic Visual Inspection of Agricultural Grains—AVIAG
Agricultural grain quality inspection is essential for ensuring food safety, public health, and compliance with market standards. It also directly influences commodity prices, international trade, and the global competitiveness of producers, playing a vital role in the integrity and sustainability of the agro-industry [14].
Grain quality assessments typically include physical, chemical, and biological evaluations. Physical analyses examine attributes such as size, shape, color, and integrity. Chemical analyses focus on moisture content, proteins, lipids, fiber, and other key constituents. Biological evaluations detect the presence of fungi, bacteria, insects, and other microorganisms that may indicate contamination or pose risks to human and animal health [7,13,15].
Visual quality inspection specifically targets parameters like size, color, external damage, and the presence of insects, leaves, twigs, or other foreign matter. In Brazil, for example, this process is detailed by technical standards issued by the Ministry of Agriculture, Livestock and Supply (MALS), which establish classification protocols for rice, beans, corn, soybeans, and wheat [13].
Despite traditional visual grain inspection methods ensuring regulatory compliance, they rely heavily on human perception and manual processes, making them prone to subjectivity, operator inconsistency, and lack of standardization, especially when applied on a large scale in industrial settings [7,8]. These limitations motivate the development of AVIAG systems capable of replicating and improving the visual inspection process.
An AVIAG system captures grain images using cameras and applies computer vision techniques combined with artificial intelligence or statistical algorithms to automatically classify them and detect defects based on visual features such as color, shape, size, texture, and impurities. These systems typically include conveyor belt, lighting chambers, image acquisition units, and embedded processors, as showed in Figure 1.
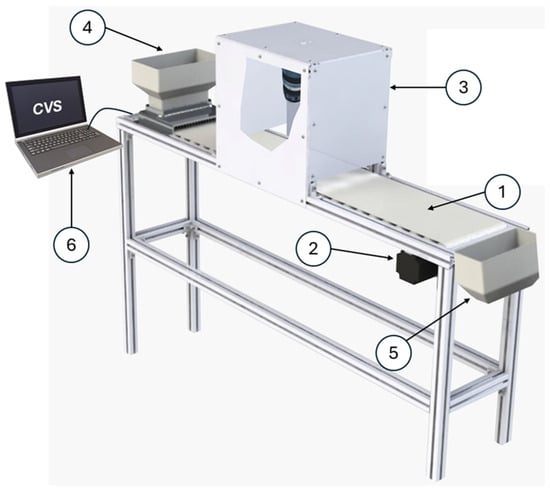
Figure 1.
Typical equipment for automatic visual inspection of grains. (1) Conveyor belt; (2) Motor that drives the conveyor belt; (3) Image acquisition chamber, including internal lighting and a digital camera; (4) Feeder that receives the grains to be inspected; (5) Collection bin for receiving inspected grains; (6) Computer to control hardware and software.
It is important to highlight that individual setups may vary, and some equipment can be more sophisticated depending on the specific application or research purpose. However, this variability does not invalidate the illustrative and conceptual role of Figure 1, which is intended to provide a general overview of the main components that constitute computer vision systems used for automatic visual inspection of agricultural grains.
2.2. Literature Review on AVIAG
Based on the eligibility criteria presented in Section 3.1, a total of 137 studies published over the past decade were identified in the literature proposing technologies for AVIAG (Appendix A). The purpose of this stage was to systematically map and synthesize the studies addressing AVIAG systems, in order to identify the most relevant applications, technological approaches, and maturity levels reported in the field.
The reviewed studies were authored by researchers from 27 countries. The most frequent contributors were: India, with 33 publications (24.1%); China, with 28 publications (20.4%); Brazil, with 18 publications (13.1%); followed by the United States, Iran, Pakistan, and several other countries.
Rice stands out as the most frequently addressed grain in the studies, appearing in 43% (59) of the publications. It is followed by wheat (28%, 39 studies), maize (18%, 26 studies), beans (7%, 10 studies), and soybeans (5%, 7 studies). The predominance of rice-related research is likely due to its status as one of the most widely consumed grains globally, especially in countries like China, where it serves as a staple food for more than half of the population. Wheat’s relevance is tied to its essential role in products such as bread and pasta, while the prominence of maize reflects its dual purpose in both human and animal nutrition. In contrast, beans, despite their cultural and dietary significance in countries like Brazil, receive less international scientific attention, given their relatively lower economic impact on the global food chain. Soybeans, although highly produced worldwide, are less studied in the context of visual inspection, as quality assessment for this grain tends to rely more on industrial processing parameters than on post-harvest visual characteristics.
Given the large number of studies identified in the literature, they were analyzed in a grouped manner to enable a more structured evaluation. The classification summarized in Appendix A considered the type of proposal, the technique or algorithm employed, the type of image analyzed, and the type of feature extracted for visual pattern recognition. Additionally, particular attention was given to hardware-based solutions, which generally exhibit higher levels of technological maturity, in order to highlight the most relevant and application-oriented contributions reported in the literature.
Regarding their proposal, the studies were classified into four categories: development of new methods (MET)—92 studies; comparison of methods (CMP_MET)—36 studies; development of new methods with hardware implementation (MET + HDW)—8 studies; and comparison of methods with hardware implementation (CMP_MET + HDW)—1 study. In the MET category, several studies reported high-accuracy results. For example, Anami et al. [24] developed a method based on color features (COL) to recognize rice varieties, achieving an average accuracy of 94.33%; Lin et al. [17] proposed a system based on convolutional neural networks (CNNs) to classify rice varieties, reaching 95.5% accuracy and outperforming traditional machine learning methods; and Qadri et al. [16] introduced a method based on the Logistic Model Tree (LMT) algorithm to discriminate Asian rice varieties, with an accuracy of 97.4%. Other noteworthy examples include Li et al. [25], who used a CNN ResNet50 (residual network with 50 layers) to identify maize varieties, achieving 91.23% accuracy, and Jollet et al. [26], who applied Mask R-CNN (mask region-based) to evaluate bean quality, obtaining up to 95.5% accuracy.
In the CMP_MET category, several studies provided detailed evaluations of various algorithms. Kılıçarslan et al. [27] compared deep learning (DL) and machine learning (ML) methods, such as MobileNetV2 and EfficientNetV2B0 CNNs, Support Vector Machines (SVM), Random Forest, and Artificial Neural Networks (ANN), and reported a maximum accuracy of 98.65% using SVM for wheat classification. Rathnayake et al. [19] explored seed age classification in Japanese rice using a cascading model of boosting algorithms including eXtreme Gradient Boosting (XGBoost), Categorical Boosting (CatBoost), and Light Gradient Boosting Machine (LightGBM), demonstrating superior performance over 13 algorithms based on metrics such as precision and F1-score. Nayak et al. [28] compared XGBoost, SVM, and other techniques for classifying seven bean varieties, with XGBoost achieving the highest accuracy of 97.32%. Additionally, Huang et al. [20] employed a PointNet++ CNN—an architecture that consumes point clouds—for classifying filled and unfilled grains, achieving 98.5% accuracy, while Yasar [29] used pretrained CNNs and SVM to classify wheat varieties, reaching up to 97.57% accuracy.
In the MET + HDW and CMP_MET + HDW categories, some prominent studies can be highlighted for their methodological and technological contributions. Antonucci et al. [18] developed a conveyor belt prototype for rice grain classification, achieving over 99% accuracy. Fan et al. [14] designed a dual-camera computer vision system (CVS) to detect defects in rice, wheat, and sorghum grains, reporting an average accuracy of 98.4% and performance approximately 20 times faster than manual inspection. Shen et al. [30] integrated visible and near infrared spectroscopy with computer vision to identify fungal contamination in maize, achieving up to 95% precision and 100% accuracy. Belan et al. [8] developed a real-time CVS for classifying and identifying major defects in Brazilian beans, reporting classification accuracy of 97.8% and defect detection rates above 81.9%. Other examples include Liu et al. [31], who developed a CVS to identify maize varieties with accuracies of 94.56% and 98.13%, and Gao et al. [32], who proposed a CVS that captures spatial and spectral information from 3D hyperspectral images of rice grains, achieving classification recall of 95%.
The techniques employed in the reviewed studies were grouped into four main categories: ML, DL, a combination of ML and DL, and statistical (ST) methods. Among these, ML stands out as the most frequently used, appearing in 68 studies. One example is Liu et al. [33], who developed a method to assess the purity of maize seeds based on multiple features extracted from RGB images, achieving accuracies of 96.7% and 88.7%. Similarly, Gao et al. [34] combined ML with 3D hyperspectral imaging for rice grain analysis, reaching 97.5% accuracy. Antonucci et al. [18] also applied ML in a conveyor-based prototype for grain classification.
DL was employed in 41 studies. For instance, Fan et al. [14] implemented an efficient dual-camera visual inspection system for rice grains, while Gao et al. [34] used CNNs to enhance the accuracy of hyperspectral data analysis. Zhou et al. [35] applied deep learning techniques for automated segmentation and classification of grains in RGB images.
A total of 16 studies applied combined ML and DL approaches, as Yasar [29] that combined CNN and SVM techniques for the classification of bread wheat seeds. Finally, statistical methods were used in 12 studies. Antonucci et al. [18], for example, explored histograms and texture analysis for rice grain classification, and Payman et al. [36] developed a vision system for the geometric characterization of rice grains based on statistical features.
Regarding the type of image used, standard RGB images were the most predominant, appearing in 106 studies. These include the work of Antonucci et al. [18], who employed conveyor-based prototype for rice grain classification; Liu et al. [33], who investigated maize seed purity; and Zhou et al. [37], who explored automated grain segmentation and classification. Additionally, studies by Shen [38] and Cisneros-Carrillo et al. [39] combined RGB and thermal images (THE) to conduct analyses beyond visual inspection. Hyperspectral images (HYP) were used in 23 studies, such as Gao et al. [34], who developed a high-precision method for processing hyperspectral data, and Fan et al. [14], who used these images for efficient grain inspection. In contrast, three-dimensional (3D) images were explored in a smaller number of studies (6), with Gao et al. [34] standing out for combining 3D and hyperspectral imaging in advanced grain analysis.
With respect to the type of feature extracted from of images, ST features were the most frequently used, appearing in 51 studies. Examples include Antonucci et al. [18], who analyzed textures and histograms for grain classification, and Gao et al. [34], who used these features to enhance hyperspectral image analysis. Hierarchical and abstract representations (HAR) were explored in 43 studies, such as Fan et al. [14], who employed CNNs to extract high-level abstractions; Gao et al. [34], who applied abstract representations to hyperspectral data; and Zhou et al. [35], who used hierarchical representations in RGB images for grain segmentation and classification. Geometric features (GEO) were used in 12 studies, including Payman et al. [36], who focused on grain shape and size analysis, and Antonucci et al. [18], who considered perimeter and area for rice grain classification. Additionally, 31 other studies employed alternative or combined descriptors, such as Xu et al. [40], who combined color (COL), statistical, and geometric features for maize seed varietal classification.
In general, the reviewed studies demonstrate the evolution of technologies applied to grain analysis, particularly highlighting the increasing use of hyperspectral imaging and deep learning. These advances have significantly contributed to the improvement of inspection methods, reinforcing the growing importance of computer vision in agriculture and the agroindustrial sector. Moreover, the findings reveal a broad range of prominent applications in the agricultural sector, which can be grouped into two main types of application: varietal classification, and defect detection and quality analysis, as described below.
- Varietal classification: one of the most prominent applications lies in the classification of grain varieties, which is crucial for ensuring seed purity and optimizing agricultural management. For example, Qadri et al. [16] demonstrated the ability of machine learning techniques to differentiate rice varieties cultivated in different Asian countries, achieving 97.4% accuracy. Similarly, Lin et al. [17] reached 95.5% accuracy using CNNs to discriminate rice varieties, outperforming traditional methods, while Belan et al. [8] developed a CVS to classify Brazilian beans, reporting a classification accuracy of 97.8%. These examples show how current technologies enable faster and more accurate identification of grain varieties, with direct impacts on marketing and agricultural planning.
- Defect detection and quality analysis: this is another frequently reported application. Fan et al. [14], for example, presented a CVS to identify defects in cereal grains with high efficiency, while Belan et al. [8] developed a real-time system capable of detecting major defects in Brazilian beans, with detection rates above 81.9%. Such technologies play a critical role in reducing subjectivity, increasing consistency, ensuring safety, commercial value, and processing efficiency of agricultural grains.
In addition, the technologies presented also play a central role in supporting decision-making within agricultural production processes, contributing to increased efficiency and cost reduction. For instance, Antonucci et al. [18] developed a conveyor belt prototype integrated with computer vision to optimize rice yield by automating the classification process. Rathnayake et al. [19] proposed boosting-based models to predict seed age, providing valuable information to improve germination rates and crop productivity. Belan et al. [8] also developed a device capable of analyzing a 250 g sample of beans in approximately 40 s, in accordance with the Brazilian grain quality inspection standard.
In summary, the reviewed applications demonstrate how the integration of computational methods and advanced hardware is transforming the agricultural sector by offering more accurate, faster, and more efficient solutions to longstanding challenges such as classification, quality analysis, and production management. In addition to contributing to agricultural sustainability by improving upon traditional inspection methods, these technologies enhance the sector’s competitiveness by meeting the growing demand for efficiency and quality in food production.
However, although many authors highlight the technological innovations introduced—particularly in terms of algorithms, combinations of computational methods, and solutions potentially adaptable to industrial environments—few explicitly discuss how these solutions could be implemented in real industrial settings, as done by Antonucci et al. [18], Belan et al. [8], and Fan et al. [14]. It is also noteworthy that none of the reviewed studies addressed the topic of technology transfer.
Of the 137 identified studies, only the nine listed in Table 1 proposed a solution that incorporated hardware components. In these studies, the hardware is described by the authors as a prototype, device, or equipment, while the proposed image analysis method serves as the software responsible for controlling the AVIAG system. These studies show potential for delivering solutions with higher levels of technological maturity, as measured by Technology Readiness Level (TRL), a scale originally proposed by NASA (National Aeronautics and Space Administration) and later adapted by various national and international innovation agencies. The TRL scale ranges from Level 1 (basic principles observed) to Level 9 (actual system proven in an operational environment). Thus, solutions presenting functional prototypes or integrated systems tested under real or near-real operating conditions demonstrate the highest degrees of maturity. It is important to note that the classification of these solutions according to TRL levels was established through consensus among five individuals with recognized expertise in technological development, including three co-authors of the present study.

Table 1.
Literature studies proposing hardware for AVIAG.
These studies propose AVIAG systems focused on the classification and defect inspection of grains, covering crops such as rice, maize, wheat, sorghum, and beans. In general, the proposals share common features such as the use of advanced image analysis and computer vision methods based on ML and DL, along with integration of specific hardware components like conveyor belts, high-resolution cameras, and controlled lighting systems. Techniques applied include CNNs, principal component analysis, and algorithms such as SVM, decision trees (DT), and linear discriminant analysis (LDA). Most studies reported high accuracy rates, exceeding 95%,for both classification tasks and defect detection.
In terms of TRL, the AVIAG systems presented range from TRL 3, corresponding to early laboratory validation, to TRL 6, indicating proximity to application in operational or industrial environments. Studies with AVIAG system classified as TRL 3 or 4, such as Payman et al. [36], Gao et al. [34], and Xu et al. [40], propose systems still in the early stages, with strong performance metrics in controlled settings but facing significant challenges for real-world deployment. Limitations include dependency on ideal conditions and difficulty adapting to industrial environments.
On the other hand, AVIAG systems classified as TRL 5 or 6, such as those proposed by Antonucci et al. [18], Liu et al. [33], Shen et al. [38], and Chen et al. [23], demonstrate greater technological maturity, having been validated in relevant environments and yielding promising results for grain classification and defect detection. However, the systems proposed in these works still face limitations, such as the need for specific calibration for different grain varieties and operational difficulties under adverse conditions.
The AVIAG systems proposed by Fan et al. [14] and Belan et al. [8], both classified as TRL 6, stand out for their stronger alignment with real-world applications. Validated under simulated or actual operating conditions, these systems demonstrate clear commercial implementation potential. In particular, Belan et al. [8] employed low-cost materials to encourage adoption by small and medium-sized agricultural producers. However, despite these advancements, broader validation under diverse operational scenarios is still needed to ensure large-scale robustness. A clear example of this limitation lies in the system developed by Belan et al. [8], which was designed to process only three varieties of Brazilian beans.
Overall, the studies associated with lower TRLs present strong scientific and technological potential but still require significant development to reach higher levels of maturity. Meanwhile, intermediate-TRL systems are progressing toward practical application but must overcome specific challenges related to scalability, adaptation to real-world conditions, and cost reduction. Finally, AVIAG systems classified at higher TRLs indicate greater commercial feasibility, although they still demand additional validation for market consolidation.
Advancing technological maturity is essential for the automation and efficiency of grain inspection. Investments in research, development, and collaborative partnerships are crucial to overcoming limitations and enabling practical use of the technologies identified in the literature. For agricultural modernization, it is necessary to address key challenges such as cost reduction, the development of affordable equipment for small and medium producers, scalability to uncontrolled environments, and broader generalization to support different crops and grain varieties.
3. Methodological Approach
This study adopts a two-stage methodological approach. First, a global literature review was conducted to synthesize the state of the art and map the main applications and technological maturity levels of AVIAG systems reported worldwide. Second, a structured survey was carried out in Brazil to identify the technological demands of the agroindustrial sector and to analyze the main challenges and barriers that hinder the effective transfer and adoption of these technologies at the national level. Together, these complementary methods provide a consistent and multi-scalar framework for addressing the research gaps outlined in the introduction.
3.1. Procedures for Conducting Literature Review
The literature review was conducted according to the following steps: selection of scientific databases; definition of keywords and construction of the search expression; application of eligibility criteria; and analysis of the eligible publications. The last two steps followed the Preferred Reporting Items for Systematic Reviews and Meta-Analyses (PRISMA) methodology, proposed by Moher et al. [41], to reinforce rigor, transparency, and replicability of the review.
The keywords, as well as the search expression composed from their combination, are presented in Table 2, and the combination scheme is illustrated in Figure 2. The search was performed within the titles, abstracts, and keywords of the following databases: Scopus, Compendex, and Web of Science. These databases were selected for their access to high-quality academic references, ensuring that the research is supported by accurate, comprehensive, and up-to-date data aligned with the state of the art on the topic investigated in this study.
Table 2.
Set of keywords and search expression used to conduct the literature review.
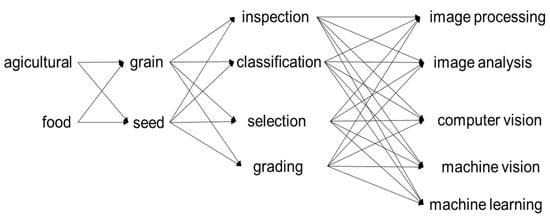
Figure 2.
Organization of keywords and related-terms in a tree structure.
Initially, the search in the databases resulted in 792 articles in which the title, abstract, or keywords contained the terms specified in the search expression. During the screening phase, 312 duplicate records were removed, resulting in 480 unique studies. From these, 137 articles were selected based on the following eligibility criteria: (i) original scientific articles published in journals; (ii) focused on the visual inspection of agricultural grains (rice, wheat, maize, soybean, and beans); (iii) use of computer vision, image processing, machine learning, or deep learning. Based on these criteria, the following were excluded: documents focused on non-grain products (e.g., fruits, vegetables) or on grains other than rice, wheat, maize, soybean, and beans; documents addressing other types of grain inspection (e.g., biological or chemical); and review papers, conference papers, patents, theses, and technical notes. It is worth noting that the focus of this research on the five most produced and consumed grains in Brazil (rice, wheat, maize, soybean, and beans) does not compromise its scientific validity, as the first four are also among the most widely produced and consumed grains worldwide. This criterion was adopted to ensure that the analysis focused on grains with the greatest economic and technological impact.
The reason for considering only the last decade in the literature review is related to the fact that this period concentrates most of the relevant publications on the topic, reflecting both the advancement of technologies applied to agriculture—such as computer vision, artificial intelligence, and embedded sensors—and the growing demand for more efficient and scalable solutions in the agroindustrial sector.
3.2. Survey and Data Collection Procedure
The survey was conducted using an online data collection instrument (the questionnaire presented in Appendix B), designed to assess participants’ knowledge and use of AVIAG technologies in the agroindustrial sector, as well as the challenges and barriers related to technology transfer in the agricultural sector. The questionnaire was structured into sections covering sociodemographic data, professional background, field of activity, and perceptions and knowledge regarding AVIAG technologies in the agroindustrial sector. It was applied between 20 November and 20 December 2024, targeting agricultural and agroindustrial workers and managers, faculty and students from undergraduate and graduate programs in agriculture and agribusiness, as well as researchers and developers of technologies for the automation of production processes, all within the Brazilian context.
The questionnaire was validated and tested based on the procedures described by Forza [42]. During the content validation phase, it was reviewed by three experts in the fields of Computer Science and Production Engineering to ensure comprehensive coverage of the aspects relevant to the research topic. In the pilot testing phase, the questionnaire was administered to a group of five participants representative of the target audience, with the aim of identifying potential comprehension issues, ambiguities, or difficulties in answering.
After the data collection period, the responses were analyzed using descriptive statistics, including measures of dispersion as well as absolute and relative frequencies to summarize the information obtained. The results were presented through graphs generated in Microsoft Excel, to facilitate the interpretation and visualization of identified patterns.
Finally, it is important to highlight that the procedure for data collection is in accordance with Article 1 of Resolution No. 510, of 7 April 2016, of the Brazilian National Health Council, available at: https://www.gov.br/conselho-nacional-de-saude/pt-br/atos-normativos/resolucoes/2016/resolucao-no-510.pdf/view (accessed on 15 June 2024).
4. Results
This section summarizes the main findings related to the research gaps concerning AVIAG technologies investigated in this study. Section 4.1 discusses the motivations, applications, technological maturity levels, challenges, and trends observed in recent literature, as summarized in Appendix A, whereas Section 4.2 focuses on the technological demands of grain quality inspection and the main barriers to technology transfer in the agricultural sector, based on data collected with the questionnaire presented in Appendix B. Finally, Section 4.3 presents a discussion of the results.
4.1. Motivations, Applications, Challenges, and Trends in the Development of AVIAG Technologies
The reviewed studies, authored by researchers from 27 countries, highlight the global relevance of AVIAG technologies. India and China stand out for their strong engineering and computer science research base, while Brazil demonstrates significant contributions from agricultural and food technology institutions, reflecting the country’s economic reliance on agribusiness.
Rice was the most frequently targeted grain by visual inspection technologies, likely due to its global economic and social relevance. As a staple food for more than half of the world’s population, improving its production efficiency and quality is essential. Moreover, rice grains exhibit relatively uniform visual characteristics, facilitating the application of computer vision techniques. Its production is concentrated in countries such as China and India, which stand out both for their investment in agricultural research and for leading AVIAG-related publications.
When comparing continents, publication data indicate that regions with higher agricultural production, such as Asia (49%) and the Americas (12%), lead in the number of studies, while the low contribution from Africa (1%) and Oceania (2%) points to areas with potential for scientific development. Overall, a significant correlation is observed between the volume of scientific publications on the topic and the levels of grain production and consumption. Countries with high production and consumption, such as Brazil, India, and China, also stand out among the main academic contributors. Moreover, five of the nine studies that propose products with higher technological maturity originate from Brazil and China [8,23,33,38,40]. These findings suggest that production and consumption may act as motivating factors for the development of AVIAG technologies. However, this relationship should not be interpreted as a rule, since the United States—despite its economic and technological relevance and high levels of grain production and consumption—contributes relatively modestly to the scientific literature on the topic.
The reviewed studies explore a variety of proposals, techniques, image types, and extracted features for visual pattern recognition. The main techniques applied include statistical methods, machine learning, and deep learning, with the latter showing increasing adoption in more recent publications. Regarding image types, RGB images remain predominant; however, there is a growing trend toward the use of hyperspectral images, particularly in analyses based on spectral signatures. As for the extracted features, statistical, geometric, and hierarchical/abstract representations stand out—the latter driven by the rise of deep neural networks.
AVIAG technologies are mainly applied in two types of application: (i) variety classification and (ii) defect detection and quality analysis. Variety classification is essential for ensuring seed purity and optimizing crop management, and it is widely addressed using machine learning algorithms and deep neural networks, as seen in studies such as [8,16]. Defect detection and grain quality analysis are key applications for quality control, helping reduce subjectivity and improve consistency, as demonstrated by Fan et al. [14]. These technologies serve as decision-support tools, as they help optimize and automate production processes, as illustrated in Antonucci et al. [18]. Despite these advances, few studies explicitly discuss the industrial applicability of these technologies, which poses a significant barrier to large-scale adoption.
In terms of technological maturity, only nine studies proposed AVIAG technologies combining hardware and software, classified between levels 3 and 7 on the TRL scale. Systems at TRL 3 or 4, such as those by Payman et al. [36] and Gao et al. [34], remain in early stages of laboratory validation and face significant limitations due to their dependence on controlled conditions. Studies at TRL 5 or 6, such as [18,38], were validated in relevant environments and show promising results, although they still face challenges such as the need for specific calibration for different crop types and adaptation to adverse industrial conditions. More advanced systems, such as those by Fan et al. [14] and Belan et al. [8], demonstrate higher commercial feasibility, having been tested in real-world conditions.
The reviewed literature reveals a significant research effort dedicated to the development of AVIAG technologies for the agricultural sector. The main contributions include:
- Automation and precision: The use of systems, such as those proposed by Antonucci et al. [18] and Belan et al. [8], has increased efficiency in identifying defects and impurities in grains.
- Accessibility: Equipment like the one proposed by Belan et al. [8] demonstrates the feasibility of low-cost solutions for grain inspection in testing laboratories and among small-scale farmers.
- Integrated analyses: Studies such as Gao et al. [34] show that combining visual inspection with other techniques, such as spectroscopy, can lead to more detailed and accurate analyses.
On the other hand, the challenges include:
- Field conditions: Many technologies are designed to operate under highly controlled environments and are not yet prepared to deal with adverse agricultural conditions (e.g., low lighting or dust presence).
- Costs: Advanced equipment, such as those proposed by Chen et al. [23] and Fan et al. [14], may involve high costs, limiting large-scale adoption, especially by small and medium-sized enterprises.
Although the analyzed studies demonstrate the significant potential of AVIAG technologies to modernize the agricultural sector and significant advancements have been reported, there are several challenges to the market transition of these technologies. Key obstacles include high costs, scalability to uncontrolled environments, the need for greater generalization to support different crop varieties, and the operational complexity of some systems. Overcoming these obstacles requires sustained investment in research and development, as well as the establishment of partnerships with the agricultural industry to validate and implement these solutions at scale. Moreover, addressing the challenges associated with increasing technological maturity is essential, as industrial-scale testing and strategies to bridge the gap between scientific research and real-world practice are crucial to reducing the disconnect between academic advances and their effective implementation in the agroindustrial sector.
4.2. Technological Demands in Visual Grain Quality Inspection and Challenges for Technology Transfer in the Agricultural Sector
The findings presented in this section are based on the data collected through the questionnaire developed for this research (Appendix B), which was answered by 100 participants. The responses provide a comprehensive overview of the respondents’ socioeconomic profile, as well as their knowledge, use, and perceptions of AVIAG technologies in the agroindustrial sector. Additionally, the data highlight the main challenges and barriers to technology transfer within the agricultural sector.
With respect to the respondents’ profile, the sample is predominantly composed of highly qualified professionals. Most participants reported advanced academic qualifications, including 21% with a bachelor’s degree, 14% with a specialization, 16% with a master’s degree, and 13% with a doctoral degree. Only a minority had lower levels of education. This indicates that the majority of respondents possess the academic background necessary to comprehend and critically evaluate technologies applied to agroindustrial sector, particularly those related to AVIAG.
Regarding their field of activity, 33% work directly in agriculture, while 44% are in academia (Education) and 7% work in research institutes as showed in Figure 3. Even among professionals in academia, some maintain practical experience with agricultural grains, which corroborates the importance of their responses. Nevertheless, 47% of participants reported working directly with the production, marketing, storage, or processing of agricultural products, reinforcing the sample’s representativeness in relation to the survey’s target audience.
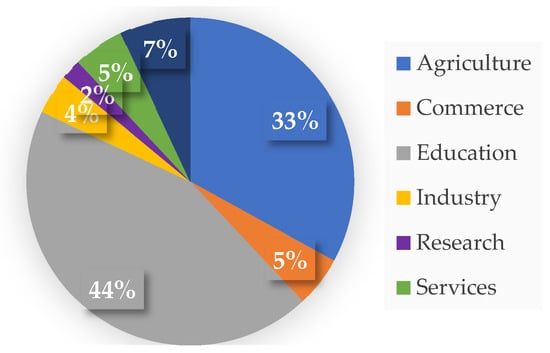
Figure 3.
Distribution of respondents by field of activity.
Among respondents directly linked to the agricultural sector, the majority (63%) have more than 10 years of experience (33% over 20 years), indicating familiarity with the processes and challenges of the production chain in this sector. On the other hand, 17% have up to five years of experience, which may indicate a greater openness to adopting emerging technologies, such as AVIAG. Regarding the hierarchical position of respondents, 52% perform operational or administrative functions, while 28% hold managerial or strategic positions, a relevant factor considering that the adoption of new technologies generally depends on the decisions of these higher levels.
Finally, among respondents whose professional activities are directly related to agricultural products, 49% reported working with grains. Although the remaining 51% are involved with other types of agricultural products, including fruits, vegetables, and legumes, which together account for 31%, this does not compromise the validity of the collected data, as automated visual inspection technologies are applicable across various segments of the agricultural sector. Therefore, the respondents’ profile aligns well with the objectives of this study, providing a reliable basis for analyzing the demands, challenges, and perceptions related to AVIAG technologies.
The distribution of respondents’ data according to the technologies used in their workplace (question 12), shows that the vast majority (89%) use only conventional technologies, while only 11% adopt modern technologies such as IoT, robotics, and AI in their work environments. Among those holding managerial or strategic positions and working directly with agricultural grains, only 18% (2 respondents) use modern technologies at their workplace. This suggests that individuals who could potentially promote the dissemination of modern grain inspection technologies currently lack access to them. This situation may contribute to the challenges and barriers preventing the large-scale adoption of AVIAG technologies.
Respondents were asked (question 13) about their knowledge of scientific studies proposing solutions for AVIAG. This question is crucial for understanding the factors that may hinder or prevent the adoption of such technological solutions in the agricultural sector. The response distribution is shown in Figure 4.
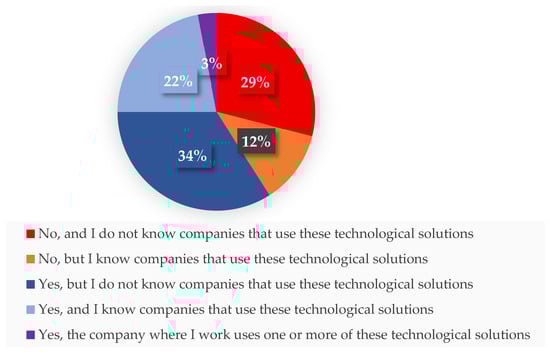
Figure 4.
Distribution of respondents according to their knowledge of studies proposing technologies for AVIAG.
The pattern of responses reveals potential gaps in the dissemination of research on the subject. A significant portion of respondents reported being unaware of existing scientific studies (41%) or lacking access to technological solutions (63%), which may negatively affect the acceptance and implementation of these innovations in the field. Notably, only 3% of participants indicated that their organization had already adopted a technological solution for AVIAG, highlighting a low rate of technology transfer (TT) to the agricultural sector. These findings underscore the importance of promoting training and scientific outreach initiatives to foster the adoption of innovative technologies in agriculture.
When asked about the importance of AVIAG technologies (question 14), 89% of respondents indicated that they consider them important for modernizing visual grain quality inspection tasks, as shown in Figure 5. These findings, when analyzed alongside the results from the previous question, underscore the need for increased investment in strategies that foster the integration of such technologies into the agricultural sector.
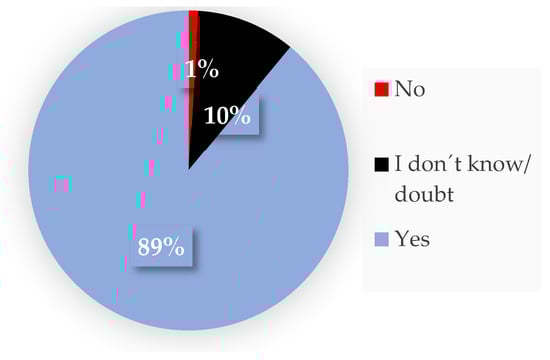
Figure 5.
Respondents’ perception of the importance of technologies for AVIAG.
The low adoption of scientific solutions in the agricultural sector may be related to the lack of financial incentives and public policies aimed at promoting innovation. Furthermore, strengthening partnerships between research institutions and companies can be a determining factor in the effective implementation of AVIAG technologies. In this sense, measures that favor the development of technological infrastructure, professional training, and expanded scientific dissemination represent promising paths to accelerate the modernization and competitiveness of the agricultural sector.
Question 15 (Figure 6) explores respondents’ perceptions of the contributions of AVIAG technologies to process efficiency, product quality, standardization, and competitiveness, thereby revealing the main technological demands of the agricultural sector.
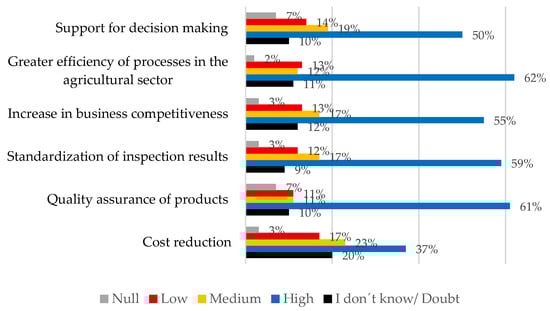
Figure 6.
Respondents’ Perception of the Contribution of AVIAG technologies.
As shown in Figure 6, respondents perceive AVIAG technologies to be of greater importance to process efficiency (62%), followed by quality assurance (61%), and standardization of results (59%). Over 57% indicated high levels of contribution from these technologies to decision-making support, increased business competitiveness, in addition to the gains in efficiency, standardization, and quality.
Considering specifically the 47% of participants whose activities are directly related to agricultural products, it was observed that over half believe that technological solutions contribute significantly to process efficiency in the sector. Similarly, almost half of this group positively assesses the impact of technologies on product quality assurance. These results indicate a consistent recognition of the benefits associated with modern automatic visual inspection technologies, in line with findings in the scientific literature, such as the studies by Anami et al. [24], Antonucci et al. [18], Belan et al. [18], and Fan et al. [14].
However, regarding cost reduction, frequently mentioned as a benefit in the reviewed studies, a significant percentage of respondents (20%) stated they were unaware of or expressed doubts about the financial impacts of AVIAG technologies. This lack of knowledge can represent a significant barrier to adoption, since return on investment is a decisive factor in the implementation of new technologies. Companies, cooperatives, and their managers may have difficulty visualizing immediate economic benefits, especially given the initial acquisition and maintenance costs, the need for integration with already established processes, and investments in workforce training.
In question 16, respondents were asked about the degree of influence of different factors that may hinder the adoption of AVIAG technologies. The distribution of responses, presented in the graph in Figure 7, supports the understanding of the challenges faced in the agricultural sector.
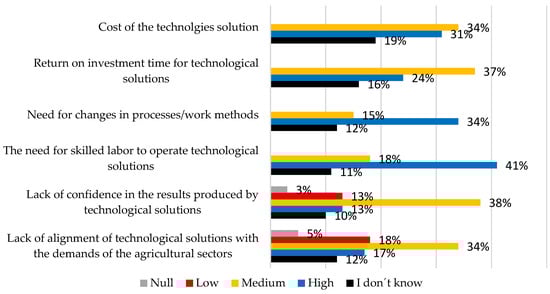
Figure 7.
Respondents’ perception of factors that hinder the use of AVIAG technologies.
Among the factors highlighted, the need for skilled labor appears to be one of the main barriers. Of the total respondents, 41% cited this aspect as having a significant impact on limiting the implementation of technological solutions. This rate is also significant among professionals directly involved with agricultural products: 34% (16 respondents) consider the requirement for professional qualifications to be a significant obstacle to the adoption of AVIAG technologies.
Another significant factor is cultural resistance to changes in agricultural production processes. Approximately 34% of respondents attributed a significant impact to the need for changes in traditional methods and ways of working—which highlights the difficulty in breaking with established practices, especially when there is uncertainty regarding the cost-benefit of new technologies, as highlighted in the previous question. Additionally, 12% of respondents stated they were unsure whether the factors presented favor the use of modern inspection technologies. This data reinforces the perception that there is still a lack of knowledge, information, and familiarity with the technological solutions available to the agroindustrial sector.
Finally, the respondents were asked (question 17) about factors considered most important for enabling the large-scale adoption of AVIAG technologies. The distribution of responses is presented in the graph in Figure 8, which shows that the main factors highlighted by respondents were workforce training (65%) and widespread dissemination of the technologies (53%), confirming patterns identified in previous questions. Among professionals directly involved with agricultural products, 69% (32 respondents) also indicated workforce training as a key factor for the adoption of these technologies.
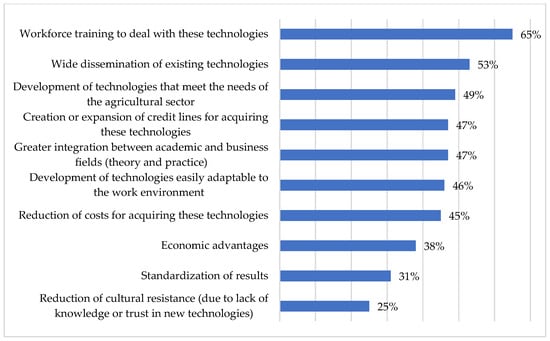
Figure 8.
Respondents’ perceptions of the most important factors for enabling the adoption of AVIAG technologies.
In addition, adequate workforce training can significantly contribute to reducing operational errors and increasing the reliability of inspection processes. Promoting technical training programs specifically focused on AVIAG could accelerate technology adoption and enhance the efficiency and competitiveness of the agricultural sector. In other words, workforce qualification may be a key factor in overcoming barriers that still hinder the adoption of modern automated visual inspection technologies.
Other factors also stood out in question 17 include:
- The development of technologies that address the specific needs of the agricultural sector (49%), consistent with the gap related to the disconnection between academic proposals and agroindustrial applications;
- Creation or expansion of credit lines (47%), cost reduction for technology acquisition (45%), and economic advantages (38%), which reflect uncertainties about the cost-benefit of these technologies;
- Stronger integration between academia and the productive sector (47%), indicating the limited awareness among many respondents regarding existing scientific work and inspection technologies;
- The development of technologies that are easily adaptable to the work environment (46%), aligned with concerns about the lack of qualified labor and the need for operational flexibility.
Questions 15 to 17 play an important role in linking the empirical results to the study’s objectives, as they capture complementary dimensions of the agricultural sector’s technological landscape. Question 15 (Figure 6) allowed us to identify how respondents perceive the contributions of AVIAG technologies to efficiency, quality, and competitiveness, outlining the sector’s main technological demands. Question 16 (Figure 7) allowed us to explore the barriers that hinder technology adoption and transfer, such as a lack of skilled labor, cultural resistance, and high implementation costs. Finally, question 17 (Figure 8) highlighted the key enablers for effective technology transfer, including workforce training, dissemination of scientific knowledge, and strengthening connections between academia and industry. Together, these findings provide a comprehensive overview of the agroindustrial sector’s needs and constraints, reinforcing the study’s focus on the demands, challenges, and opportunities for transferring AVIAG technologies to real-world production environments.
4.3. Discussion
Regarding the motivations for proposing technologies for AVIAG, the literature review revealed that, although there is a significant correlation between grain production and consumption volumes and the number of scientific publications on the subject in countries such as Brazil, China, and India, other factors also influence the direction of research. Elements such as technological advances, regulatory requirements, financial incentives, and specific challenges can also be decisive, as illustrated by the case of the United States, which, despite its significant economic and technological relevance and its high grain production and consumption volumes, contributes relatively little to the scientific literature in this field.
It was also found that most of the proposed AVIAG solutions are still at early stages of technological maturity, concentrated between TRL levels 3 and 5, corresponding to prototypes developed in laboratory settings or tested under highly controlled conditions. Only a few studies reach more advanced levels (TRL > 5), involving tests in real or near-real environments, as seen in the works [8,14,18].
Based on the survey results, the main demands and challenges for technology transfer in the agricultural sector were identified. Among the most relevant demands are:
- Workforce training: 41% of respondents pointed to the lack of qualified professionals as a major obstacle to the adoption of AVIAG technologies, highlighting the need for specialized technical training to support the implementation of these solutions.
- Wider dissemination of technologies: The low adoption rate of AVIAG solutions may also be related to the lack of knowledge about their benefits and applications. Only 3% of respondents reported having had contact with an actual implementation of AVIAG technologies, while 63% were unaware of the existence of such scientific solutions. This indicates the need to strengthen both scientific communication and industry outreach. It is also worth noting the low presence of non-academic institutions among the affiliations of authors in the reviewed literature, suggesting limited cooperation between academia and industry. Nevertheless, 89% of participants acknowledged the importance of using automated technologies to improve efficiency in grain quality inspection—a view consistent with studies such as Fan et al. [14] and Belan et al. [8], which report high accuracy rates (above 95%) in various applications.
- Financial support and incentives: 47% of respondents stated that the creation or expansion of credit lines is essential for enabling the adoption of AVIAG technologies. Acquisition and maintenance costs are seen as significant barriers, especially for small and medium-sized producers.
The main challenges to technology transfer identified in the study include:
- Adaptation to field conditions: Many technologies are still limited to laboratory environments and face difficulties operating under real agricultural conditions, such as environmental variability, lighting issues, or the presence of dust. This limitation is also present in some higher-TRL solutions, such as those proposed by Shen et al. [38], Chen et al. [23], Liu et al. [33], Antonucci et al. [18], Belan et al. [18], and Fan et al. [14]. The fact that only 3% of respondents work in companies that have implemented AVIAG solutions suggests a gap between industry expectations and the actual maturity of these technologies.
- Cultural resistance and lack of technological acceptance: 34% of respondents identified resistance to changes in production processes as a high-impact factor affecting adoption. Many producers still rely on traditional methods and are hesitant to invest in automated solutions.
- High cost and economic feasibility: The implementation of some modern technologies requires significant upfront investment, which can discourage small and medium producers. Moreover, the lack of clarity about the financial return makes large-scale adoption even more difficult. While some systems, such as that proposed by Belan et al. [8], were developed as low-cost solutions for small enterprises or labs, advanced equipment, like those in [14,23], still involve high costs, limiting their commercial application. Respondents likely lack access to clear data on the economic benefits of such technologies, which further hinders trust and adoption. The literature itself rarely explores implementation costs in detail, reinforcing this uncertainty.
This study shows that, despite the high potential of AVIAG technologies to modernize agribusiness, their adoption still faces structural, technical, and cultural barriers. Overcoming these challenges requires coordinated efforts between academia, the agricultural industry, and government, including: continuous workforce training; stronger university–industry partnerships; financial incentives for equipment acquisition and maintenance; and public policies supporting innovation and technology transfer in agriculture. In this context, governmental incentives appear to be a promising path to bridge the gap between research and market implementation, promoting the effective adoption of AVIAG technologies in the agricultural sector.
Finally, it is important to highlight that the lack of a survey of IVAGA technologies in patent databases represents a limitation of this study. Countries recognized for significant investments in science, technology, and innovation, such as Japan, South Korea, and Germany, have a consolidated history of collaboration between universities and industry, and knowledge transfer commonly occurs through patent registration. Thus, the apparent low representation of these countries in the scientific literature on IVAGA may not reflect the true magnitude of research developed in this field, but rather an intellectual property protection strategy geared toward industrial applications. Therefore, to increase the impact and robustness of this study, we suggest that future work combine the bibliographic survey with a survey of patent databases to provide a more comprehensive overview of existing technological innovations and mitigate potential biases in characterizing the state of the art.
5. Conclusions
The integration of intelligent systems and advanced hardware elements has driven significant transformations in agriculture, making visual inspection processes more efficient, sustainable, and aligned with the sector’s quality and competitiveness requirements. However, despite the growing volume of research on AVIAG technologies, especially in the last decade, important gaps were identified concerning researchers’ motivations for proposing AVIAG technologies, potential misalignments between academic research and agroindustrial needs, and barriers hindering effective technology transfer.
The results obtained in this study revealed that, although there is a correlation between grain production and consumption and the volume of scientific publications, factors such as infrastructure, incentive policies, and intellectual property protection strategies also influence the development of AVIAG technologies. The survey results provided a clear distinction between technological demands, reflected in respondents’ recognition of AVIAG’s contributions to process efficiency, product quality, standardization, and competitiveness (Question 15), and the barriers that limit technology transfer, such as a lack of skilled labor, high implementation costs, and cultural resistance to innovation (Question 16). Furthermore, the factors that enable effective technology transfer, including workforce training, dissemination of scientific knowledge, and stronger collaboration between academia and industry, were highlighted as key conditions for advancing adoption (Question 17). Together, these findings outlined distinct scenarios for technology transfer, in which the agricultural sector demonstrates both high awareness of the potential of AVIAG technologies and persistent structural and organizational barriers that impede their large-scale implementation. This analysis provided an assessment of the sector’s current demands, constraints, and opportunities, illuminating the dynamics of technology transfer addressed in the study.
The findings of this study indicate that the effective integration of AVIAG technologies into the agroindustrial sector depends not only on technical progress but also on the establishment of an innovation ecosystem capable of aligning scientific production with the practical demands of global agribusiness.
This study contributes theoretically by offering a comprehensive analysis of the evolution of AVIAG technologies, mapping their main applications, scientific production patterns, technological maturity levels, and the challenges associated with their adoption. To broaden the scope and robustness of the research, we recommend expanding the survey to a larger number of professionals directly involved in agricultural grains, as well as including participants from other countries, to obtain a more comprehensive and globally representative perspective. Additionally, it is suggested that future studies complement the literature review with an analysis of patent databases, aiming to capture innovations that are not necessarily published in scientific studies. The analysis could also be extended to other agricultural products, thereby expanding the application field of automated visual inspection technologies.
Author Contributions
Conceptualization, R.A.G. and S.A.d.A.; methodology, R.A.G. and S.A.d.A.; validation, A.F.H.L., P.A.B., A.A.G.F.B., G.C.d.O.N. and S.A.d.A.; formal analysis, A.F.H.L., G.C.d.O.N. and S.A.d.A.; investigation, R.A.G. and S.A.d.A.; resources, S.A.d.A.; data curation, R.A.G. and S.A.d.A.; writing—original draft preparation, R.A.G. and S.A.d.A.; writing—review and editing, S.A.d.A., A.F.H.L., A.A.G.F.B. and D.T.B.; visualization, D.T.B., P.A.B., A.F.H.L. and A.A.G.F.B.; supervision, S.A.d.A.; project administration, R.A.G. and S.A.d.A.; funding acquisition, S.A.d.A. All authors have read and agreed to the published version of the manuscript.
Funding
This research received no external funding.
Institutional Review Board Statement
Ethical Exemption: in accordance with Article 1 of Resolution No. 510, of 7 April 2016, of the National Health Council (https://www.gov.br/conselho-nacional-de-saude/pt-br/atos-normativos/resolucoes/2016/resolucao-no-510.pdf/view (accessed on 15 June 2024)), anonymous public opinion surveys that do not pose risks greater than those encountered in everyday life are exempt from IRB/Research Ethics Committee approval in Brazil. Our study falls into this category, as it involves only anonymous, non-sensitive survey responses. Informed Consent and Voluntary Participation: all participants were informed about the objectives and methods of the research, the confidentiality of their responses, and the academic purposes of the study. Participation was entirely voluntary, with no remuneration or obligations, and only those who provided free and informed consent proceeded to answer the questionnaire. Anonymity and Data Privacy: to ensure full compliance with Resolution No. 510, no identifying information was collected. The data were published only in aggregated form, while key information and trends are presented throughout the manuscript to ensure transparency and reproducibility. Data Security and Use: all collected information is securely stored and used exclusively for academic purposes (thesis development and scientific publications). The research fully adheres to MDPI’s ethical standards and COPE’s principles of good publication practices. Transparency and Accountability: the complete questionnaire, including introductory sections with objectives, methods, and ethical terms, is openly available at: https://forms.gle/6uLuc9Mo32N9tw7n8 (accessed on 19 April 2025).
Informed Consent Statement
Informed consent was obtained from all subjects involved in the study.
Data Availability Statement
The data used in this research were collected through a questionnaire applied to agricultural and agribusiness professionals. In compliance with the confidentiality agreement made with respondents, the collected data cannot be made available.
Acknowledgments
The authors gratefully acknowledge the Conselho Nacional de Desenvolvimento Científico e Tecnológico (CNPq) for awarding the Research Grants (Processes 421769/2023-8 and 313484/2025-2) to Sidnei A. de Araújo, as well as the Universidade Nove de Julho (UNINOVE) for their continued institutional support.
Conflicts of Interest
The authors declare no known competing financial interests or personal relationships that could have influenced the work reported in this paper.
Abbreviations
The following abbreviations are used in this manuscript:
| A5.0 | Agriculture 5.0 |
| AI | Artificial Intelligence |
| ANN | Artificial Neural Network |
| AVIAG | Automatic Visual Inspection of Agricultural Grains |
| CatBoost | Categorial Boosting |
| CMP_MET | Comparison of methods |
| CMP_MET + HDW | Comparison of methods with hardware implementation |
| CNN | Convolutional Neural Network |
| COL | Color features |
| CV | Computer Vision |
| CVS | Computer Vision System |
| DL | Deep Learning |
| DT | Decision Tree |
| EfficientNetV2B0 | CNN model from the EfficientNetV2 family, developed by Google |
| GEO | Geometric Features |
| HAR | Hierarchical and Abstract Representations |
| HYP | Hyperspectral images |
| IoT | Internet of Things |
| LDA | Linear Discriminant Analysis |
| LightGBM | Light Gradient Boosting Machine |
| LMT | Logistic Model Tree |
| MALS | Ministry of Agriculture, Livestock and Supply |
| Mask R-CNN | Mask region-based CNN |
| MET | Methods |
| MET + HDW | Methods with hardware implementation |
| ML | Machine Learning |
| MobileNetV2 | CNN model developed by Google |
| PA | Precision Agriculture |
| PointNet++ | Architecture of CNN that consumes point clouds |
| RGB | Red, Green and Blue—color system |
| ST | Statistical |
| SVM | Support Vector Machines |
| THE | Thermal images |
| TRL | Technology Readiness Level |
| TT | Technology Transfer |
| XGBoost | eXtreme Gradient Boosting |
Appendix A. Eligible Publications Identified in the Literature
| No | Author(s) | Year | Country | Grain(s) | Proposal | Technique | Type of Image | Type of Feature | Results |
| 1 | Anami et al. [24] | 2015 | India | Rice | MET | ML | RGB | COL | Acc.: 94.33; Rec.: 98.0 |
| 2 | De Araújo et al. [7] | 2015 | Brazil | Beans | MET | ML | RGB | ST/COL | Acc.: 99.88; Prec.: 99.98; F1: 99.98 |
| 3 | Barbedo et al. [43] | 2015 | Brazil | Wheat | MET | ST | HYP | ST | Acc.: 91.0 |
| 4 | Fang et al. [44] | 2015 | China | Rice | MET | ST | RGB | GEO | Acc.: 92.10 |
| 5 | Bianco et al. [45] | 2015 | Italy | Beans | MET | ML | RGB | ST | Acc.: ~99.7 |
| 6 | Wang et al. [46] | 2015 | USA | Maize | MET | ST | HYP | ST | Acc.: 91.67 |
| 7 | Ambrose et al. [47] | 2016 | South Korea | Maize | MET | ST | HYP | ST | Acc.: 97.6 |
| 8 | Huang al. [48] | 2016 | China | Maize | MET | ML | HYP | ST | Acc.: 95.0 |
| 9 | Kuo et al. [49] | 2016 | Taiwan | Rice | MET | ML | RGB | ST | Rec.: ~89.0 |
| 10 | Liu et al. [31] | 2016 | China | Rice | MET | ML | RGB | ST | Acc.:94.56–98.13 |
| 11 | Olgun et al. [50] | 2016 | Turkey | Wheat | MET | ML | RGB | ST | Prec.: 88.33 |
| 12 | Piramli et al. [51] | 2016 | Malaysia | Rice | MET | ML | RGB | ST/COL | Acc.: 95.83 |
| 13 | Ravikanth et al. [52] | 2016 | Canadian | Wheat | MET | ML | HYP | ST | Acc.: ~92.5 |
| 14 | Ir et al. [53] | 2016 | Philippines | Rice, Maize | MET | ML | RGB | ST/COL | Acc.: >90.0 |
| 15 | Lin et al. [17] | 2018 | China | Rice | MET | DL | RGB | HAR | Acc.: 95.50 |
| 16 | Mahajan et al. [54] | 2018 | India | Soybeans | MET | ML | RGB | ST | Acc.: >90.0 |
| 17 | Sendin et al. [55] | 2018 | South Africa | Maize | MET | ML | HYP | ST | Acc.: 83.0~100.0 |
| 18 | Alotaibi [56] | 2019 | Saudi Arabia | Rice | MET | ML | RGB | GEO | — |
| 19 | Anami et al. [57] | 2019 | India | Rice | MET | ML | RGB | ST | Prec.: 93.31 |
| 20 | Itsarawisut et al. [58] | 2019 | Thailand | Rice | MET | ML | RGB | ST/COL | Acc.: 94.0; Rec.: 98.0 |
| 21 | Lin et al. [59] | 2019 | China | Soybeans | MET | ML | RGB | ST | Acc.: 95.6 |
| 22 | Mittal et al. [60] | 2019 | India | Rice | MET | ML | RGB | ST | Rec.: 93.33 |
| 23 | Özkan et al. [61] | 2019 | Turkey | Wheat | MET | DL | HYP | HAR | Acc.: 100.0 |
| 24 | Protsenko et al. [62] | 2019 | Belarus | Wheat | MET | ML | HYP | ST | Acc.: 100.0 |
| 25 | Ropelewska [63] | 2019 | Poland | Wheat | MET | ML/DL | RGB | ST | Prec.: 58.12–73.37 |
| 26 | Kumar & Javeed [64] | 2019 | India | Rice | MET | ML | RGB | ST/GEO | Acc.: 97.67 |
| 27 | Abbaspour-Gilandeh et al. [65] | 2020 | Iran | Wheat | MET | ML | RGB | ST | Acc.: 100.0 |
| 28 | Ali et al. [15] | 2020 | Thailand | Maize | MET | ML | RGB | ST | Acc.: 98.83 |
| 29 | Aukkapinyo et al. [66] | 2020 | Thailand | Rice | MET | DL | RGB | HAR | Acc.: 81.0; Rec.: 80.0 |
| 30 | Boniecki et al. [67] | 2020 | Poland | Wheat | MET | ML | RGB | GEO | Acc.: 95.0 |
| 31 | Cisneros-Carrillo et al. [39] | 2020 | Mexico | Maize | MET | ST | RGB/TER | COL/GEO | Acc.: 93–95; R2: 72.0 |
| 32 | Fan et al. [68] | 2020 | China | Wheat | MET | ML | HYP | ST | Acc.: 88.5–88.9; R2: 87.0 |
| 33 | Hu et al. [69] | 2020 | China | Rice | MET | ML | 3D | GEO/ST | Acc.: 94.2; R2: 98.0 |
| 34 | Kiratiratanapruk et al. [70] | 2020 | Thailand | Rice | MET | ML/DL | RGB | ST | Acc.: 99.28 |
| 35 | Srivastava et al. [71] | 2020 | India | Rice | MET | ST | 3D | ST | Acc.: 88.34; R2.: 98.0–99.0 |
| 36 | Zhang et al. [72] | 2020 | China | Wheat | MET | ML | HYP | ST | Acc.: 96.44 |
| 37 | Zhang et al. [73] | 2020 | China | Wheat | MET | ML | HYP | ST | Acc.: ~94.8 |
| 38 | AgaAzizi et al. [74] | 2021 | Iran | Wheat | MET | ML | RGB | ST | Acc.: 97.77; Rec.: 100.0 |
| 39 | Aznan et al. [75] | 2021 | Australia | Rice | MET | ML | RGB | ST | Acc.: 93.9 |
| 40 | Bhattacharyya et al. [76] | 2021 | India | Rice | MET | ML | RGB | GEO | Acc.: 95.24; R2: 93.0–99.0 |
| 41 | Lingwal et al. [77] | 2021 | India | Wheat | MET | DL | RGB | HAR | Acc.: 94.88–97.53 |
| 42 | Nga et al. [78] | 2021 | Vietnam | Rice | MET | ML | RGB | ST | Acc.: 93.94 |
| 43 | Qadri et al. [16] | 2021 | Pakistan | Rice | MET | ML | RGB | ST | Acc.: 97.4 |
| 44 | Sharma et al. [79] | 2021 | India | Wheat | MET | ML | RGB | ST | Acc.: 84.0–95.0; R2: 79.0–94.0 |
| 45 | Zhou et al. [35] | 2021 | China | Maize | MET | DL | RGB | HAR | Acc.: 93.33 |
| 46 | Zhou et al. [37] | 2021 | China | Wheat | MET | ML | RGB | ST | Acc.: 83.0; Prec.: 87.0; R2: 59.0 |
| 47 | Abana et al. [80] | 2022 | Philippines | Rice | MET | ML | RGB | ST | Acc.: 93.0 |
| 48 | Assadzadeh et al. [81] | 2022 | Australia | Wheat | MET | ML/DL | HYP | ST/COL/GEO | R2: 61.0 |
| 49 | Moses et al. [82] | 2022 | India | Rice | MET | DL | RGB | HAR | Acc.: 98.37 |
| 50 | de Brito Silva [83] | 2022 | Brazil | Maize | MET | ML | RGB | ST | Acc.: 97.55 |
| 51 | Dönmez [84] | 2022 | Turkey | Maize | MET | DL | RGB | HAR | Acc.: 96.74 |
| 52 | Gierz et al. [85] | 2022 | Poland | Wheat, Barley, Colza | MET | ML | RGB | ST | Rec.: >90.0 |
| 53 | Hossen et al. [86] | 2022 | Bangladesh | Wheat | MET | DL | RGB | HAR | Acc.: 98.84 |
| 54 | Huang et al. [20] | 2022 | China | Soybeans | MET | DL | RGB | HAR | Acc.: 90.3; Rec.: 81.0 |
| 55 | Işık Ş. et al. [87] | 2022 | Turkey | Wheat | MET | ML/DL | RGB | HAR | Acc.: 99.94 |
| 56 | Jin et al. [88] | 2022 | China | Rice | MET | ML/DL | RGB | ST | Acc.: 99.0 |
| 57 | Palacios-Cabrera et al. [89] | 2022 | Ecuador | Rice | MET | ML | RGB | ST/COL | Acc.: >95.0 |
| 58 | Priya et al. [90] | 2022 | Canadian | Maize | MET | ML/DL | RGB | HAR | Acc.: 93.0; Rec.: >96.0 |
| 59 | Ravichandran et al. [91] | 2022 | Canadian | Rice | MET | DL | RGB | HAR | Acc.: >95.0; Rec.: 85.0–89.0 |
| 60 | Singh et al. [92] | 2022 | India | Rice | MET | ML | RGB | ST | Acc.: 99.4; Rec.: 100.0 |
| 61 | Unlersen et al. [93] | 2022 | Poland | Wheat | MET | ML/DL | RGB | ST/HAR | Acc.: 98.1 |
| 62 | Wang et al. [94] | 2022 | USA | Rice | MET | DL | RGB | HAR | Acc.: 95.1 |
| 63 | Yaman et al. [95] | 2022 | Turkey | Maize | MET | ML | HYP | COL/GEO | Acc.: 91.1 |
| 64 | Zhao et al. [96] | 2022 | China | Wheat | MET | DL | RGB | HAR | — |
| 65 | Zhao et al. [97] | 2022 | China | Wheat | MET | DL | HYP | HAR | Rec.: 95.65 |
| 66 | Alshahrani et al. [98] | 2023 | Saudi Arabia | Rice | MET | DL | RGB | HAR | Acc.: 99.66 |
| 67 | de Jesus Dantas et al. [99] | 2023 | Brazil | Beans | MET | ST | RGB | GEO | Acc.: 86.8 |
| 68 | Hidayat et al. [100] | 2023 | Indonesia | Rice | MET | DL | RGB | HAR | Acc.: 88; Rec.: 93.0 |
| 69 | Islam et al. [101] | 2023 | Bangladesh | Rice | MET | DL | RGB | HAR | Acc.: ~99.1 |
| 70 | Jollet et al. [26] | 2023 | Germany | Beans | MET | DL | RGB | HAR | Acc.: 95.5; Rec.: 93.3 |
| 71 | Li et al. [102] | 2023 | China | Maize | MET | DL | RGB | HAR | Acc.: ~98.0 |
| 72 | Matsuda et al. [103] | 2023 | Japan | Maize | MET | ST | HYP | ST | F1.: 83.0 |
| 73 | Qiao et al. [104] | 2023 | Vietnam | Rice | MET | DL | HYP | HAR | Acc.: 94.1 0 |
| 74 | Shen et al. [30] | 2023 | China | Wheat | MET | DL | RGB | HAR | Acc.: 86.0 |
| 75 | Sokudlor et al. [105] | 2023 | Thailand | Rice | MET | ML/DL | RGB | GEO | Acc.: 99.5 |
| 76 | Suárez et al. [106] | 2023 | Ecuador | Maize | MET | DL | RGB | HAR | Acc.: 96.7 0 |
| 77 | Wang et al. [107] | 2023 | China | Rice | MET | DL | RGB | HAR | Acc.: 98.0 |
| 78 | Yang et al. [108] | 2023 | China | Rice | MET | DL | RGB | HAR | Acc.: 93.6 |
| 79 | Zhang et al. [109] | 2023 | China | Wheat | MET | DL | RGB | HAR | Acc.: 96.24 |
| 80 | Balingbing et al. [110] | 2024 | Germany | Rice | MET | ML | RGB | ST | Acc.: 84.51 0 |
| 81 | Din et al. [111] | 2024 | India | Rice | MET | DL | RGB | HAR | Acc.: 94.0 |
| 82 | Dönmez et al. [112] | 2024 | Turkey | Maize | MET | DL | RGB | HAR | Acc.: 90.6; Rec.: 86.4; F1.: 92,15 |
| 83 | Jeong et al. [113] | 2024 | South Korea | Soybeans | MET | ST | RGB | ST/COL | Acc.: 95.8 0 |
| 84 | Kim et al. [114] | 2024 | South Korea | Wheat | MET | ML | RGB | GEO | Acc.: 83.0 |
| 85 | Li et al. [25] | 2024 | China | Maize | MET | ML | RGB | ST | Acc.: 91.23 |
| 86 | Razavi et al. [115] | 2024 | Iran | Rice | MET | DL | RGB | HAR | Acc.: 99.85; Rec.: 98.13 |
| 87 | Samanta et al. [116] | 2024 | India | Rice | MET | DL | RGB | ST | Rec.: 97.77; F1.: 94.0 |
| 88 | Siripatrawan et al. [117] | 2024 | Thailand | Rice | MET | ML | HYP | ST | Acc.: 93.94 |
| 89 | Van Puyenbroeck et al. [118] | 2024 | Belgium | Maize | MET | DL | HYP | HAR | Acc.: 94.1 |
| 90 | Yang et al. [119] | 2024 | China | Soybeans | MET | DL | HYP | HAR | Acc.: 94.24; Rec.: 94.14 |
| 91 | Yasar et al. [29] | 2024 | Turkey | Wheat | MET | DL | RGB | HAR | Acc.: 97.73; Rec.: 97.82; F1: 97.76 |
| 92 | Zhang et al. [120] | 2024 | China | Maize | MET | DL | 3D | HAR | Acc.: 93.0 |
| 93 | Zareiforoush et al. [121] | 2016 | Iran | Rice | CMP_MET | ML | RGB | ST | Acc.: 98.72 |
| 94 | Basati et al. [122] | 2018 | Iran | Wheat | CMP_MET | ML | RGB | ST/GEO | Acc.: 90.2 |
| 95 | Mavaddati [123] | 2018 | Iran | Rice | CMP_MET | ML | RGB | ST | Acc.: 94.5 |
| 96 | Koklu et al. [124] | 2020 | Turkey | Beans | CMP_MET | ML | RGB | ST | Acc.: ~93.13 |
| 97 | Barboza da Silva et al. [125] | 2021 | Brazil | Soybeans | CMP_MET | ML | HYP | GEO | Acc.: 99.0; Prec.: 99.0; R2: 91.0–92.0 |
| 98 | Koklu et al. [126] | 2021 | Turkey | Rice | CMP_MET | ML/DL | RGB | ST/GEO | Acc.: 99.87–99.95 |
| 99 | Özkan et al. [127] | 2021 | Turkey | Wheat | CMP_MET | ML/DL | RGB | ST | Acc.: 99.0 |
| 100 | Castro et al. [128] | 2022 | Brazil | Beans | CMP_MET | ML | RGB | COL/GEO | Acc.: ~91.0 |
| 101 | Gao et al. [32] | 2022 | China | Wheat | CMP_MET | DL | RGB | HAR | Acc.: 94.0; Rec.: 95.0 |
| 102 | Khatri et al. [129] | 2022 | India | Wheat | CMP_MET | ML | RGB | GEO | Acc.: 95.0; Rec.: 95.0; Prec.: 95.0; F1: 95.0 |
| 103 | Qin et al. [130] | 2022 | China | Rice, Wheat, Maize | CMP_MET | ML | RGB | ST/GEO | Acc.: 90.0; Rec.: 99.95; R2: >99.0 |
| 104 | Uddin et al. [131] | 2022 | Bangladesh | Rice | CMP_MET | ML | RGB | ST | Acc.: 99.28; Rec.: 98.64; F1: 98.56 |
| 105 | Wang et al. [132] | 2022 | China | Rice | CMP_MET | DL | RGB | HAR | Acc.: 90.0–91.0 |
| 106 | Xu et al. [133] | 2022 | China | Maize | CMP_MET | DL | RGB | HAR | Acc.: 99.7; Rec.: 99.7; F1: 99.7 |
| 107 | Xu et al. [134] | 2022 | China | Maize | CMP_MET | ML | HYP | ST | Acc.: 92.06 |
| 108 | Zia et al. [135] | 2022 | Pakistan | Rice | CMP_MET | ML | RGB | GEO | Acc.: 98.0–100.0 |
| 109 | Agarwal et al. [136] | 2023 | India | Wheat | CMP_MET | ML | RGB | ST | Acc.: 93.0; F1: 93.46 |
| 110 | Dhakal et al. [137] | 2023 | USA | Wheat | CMP_MET | DL | HYP | HAR | Acc.: 97.0; R2: 75.0 |
| 111 | Golcuk et al. [138] | 2023 | Turkey | Wheat | CMP_MET | ML | RGB | ST/COL | Acc.: 96.28 |
| 112 | He et al. [21] | 2023 | China | Rice | CMP_MET | ML/DL | 3D/2D | HAR | Acc.: 99.72; Rec.: 99.64; F1: 99.65 |
| 113 | Huang et al. [139] | 2023 | China | Rice | CMP_MET | ML/DL | 3D | ST/GEO | Acc.: 98.5; F1: 98.25 |
| 114 | Kini et al. [140] | 2023 | India | Wheat | CMP_MET | ML | RGB | GEO | Acc.: 90.6; Rec.: 89.9; F1: 90.6 |
| 115 | Macuácua et al. [9] | 2023 | Brazil | Beans | CMP_MET | ML | RGB | ST/GEO | Acc.: 95.9; Rec.: 96.0 |
| 116 | Nayak et al. [28] | 2023 | India | Beans | CMP_MET | ML | RGB | ST | Acc.: 97.32 |
| 117 | Rathnayake et al. [19] | 2023 | Japan | Rice | CMP_MET | ML | RGB | ST/COL/GEO | Acc.: 95.12; Rec.: 95.21; F1: 95.12 |
| 118 | Khan et al. [141] | 2023 | Bangladesh | Beans | CMP_MET | ML | RGB | ST | Acc.: 95.4 |
| 119 | Setiawan A. et al. [142] | 2023 | Indonesia | Rice | CMP_MET | ML | RGB | ST/GEO | Acc.: 96.83; Rec.: 97.92; F1: 97.29 |
| 120 | Xu et al. [143] | 2023 | China | Maize | CMP_MET | ML/DL | HYP | GEO | Acc.: 97.5 |
| 121 | Yasar [22] | 2023 | Turkey | Wheat | CMP_MET | DL | RGB | HAR | Acc.: 97.67; Rec.: 97.7; F1: 97.7 |
| 122 | Bhattacharyya et al. [144] | 2024 | India | Rice | CMP_MET | ML | RGB | ST | Acc.: ~96.2; Rec.: ~96.0; F1: 96.0 |
| 123 | Kılıçarslan et al. [27] | 2024 | Turkey | Wheat | CMP_MET | ML | RGB | ST/COL | Acc.: 98.65; Rec.: 98.6; F1: 98.44 |
| 124 | Koppad et al. [145] | 2024 | India | Soybeans | CMP_MET | DL | RGB | HAR | Acc.: 98.0; Rec.: 91.0–98.0 |
| 125 | Rajalakshmi et al. [146] | 2024 | India | Rice | CMP_MET | DL | RGB | HAR | Acc.: 97.0–99.0 |
| 126 | Setiawan et al. [147] | 2024 | Indonesia | Rice | CMP_MET | DL | RGB | HAR | Acc.: 97.0 |
| 127 | Shivamurthaiah et al. [148] | 2024 | India | Rice | CMP_MET | ML | RGB | ST | Acc.: 99.6 |
| 128 | Yasar [149] | 2024 | Turkey | Wheat | CMP_MET | ML/DL | RGB | ST/GEO | Acc.: 97.57 |
| 129 | Antonucci et al. [18] | 2017 | Italy | Rice | MET + HDW | ST | RGB | ST/COL/GEO | Acc.: 99.0 |
| 130 | Liu et al. [33] | 2018 | China | Maize | MET + HDW | ML | RGB | ST/COL | Acc.: 96.7–100.0 |
| 131 | Payman et al. [36] | 2018 | Iran | Rice | MET + HDW | ST | RGB | COL/GEO | Acc.: 98.0 |
| 132 | Belan et al. [8] | 2020 | Brazil | Beans | MET + HDW | ML/DL | RGB | COL/GEO | Acc.: 97.8–99.6; Rec.: 100.0 |
| 133 | Chen et al. [23] | 2020 | China | Rice | MET + HDW | ML | RGB | GEO | Acc.: 76.0 |
| 134 | Shen et al. [38] | 2020 | China | Maize | MET + HDW | ST | HYP/RGB | ST/COL | Acc.: 100.0; Rec.: 92.0 |
| 135 | Gao et al. [34] | 2021 | USA | Rice | MET + HDW | ML/DL | HYP/3D | ST | Acc.: 97.5 |
| 136 | Fan et al. [14] | 2024 | Australia | Rice, Wheat, Sorghum | MET + HDW | DL | RGB | HAR | Acc.: 99.5; Prec.: 99.0 |
| 137 | Xu et al. [40] | 2021 | China | Maize | CMP_MET + HDW | ML | RGB | ST/COL/GEO | Acc.: 96.46 |
- Proposal
HDW: Hardware for grain defect analysis/classification/identification;
MET: Method for grain defect analysis/classification/identification;
CMP_MET: Comparative studies between different methods for grain defect analysis/classification/identification.
- Technique
ML: Machine Learning;
DL: Deep Learning;
ST: Statistical approaches.
- Type of image
2D: Bidimensional images;
3D: Three-dimensional images acquired by scanners, X-ray, or tomography;
HYP: Hyperspectral images (multiple spectral bands [4+]);
RGB: Standard red, green, blue 2D images;
THE: Thermal images.
- Type of feature
COL: Color features;
ST: Statistical features (histogram, texture, spectral signature, etc.);
GEO: Geometric features (area, perimeter, diameter, morphological attributes, etc.);
HAR: Hierarchical or abstract representations (features commonly extracted by CNNs).
- Results
Acc.: Accuracy;
F1: F1-score;
Prec.: Precision;
Rec.: Recall;
R2: Coefficient of determination.
Appendix B. Survey Questionnaire for Collecting Data
Appendix B.1. Research Clarifications (Purpose and Confidentiality)
Hello,
Thank you for your interest in contributing to this research.
What is this research about?
This is a doctoral study entitled “AUTOMATIC VISUAL INSPECTION OF AGRICULTURAL GRAINS: potential applications and key challenges for technology transfer in the agroindustrial sector.” Its main objective is to understand the needs of the agricultural sector regarding visual quality inspection of grains, to identify ways to align technological innovations in automatic visual inspection with sector demands, and to investigate the factors that hinder the transfer of these innovations to agroindustry.
What method is being used? What exactly is this questionnaire, and how will I be involved?
To achieve the research objectives, the following qualitative and quantitative methods are being used in combination: a systematic literature review, a bibliometric analysis, and this questionnaire for data collection.
Your participation is very important to inform the study, especially regarding the needs of the agricultural sector and the factors that hinder the transfer of automatic visual inspection technologies to agroindustry.
The estimated time to complete this questionnaire is 10–15 min. You do not need to identify yourself. Your participation is voluntary; there will be no payment or costs involved, other than the time you dedicate.
Who is the responsible researcher?
Robson Aparecido Gomes (robsonapgomes@gmail.com)—PhD candidate in the Graduate Program of Informatics and Knowledge Management at Universidade Nove de Julho (UNINOVE), supervised by Prof. Dr. Sidnei Alves de Araújo (saraujo@uni9.pro.br).
What about privacy, data use, and publicity of participation?
All data collected through this questionnaire will be treated as strictly confidential and anonymous and will be used exclusively for academic purposes, such as the preparation of the dissertation and scientific publications (in aggregated, non-individualized form). This conduct is in accordance with Article 1 of Resolution No. 510, of 7 April 2016, of the Brazilian National Health Council: https://www.gov.br/conselho-nacional-de-saude/pt-br/atos-normativos/resolucoes/2016/resolucao-no-510.pdf/view (accessed on 15 June 2024).
Many thanks,
Robson Aparecido Gomes
Appendix B.2. Consent
Do you freely and knowingly authorize the use of your responses for the research presented above?
( ) YES
( ) NO
Appendix B.2.1. Section 1—Personal Information
- Education level:
| ( ) Incomplete elementary school | ( ) Incomplete undergraduate degree | ( ) Incomplete Master’s degree |
| ( ) Complete elementary school | ( ) Complete undergraduate degree | ( ) Complete Master’s degree |
| ( ) Incomplete high school | ( ) Incomplete specialization | ( ) Incomplete Doctorate degree |
| ( ) Complete high school | ( ) Complete specialization | ( ) Complete Doctorate degree |
| ( ) Postdoctoral |
- 2.
- Age group:
| ( ) Up to 20 years | ( ) 31 to 40 years | ( ) 51 to 60 years |
| ( ) 21 to 30 years | ( ) 41 to 50 years | ( ) Over 60 years |
Appendix B.2.2. Section 2—Professional Background
- 3.
- Field of activity:
| ( ) Agriculture | ( ) Industry |
| ( ) Commerce | ( ) Research |
| ( ) Education (Academic area) | ( ) Services |
| ( ) Others |
- 4.
- How long have you been working in this field?
| ( ) Up to 5 years | ( ) More than 10 up to 20 years |
| ( ) More than 5 up to 10 years | ( ) More than 20 years |
- 5.
- Current job position/level:
| ( ) Administrative | ( ) Managerial |
| ( ) Strategic | ( ) Operational |
| ( ) Other/I don’t know |
- 6.
- Name of the institution/company/organization (optional): ______________________________________________
- 7.
- State (location of the institution): (List of Brazilian states: Acre, Alagoas, etc.)
- 8.
- Is your activity directly related to the production, commercialization, storage, or processing of agricultural products?
( ) Yes ( ) No
Appendix B.2.3. Section 3—Professional Activities Related to Agricultural Products
- 9.
- Type of product:
| ( ) Grains | ( ) Vegetables and legumes |
| ( ) Fruits | ( ) Others |
- 10.
- What types of technologies are used in your institution/company/organization?
( ) Conventional technologies (e.g., computers, inspection machines, conveyors, autoclaves, harvesters, etc.)
( ) Modern technologies (e.g., IoT, robotics, AI, drones, etc.)
( ) Other: ____________________________________________
Appendix B.2.4. Section 4—Aviag Technologies
- 11.
- Are you aware of scientific work proposing technological solutions (systems or equipment) for the automatic visual inspection of agricultural product quality? ( ) Yes ( ) No ( ) I don’t know
- 12.
- Do you think it is important to have systems or equipment to automate visual inspection of grain quality (e.g., color, size, shape, texture, defect detection)? ( ) Yes ( ) No ( ) I don’t know
- 13.
- In your opinion, what is the contribution level of AVIAG technologies to the following aspects?
(Use a Likert scale: None/Low/Medium/High/I don’t know)
- -
- Cost reduction
- -
- Quality assurance of products
- -
- Standardization of inspection results
- -
- Increase in business competitiveness
- -
- Greater efficiency of processes in the agricultural sector
- -
- Support for decision making
- 14.
- To what extent do the following factors hinder the adoption of AVIAG technologies?
(Use a Likert scale: None/Low/Medium/High/I don’t know)
- -
- Cost of technological solutions
- -
- Return on investment time for technological solutions
- -
- Need for changes in processes/work methods
- -
- Need for skilled labor to operate technological solutions
- -
- Lack of confidence in the results produced by technological solutions
- -
- Lack of alignment of technological solutions with the demands of the agriculture sector
- 15.
- Select up to five (5) items that, in your opinion, are important to enable large-scale adoption of AVIAG technologies:
- ⃞
- Reducing cultural resistance (lack of knowledge or trust in technology)
- ⃞
- Standardization of results
- ⃞
- Economic advantages/benefits
- ⃞
- Reduction of costs for acquiring these technologies
- ⃞
- Development of technologies easily adaptable to the work environment
- ⃞
- Greater integration between academic and business fields (theory and practice)
- ⃞
- Creation or expansion of credit lines for acquiring these technologies
- ⃞
- Development of technologies that meet the needs of the agricultural sector
- ⃞
- Wide dissemination of existing technologies
- ⃞
- Workforce training to deal with these technologies
References
- Ayaz, M.; Ammad-Uddin, M.; Sharif, Z.; Mansour, A.; Aggoune, E.M. Internet-of-Things (IoT)-based smart agriculture: Toward making the fields talk. IEEE Access 2019, 7, 129551–129583. [Google Scholar] [CrossRef]
- Sott, M.K.; Nascimento, L.D.S.; Foguesatto, C.R.; Furstenau, L.B.; Faccin, K.; Zawislak, P.A.; Bragazzi, N.L. A bibliometric network analysis of recent publications on digital agriculture to depict strategic themes and evolution structure. Sensors 2021, 21, 7889. [Google Scholar] [CrossRef]
- CONAB—Companhia Nacional de Abastecimento: Feijão Comum. Available online: https://portaldeinformacoes.conab.gov.br/produtos-360.html (accessed on 1 April 2024).
- United Nations, Department of Economic and Social Concil—Commission on Population and Development—Fifty-Fifth Session. 25–29 April 2022. Available online: https://documents-dds-ny.un.org/doc/UNDOC/GEN/N22/240/68/PDF/N2224068.pdf (accessed on 1 April 2024).
- Aggarwal, S.; Suchithra, M.; Chandramouli, N.; Sarada, M.; Verma, A.; Vetrithangam, D.; Ambachew Adugna, B. Rice Disease Detection Using Artificial Intelligence and Machine Learning Techniques to Improvise Agro-Business. Sci. Program. 2022, 2022, 1757888. [Google Scholar] [CrossRef]
- Buainain, A.M.; Cavalcante, P.; Consoline, L. Estado Atual da Agricultura Digital no Brasil: Inclusão dos Agricultores Familiares e Pequenos Produtores Rurais; CEPAL: Santiago, Chile, 2021. [Google Scholar]
- De Araújo, S.A.; Pessota, J.H.; Kim, H.Y. Beans quality inspection using correlation-based granulometry. Eng. Appl. Artif. Intell. 2015, 40, 84–94. [Google Scholar] [CrossRef]
- Belan, P.A.; Macedo, R.A.G.; Alves, W.A.L.; Santana, J.C.C.; Araújo, S.A. Machine vision system for quality inspection of beans. Int. J. Adv. Manuf. Technol. 2020, 112, 271–282. [Google Scholar] [CrossRef]
- Macuácua, J.C.; Centeno, J.A.S.; Amisse, C. Data mining approach for dry bean seeds classification. Smart Agric. Technol. 2023, 5, 100240. [Google Scholar] [CrossRef]
- Brosnan, T.; Sun, D.-W. Inspection and grading of agricultural and food products by computer vision systems-A review. Comput. Electron. Agric. 2002, 36, 193–213. [Google Scholar] [CrossRef]
- Da Silva, D.D.A.; De Freitas, E.D.G.; Abud, H.F.; Gomes, D.G. Applying YOLOv8 and X-ray Morphology Analysis to Assess the Vigor of Brachiaria brizantha cv. Xaraés Seeds. AgriEngineering 2024, 6, 869–880. [Google Scholar] [CrossRef]
- Costa, G.P.; Sakata, G.Y.A.; Oliveira, L.F.P.D.; Chaves, M.E.; Duarte, L.F.; Matulovic, M.; Morais, F.J. FarmSync: Ecosystem for Environmental Monitoring of Barns in Agribusiness. AgriEngineering 2025, 7, 124. [Google Scholar] [CrossRef]
- MALS—Ministry of Agriculture, Livestock and Food Supply, Rules for Seed Analysis. 2009. Available online: https://www.gov.br/agricultura/pt-br/assuntos/insumos-agropecuarios/arquivos-publicacoes-insumos/2946_regras_analise__sementes.pdf (accessed on 1 April 2024).
- Fan, L.; Fan, D.; Ding, Y.; Wu, Y.; Chu, H.; Pagnucco, M.; Song, Y. AV4GAInsp: An Efficient Dual-Camera System for Identifying Defective Kernels of Cereal Grains. IEEE Robot. Autom. Lett. 2024, 9, 851–858. [Google Scholar] [CrossRef]
- Ali, A.; Qadri, S.; Mashwani, W.K.; Belhaouari, S.B.; Naeem, S.; Rafique, S.; Jamal, F.; Chesneau, C.; Anam, S. Machine learning approach for the classification of corn seed using hybrid features. Int. J. Food Prop. 2020, 23, 1110–1124. [Google Scholar] [CrossRef]
- Qadri, S.; Aslam, T.; Nawaz, S.A.; Saher, N.; Razzaq, A.; Ur Rehman, M.; Ahmad, N.; Shahzad, F.; Qadri, S.F. Machine vision approach for classification the rice varieties using statistical features. Int. J. Food Prop. 2021, 24, 1615–1630. [Google Scholar] [CrossRef]
- Lin, P.; Li, X.L.; Chen, Y.M.; He, Y. A Deep Convolutional Neural Network Architecture for Boosting Image Discrimination Accuracy of Rice Species. J. Agric. Inform. 2018, 14, 34–49. [Google Scholar] [CrossRef]
- Antonucci, F.; Figorilli, S.; Costa, C.; Pallottino, F.; Spanu, A.; Menesatti, P. An Open Source Conveyor Belt Prototype for Image Analysis-Based Rice Yield Determination. Food Bioprocess Technol. 2017, 10, 1257–1264. Available online: https://link.springer.com/article/10.1007/s11947-017-1895-2 (accessed on 1 April 2024). [CrossRef]
- Rathnayake, N.; Miyazaki, A.; Dang, T.L.; Hoshino, Y. Age Classification of Rice Seeds in Japan Using Gradient-Boosting and ANFIS Algorithms. Sensors 2023, 23, 2828. [Google Scholar] [CrossRef]
- Huang, Z.; Wang, R.; Zhou, Q.; Teng, Y.; Zheng, S.; Liu, L.; Wang, L. Fast location and segmentation of high-throughput damaged soybean seeds with invertible neural networks. J. Sci. Food Agric. 2022, 102, 4854–4865. [Google Scholar] [CrossRef]
- He, X.; Cai, Q.; Zou, X.; Li, H.; Feng, X.; Yin, W.; Qian, Y. Multi-Modal Late Fusion Rice Seed Variety Classification Based on an Improved Voting Method. Agriculture 2023, 13, 597. [Google Scholar] [CrossRef]
- Yasar, A. Benchmarking analysis of CNN models for bread wheat varieties. Eur. Food Res. Technol. 2023, 249, 749–758. [Google Scholar] [CrossRef]
- Chen, J.; Lian, Y.; Li, Y. Real-time grain impurity sensing for rice combine harvesters using image processing and decision-tree algorithm. Comput. Electron. Agric. 2020, 175, 105591. [Google Scholar] [CrossRef]
- Anami, B.S.; Naveen, N.M.; Hanamaratti, N.G. A colour features-based methodology for variety recognition from bulk paddy images. Int. J. Adv. Intell. Paradig. 2015, 7, 187. [Google Scholar] [CrossRef]
- Li, J.; Xu, F.; Song, S.; Qi, J.; Li, J.; Xu, F.; Song, S.; Qi, J. A maize seed variety identification method based on improving deep residual convolutional network. Front. Plant Sci. 2024, 15, 1382715. [Google Scholar] [CrossRef] [PubMed]
- Jollet, D.; Junker-Frohn, L.V.; Steier, A.; Meyer-Lüpken, T.; Müller-Linow, M. A new computer vision workflow to assess yield quality traits in bush bean (Phaseolus vulgaris L.). Smart Agric. Technol. 2023, 5, 100306. [Google Scholar] [CrossRef]
- Kılıçarslan, S.; Kılıçarslan, S. A comparative study of bread wheat varieties identification on feature extraction, feature selection and machine learning algorithms. J. Food Eng. 2024, 12, 56–78. [Google Scholar] [CrossRef]
- Nayak, J.; Dash, P.B.; Naik, B. An Advance Boosting Approach for Multiclass Dry Bean Classification. J. Eng. Sci. Technol. Rev. 2023, 12, 107–115. [Google Scholar] [CrossRef]
- Yasar, A.; Golcuk, A.; Sari, O.F. Classification of bread wheat varieties with a combination of deep learning approach. Eur. Food Res. Technol. 2024, 250, 181–189. [Google Scholar] [CrossRef]
- Shen, R.; Zhen, T.; Li, Z. Segmentation of Unsound Wheat Kernels Based on Improved Mask RCNN. Sensors 2023, 23, 3379. [Google Scholar] [CrossRef]
- Liu, J.P.; Tang, Z.H.; Zhang, J.; Chen, Q.; Xu, P.F.; Liu, W.Z. Visual Perception-Based Statistical Modeling of Complex Grain Image for Product Quality Monitoring and Supervision on Assembly Production Line. PLoS ONE 2016, 11, e0146484. [Google Scholar] [CrossRef]
- Gao, H.; Zhen, T.; Li, Z. Detection of Wheat Unsound Kernels Based on Improved ResNet. IEEE Access 2022, 10, 20092–20101. [Google Scholar] [CrossRef]
- Liu, S.X.; Zhang, H.J.; Wang, Z.; Zhang, C.Q.; Li, Y.; Wang, J.X. Determination of maize seed purity based on multi-step clustering. Appl. Eng. Agric. 2018, 34, 659. [Google Scholar] [CrossRef]
- Gao, T.; Chandran, A.K.N.; Paul, P.; Walia, H.; Yu, H. HyperSeed: An End-to-End Method to Process Hyperspectral Images of Seeds. Sensors 2021, 21, 8184. [Google Scholar] [CrossRef]
- Zhou, Q.; Huang, W.; Tian, X.; Yang, Y.; Liang, D. Identification of the variety of maize seeds based on hyperspectral images coupled with convolutional neural networks and subregional voting. J. Sci. Food Agric. 2021, 101, 4532–4542. [Google Scholar] [CrossRef] [PubMed]
- Payman, S.H.; Bakhshipour, A.; Zareiforoush, H. Development of an expert vision-based system for inspecting rice quality indices. Qual. Assur. Saf. Crops Foods 2018, 10, 103–114. [Google Scholar] [CrossRef]
- Zhou, C.; Yang, G.; Liang, D.; Hu, J.; Yang, H.; Yue, J.; Yan, R.; Han, L.; Huang, L.; Xu, L. Recognizing black point in wheat kernels and determining its extent using multidimensional feature extraction and a naive Bayes classifier. Comput. Electron. Agric. 2021, 180, 105919. [Google Scholar] [CrossRef]
- Shen, F.; Huang, Y.; Jiang, X.; Fang, Y.; Li, P.; Liu, Q.; Hu, Q.; Liu, X. On-line prediction of hazardous fungal contamination in stored maize by integrating Vis/NIR spectroscopy and computer vision. Spectrochim. Acta Part A Mol. Biomol. Spectrosc. 2020, 229, 118012. [Google Scholar] [CrossRef]
- Cisneros-Carrillo, H.; Hernandez-Aguilar, C.; Dominguez-Pacheco, A.; Cruz-Orea, A.; Zepeda-Bautista, R. Thermal analysis and artificial vision of laser irradiation on corn. SN Appl. Sci. 2020, 2, 1606. [Google Scholar] [CrossRef]
- Xu, P.; Yang, R.; Zeng, T.; Zhang, J.; Zhang, Y.; Tan, Q. Varietal classification of maize seeds using computer vision and machine learning techniques. J. Food Process Eng. 2021, 44, e13846. [Google Scholar] [CrossRef]
- Moher, D.; Liberati, A.; Tetzlaff, J.; Altman, D.G.; Prisma Group. Preferred reporting items for systematic reviews and meta-analyses: The PRISMA statement. Int. J. Surg. 2010, 8, 336–341. [Google Scholar] [CrossRef]
- Forza, C. Survey research in operations management: A process-based perspective. Int. J. Oper. Prod. Manag. 2002, 22, 152–194. [Google Scholar] [CrossRef]
- Barbedo, J.G.A.; Tibola, C.S.; Fernandes, J.M.C. Detecting Fusarium head blight in wheat kernels using hyperspectral imaging. Biosyst. Eng. 2015, 131, 65–76. [Google Scholar] [CrossRef]
- Fang, C.; Hu, X.; Sun, C.; Duan, B.; Xie, L.; Zhou, P. Simultaneous Determination of Multi Rice Quality Parameters Using Image Analysis Method. Food Anal. Methods 2015, 8, 70–78. [Google Scholar] [CrossRef]
- Bianco, M.L.; Grillo, O.; Cremonini, R.; Sarigu, M.; Venora, V. Characterisation of Italian bean landraces (Phaseolus vulgaris L.) using seed image analysis and texture descriptors. Aust. J. Crop Sci. 2015, 9, 1002–1034. Available online: https://search.informit.org/doi/10.3316/informit.773365602021661 (accessed on 1 April 2024).
- Wang, W.; Heitschmidt, G.W.; Windham, W.R.; Feldner, P.; Ni, X.; Chu, X. Feasibility of Detecting Aflatoxin B1 on Inoculated Maize Kernels Surface using Vis/NIR Hyperspectral Imaging. J. Food Sci. 2015, 80, M116–M122. [Google Scholar] [CrossRef] [PubMed]
- Ambrose, A.; Kandpal, L.M.; Kim, M.S.; Lee, W.-H.; Cho, B.-K. High speed measurement of corn seed viability using hyperspectral imaging. Infrared Phys. Technol. 2016, 75, 173–179. [Google Scholar] [CrossRef]
- Huang, M.; Tang, J.; Yang, B.; Zhu, Q. Classification of maize seeds of different years based on hyperspectral imaging and model updating. Comput. Electron. Agric. 2016, 122, 139–145. [Google Scholar] [CrossRef]
- Kuo, T.Y.; Chung, C.L.; Chen, S.Y.; Lin, H.A.; Kuo, Y.F. Identifying rice grains using image analysis and sparse-representation-based classification. Comput. Electron. Agric. 2016, 127, 716–725. [Google Scholar] [CrossRef]
- Olgun, M.; Onarcan, A.O.; Özkan, K.; Işik, Ş.; Sezer, O.; Özgişi, K.; Ayter, N.G.; Başçiftçi, Z.B.; Ardiç, M.; Koyuncu, O. Wheat grain classification by using dense SIFT features with SVM classifier. Comput. Electron. Agric. 2016, 122, 185–190. [Google Scholar] [CrossRef]
- Piramli, M.M.; Rahman, A.F.N.A.; Abdullah, S.F. Rice grain grading classification based on perimeter using Moore-Neighbor Tracing method. Electron. Comput. Eng. 2016, 8, 23–27. Available online: https://jtec.utem.edu.my/jtec/article/view/940 (accessed on 1 April 2024).
- Ravikanth, L.; Singh, C.B.; Jayas, D.S.; White, N.D.G. Performance evaluation of a model for the classification of contaminants from wheat using near-infrared hyperspectral imaging. Biosyst. Eng. 2016, 147, 248–258. [Google Scholar] [CrossRef]
- Ir, A.T.; Ligisan, A.R. Development of PHilMech computer vision system (CVS) for quality analysis of rice and corn. Int. J. Adv. Sci. Eng. Inf. Technol. 2016, 6, 1060–1066. [Google Scholar] [CrossRef][Green Version]
- Mahajan, S.; Mittal, S.K.; Das, A. Machine vision based alternative testing approach for physical purity, viability and vigour testing of soybean seeds (Glycine max). J. Food Sci. Technol. 2018, 55, 3949–3959. [Google Scholar] [CrossRef]
- Sendin, K.; Manley, M.; Williams, P.J. Classification of white maize defects with multispectral imaging. Food Chem. 2018, 243, 311–318. [Google Scholar] [CrossRef] [PubMed]
- Alotaibi, N.S. A Rice Quality Analysis with Image Classification using Sobel Filetr. J. Mech. Contin. Math. Sci. 2019, 14, 375–384. [Google Scholar] [CrossRef]
- Anami, B.S.; Malvade, N.N.; Palaiah, S. Automated recognition and classification of adulteration levels from bulk paddy grain samples. Inf. Process. Agric. 2019, 6, 47–60. [Google Scholar] [CrossRef]
- Itsarawisut, J.; Kanjanawanishkul, K. Neural Network-based Classification of Germinated Hang Rice Using Image Processing. IETE Tech. Rev. 2019, 36, 375–381. [Google Scholar] [CrossRef]
- Lin, P.; Xiaoli, L.; Li, D.; Jiang, S.; Zou, Z.; Lu, Q.; Chen, Y. Rapidly and exactly determining postharvest dry soybean seed quality based on machine vision technology. Sci. Rep. 2019, 9, 17143. [Google Scholar] [CrossRef]
- Mittal, S.; Dutta, M.K.; Issac, A. Non-destructive image processing based system for assessment of rice quality and defects for classification according to inferred commercial value. Measurement 2019, 148, 106969. [Google Scholar] [CrossRef]
- Özkan, K.; Işık, Ş.; Yavuz, B.T. Identification of wheat kernels by fusion of RGB, SWIR, and VNIR samples. J. Sci. Food Agric. 2019, 99, 4977–4984. [Google Scholar] [CrossRef]
- Protsenko, S.V.; Mishurnaya, V.S.; Voropai, E.S. Construction of a Classification Model for Bulk Cereal Grains from Diffuse Reflectance Spectra in the Near Infrared Region, Using Logistic Regression as an Example. J. Appl. Spectrosc. 2019, 86, 106–111. [Google Scholar] [CrossRef]
- Ropelewska, E. Evaluation of wheat kernels infected by fungi of the genus Fusarium based on morphological features. J. Food Saf. 2019, 39, e12623. [Google Scholar] [CrossRef]
- Kumar, M.S.; Javeed, M. An efficient rice variety identification scheme using shape, harlick & color feature extraction and multiclass SVM. Int. J. Eng. Adv. Technol. 2019, 8, 3629–3632. [Google Scholar] [CrossRef]
- Abbaspour-Gilandeh, Y.; Ghadakchi-Bazaz, H.; Davari, M. Discriminating Healthy Wheat Grains from Grains Infected with Fusarium graminearum Using Texture Characteristics of Image-Processing Technique, Discriminant Analysis, and Support Vector Machine Methods. J. Intell. Syst. 2020, 29, 1576–1586. [Google Scholar] [CrossRef]
- Aukkapinyo, K.; Sawangwong, S.; Pooyoi, P.; Kusakunniran, W. Localization and Classification of Rice-grain Images Using Region Proposals-based Convolutional Neural Network. Int. J. Autom. Comput. 2020, 17, 233–246. [Google Scholar] [CrossRef]
- Boniecki, P.; Koszela, K.; Swierczynski, K.; Skwarcz, J.; Zaborowicz, M.; Przybyl, J. Neural Visual Detection of Grain Weevil (Sitophilus granarius L.). Agriculture 2020, 10, 25. [Google Scholar] [CrossRef]
- Fan, Y.; Ma, S.; Wu, T. Individual wheat kernels vigor assessment based on NIR spectroscopy coupled with machine learning methodologies. Infrared Phys. Technol. 2020, 105, 103213. [Google Scholar] [CrossRef]
- Hu, W.; Zhang, C.; Jiang, Y.; Huang, C.; Liu, Q.; Xiong, L.; Yang, W.; Chen, F. Nondestructive 3D image analysis pipeline to extract rice grain traits using X-ray computed tomography. Plant Phenomics 2020, 2020, 3414926. [Google Scholar] [CrossRef] [PubMed]
- Kiratiratanapruk, K.; Temniranrat, P.; Sinthupinyo, W.; Prempree, P.; Chaitavon, K.; Porntheeraphat, S.; Prasertsak, A. Development of Paddy Rice Seed Classification Process using Machine Learning Techniques for Automatic Grading Machine. J. Sens. 2020, 2020, 7041310. [Google Scholar] [CrossRef]
- Srivastava, S.; Mishra, G.; Mishra, H.N. Application of an expert system of X-ray micro computed tomography imaging for identification of Sitophilus oryzae infestation in stored rice grains. Pest. Manag. Sci. 2020, 76, 952–960. [Google Scholar] [CrossRef]
- Zhang, D.; Chen, G.; Zhang, H.; Jin, N.; Gu, C.; Weng, S.; Wang, Q.; Chen, Y. Integration of spectroscopy and image for identifying fusarium damage in wheat kernels. Spectrochim. Acta Part A Mol. Biomol. Spectrosc. 2020, 236, 118344. [Google Scholar] [CrossRef]
- Zhang, L.; Sun, H.; Rao, Z.; Ji, H. Non-destructive identification of slightly sprouted wheat kernels using hyperspectral data on both sides of wheat kernels. Biosyst. Eng. 2020, 200, 188–199. [Google Scholar] [CrossRef]
- AgaAzizi, S.; Rasekh, M.; Abbaspour-Gilandeh, Y.; Kianmehr, M.H. Identification of impurity in wheat mass based on video processing using artificial neural network and PSO algorithm. J. Food Process. Preserv. 2021, 45, e15067. [Google Scholar] [CrossRef]
- Aznan, A.; Viejo, C.G.; Pang, A.; Fuentes, S. Computer vision and machine learning analysis of commercial rice grains: A potential digital approach for consumer perception studies. Sensors 2021, 21, 6354. [Google Scholar] [CrossRef]
- Bhattacharyya, S.K.; Pal, S.; Chattopadhyay, S. Classification and quality analysis of rice grain based on dimensional measurement during hydrothermal treatment. Int. J. Eng. Trends Technol. 2021, 69, 145–154. [Google Scholar] [CrossRef]
- Lingwal, S.; Bhatia, K.K.; Tomer, M.S. Image-based wheat grain classification using convolutional neural network. Multimed. Tools Appl. 2021, 80, 35441–35465. [Google Scholar] [CrossRef]
- Nga, T.T.K.; Tuan, P.V.; Tam, D.M.; Koo, I.; Mariano, V.Y.; Do-Hong, T. Combining Binary Particle Swarm Optimization with Support Vector Machine for Enhancing Rice Varieties Classification Accuracy. IEEE Access 2021, 9, 66062–66078. [Google Scholar] [CrossRef]
- Sharma, R.; Kumar, M.; Alam, M.S. Image processing techniques to estimate weight and morphological parameters for selected wheat refractions. Sci. Rep. 2021, 11, 20953. [Google Scholar] [CrossRef] [PubMed]
- Abana, E.; Sy, B. ISO/IEC 25010 based evaluation of rice seed analyzer: A machine vision application using image processing technique. Indones. J. Electr. Eng. Comput. Sci. 2022, 28, 994–1001. [Google Scholar] [CrossRef]
- Assadzadeh, S.; Walker, C.K.; McDonald, L.S.; Panozzo, J.F. Prediction of milling yield in wheat with the use of spectral, colour, shape, and morphological features. Biosyst. Eng. 2022, 214, 28–41. [Google Scholar] [CrossRef]
- Moses, K.; Miglani, A.; Kankar, P.K. Deep CNN-based damage classification of milled rice grains using a high-magnification image dataset. Comput. Electron. Agric. 2022, 195, 106811. [Google Scholar] [CrossRef]
- de Brito Silva, G.V.; Flores, F.C. Rot Corn Grain Classication by Color and Texture Analysis. IEEE Lat. Am. Trans. 2021, 20, 208–214. [Google Scholar] [CrossRef]
- Dönmez, E. Enhancing classification capacity of CNN models with deep feature selection and fusion: A case study on maize seed classification. Data Knowl. Eng. 2022, 141, 102075. [Google Scholar] [CrossRef]
- Gierz, Ł.; Przybył, K. Texture analysis and artificial neural networks for identification of cereals—Case study: Wheat, barley and rape seeds. Sci. Rep. 2022, 12, 19316. [Google Scholar] [CrossRef] [PubMed]
- Hossen, M.H.; Mohibullah, M.; Muzammel, C.S.; Ahmed, T.; Acharjee, S.; Panna, M.B. Wheat Diseases Detection and Classification using Convolutional Neural Network (CNN). Int. J. Adv. Comput. Sci. Appl. 2022, 13, 719–726. [Google Scholar] [CrossRef]
- Işık, Ş.; Özkan, K.; Demirez, D.Z.; Seke, E. Consensus rule for wheat cultivar classification on VL, VNIR and SWIR imaging. IET Image Process. 2022, 16, 2834–2844. [Google Scholar] [CrossRef]
- Jin, B.; Zhang, C.; Jia, L.; Tang, Q.; Gao, L.; Zhao, G.; Qi, H. Identification of Rice Seed Varieties Based on Near-Infrared Hyperspectral Imaging Technology Combined with Deep Learning. ACS Omega 2022, 7, 4735–4749. [Google Scholar] [CrossRef]
- Palacios-Cabrera, H.; Jimenes-Vargas, K.; González, M.; Flor-Unda, O.; Almeida, B. Determination of Moisture in Rice Grains Based on Visible Spectrum Analysis. Agronomy 2022, 12, 3021. [Google Scholar] [CrossRef]
- Priya, T.S.R.; Manickavasagan, A. Evaluation of segmentation methods for RGB colour image-based detection of Fusarium infection in corn grains using support vector machine (SVM) and pretrained convolution neural network (CNN). Can. Biosyst. Eng. J. 2022, 64, 7.9–7.20. [Google Scholar] [CrossRef]
- Ravichandran, P.; Viswanathan, S.; Ravichandran, S.; Pan, Y.-J.; Chang, Y.K. Estimation of grain quality parameters in rice for high-throughput screening with near-infrared spectroscopy and deep learning. Cereal Chem. 2022, 99, 907–919. [Google Scholar] [CrossRef]
- Singh, K.R.; Chaudhury, S.; Datta, S.; Deb, S. Gray level size zone matrix for rice grain classification using back propagation neural network: A comparative study. Int. J. Syst. Assur. Eng. Manag. 2022, 13, 2683–2697. [Google Scholar] [CrossRef]
- Unlersen, M.F.; Sonmez, M.E.; Aslan, M.F.; Demir, B.; Aydin, N.; Sabanci, K.; Ropelewska, E. CNN-SVM hybrid model for varietal classification of wheat based on bulk samples. Eur. Food Res. Technol. 2022, 248, 2043–2052. [Google Scholar] [CrossRef]
- Wang, C.; Caragea, D.; Kodadinne, N.N.; Hein, N.T.; Bheemanahalli, R.; Somayanda, I.M.; Jagadish, S.V.K. Deep learning based high-throughput phenotyping of chalkiness in rice exposed to high night temperature. Plant Methods 2022, 18, 9. [Google Scholar] [CrossRef]
- Yaman, F.; Kahrıman, F. Classification of viable/non-viable seeds of specialty maize genotypes using spectral and image data plus morphological features. J. Crop Improv. 2022, 36, 285–300. [Google Scholar] [CrossRef]
- Zhao, W.; Liu, S.; Li, X.; Han, X.; Yang, H. Fast and accurate wheat grain quality detection based on improved YOLOv5. Comput. Electron. Agric. 2022, 202, 107426. [Google Scholar] [CrossRef]
- Zhao, X.; Que, H.; Sun, X.; Zhu, Q.; Huang, M. Hybrid convolutional network based on hyperspectral imaging for wheat seed varieties classification. Infrared Phys. Technol. 2022, 125, 104270. [Google Scholar] [CrossRef]
- Alshahrani, H.M.; Saeed, M.K.; Alotaibi, S.S.; Mohamed, A.; Assiri, M.; Ibrahim, S.S. Quantum-Inspired Moth Flame Optimizer Enhanced Deep Learning for Automated Rice Variety Classification. IEEE Access 2023, 11, 125593–125600. [Google Scholar] [CrossRef]
- de Jesus Dantas, S.; Torres, M.F.O.; Silva-Mann, R.; Vargas, P.F. Phaseolus lunatus L.: Pulse seeds phenotype image analysis. Genet. Resour. Crop Evol. 2023, 70, 2555–2565. [Google Scholar] [CrossRef]
- Hidayat, S.S.; Rahmawati, D.; Ardi Prabowo, M.C.; Triyono, L.; Putri, F.T. Determining the Rice Seeds Quality Using Convolutional Neural Network. Int. J. Inform. Vis. 2023, 7, 527–534. [Google Scholar] [CrossRef]
- Islam, M.A.; Hassan, M.R.; Uddin, M.; Shajalal, M. Germinative paddy seed identification using deep convolutional neural network. Multimed. Tools Appl. 2023, 82, 39481–39501. [Google Scholar] [CrossRef]
- Li, C.; Chen, Z.; Jing, W.; Wu, X.; Zhao, Y. A lightweight method for maize seed defects identification based on Convolutional Block Attention Module. Front. Plant Sci. 2023, 14, 1153226. [Google Scholar] [CrossRef]
- Matsuda, O.; Ohara, Y. Last-percent improvement in eligibility rates of crop seeds based on quality evaluation using near-infrared imaging spectrometry. PLoS ONE 2023, 18, e0291105. [Google Scholar] [CrossRef]
- Qiao, J.; Liao, Y.; Yin, C.; Yang, X.; Tú, H.M.; Wang, W.; Liu, Y. Vigour testing for the rice seed with computer vision-based techniques. Front. Plant Sci. 2023, 14, 1194701. [Google Scholar] [CrossRef]
- Sokudlor, N.; Laloon, K.; Junsiri, C.; Sudajan, S. Enhancing milled rice qualitative classification with machine learning techniques using morphological features of binary images. Int. J. Food Prop. 2023, 26, 2978–2992. [Google Scholar] [CrossRef]
- Suárez, P.L.; Velesaca, H.O.; Carpio, D.; Sappa, A.D. Corn kernel classification from few training samples. Artif. Intell. Agric. 2023, 9, 89–99. [Google Scholar] [CrossRef]
- Wang, Z.; Hu, Z.; Xiao, X. Crack Detection of Brown Rice Kernel Based on Optimized ResNet-18 Network. IEEE Access 2023, 11, 140701–140709. [Google Scholar] [CrossRef]
- Yang, Y.; Xiao, Y.; Chen, Z.; Tang, D.; Li, Z.; Li, Z. FCBTYOLO: A Lightweight and High-Performance Fine Grain Detection Strategy for Rice Pests. IEEE Access 2023, 11, 101286–101295. [Google Scholar] [CrossRef]
- Zhang, Z.; Zuo, Z.; Li, Z.; Yin, Y.; Chen, Y.; Zhang, T.; Zhao, X. Real-Time Wheat Unsound Kernel Classification Detection Based on Improved YOLOv5. J. Adv. Comput. Intell. Intell. Inform. 2023, 27, 474–480. [Google Scholar] [CrossRef]
- Balingbing, C.B.; Kirchner, S.; Siebald, H.; Kaufmann, H.-H.; Gummert, M.; Nguyen, V.H.; Hensel, O. Application of a multi-layer convolutional neural network model to classify major insect pests in stored rice detected by an acoustic device. Comput. Electron. Agric. 2024, 225, 109297. [Google Scholar] [CrossRef]
- Din, N.M.U.; Assad, A.; Dar, R.A.; Rasool, M.; Sabha, S.U.; Majeed, T.; Islam, Z.U.; Gulzar, W.; Yaseen, A. RiceNet: A deep convolutional neural network approach for classification of rice varieties. Expert. Syst. Appl. 2024, 235, 121214. [Google Scholar] [CrossRef]
- Dönmez, E.; Diker, A.; Elen, A.; Ulu, M. Multiple deep learning by majority-vote to classify haploid and diploid maize seeds. Sci. Hortic. 2024, 337, 113549. [Google Scholar] [CrossRef]
- Jeong, S.W.; Lyu, J.I.; Jeong, H.; Baek, J.; Moon, J.-K.; Lee, C.; Choi, M.-G.; Kim, K.-H.; Park, Y.-I. SUnSeT: Spectral unmixing of hyperspectral images for phenotyping soybean seed traits. Plant Cell Rep. 2024, 43, 164. [Google Scholar] [CrossRef]
- Kim, Y.; Kang, S.; Ajani, O.S.; Mallipeddi, R.; Ha, Y. Predicting early mycotoxin contamination in stored wheat using machine learning. J. Stored Prod. Res. 2024, 106, 102294. [Google Scholar] [CrossRef]
- Razavi, M.; Mavaddati, S.; Koohi, H. ResNet deep models and transfer learning technique for classification and quality detection of rice cultivars. Expert. Syst. Appl. 2024, 247, 123276. [Google Scholar] [CrossRef]
- Samanta, S.; Ajij, M.; Chatterji, S.; Pratihar, S. Fast and robust monitoring of broken rice kernels in the course of milling. Multimed. Tools Appl. 2024, 83, 51337–51365. [Google Scholar] [CrossRef]
- Siripatrawan, U.; Makino, Y. Assessment of food safety risk using machine learning-assisted hyperspectral imaging: Classification of fungal contamination levels in rice grain. Microb. Risk Anal. 2024, 27, 100295. [Google Scholar] [CrossRef]
- Van Puyenbroeck, E.; Wouters, N.; Leblicq, T.; Saeys, W. Detection of kernels in maize forage using hyperspectral imaging. Comput. Electron. Agric. 2024, 225, 109336. [Google Scholar] [CrossRef]
- Yang, X.; Ma, K.; Zhang, D.; Song, S.; An, X. Classification of soybean seeds based on RGB reconstruction of hyperspectral images. PLoS ONE 2024, 19, e0307329. [Google Scholar] [CrossRef] [PubMed]
- Zhang, Y.; Hui, Y.; Zhou, Y.; Liu, J.; Gao, J.; Wang, X.; Wang, B.; Xie, M.; Hou, H. Characterization and Detection Classification of Moldy Corn Kernels Based on X-CT and Deep Learning. Appl. Sci. 2024, 14, 2166. [Google Scholar] [CrossRef]
- Zareiforoush, H.; Minaei, S.; Alizadeh, M.R.; Banakar, A. Qualitative classification of milled rice grains using computer vision and metaheuristic techniques. J. Food Sci. Technol. 2016, 53, 118–131. [Google Scholar] [CrossRef]
- Basati, Z.; Rasekh, M.; Abbaspour-Gilandeh, Y. Using different classification models in wheat grading utilizing visual features. Int. Agrophysics 2018, 32, 225–235. [Google Scholar] [CrossRef]
- Mavaddati, S. Rice classification and quality detection based on sparse coding technique. Ije Trans. B Appl. 2018, 31, 1910–1917. [Google Scholar] [CrossRef]
- Koklu, M.; Ozkan, I.A. Multiclass classification of dry beans using computer vision and machine learning techniques. Comput. Electron. Agric. 2020, 174, 105507. [Google Scholar] [CrossRef]
- Barboza da Silva, C.; Oliveira, N.M.; de Carvalho, M.E.A.; de Medeiros, A.D.; de Lima Nogueira, M.; Dos Reis, A.R. Autofluorescence-spectral imaging as an innovative method for rapid, non-destructive and reliable assessing of soybean seed quality. Sci. Rep. 2021, 11, 17834. [Google Scholar] [CrossRef]
- Koklu, M.; Cinar, I.; Taspinar, Y.S. Classification of rice varieties with deep learning methods. Comput. Electron. Agric. 2021, 187, 106285. [Google Scholar] [CrossRef]
- Özkan, K.; Seke, E.; Isik, S. Wheat kernels classification using visible-near infrared camera based on deep learning. Pamukkale Univ. J. Eng. Sci. 2021, 27, 618–626. [Google Scholar] [CrossRef]
- Castro, É.B.L.; Melo, R.S.; Da Costa, E.M.; Pessoa, A.M.D.S.; Oliveira, R.K.B.; Bertini, C.H.C.D.M. Classification of phaseolus lunatus l. using image analysis and machine learning models. Rev. Caatinga 2022, 35, 772–782. [Google Scholar] [CrossRef]
- Khatri, A.; Agrawal, S.; Chatterjee, M.J. Wheat Seed Classification: Utilizing Ensemble Machine Learning Approach. Sci. Program. 2022, 2022, 2626868. [Google Scholar] [CrossRef]
- Qin, Z.; Zhang, Z.; Hua, X.; Yang, W.; Liang, X.; Zhai, R.; Huang, C. Cereal grain 3D point cloud analysis method for shape extraction and filled/unfilled grain identification based on structured light imaging. Sci. Rep. 2022, 12, 3145. [Google Scholar] [CrossRef] [PubMed]
- Uddin, M.; Islam, M.A.; Shajalal, M.; Hossain, M.A.; Yousuf, M.S.I. Paddy seed variety identification using T20-HOG and Haralick textural features. Complex. Intell. Syst. 2022, 8, 657–671. [Google Scholar] [CrossRef]
- Wang, X.; Wang, K.; Li, X.; Lian, S. Vision-Based Defect Classification and Weight Estimation of Rice Kernels. IEEE Access 2022, 10, 122243–122253. [Google Scholar] [CrossRef]
- Xu, P.; Tan, Q.; Zhang, Y.; Zha, X.; Yang, S.; Yang, R. Research on Maize Seed Classification and Recognition Based on Machine Vision and Deep Learning. Agriculture 2022, 12, 232. [Google Scholar] [CrossRef]
- Xu, P.; Zhang, Y.P.; Tan, Q.; Xu, K.; Sun, W.B.; Xing, J.J.; Yang, R.B. Vigor identification of maize seeds by using hyperspectral imaging combined with multivariate data analysis. Infrared Phys. Technol. 2022, 126, 104361. [Google Scholar] [CrossRef]
- Zia, H.; Fatima, H.S.; Khurram, M.; Hassan, I.U.; Ghazal, M. Rapid Testing System for Rice Quality Control through Comprehensive Feature and Kernel-Type Detection. Foods 2022, 11, 2723. [Google Scholar] [CrossRef]
- Agarwal, D.; Sweta; Bachan, P. Machine learning approach for the classification of wheat grains. Smart Agric. Technol. 2023, 3, 100136. [Google Scholar] [CrossRef]
- Dhakal, K.; Sivaramakrishnan, U.; Zhang, X.; Belay, K.; Oakes, J.; Wei, X.; Li, S. Machine Learning Analysis of Hyperspectral Images of Damaged Wheat Kernels. Sensors 2023, 23, 3523. [Google Scholar] [CrossRef] [PubMed]
- Golcuk, A.; Yasar, A. Classification of bread wheat genotypes by machine learning algorithms. Compos. Anal. 2023, 119, 105253. [Google Scholar] [CrossRef]
- Huang, S.; Lu, Z.; Shi, Y.; Dong, J.; Hu, L.; Yang, W.; Huang, C. A Novel Method for Filled/Unfilled Grain Classification Based on Structured Light Imaging and Improved PointNet++. Sensors 2023, 23, 6331. [Google Scholar] [CrossRef]
- Kini, M.G.R.; Bhandarkar, R. Quality Assessment of Seed Using Supervised Machine Learning Technique. J. Inst. Eng. Ser. B 2023, 104, 901–909. [Google Scholar] [CrossRef]
- Khan, M.S.; Nath, T.D.; Hossain, M.M.; Mukherjee, A.; Hasnath, H.B.; Meem, T.M.; Khan, U. Comparison of multiclass classification techniques using dry bean dataset. Int. J. Cogn. Comput. Eng. 2023, 4, 6–20. [Google Scholar] [CrossRef]
- Setiawan, A.; Adi, K.; Widodo, C.E. Rice Foreign Object Classification Based on Integrated Color and Textural Feature Using Machine Learning. Math. Model. Eng. Probl. 2023, 10, 572–580. [Google Scholar] [CrossRef]
- Xu, P.; Sun, W.; Xu, K.; Zhang, Y.; Tan, Q.; Qing, Y.; Yang, R. Identification of Defective Maize Seeds Using Hyperspectral Imaging Combined with Deep Learning. Foods 2023, 12, 144. [Google Scholar] [CrossRef]
- Bhattacharyya, S.K.; Pal, S. Design and performance analysis of decision tree learning model for classification of dry and cooked rice samples. Eur. Food Res. Technol. 2024, 250, 2529–2544. [Google Scholar] [CrossRef]
- Koppad, D.; Suma, K.V.; Nagarajappa, N. Automated Seed Classification Using State-of-the-Art Techniques. SN Comput. Sci. 2024, 5, 511. [Google Scholar] [CrossRef]
- Rajalakshmi, R.; Faizal, S.; Sivasankaran, S.; Geetha, R. RiceSeedNet: Rice seed variety identification using deep neural network. J. Agric. Food Res. 2024, 16, 101062. [Google Scholar] [CrossRef]
- Setiawan, A.; Adi, K.; Widodo, C.E. Comparative Analysis of Deep Convolutional Neural Network for Accurate Identification of Foreign Objects in Rice Grains. Eng. Lett. 2024, 32, 315–324. [Google Scholar]
- Shivamurthaiah, M.M.; Shetra, H.K.K. Non-destructive Machine Vision System based Rice Classification using Ensemble Machine Learning Algorithms. Recent Adv. Electr. Electron. Eng. 2024, 17, 486–497. [Google Scholar] [CrossRef]
- Yasar, A. Analysis of selected deep features with CNN-SVM-based for bread wheat seed classification. Eur. Food Res. Technol. 2024, 250, 1551–1561. [Google Scholar] [CrossRef]
Disclaimer/Publisher’s Note: The statements, opinions and data contained in all publications are solely those of the individual author(s) and contributor(s) and not of MDPI and/or the editor(s). MDPI and/or the editor(s) disclaim responsibility for any injury to people or property resulting from any ideas, methods, instructions or products referred to in the content. |
© 2025 by the authors. Licensee MDPI, Basel, Switzerland. This article is an open access article distributed under the terms and conditions of the Creative Commons Attribution (CC BY) license (https://creativecommons.org/licenses/by/4.0/).