Highlights
What are the main findings?
- Developed a framework to calibrate autonomous shuttle movement in a simulation environment with real-world trajectory data.
- Assessed the impact of autonomous shuttle movements in mixed traffic conditions.
What is the implication of the main finding?
- The calibration framework enables realistic simulation of autonomous shuttle operations, providing critical insights before large-scale implementation/commercial deployment.
- The findings can help shuttle operators to optimize shuttle frequency or speed without interrupting the regular traffic, or local authorities to accommodate additional infrastructures for shuttle operation.
Abstract
Autonomous shuttle services are currently introduced in different urban conditions throughout the world. As a result, studies are needed to assess the safety and mobility performance of such autonomous shuttle services. However, calibrating the movement of autonomous shuttles in a simulation environment has been a difficult task due to the absence of any real-world data. This study aims to assess the impact of the shuttle service on suburban road capacity through a calibrated simulation prototype of an operational shuttle system at Lake Nona, Orlando, Florida. The movements of autonomous vehicles are calibrated using real-world trajectory data, which helps replicate the driving behavior of the shuttle in the simulation. The analysis reveals that with increasing frequency of the shuttle service, the delay time percentage of the shared road sections increases and traveling speed decreases. A moving bottleneck phenomenon is also observed with the shuttle movement. The findings also demonstrate that increasing the speed of shuttles up to 10 mph can improve traffic conditions, which are constrained by the operational safety aspects. The findings from this study provide insights for policymakers and transportation agencies towards deploying autonomous shuttles and for planning road infrastructures for shared road-use of autonomous and human-driven vehicles.
1. Introduction
Advances in vehicular automation have created opportunities to reshape the urban mobility landscape and transportation systems. Autonomous vehicles (AV) or connected autonomous vehicles (CAV) are expected to serve a significant portion of travel demand in the future. Increasing penetration of autonomous vehicles is expected to significantly contribute to—crash reduction, travel time reduction, fuel savings, and equity improvement—which are attracting policymakers to introduce autonomous vehicles in different cities [1,2,3,4,5,6].
The potential impact of vehicle automation is not limited to personal transportation only; public transit is also expecting automation to improve safety and efficiency. To this end, autonomous shuttles have emerged as a highly promising transportation mode, with several pilots being introduced in different places in the last few years [7]. Some of the busiest cities of the world, including Singapore, Paris, Tokyo, and Perth, and several states, including Florida, California, and Nevada in the USA, are implementing autonomous shuttles in different urban contexts [8,9,10,11,12]. They represent a prospective solution for both on-demand and scheduled mass transit, offering significant potential for the future of public transportation [13,14,15].
One of the most prominent features of autonomous vehicles is that these vehicles can be operated with a smaller headway than usual, increasing roadway capacity and causing less congestion and reduced travel time [16]. However, some studies also suggest that in several cases, automated vehicles are deteriorating road capacity as a result of low-level automation or shorter stop-to-stop gaps [17]. Cao and Avi [18] found that shuttle systems offering demand-based skip-stop services provide a better service to passengers due to reduced travel time, with improved network performance by reducing congestion. For autonomous shuttles, network performance is affected by operating conditions like the use of a dedicated lane and the increasing penetration of autonomous vehicles [19].
As currently autonomous shuttles are being piloted in many communities, considering the opportunities they provide for mobility without vehicle ownership, there is growing interest among policymakers and traffic management agencies to know how these shuttles would impact roadway capacity. Although several studies have assessed the impact of autonomous shuttle movement, those studies have some limitations. Mixed traffic, comprising autonomous shuttles and other types of vehicles, creates unique traffic flow characteristics that are comparatively new to researchers. This requires proper calibration of vehicle movements in simulation platforms.
In this study, we aim to answer the research question: What are the impacts of autonomous shuttle movement on road capacity in an urban traffic network? The objective of this study is to evaluate the impact of autonomous shuttles on urban road environments by adopting a microscopic traffic simulation approach. To accomplish this objective, we have created an autonomous shuttle movement network in a microscopic traffic simulation platform following a real-world deployment of autonomous shuttles in Lake Nona, Orlando, Florida. The simulation model has been calibrated for traffic demand and vehicle movement parameters for both autonomous shuttles and human-driven vehicles (HDV) using detector data and real-world vehicle trajectory data obtained from field measurements. Later, we performed an impact analysis of autonomous shuttle movement under different scenarios, including travel demand projections and possible headways of the operated autonomous shuttles.
The calibration of simulation parameters for autonomous vehicles and/or shuttles was not possible in most of the previous studies due to the lack of real-world data. However, automated shuttles are being piloted in different urban environments. These operations are providing opportunities to researchers to calibrate simulation parameters of autonomous shuttles, incorporating real-world travel demand and vehicle movement data to produce more accurate results of the potential impact of autonomous shuttles. The novelty of this study is that we analyzed the impact of the autonomous shuttle movement with a calibrated simulation prototype. We calibrate the autonomous shuttle movement using trajectory data collected through field measurements from a real-world deployment of autonomous shuttles.
There are significant implications of this study. This work will provide an opportunity for traffic management agencies to have a better understanding of the impact of operating autonomous shuttles on urban roads in mixed traffic conditions. The calibrated microscopic behaviors of autonomous shuttles and HDVs will help to correctly emulate traffic movement in a real-world environment. This study can demonstrate the real-world impact of autonomous shuttles on road capacity and suggest policies for shuttle operations to optimize travel time and traffic flows for autonomous shuttles and other road users.
2. Literature Review
The review on the state-of-the-art focuses on previous studies on the impacts of autonomous vehicles/shuttles on roadway capacity, the modeling procedures adopted by existing studies, typical scenarios modeled for impact evaluation, and the calibration procedure of microscopic traffic simulation models.
Several studies have investigated the impact of autonomous vehicles (AV) or connected autonomous vehicles (CAV) carrying passengers on the transportation network. Most of the impact assessments used microscopic traffic simulation models using open-source (e.g., SUMO) or commercial (e.g., VISSIM and AIMSUN) simulation platforms. These studies revealed that the penetration rate of AVs is an important parameter in determining how AVs can influence road capacity. Using VISSIM, Park et al. [20] observed an improvement in traffic flow capacity with increasing AV penetration rate in an urban road network. This study suggests that for saturated penetration levels of AVs, road network capacity can increase up to 40%. Using microscopic simulation on a freeway, Talebpour et al. [21] showed that AVs can significantly increase highway capacity using a reserved lane when the penetration rate is more than 50% for two-lane freeways and more than 30% for four-lane freeways. Lu et al. [22] used microscopic simulation on SUMO to assess how different penetration levels of AVs impact the urban road network and found similar correlations between AV penetration rates and roadway capacity.
Some studies also focused on the impact of autonomous shuttles depending on their operating routes. Ziakopoulos et al. [19] studied the impact of an on-demand autonomous shuttle on the urban road network via microscopic simulation, considering different scenarios such as mixed movement of autonomous shuttles and HDVs and a dedicated lane for shuttle movement. This study also considered different penetration rates of autonomous shuttles and found that a higher penetration rate of autonomous shuttles reduces travel time. Similarly, Oikonomou et al. [23] studied the impact of autonomous shuttles on road capacity, traffic safety, and the environment through microscopic simulation, where they showed that operations of a shuttle service increased delay, specifically during off-peak periods. Mourtakos et al. [24] studied the impact of on-demand mobility services through simulation, where they found that implementation of the services would lead to decreased delay at a network level.
The reviewed literature revealed some gaps in the existing works on the impact analysis of the autonomous shuttle on urban road capacity. All works on the impact analysis of autonomous shuttles are based on simulation. However, car-following models simulating the behavior of autonomous shuttles and HDVs were not calibrated in earlier works due to the lack of real-world mixed road use data observing the interactions between automated shuttles and HDVs. Since autonomous shuttle operations are comparatively new, no shuttle trajectory data is currently publicly available to the best of our knowledge.
The purpose of calibrating a simulation model is to emulate the characteristics of real-world traffic by tuning different simulation parameters and reducing errors between field observations and simulated data. The calibration of traffic simulation models is conducted at two different levels. The first level is to calibrate the volume of traffic or the origin-destination demand matrix, the route choice behavior model, and the other level is to calibrate the car-following and lane-changing behaviors used in simulation [25,26]. Both levels are important for a simulation-based approach to replicate a real-world scenario. Different sources of real-world data are used for the calibration process. For instance, data from vehicle detectors, GPS trajectories from vehicles, and video-based trajectories are used for simulation calibration. Detector data reveal macroscopic properties, and vehicle trajectory data reveal microscopic properties [27,28]. Several goodness-of-fit metrics, such as Geoffrey E. Havers (GEH) statistics, root mean square error (RMSE), and mean absolute percentage error (MAPE), are typically used in the macroscopic calibration process to quantify errors [25,26,27,28,29].
Different car-following models are used for modeling AVs and HDVs in various circumstances. The car-following models use different parameters, such as maximum and minimum desired acceleration, deceleration values, desired speed, reaction time, sensitivity, etc., to replicate the real-world road traffic environment in simulation [30,31]. The car-following models used in different studies include the General Motors model, collision avoidance models (e.g., Gipps model), psychophysical models (e.g., Wiedemann model), desired measures models (e.g., the intelligent driver model (IDM), the adaptive cruise control (ACC), and cooperative adaptive cruise control (CACC) models) [30,32]. Yang et al. [33] introduced a novel framework in combination with machine learning models and the Gipps model to emulate AV driving behavior with enhanced safety and robustness. Coropulis et al. [34] compared the performance of two psycho-physical models (Wiedemann and Fritzsche), the collision avoidance model (Gipps), and the IDM model, where they concluded that the Gipps model is superior to simulate AV.
Several studies used real-world AV trajectory data to calibrate microscopic vehicle movement parameters in simulation. de Souza and Stern [35] used trajectory data from ACC-enabled cars to calibrate car-following models. Milanés and Shladover [36] used similar experimental test-track data from commercial ACC and prototype CACC-enabled vehicles for their calibration purpose. As per our knowledge, only one previous study, Favero and Elefteriadou [37], performed the calibration of an autonomous shuttle’s car-following behavior in a traffic simulation. They considered using IDM, improved IDM, and the CACC model, where the ACC model produced the lowest error in predicting instantaneous speed and spacing. They also observed that the autonomous shuttle is demonstrating a more cautious car-following model parameter value than the earlier AV studies. However, no previous study has assessed the traffic impact and moving bottleneck behavior of an autonomous shuttle with a calibrated simulation model. We addressed this significant research gap in this study.
3. Methodology
In this section, we present the study area, models for autonomous shuttle movement, the calibration framework, and the scenarios developed to compare the impact of shuttle movement. Figure 1 presents the study methodology, where the main components are the selection of the study area and simulation network setup, the microscopic movement model calibration, the travel demand calibration, and finally the impact analysis.
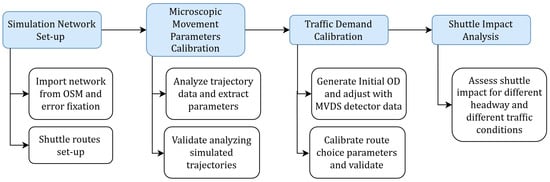
Figure 1.
Study methodology.
3.1. Study Area with a Real-World Autonomous Shuttle System
Autonomous mobility service provider Beep is operating shuttle services in the Lake Nona region of Orlando, Florida, United States. Lake Nona is a mixed urban area close to Orlando International Airport [8]. Beep is operating its current shuttle services daily on six routes in limited time periods. The current Beep movement is on-demand, and the shuttle is autonomous in only two routes, but the organization is planning to expand its autonomous shuttle service to other routes. All six operating routes with route length, number of stops, and current conditions are provided in Table 1.

Table 1.
Autonomous shuttle routes.
The simulation model is developed in Aimsun Next (version 24.0.2) traffic simulator, a commercial software package for transportation modeling and planning [38]. As microscopic movements are included in our research scope, a microscopic simulation platform is selected for this study. We have included the main road network of the study area in our simulation. The road network geometry is first imported from the OpenStreetMap platform [39], and then the geometric and functional characteristics of the road sections, such as the number of lanes, lane reservations (e.g., transit priority), and posted speed limits, are manually corrected based on high-resolution Google Maps aerial imagery to replicate the actual road network in Lake Nona. The intersection characteristics, such as the number of allowed movements, stop, yield directions, and signal plans, are provided in the model. Elevation and grade are not modified and are kept at the default zero grade, as the study area is characterized by flat terrain where vertical geometry has negligible influence on vehicle behavior. All six operating or probable routes of the shuttle movement are also incorporated in the simulation (see Figure 2). Two types of vehicles are simulated, including passenger cars as HDVs and Beep autonomous shuttles. For passenger cars, the vehicle dimension is provided as the standard dimension of a sedan, and for modeling Beep shuttles, the dimensions of the shuttles are obtained from their manufacturer company, Navya from Villeurbanne, France [40]. The shuttle stops are provided as they are currently located. Pedestrian movement is not included in the simulation as the number of pedestrians is quite negligible.
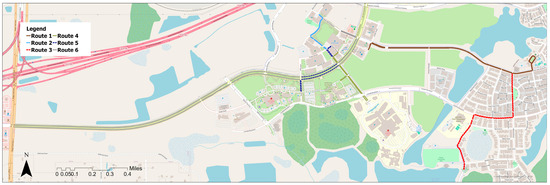
Figure 2.
Shuttle routes in the Lake Nona region simulation.
3.2. Vehicle Microscopic Movement Calibration
Vehicle movements in simulations are mainly controlled by their speed and their dynamic and microscopic models, which are used to accurately represent and imitate driving behaviors. Gipps car-following and lane-changing models are applied in previous studies for both HDV and AV/CAV modeling, and they are chosen as the car-following and lane-changing models in this study [19,23,24,30]. Gipps model is a safety distance-based model governing through kinematic constraints, e.g., maximum acceleration, deceleration, gap between vehicles, etc., which are essential to regulate autonomous shuttle driving behaviors. Although the Gipps model is used for modeling human driving behavior, prior studies demonstrated that the Gipps model can produce AV driving behavior by adjusting the model parameters rather than altering the model structure [34,41,42]. This model predicts the behavior of the following vehicle by assuming that drivers have a preferred limit for the vehicle acceleration and deceleration for collision avoidance and safe driving, which is applicable for both autonomous shuttles and HDVs [30,38]. The vehicle movement models are calibrated using the vehicle trajectories obtained by field data collection efforts.
The field data collection efforts are described as follows:
- We have collected vehicle trajectory data by keeping a GPS device in a sedan car (to reflect an HDV) and in the autonomous shuttles in 1 s intervals (Figure 3) [43]. We collected one round-trip trajectory of data for each HDV and autonomous shuttle on route 1. Our GPS device is placed inside our car, and the autonomous shuttle is used to collect trajectory data.
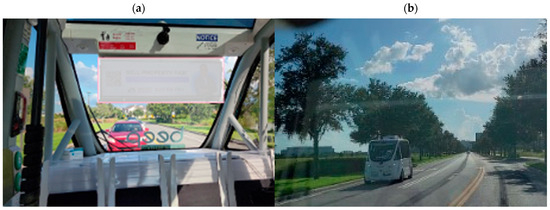 Figure 3. Photos taken during the trajectory data collection: (a) Inside the shuttle, HDV queues are visible behind; (b) Outside the shuttle, no queue is observed.
 - The HDV was following the autonomous shuttle throughout the full route during the trajectory data collection procedure. As the shuttle is operated visibly at a very low speed, effectively, it does not show any car-following behavior in its route. But sometimes it takes unscheduled stops to release the queue of HDVs behind it. This stopping time is ignored in our calculation. So, the free-flow speed of the shuttle and the regular stops are traced in our trajectory data. For the HDV, the car-following behavior is reflected.
- The travel times for each trip direction are obtained from the trajectory data. Similar scenarios are developed in the simulation to match the travel time of simulated vehicles with real-world observations.
Favero and Elefteriadou [37] demonstrated that the desired speed, acceleration, deceleration, and spacing-related parameters are most significant to imitate autonomous shuttle microscopic movement in simulation. One notable limitation of our trajectory data collection effort is that we could not collect any trajectory data to capture the effective car-following behavior of the autonomous shuttle, as the shuttle operates at very low speeds and does not frequently engage in active car-following behavior during its operation. Nonetheless, we believe that the available trajectory is sufficient for estimating some primary movement parameters. We will calibrate three major movement parameters in this study:
- Desired speed
- Maximum acceleration
- Normal deceleration
The remaining car-following and lane-changing model parameters’ standard values will be adopted from Coropulis et al. [41] for use in the Aimsun Next traffic simulator. This calibrated autonomous shuttle prototype is sufficient to estimate the network-level traffic impact.
We calculate the relevant parameters for both HDVs and the autonomous shuttle by analyzing their trajectory data. This involved identifying acceleration, steady-state, and deceleration events through detailed examination of the data patterns and the application of appropriate thresholds. The criteria used for event classification are summarized in Table 2. We calculate the desired speed as 85 percentiles of the steady state speed values, since the GIS-based data collection might provide slightly higher instantaneous values than the actual speed. Similarly, for maximum acceleration, we consider the 95 percentiles of the accelerating event accelerations. We did not observe any hard-braking events in our data collection; therefore, we consider all the decelerating events as regular deceleration and consider 95 percentiles of the decelerating event decelerations as normal deceleration.
Table 2.
Thresholds to identify events from trajectory data.
Table 3 provides the calculated parameters for both HDV and autonomous shuttles, as well as the adopted values for other parameters from Coropulis et al. [41].
Table 3.
Vehicle microscopic modeling parameters.
The validation of this process is performed by comparing the travel time of HDV following the shuttle in route 1 in the simulation experiment against the actual time observed in the field experiment. The validation result is shown in Table 4, where for the route 1 eastbound and westbound directions, the simulated and actual travel times are compared. The validation result implies that the absolute error percentage in calibration and validation results for HDV movement is close to the MAPE value of 4.86.
Table 4.
Validation results (HDVs travel time in route 1 following the shuttle).
The calibrated lower desired speed of the autonomous shuttles in the Lake Nona area reflects operational safety considerations rather than technical limitations. Although the shuttles can technically operate at speeds up to approximately 25 mph, current deployments intentionally govern shuttle speed to reduce operational risk while the automation technology continues to develop [44,45]. This approach is consistent with practitioner perspectives, and survey results indicate that operational speed is among the lowest priorities for improvement, whereas passenger safety ranks among the highest concerns [46]. Accordingly, the shuttle is operated at a desired speed of 10.75 mph despite a posted roadway speed limit of 25 mph.
3.3. Travel Demand and Route Choice Calibration
We calibrate the study area traffic demand from 6 AM to 7 PM. The traffic demand is introduced in the simulation through a centroid-to-centroid demand matrix. We divided the Lake Nona area into seven internal traffic analysis zones (TAZ). Seven external TAZs are also used to generate the internal to external, external to internal, and external to external traffic flow. In total, 14 centroids are considered here for the origin–destination (O–D) matrix (see Figure 4a). The initial traffic demand for the study area is extracted using OpenPaths Patterns by Bentley Systems for 2019. This estimation is performed using a combination of diversified data sources, i.e., anonymized GPS data from smartphones, traffic detector count, travel behavior survey, etc [47].
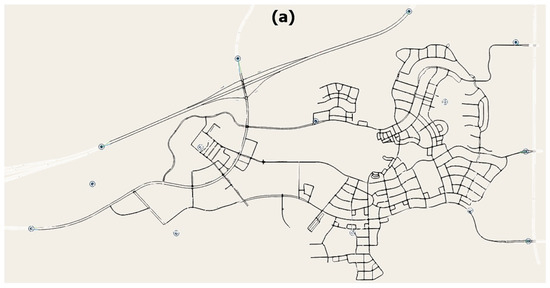
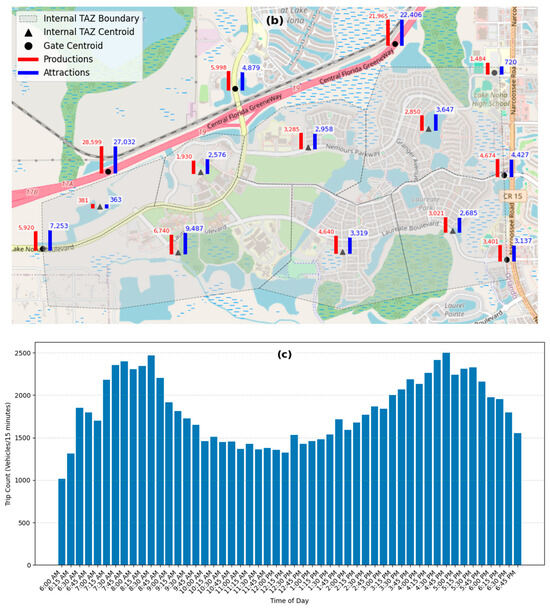
Figure 4.
(a) Simulation network and traffic generation and attraction centroids, (b) Total trip generation and attraction in centroids, (c) Trip demand variation throughout the 13 h simulation.
The next step is the calibration of the generated demand. The O–D demands are calibrated using aggregated vehicle volume data collected from road detectors. We did not find any detectors inside the Lake Nona community. However, there are MVDS detectors available from the Regional Integrated Transportation Information System (RITIS) in the Central Florida Greeneway (SR 417) [48]. We collect detection data from 10 RITIS MVDS detectors and selected a representative day (February 13) from the 2024 traffic records. This day is chosen to ensure that no outliers are present in the daily traffic counts across the selected detectors. Next, we adjust or calibrate the demand matrix for 2024, which is performed using a static O–D adjustment procedure in Aimsun Next [49]. Six detectors are used for this calibration, and the remaining four are used for validation. Figure 4b presents the adjusted O–D demand throughout the 13 h simulation (6 AM to 7 PM).
The O–D adjustment procedure is followed by the mesoscopic simulation, which is used to generate path assignment for the microscopic simulation. The assigned paths increase the microscopic simulation accuracy. A certain proportion of the vehicles in the microscopic simulation have the option to follow the path assigned by the mesoscopic simulation, and the others can fix their path in the microscopic simulation to reach their destination. This proportion is determined through the calibration procedure. The route choice calibration process is performed using a dynamic traffic assignment procedure to minimize the difference between actual and simulated data in different volume detectors. The calibrated parameters of dynamic traffic assignment are provided in Table 5.
Table 5.
Calibrated parameters of dynamic traffic assignment.
Calibration accuracy is measured using the GEH (Geoffrey E. Havers) value. If the GEH value is less than 5, it indicates very good calibration, and if the value is more than 5 but less than 10, it indicates the requirement of further investigation [25,50]. The calibration accuracy is provided in Table 6. The calibration measurement indicates the demand is well-calibrated, all 4 validation detector GEH values are within 5. The calculated mean absolute percentage error (MAPE) value is 0.68%, and the root mean square error (RMSE) value is 208 trips/13 h in the validation detectors. The calibration and validation error measurement indicates that the trip demand of the simulation model is well-calibrated.
Table 6.
Calibration accuracy measurement for 13 h simulation duration.
The trip demand throughout the simulation period in Figure 3b shows that there are two peaks in the full-day demand. This study considers one-hour off-peak (11 AM to 12 PM) and one-hour peak (4 PM to 5 PM) periods for impact assessment.
3.4. Scenarios for Simulation Experiments
Since our objective is to assess the impact of the shuttle movement on transportation facilities, the best way of analyzing the impact is to measure how the frequency of shuttle movement is contributing to increasing/decreasing the delay in the operating routes and how the traveling speed is being affected. Thus, we have used the delay/travel time ratio (%) and speed (mph) of the HDVs as impact assessment metrics. We have considered different scenarios of traffic operations to compare the performance of shuttle movements. We have assessed the impact of shuttles on three routes (No. 1, 3, and 6).
- S0: The baseline scenario without any autonomous shuttle movement in all three routes, only HDVs are operated.
- S1: Long interval (30 min) between consecutive shuttles.
- S2: Medium interval (20 min) between consecutive shuttles.
- S3: Small interval (10 min) between consecutive shuttles.
- S4: Repeat of the S3 scenario, but the shuttle speed is adjusted on a trial-and-error basis until the simulation result becomes close to the S0 scenario.
The speed of the HDVs is controlled by the road speed limit as well as the vehicle’s microscopic properties. To reduce stochastic variation in Aimsun outputs, all results are averaged over three independent replications using different random seeds. This improves the stability of the traffic analysis results across scenarios.
4. Results and Discussions
Figure 5 presents the off-peak vs. peak period road statistics for HDVs, which are the outputs of the simulated traffic experiments. It is observed that for all the evaluated scenarios, the aggregated delay/travel time ratio is higher, and the mean travel speed is lower in the peak period, though the difference is negligible.
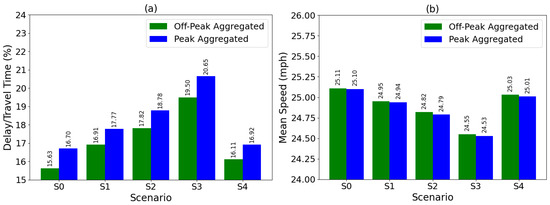
Figure 5.
Off-peak vs. peak period road statistics for HDVs (a) mean delay time/travel time percentage, and (b) mean speed.
From the implemented scenarios S0 to S3, it is observed that for the HDVs, the aggregated delay/travel time ratio increases with the decreasing intervals between shuttles. The delay/travel time ratio is increased by 3.87 percentage points in the off-peak and by 3.95 percentage points in the peak period from scenario S0 to S3. The weighted speed of the traffic flow also reduces by 0.56 mph in the off-peak period modeling and by 0.57 mph in peak period modeling from scenario S0 to S3. The reason for this increase in delay time and decrease in speed is probably the difference in speed between the shuttles and HDVs. The road speed limit on route 1 is 25 mph, on Route 3 it varies between 20 and 15 mph in different sections, and on route 6 the speed limit is 30 mph. The HDV generally runs close to the road speed limit, but the shuttle speed is calibrated to 10.75 mph in this study. Most of the sections in routes 1 and 3 are one lane only, which means no overtaking or limited overtaking scope for the queuing vehicles behind the shuttle.
Scenario S4 is created to test the hypothesis that increasing shuttle speed will improve the road condition by decreasing delays. It is observed that when the shuttle speed is increased to 20 mph, the average delay/travel time ratio for HDV is reduced by 3.39 percentage points (from 19.50% to 16.11%) in off-peak period, and by 3.73 percentage points (from 20.65% to 16.92%), close to the baseline scenario S0 with no shuttle, despite the shuttle frequency remaining at 10 min/trip. The weighted mean speed of the road segments also improved from 24.55 mph during the off-peak period in S3 to 25.03 mph in S4. Similar improvements are also observed during the peak period when the shuttle speed increases to 20 mph. Nevertheless, this is only a hypothetical solution to this issue. Increasing the speed of autonomous shuttles depends on many factors, including prevailing regulations to ensure the safety of other road users, such as drivers and pedestrians etc. As discussed previously, the current state of vehicle automation technology does not consider it safe to operate the autonomous shuttles at higher speeds than the current operating speed in mixed-traffic conditions. Therefore, increasing the operational speed can only be possible after significant development of vehicle automation technology.
Figure 6 presents a moving bottleneck analysis for the shuttle movement in different road segments or sections of the route 1, eastbound and westbound. For this analysis, we run experiments with 5 min data collection intervals in these road sections with 30 min shuttle operation interval and regular operating speed (10.75 mph). The delay time/travel time percentage time series for these road sections in each subplot demonstrates that the delay peaks are associated with the shuttle’s passing time, which reveals a consistent pattern of moving bottleneck associated with the shuttle movement. One key observation is that the bottleneck moves gradually to the downstream sections. Section ids 1–10 represent the westbound directions where the shuttle starts its journey, and Sections 11–18 represent the eastbound directions where it finishes its trip. Upstream sections experience their highest delay in earlier intervals, while downstream sections exhibit their peak delay in later intervals. Such a pattern can be observed in moving bottleneck incidents, wherein a slow-moving vehicle reduces the effective capacity of each section it enters, producing a delay in the traffic stream. Once the shuttle exits a section, the delay rapidly diminishes, indicating that the bottleneck is not stationary but propagates downstream with the shuttle.
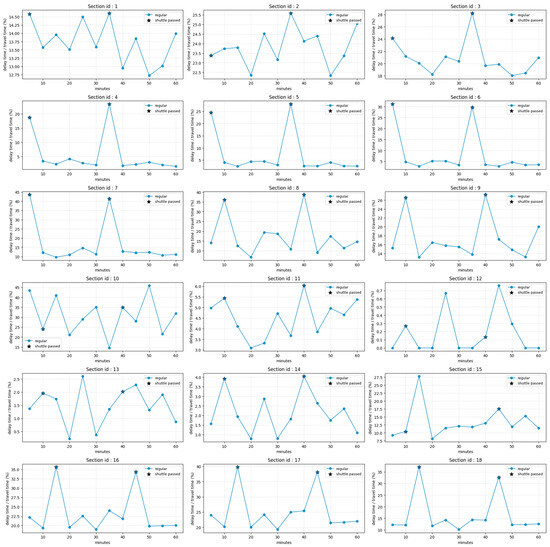
Figure 6.
Moving Bottleneck effect of the autonomous shuttle.
5. Conclusions
This study evaluates the operational impacts of an autonomous shuttle in mixed traffic using a microscopic traffic simulation model calibrated with real-world trajectory data. There are several outcomes of this study. The experiments of this study, integrating calibrated shuttle movement in different intervals, provide insights into how low-speed autonomous shuttles can influence mixed traffic operation.
First, this study calibrates several microscopic movement parameters of autonomous shuttles in Gipps car-following model, using real-world trajectory data, which can be used in the future for simulating the microscopic behavior of automated shuttles. These parameters can approximately represent autonomous vehicle mobility in a simulation environment, which would be important to evaluate their traffic flow impacts. The shuttle movement calibration framework in this study demonstrates how real-world trajectory data, even with operational constraints, can be used to calibrate a simulation model for impact assessment.
Second, this study evaluates the limits of an existing autonomous shuttle system and provides insights on how to improve system performance. The findings demonstrate that a low-speed autonomous shuttle can function as a moving bottleneck, producing measurable reductions in traffic speed and increases in travel time. The analysis also indicates how a modest increase in shuttle speed, maintaining safety constraints, can mitigate this effect. This simulation framework can serve as a decision-support tool for transportation planners to evaluate trade-offs between improved connectivity for shuttle operation and impacts on mixed traffic conditions.
There are several limitations of the study. First, the microscopic movement parameters of the shuttles are calibrated using single round-trip data. The trajectory data collection effort was constrained by limited cooperation from the shuttle operator, which restricted our ability to obtain additional data in different traffic conditions. Moreover, no leader vehicle was available during data collection, restricting the ability to observe shuttle car-following behavior. Second, most segments of the study corridor consist of a single lane, and the shuttle does not actively demonstrate any lane-changing behavior. Consequently, the calibration of lane-choice or overtaking behavior is beyond the scope of this study. Within these operational constraints, we focus on empirically calibrating the key parameters that characterize the shuttle’s single lane free-flow movement, whereas the remaining model parameters are adopted from earlier autonomous mobility simulation research.
Future work can address these limitations by collecting a larger set of shuttle trajectories across different traffic conditions, incorporating scenarios with controlled leader–follower interactions. Studies employing alternative advanced car-following models may also provide deeper insights into shuttle dynamics and their broader traffic impacts. Additionally, leveraging high-resolution localization and perception data from advanced onboard sensors, instead of relying solely on low-precision GPS devices, would further enhance the accuracy and robustness of the calibration procedure.
The autonomous vehicles are expected to transform the urban transportation landscape. However, comprehensive assessments of their traffic impact and safety implications are essential before widespread deployment. This study provides a simulation-based framework, first to calibrate the driving behavior of the autonomous shuttle in simulation and to evaluate the effects of the autonomous shuttle movements under various service scenarios. The findings of this study provide critical insights to support their effective integration into mixed traffic environments.
Author Contributions
Conceptualization and methodology, S.R., B.-h.N.-B., and S.H.; software, S.R.; data collection, S.R.; analysis and investigation, S.R., B.-h.N.-B., and S.H.; writing—original draft preparation, S.R.; writing—review and editing, B.-h.N.-B., S.H.; visualization, S.R.; supervision, B.-h.N.-B., S.H. All authors have read and agreed to the published version of the manuscript.
Funding
The authors received no specific grant from funding agencies for this study.
Data Availability Statement
The travel demand-related data cannot be shared because of an agreement with the data provider. The trajectory dataset is available on request from the authors.
Acknowledgments
The authors acknowledge Aimsun for providing the Aimsun Next license for the simulation and Bentley Systems for providing the OpenPaths Patterns data to develop the travel demand. The authors would like to thank Glenn Cook, founder and CEO of Transports, and Mark Reid, Co-founder of Beep, for their valuable information regarding Beep shuttle movement and facilitating field data collection; and Mobasshir Rashid, Graduate Research Assistant, UCF for his valuable efforts in vehicle trajectory data collection. The authors would also like to acknowledge the partial support from Mobility Insight Ltd. ChatGPT versions 5.1 and 5.2 are used when preparing the draft of this manuscript to assist in reconstructing or polishing some author-provided text only.
Conflicts of Interest
The authors declare that they have no known competing financial interests or personal relationships that could have appeared to influence the work reported in this paper. The funders had no role in the design of the study; in the collection, analyses, or interpretation of data; in the writing of the manuscript; or in the decision to publish the results.
Abbreviations
The following abbreviations are used in this manuscript:
| AV | Autonomous Vehicle |
| CAV | Connected and Autonomous Vehicle |
| GEH | Geoffrey E. Havers |
| HDV | Human-driven Vehicle |
| MAPE | Mean Absolute Percentage Error |
| RITIS | Regional Integrated Transportation Information System |
| RMSE | Root Mean Square Error |
| TAZ | Traffic Analysis Zone |
References
- Alessandrini, A.; Campagna, A.; Site, P.D.; Filippi, F.; Persia, L. Automated vehicles and the rethinking of mobility and cities. Transp. Res. Procedia 2015, 5, 145–160. [Google Scholar] [CrossRef]
- Bahamonde-Birke, F.J.; Kickhöfer, B.; Heinrichs, D.; Kuhnimhof, T. A Systemic View on Autonomous Vehicles: Policy Aspects for a Sustainable Transportation Planning. DISP 2018, 54, 12–25. [Google Scholar] [CrossRef]
- Asadi, S.; Madjid, B.; Asadi, M.; Oliver, T. Autonomous vehicles: Challenges, opportunities, and future implications for transportation policies. J. Mod. Transp. 2016, 24, 284–303. [Google Scholar] [CrossRef]
- Blas, F.; Giacobone, G.; Massin, T.; Rodríguez Tourón, F. Impacts of vehicle automation in public revenues and transport equity. Economic challenges and policy paths for Buenos Aires. Res. Transp. Bus. Manag. 2022, 42, 100566. [Google Scholar] [CrossRef]
- Nahmias-Biran, B.H.; Dadashev, G.; Levi, Y. Demand Exploration of Automated Mobility On-Demand Services Using an Innovative Simulation Tool. IEEE Open J. Intell. Transp. Syst. 2022, 3, 580–591. [Google Scholar] [CrossRef]
- Nahmias-Biran, B.H.; Oke, J.B.; Kumar, N. Who benefits from AVs? Equity implications of automated vehicles policies in full-scale prototype cities. Transp. Res. Part A Policy Pract. 2021, 154, 92–107. [Google Scholar] [CrossRef]
- Haque, A.M.; Brakewood, C. A synthesis and comparison of American automated shuttle pilot projects. Case Stud. Transp. Policy 2020, 8, 928–937. [Google Scholar] [CrossRef]
- Beep. Move Nona. 2025. Available online: https://ridebeep.com/autonomous-mobility/ (accessed on 29 June 2023).
- Unmanned System Technology. Driverless Bus Route Introduced in Singapore. 2024. Available online: https://www.unmannedsystemstechnology.com/2024/07/driverless-bus-route-introduced-in-singapore/ (accessed on 30 September 2025).
- Smart Cities World. Driverless Passenger Shuttle Launched in Paris Ile-de-France. 2021. Available online: https://www.smartcitiesworld.net/news/news/driverless-passenger-shuttle-launched-in-paris-ile-de-france-6262 (accessed on 29 June 2023).
- Freethink. Toyota’s Autonomous Shuttle is Optimized for Olympians. 2021. Available online: https://www.freethink.com/hard-tech/autonomous-shuttle (accessed on 29 June 2023).
- Drive. Australia’s First Autonomous Bus Hits the Road in Perth. 2016. Available online: https://www.drive.com.au/news/australias-first-autonomous-bus-hits-the-road-in-perth/ (accessed on 29 June 2023).
- Ainsalu, J.; Arffman, V.; Bellone, M.; Ellner, M.; Haapamäki, T. State of the Art of Automated Buses. Sustainability 2018, 10, 3118. [Google Scholar] [CrossRef]
- Bucchiarone, A.; Member, A.; Battisti, S.; Marconi, A.; Maldacea, R.; Ponce, D.C. Autonomous Shuttle-as-a-Service (ASaaS): Challenges, Opportunities, and Social Implications. IEEE Trans. Intell. Transp. Syst. 2020, 22, 3790–3799. [Google Scholar] [CrossRef]
- Grahle, A.; Bender, B. Autonomous Shuttles for Urban Mobility on Demand Applications—Ecosystem Dependent Requirement. In Proceedings of the Design Society: DESIGN Conference; Cambridge University Press: Cambridge, UK, 2020; pp. 887–896. [Google Scholar]
- Lu, Q.; Tettamanti, T.; Hörcher, D.; Varga, I. The impact of autonomous vehicles on urban traffic network capacity: An experimental analysis by microscopic traffic simulation. Transp. Lett. 2020, 12, 540–549. [Google Scholar] [CrossRef]
- Calvert, S.C.; Schakel, W.J.; van Lint, J.W.C. Will automated vehicles negatively impact traffic flow? J. Adv. Transp. 2017, 2017, 3082781. [Google Scholar] [CrossRef]
- Cao, Z.; Avi, A. Autonomous shuttle bus service timetabling and vehicle scheduling using skip-stop tactic. Transp. Res. Part C 2019, 102, 370–395. [Google Scholar] [CrossRef]
- Ziakopoulos, A.; Oikonomou, M.G.; Vlahogianni, E.I.; Yannis, G. Quantifying the implementation impacts of a point to point automated urban shuttle service in a large-scale network. Transp. Policy 2021, 114, 233–244. [Google Scholar] [CrossRef]
- Park, J.E.; Byun, W.; Kim, Y.; Ahn, H.; Shin, D.K. The Impact of Automated Vehicles on Traffic Flow and Road Capacity on Urban Road Networks. J. Adv. Transp. 2021, 2021, 8404951. [Google Scholar] [CrossRef]
- Talebpour, A.; Mahmassani, H.S.; Elfar, A. Investigating the Effects of Reserved Lanes for Autonomous Vehicles on Congestion and Travel Time Reliability. Transp. Res. Rec. J. Transp. Res. Board 2017, 2622, 1–12. [Google Scholar] [CrossRef]
- Lu, X.; Yu, J.; Yang, X.; Pan, S.; Zou, N. Flexible feeder transit route design to enhance service accessibility in urban area. J. Adv. Transp. 2016, 50, 507–521. [Google Scholar] [CrossRef]
- Oikonomou, M.G.; Orfanou, F.P.; Vlahogianni, E.I.; Yannis, G. Impacts of Autonomous Shuttle Services on Traffic, Safety and Environment for Future Mobility Scenarios. In Proceedings of the 2020 IEEE 23rd International Conference on Intelligent Transportation Systems, ITSC 2020, Rhodes, Greece, 20–23 September 2020; IEEE: Piscataway, NJ, USA, 2020; pp. 1–6. Available online: https://ieeexplore.ieee.org/document/9294576 (accessed on 19 January 2023).
- Mourtakos, V.; Oikonomou, M.G.; Kopelias, P.; Vlahogianni, E.I.; Yannis, G. Impacts of autonomous on-demand mobility service: A simulation experiment in the City of Athens. Transp. Lett. 2022, 14, 1138–1150. [Google Scholar] [CrossRef]
- Chu, L.; Liu, H.X.; Oh, J.-S.; Recker, W. A calibration procedure for microscopic traffic simulation. In Proceedings of the 2003 IEEE International Conference on Intelligent Transportation Systems, Shanghai, China, 12–15 October 2003; IEEE: Piscataway, NJ, USA, 2003; pp. 1574–1579. [Google Scholar]
- Park, B.; Qi, H. Development and Evaluation of a Procedure for the Calibration of Simulation Models. Transp. Res. Rec. J. Transp. Res. Board 2005, 1934, 208–217. [Google Scholar] [CrossRef][Green Version]
- Daamen, W.; Buisson, C.; Hoogendoorn, S.P. (Eds.) Traffic Simulation and Data, 1st ed.; CRC Press: Boca Raton, FL, USA, 2014. [Google Scholar]
- FHWA. Trajectory Investigation for Enhanced Calibration of Microsimulation Models; Federal Highway Administration: Washington, DC, USA, 2021. [CrossRef]
- Kim, J.; Kim, J.H.; Lee, G.; Shin, H.J.; Park, J.H. Microscopic Traffic Simulation Calibration Level for Reliable Estimation of Vehicle Emissions. J. Adv. Transp. 2020, 2020, 4038305. [Google Scholar] [CrossRef]
- Ahmed, H.U.; Huang, Y.; Lu, P. A Review of Car-Following Models and Modeling Tools for Human and Autonomous-Ready Driving Behaviors in Micro-Simulation. Smart Cities 2021, 4, 314–335. [Google Scholar] [CrossRef]
- Kesting, A.; Treiber, M. Calibrating car-following models by using trajectory data methodological study. Transp. Res. Rec. 2008, 2088, 148–156. [Google Scholar] [CrossRef]
- Ims, A.B.; Pedersen, H.B. Simulation of Automated Vehicles in AIMSUN Behavioral Modeling and Design Proposals. Master’s Thesis, Norwegian University of Science and Technology, Trondheim, Norway, 2021. [Google Scholar]
- Yang, D.; Zhu, L.; Liu, Y.; Wu, D.; Ran, B. A Novel Car-Following Control Model Combining Machine Learning and Kinematics Models for Automated Vehicles. IEEE Trans. Intell. Transp. Syst. 2019, 20, 1991–2000. [Google Scholar] [CrossRef]
- Coropulis, S.; Berloco, N.; Gentile, R.; Intini, P.; Ranieri, V. Traffic microsimulation for road safety assessments of vehicle automation scenarios: Model comparison and sensitivity analysis. Simul. Model Pract. Theory 2024, 130, 102868. [Google Scholar]
- de Souza, F.; Stern, R. Calibrating Microscopic Car-Following Models for Adaptive Cruise Control Vehicles: Multiobjective Approach. J. Transp. Eng. A Syst. 2021, 147, 04020150. Available online: https://ascelibrary.org/doi/full/10.1061/JTEPBS.0000475 (accessed on 1 December 2025). [CrossRef]
- Milanés, V.; Shladover, S.E. Modeling cooperative and autonomous adaptive cruise control dynamic responses using ex-perimental data. Transp. Res. Part C Emerg. Technol. 2014, 48, 285–300. [Google Scholar] [CrossRef]
- Favero, R.; Elefteriadou, L. Exploratory Driving Performance and Car-Following Modeling for Autonomous Shuttles Based on Field Data. IEEE Trans. Intell. Transp. Syst. 2025, 26, 6042–6055. [Google Scholar] [CrossRef]
- Aimsun. Aimsun Next User Manual. 2022. Available online: https://docs.aimsun.com/next/22.0.2/ (accessed on 14 July 2023).
- OpenStreetMap. Available online: https://www.openstreetmap.org/ (accessed on 13 July 2023).
- Navya. AUTONOM Shuttle: For More Fluid Mobility; Navya: Villeurbanne, France, 2019. [Google Scholar]
- Coropulis, S.; Berloco, N.; Gentile, R.; Intini, P.; Ranieri, V. The use of microscopic simulators for safety assessment in automated and partially automated scenarios: A comparison. Transp. Res. Procedia 2023, 69, 313–320. [Google Scholar] [CrossRef]
- Vasconcelos, L.; Neto, L.; Santos, S.; Bastos, A.; Seco, Á. Calibration of the Gipps Car-Following Model Using Trajectory Data. Transp. Res. Procedia 2014, 3, 952–961. [Google Scholar] [CrossRef]
- QStarz. QStarz BL-1000GT Specification. 2023. Available online: http://racing.qstarz.com/Products/BL-1000GT.html (accessed on 14 July 2023).
- Cregger, J.; Mahavier, K.; Holub, A.; Machek, E.; Crayton, T.; Patel, R.; Suder, S. Automation in Our Parks: Automated Shuttle Pilots at Yellowstone National Park and Wright Brothers National Memorial. 2022. Available online: https://rosap.ntl.bts.gov/view/dot/76562 (accessed on 14 December 2025).
- Lake Nona. Beep Autonomous Vehicles. 2024. Available online: https://www.lakenona.com/thing/autonomous-vehicles-move-nona/ (accessed on 25 July 2024).
- Diba, D.S.; Gore, N.; Pulugurtha, S. Autonomous Shuttle Implementation and Best Practices; Mineta Transportation Institute: San Jose, CA, USA, 2023. [Google Scholar]
- Bentley Systems. Openpaths Patterns. 2025. Available online: https://www.bentley.com/software/openpaths-patterns/#how (accessed on 7 December 2025).
- RITIS. RITIS. 2024. Available online: https://ritis.org/ (accessed on 14 July 2023).
- De Villa, A.R.; Casas, J.; Breen, M.; Perarnau, J. Static OD Estimation Minimizing the Relative Error and the GEH Index. Procedia Soc. Behav. Sci. 2014, 111, 810–818. [Google Scholar] [CrossRef]
- Balakrishna, R.; Antoniou, C.; Ben-Akiva, M.; Koutsopoulos, H.N.; Wen, Y. Calibration of Microscopic Traffic Simulation Models. Transp. Res. Rec. J. Transp. Res. Board 2007, 1999, 198–207. [Google Scholar] [CrossRef]


Disclaimer/Publisher’s Note: The statements, opinions and data contained in all publications are solely those of the individual author(s) and contributor(s) and not of MDPI and/or the editor(s). MDPI and/or the editor(s) disclaim responsibility for any injury to people or property resulting from any ideas, methods, instructions or products referred to in the content. |
© 2026 by the authors. Licensee MDPI, Basel, Switzerland. This article is an open access article distributed under the terms and conditions of the Creative Commons Attribution (CC BY) license.