Abstract
Motorcycle horns are a dominant source of urban noise in many Southeast Asian cities, driven by high two-wheeler density and limited public transport infrastructure. Although automobiles have been in use for over a century, regulations governing horn design and volume control remain inadequate. This study investigates horn use behavior in Vietnamese urban traffic, identifying distinct acoustic patterns categorized as “attention” and “warning” signals. Measurements conducted in an anechoic chamber reveal that these patterns can increase sound pressure levels by up to 17 dB compared to standard horn use, with notable differences in frequency components. These levels often exceed the daytime noise thresholds recommended by the World Health Organization (WHO), indicating potential risks for adverse health outcomes, such as elevated stress, hearing damage, sleep disturbance, and cardiovascular effects. The findings are contextualized within broader efforts to manage traffic noise in rapidly developing urban areas. Drawing parallels with studies on aircraft noise exposure in Japan, this study suggests that long-term exposure, rather than peak noise levels alone, plays a critical role in shaping community sensitivity. The study results support the need for updated noise regulations that address both the acoustic and perceptual dimensions of road traffic noise.
1. Introduction
The issue of road traffic noise is a widespread societal challenge in urban areas globally, with public responses to noise influencing guidelines for transportation planning and environmental management. Rapid economic growth in developing Asian countries has intensified environmental concerns, particularly related to traffic noise and exhaust emissions [1,2]. This problem is compounded by the high volume of motorcycle traffic and the frequent use of motorcycle horns. In these nations, the lack of adequate public transportation systems, such as trains and subways, leaves motorcycles as the predominant mode of transport. Motorcycles are especially well-suited for short- to medium-distance travel, navigating narrow streets and areas with limited infrastructure. Their affordability in terms of both purchase and maintenance also makes them a practical and efficient vehicle choice.
In 2005 and 2007, Phan et al. [3,4] conducted extensive socio-acoustic surveys to assess community responses to road traffic noise in Vietnam, focusing on the characteristics of horn sounds from motorbikes. Their findings indicated that noise levels in Hanoi ranged from 70 to 83 dB, while Ho Chi Minh City recorded levels between 75 and 83 dB. A staggering 93% of respondents found road traffic noise unpleasant, with 86% expressing daily displeasure, particularly during the early morning, afternoon, and evening. The recent survey on cyclists’ exposure to road traffic noise in Ho Chi Minh City by Gelb and Apparicio [5] found an average level of 78.8 dB, confirming consistently high levels of road traffic noise exposure. The research emphasized the necessity of incorporating effective noise assessments and recognized the influence of factors such as horn sound components on noise annoyance.
Unlike European and Korean contexts, where cars are the primary source of noise pollution, motorbikes are the dominant contributor in Vietnam. Interestingly, Vietnamese respondents reported lower levels of annoyance related to road traffic noise compared to their European and Korean counterparts [6]. This discrepancy may be attributed to the unique characteristics of road traffic noise in Vietnam, which is marked by a heavy reliance on motorbikes and frequent horn usage. Gjestland et al. [7] tackled this issue by developing dose–response functions specific to Vietnam, which include both aircraft and road traffic noise. A comparative analysis of these results with findings from similar studies in other geographical regions revealed that individuals in Vietnam generally demonstrate higher tolerance levels to noise. To align the response curve with recommendations from the European Noise Directive, noise levels would need to be increased by approximately 5 to 10 dB. As a result, responses to annoyance and sleep disturbance caused by noise and vibration would intensify, particularly considering that crash noise generated by motorcycles significantly impacts these responses.
The applicability of Western-derived knowledge on road traffic noise exposure is not fully established in large Asian cities. Brown et al. [8] examined this issue in Hong Kong and found that due to dense populations, and heavy traffic, a larger proportion of the population experiences moderate noise levels (60–64 dB) compared to European counterparts, while fewer are exposed to lower levels (<55 dB). This research carries significant implications for noise management in Asian mega-cities and a standardized approach to traffic noise issues. Despite growing public concern, noise pollution remains inadequately addressed in Asia, especially in many developing countries, due to fragmented or outdated legal frameworks. In the case of Vietnam, current regulations lack clear definitions, noise-mapping systems, and enforcement mechanisms. Nguyen et al. highlight several regulatory loopholes, noting that existing laws provide only general principles without practical guidance on controlling specific noise sources or holding violators accountable [9]. Their study recommends a comprehensive approach, including source-specific categorization and technological monitoring, which are relevant to other countries facing similar environmental challenges.
In urban environments with heterogeneous traffic conditions—common in many developing countries—frequent horn use significantly contributes to overall noise levels and alters the soundscape. Kalaiselvi and Ramachandraiah found that horn events can increase equivalent noise levels by 0.5 to 13 dB(A), depending on the traffic flow and congestion [10]. This points out honking as a variable in traffic noise prediction models to more accurately assess environmental noise exposure in complex urban settings. Exposure to high-intensity horn sounds, especially from trucks, can cause significant cognitive and mood disturbances in pedestrians, as evidenced by an EEG analysis across multiple brainwave frequency bands [11]. To address this issue, recent studies introduced an innovative approach which can significantly improve the perceived sound quality of the horn sound. Kang et al. developed a dual-shell car horn using a boundary element model of the existing car horn and transfer path analysis to enhance sound characteristics and reduce unwanted noise components [12]. The detectability and annoyance level of electric vehicle warning sounds were found to be influenced significantly by masking effects [13].
Several works have assessed how the structural features of shell horns and exhaust systems affect both their vibrational behavior and acoustic characteristics [14,15,16,17]. Qiu et al. [14] investigated how different exhaust manifold structures influence the distribution of sound orders in a four-cylinder engine. Their theoretical and experimental findings offer valuable insights into how manifold geometry can control specific noise components. Rim et al. [15] analyzed the vibration and acoustic characteristics of shell horns, demonstrating the relationship between structural design and emitted sound profiles in vehicles. Hayashi et al. [16] conducted acoustic simulations of horn systems, contributing early, yet important, modeling approaches to understand horn performance. Munjal’s work [17] provides a comprehensive theoretical framework on the acoustics of ducts and mufflers, serving as a foundational reference for understanding wave propagation and attenuation in automotive acoustic systems. Integrating structural dynamics and acoustic modeling in horn and exhaust system design is essential to improve noise control and sound quality in transportation systems.
While extensive research has been conducted to combat car horn sounds, there has been limited discussion concerning the specific noise generated by motorcycle horns and the corresponding measures to mitigate it. Cuong and Okda [18] explored the impact of inlet and outlet pipe positioning in muffler chambers, highlighting the acoustic consequences of design geometry—principles that are directly transferable to horn acoustics. Motorbike riders, despite enduring daily noise disruptions, find themselves compelled to employ their horns as a safety measure while riding. They are acutely aware that this action may inconvenience those nearby. The frequency and manner in which they use their horns fluctuate based on traffic conditions and their current emotional state [19,20]. This issue is particularly pronounced in developing countries, where motorcycles constitute a significant portion of urban traffic [21,22]. For instance, in Vietnam, motorcycles account for approximately 96% of all local transportation, leading to frequent horn usage and elevated noise levels in urban areas. Studies have shown that, in such environments, horn events can increase noise levels by 2 to 13 dB(A), exacerbating noise pollution [23]. Moreover, the unique acoustic characteristics of motorcycle horns, often higher-pitched and more abrupt than car horns, may contribute more significantly to public stress and annoyance, especially in densely populated areas. Despite these concerns, there is a notable lack of dedicated research focusing on the acoustic properties of motorcycle horns and their impact on urban soundscapes in developing regions. Addressing this gap is crucial for developing effective noise mitigation strategies tailored to the specific challenges posed by motorcycle horn usage in these contexts.
The purpose of this study is to propose improvements to the issues discussed above. The initial phase of the research will examine how various horn patterns used by drivers in congested traffic conditions signal nearby vehicles and how these patterns affect noise levels. The study begins by presenting the types of horns commonly used in Vietnamese motorcycles, detailing their operating principles and sound characteristics. It then selects specific horn patterns observed in congested traffic and measures their acoustic properties in an anechoic room.
2. Methods
2.1. Noise Source and Traffic Condition Data
In Vietnam, motorcycles have historically been primarily imported from Japan, but local production has recently seen significant growth. The 125cc motorcycle, a widely preferred choice for both commuting and transporting goods, is prevalent. These motorcycles are typically equipped with electromechanical diaphragm horns, which were selected for this study due to their affordability, compact structure, and widespread usage in urban traffic. The selected horn type was verified through a market survey of available horn models, and the representative sample used in our experiments is shown in Figure 1 [12].
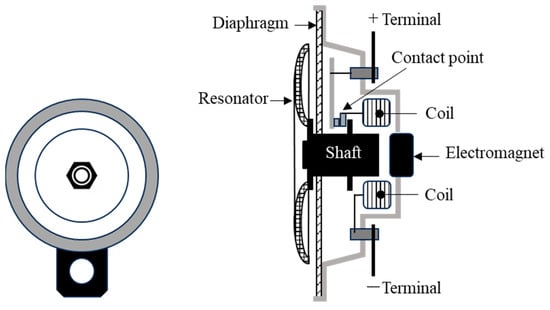
Figure 1.
Appearance and structure of motorcycle horn.
When the horn button on the handlebar is pressed, an electric current flows from the terminals through the contact points to the coil, generating a magnetic field that exerts a pulling force. This force causes the armature and diaphragm to move, initiating vibration and producing sound. The vibration is transmitted through the resonator, where the sound is amplified and shaped before being emitted. Conversely, when the shaft collides with the electromagnet, the contact point disengages, interrupting the current. At this moment, the diaphragm retracts the shaft to its original position after being attracted to the pole. This cycle repeats continuously until the horn button is released.
Although the horn mechanism is designed to produce a relatively consistent sound pressure level (SPL) when continuously activated, real-world road traffic situations reveal fluctuations in sound pressure levels based on the timing and manner of horn button activation. Thus, it is important to analyze actual horn-use patterns to better understand these SPL variations during short, intermittent activations.
To examine actual horn usage patterns, we recorded traffic conditions using a high-definition video camera and a calibrated sound level meter (RION NL-28). Data collection was conducted on Hoang Van Thu Street in Ho Chi Minh City, a key urban artery connecting multiple districts and Tan Son Nhat International Airport. Recordings were carried out during weekday morning and evening rush hours to capture peak traffic conditions and representative horn usage behavior.
2.2. Collection of Horn Sound Patterns
Horn pattern selection was based on a combination of empirical measurements and qualitative interviews. Specifically, structured interviews were conducted with 10 experienced motorcycle taxi drivers and 20 university students who commute daily by motorcycle. Participants were recruited through flyers and in-person invitations at motorcycle parking areas on university campuses and transport hubs. All participants provided informed consent prior to participation. Based on both participant input and observations of typical horn behavior, horn usage was classified into two main types: “attention” signals and “warning” signals. These categories and their associated horn button activation patterns are illustrated in Figure 2. The identified patterns reflect the informal yet culturally shaped acoustic signaling behavior of Vietnamese motorcyclists in congested urban environments.
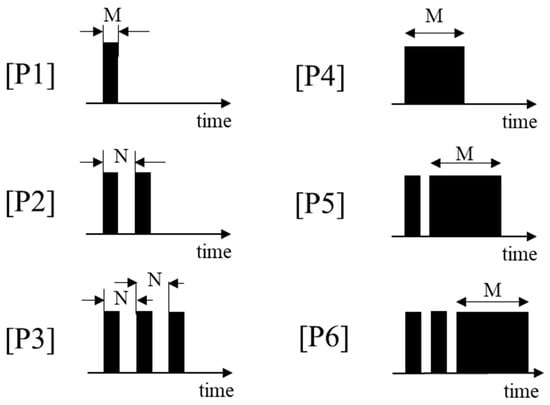
Figure 2.
The patterns of horn sounds frequently used in Vietnam: Attention Patterns P1–P3; Warning Pattern P4–P6.
Attention Pattern [P1] involves a single short press of the horn button, typically lasting between 0.5 and 0.7 s. This pattern is commonly used when driving at low speeds to alert the vehicle in front to accelerate or become aware of the presence of the hornblower behind them. Additionally, it is used to acknowledge a nearby friend who is either driving or walking. Attention Pattern [P2] consists of a double tap of the horn button. Each press lasts about 0.5 to 0.7 s, with an interval (N) of approximately 0.3 to 0.5 s between taps. This pattern is often used to reinforce a previous signal or prompt the vehicle ahead to accelerate or to issue a second warning. The duration of horn button presses is the same as that of [P1], but the interval time between double taps (N) varies depending on the vehicle’s speed. Attention Pattern [P3] involves three short horn presses, typically following [P2], to encourage the vehicle ahead to accelerate or to issue a second warning. The duration of each press remains consistent with [P1] (0.5 to 0.7 s), with inter-press intervals of approximately 0.3 s.
Warning Pattern [P4] is similar to [P1] but involves a more prolonged horn press, often exceeding 1 s. It is typically used at higher driving speeds when the leading vehicle is moving slowly. This extended honk is intended to attract attention more forcefully and communicate urgency. Warning Patterns [P5] and [P6] involve multiple short horn presses followed by a final continuous press. These patterns are often used to advise nearby drivers to exercise extra caution and may also convey the horn user’s irritation or frustration.
2.3. Data Analysis
To analyze the acoustic characteristics of each horn pattern, controlled experiments were conducted using the setup illustrated in Figure 3. A 125 cc motorcycle horn, commonly used in Vietnam, was placed at the center of an anechoic chamber. The horn was activated using a computer-generated signal transmitted through a custom horn drive circuit, ensuring consistent and repeatable signal patterns. The horn and the sound level meter (RION NL-28) were mounted at heights of 0.5 m and 1.5 m above the floor, respectively, in accordance with Article 141 of the Japanese Safety Standard for Road Transportation Vehicles [24]. This setup allowed for precise and controlled analysis of the horn’s acoustic properties. As an anechoic chamber eliminates sound reflections from the walls, ceiling, and floor, the measurement captured only the direct sound field. To simulate realistic reflective conditions and obtain reflected sound components, a metal plate was placed on the floor to simulate the environment of a semi-anechoic chamber. Prior to each measurement session, the sound level meter was calibrated using an acoustic calibrator (RION NC-74, 1 kHz, 94 dB SPL) to ensure measurement accuracy. Calibration was repeated before each recording to maintain consistency.
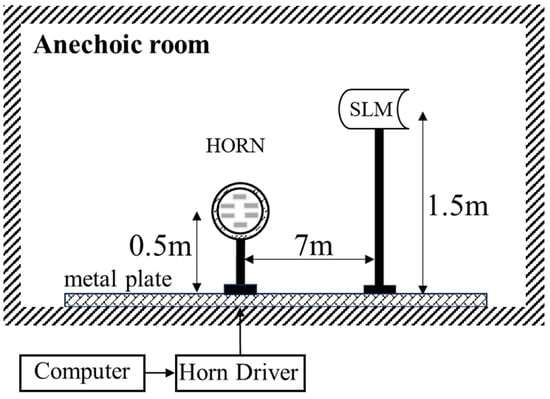
Figure 3.
Block diagram of the experimental apparatus.
The sound pressure waveform was recorded at a sampling frequency of 44.1 kHz, using a Fast Fourier Transform (FFT) with 4096 points, yielding a frequency resolution of 10.76 Hz. To ensure comparability among horn patterns, the A-weighted equivalent continuous sound level (LAeq,T) was calculated over a fixed duration of 1.5 s, corresponding to the maximum horn duration observed in Pattern [P6]. This approach enabled a consistent comparison of acoustic intensity and spectral distribution across all horn usage patterns.
3. Results
3.1. Power Spectrum of Round Diaphragm Horn
Figure 4 illustrates the power spectrum of horn Pattern [P1], providing detailed insights into the acoustic characteristics of the motorcycle horn. The A-weighted sound pressure level (SPL) of [P1] was measured at 87 dB(A). According to Article 141 of the Japanese Safety Standard for Road Transportation Vehicles [24], the permissible horn sound level must range from 87 dB(A) to 112 dB(A) when measured at a distance of 7 m. Therefore, the measured SPL of [P1] complies with the lower threshold of the regulatory requirement. Within the frequency range of 300 Hz to 20 kHz, multiple elevated spectral components are observed in [P1], with a notable concentration of acoustic energy around 3 kHz. This frequency range corresponds closely to the range of maximum sensitivity of the human ear, significantly contributing to the horn’s perceived loudness and auditory salience.
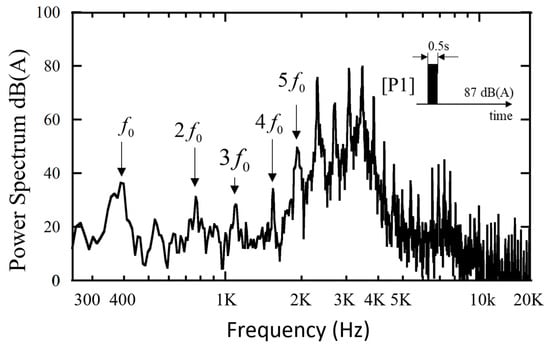
Figure 4.
Power spectrum of Pattern [P1].
The fundamental mechanism of the horn sound generation, previously described in Figure 1, involves the pressing of the horn button, which causes an electric current to flow through the terminals, contact points, and coil. This current generates a magnetic field that induces a collision between the shaft and electromagnet, producing a sharp mechanical impact. This action generates the fundamental frequency, measured at approximately 387 Hz, along with multiple higher-order harmonics. The resonator further amplifies the emitted sound, especially in the mid-frequency range, contributing to the pronounced peak near 3 kHz in the power spectrum.
3.2. Frequency Characteristics
To further examine the spectral properties of horn Pattern [P1], Figure 5 presents a 1/3 octave band frequency analysis. The A-weighted equivalent continuous sound level (LAeq,T) for [P1] is 87 dB(A), consistent with earlier measurements. For detailed analysis, the frequency domain is divided into three bands: (A1), (A2), and (A3), representing low-, mid-, and high-frequency ranges, respectively.
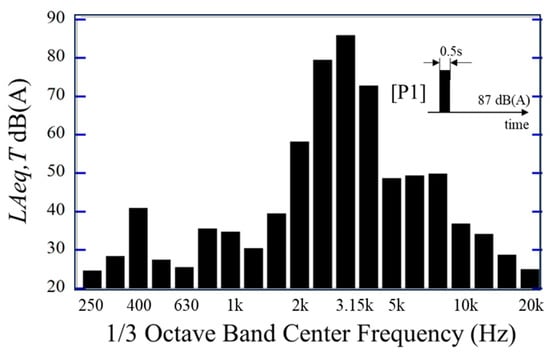
Figure 5.
One-third octave frequency characteristic of [P1].
Figure 6 shows the frequency characteristics of Pattern [P2], represented by the solid line. This pattern involves double-tapping the horn button with a 0.3 s interval, a method frequently employed in slow-moving traffic during rush hour. Compared to the single press in [P1], [P2] shows a significantly higher overall LAeq,T, a difference of approximately 14 dB(A). As illustrated in Figure 7, the arranged peak levels of [P1] and [P2] reveal the distinct differences in spectral energy distribution, particularly within bands (A1) and (A2), where differences reach up to 20 dB. These variations within specific frequency bands are known to influence human auditory perception, depending on surrounding noise conditions and individual hearing sensitivity.
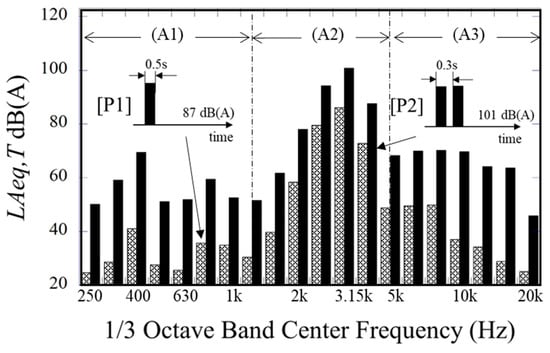
Figure 6.
Comparison between [P1] and [P2].
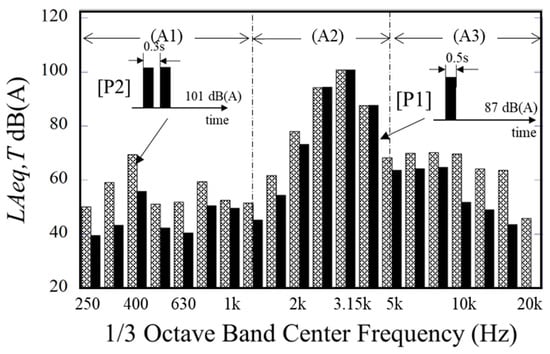
Figure 7.
Characteristic of [P1] and [P2] when arranging those peak values.
Figure 8 compares two variations in [P2] with different time intervals (M) between two horn signals. The solid line represents M = 0.5 s, while the dotted line represents M = 0.3 s. Although the frequency characteristics of both patterns are relatively similar, an increase in the time interval (M) results in a decrease in the overall sound level.
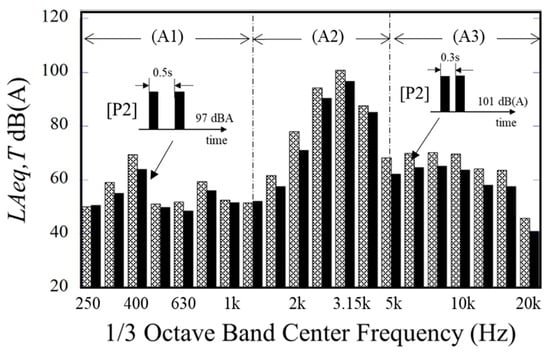
Figure 8.
Characteristic of [P2] when changes the time interval of two horn sounds.
In Figure 9, [P2] is compared with Pattern [P3], which consists of three horn presses. While the frequency characteristics of both patterns appear similar, [P3] exhibits a lower overall sound level, particularly within the (A1) range, suggesting that pattern complexity (i.e., number of presses) impacts sound energy accumulation.
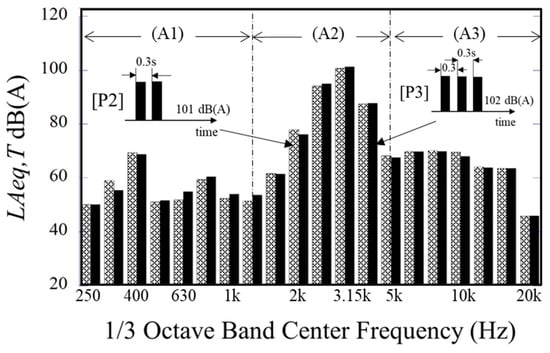
Figure 9.
Comparison between [P2] and [P3].
Figure 10 compares [P1] and Warning Pattern [P4], which features a longer horn button press lasting 0.82 s. This extended activation results in an overall increase in sound levels across all frequency ranges, with the most pronounced difference occurring in (A1). The overall difference between the two patterns is 13 dB(A).
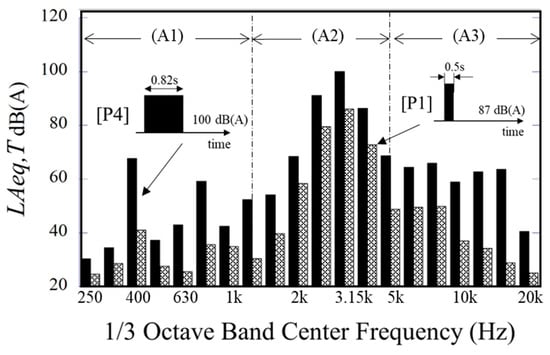
Figure 10.
Comparison between [P4] and [P1].
A comparison of two warning patterns, [P4] and [P5], is shown in Figure 11. Pattern [P5] consists of a single short honk followed by a prolonged press, similar in structure to [P4]. A notable difference in overall sound levels, particularly in the frequency range (A1), is evident between the two patterns, with an overall value difference of 3 dB(A).
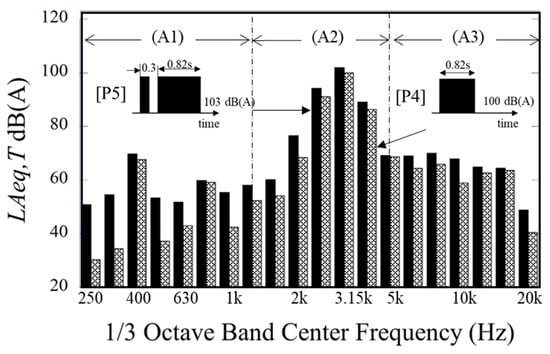
Figure 11.
Comparison between [P4] and [P5].
Finally, Figure 12 compares [P1] with [P6], which consists of two short honks followed by a prolonged press. Among all comparisons, this pattern shows the largest increase in sound energy relative to [P1], with an overall difference of 17 dB(A). The increase is again most pronounced in the low-frequency (A1) range.
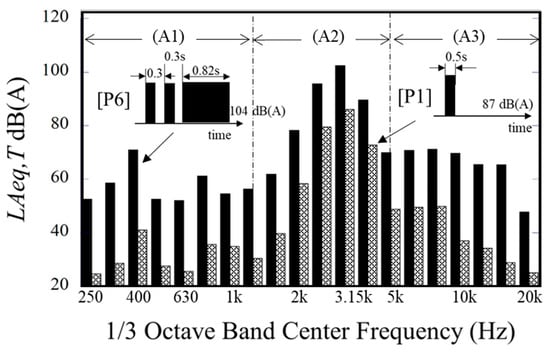
Figure 12.
Comparison between [P1] and [P6].
3.3. Sound Pressure Distribution
To investigate how a motorcycle horn sound propagates in the surrounding area, an additional experiment was conducted to measure the directional distribution of sound pressure during horn activation. A second sound level meter of the same model (RION NL-28) was placed 3 m from the horn, and measurements were taken by rotating the meter in 45-degree increments, with 0 degrees corresponding to the front of the horn. The results are shown in Figure 13, where the solid line represents Pattern [P1], and the dotted line represents Pattern [P4]. The data reveal that the sound pressure levels remain relatively consistent in all directions, suggesting that the horn emits sound in a broadly omnidirectional pattern.
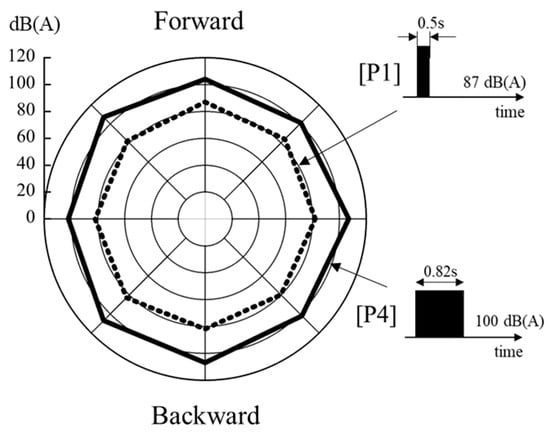
Figure 13.
Sound pressure distributed around the horn.
It is important to note that, although the standard installation of motorcycle horns typically orients them forward, some designs tilt the horn downward. This configuration is often intended to improve sound dispersion and reduce the risk of water or debris ingress. Moreover, the presence of a rider or passenger may obstruct or reflect sound waves, potentially affecting the horn’s directivity and leading to variations in real-world acoustic performance compared to the controlled conditions of this experiment.
3.4. Electric Horn Sound
In recent years, electric horns have increasingly replaced conventional round diaphragm horns on motorcycles. Unlike traditional diaphragm-based designs that rely on mechanical vibration and horn coils, electric horns employ electronic circuits, resulting in more compact devices with adjustable pitch and volume to match user preferences. Motorcycles operating on Vietnamese roads feature a wide variety of electric horns. For this study, we selected a representative horn for a 125cc motorcycle and analyzed its acoustic characteristics using the same experimental setup as for the round diaphragm horn.
Figure 14 shows the power spectrum of Pattern [P1] produced by the electric horn. Similarly to the round diaphragm horn, elevated levels are observed in the frequency range from 300 Hz to 20 kHz. Electric horns typically operate in the 400–500 Hz range, producing sound pressure levels between 100 and 130 dB to ensure effective audibility in noisy environments. As shown in Figure 14, the sound pressure level of [P1] is 94.8 dB, which is 17 dB higher than that of the round diaphragm horn presented in Figure 5. Nonetheless, this still complies with Article 141 of the Japanese Safety Standard for Road Transportation Vehicles.
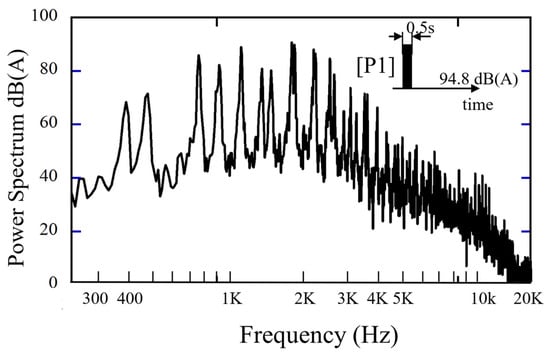
Figure 14.
Power spectrum of Pattern [P1] when using an electric horn.
Figure 15 presents the 1/3 octave band frequency analysis of the electric horn [P1]. When compared with the corresponding analysis for the round diaphragm horn in Figure 6, no significant differences are observed across the frequency bands, suggesting similar spectral structures under normal single-press usage.
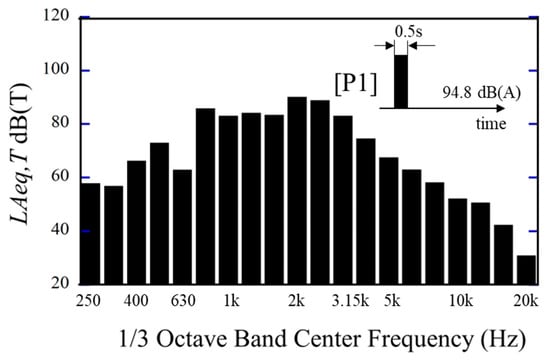
Figure 15.
One-third octave frequency characteristic of [P1] when using an electric horn.
Figure 16 compares [P1] with the Warning Pattern [P4]. Although frequency-level variations are seen across the bands, no consistent trend or regularity is observed in the pattern of these variations. A similar comparison is presented in Figure 17 between [P1] and Attention Pattern [P2], again revealing irregular changes in frequency characteristics.
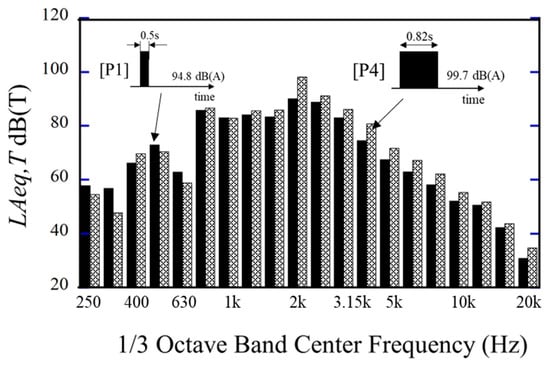
Figure 16.
One third octave frequency characteristic of [P1] and [P4] when using an electric horn.
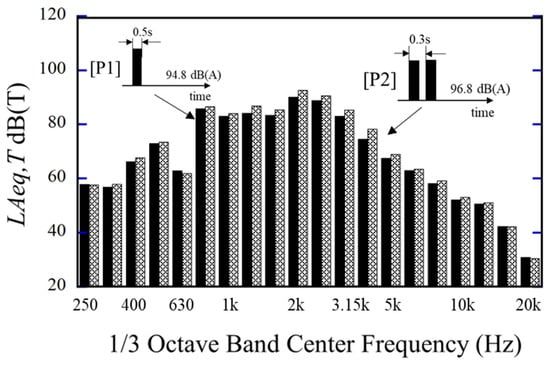
Figure 17.
One-third octave frequency characteristic of [P1] and [P2] when using an electric horn.
Table 1 summarizes the increase in sound pressure level for both “Attention” and “Warning” relative to [P1]. The table is divided into two sections, representing results for the round diaphragm horn (center) and the electric horn (right). The data show that the sound level of the electric horn differs by an order of magnitude compared to the round diaphragm horn.

Table 1.
The increase in sound level when using the “Attention” and “Warning” patterns compared to Pattern [P1].
From these measurement results and analyses, it is evident that both the overall level and frequency characteristics vary significantly depending on the horn usage pattern of “Attention” or “Warning”, regardless of the horn type. In typical road conditions, [P1] (a single press) is used to alert vehicles ahead. However, on Vietnam’s congested roads, more dynamic horn patterns are employed. For instance, Patterns [P2] or [P3] are used as attention signals, while Pattern [P4], [P5], and [P6] serve as warning signals.
To quantify, the sound level of a typical [P1] is approximately 87 dB, whereas attention patterns can reach around 103 dB, and warning patterns exceed 104 dB. In effect, attention and warning patterns are about 13 dB louder than [P1]. Additionally, these patterns introduce notable changes in both low-frequency and high-frequency components, reflecting their role in achieving greater perceptual urgency and effectiveness in noisy traffic environments. These variations in acoustic characteristics are crucial for understanding how horn patterns are adapted for real-world driving scenarios in Vietnam, especially in terms of communication, safety, and driver perception.
4. Discussion
This study analyzes various motorcycle horn sound patterns, focusing on differences in sound pressure levels and acoustic characteristics. As highlighted, most motorcycles used in Vietnam are manufactured in Japan, and their horn specifications comply with Japanese safety standards, specifically, Article 141 of the Japanese Safety Standards for Road Transportation Vehicles, which permits horn sound pressure levels in the range of 87 to 112 dB(A). While these standards are effective in the well-organized traffic conditions of Japan, they may be poorly suited to Vietnam’s unique traffic context. In dense urban environments such as Ho Chi Minh City, where narrow roads, mixed traffic flows, and frequent congestion are common, horns are used more frequently and often more aggressively. The findings reveal that certain patterns, particularly multi-press signals, generate significantly higher peak levels and longer durations, contributing disproportionately to overall traffic noise. Motorcycle horns in Ho Chi Minh City often emit up to 112 dB, exceeding thresholds recommended by global authorities such as the World Health Organization (WHO) and European Union Environmental Noise Directive [25]. The health risks, such as hearing loss, cardiovascular stress, and sleep disturbance significantly link to chronic exposure to noise levels above 85 dB(A) [26]. To mitigate these risks, we propose lowering the upper permissible limit for horn sound pressure levels.
The results suggest that by reducing the sound levels of individual horn patterns, a significant reduction in overall traffic noise can be achieved. In addition to regulatory adjustment, we propose implementing adaptive horn systems that modulate output levels based on surrounding ambient noise, vehicle speed, and time of day. This would allow drivers to issue warnings when necessary without excessive acoustic intrusion. Public campaigns and licensing programs could also educate drivers about responsible horn use, emphasizing the difference between necessary alerts and aggressive honking.
According to the study results, the horn volume can be mechanically adjusted using the horn diaphragm’s calibration screw, offering a low-cost, easily implementable solution for existing vehicles. Furthermore, although individual horn activations may last only 0.5–1.5 s, their cumulative contribution to ambient sound energy density—especially during peak traffic periods—can be substantial. This study underscores the need to address horn noise not only as a behavioral issue but also as a key contributor to urban environmental noise. Addressing this overlooked source of environmental noise is a significant step toward a good practice in acoustic regulation and public health protection.
5. Conclusions
This study examines how different horn patterns used by drivers in congested traffic can communicate with nearby vehicles and influence noise levels. While the conventional single horn sound ([P1]) is the norm for signaling presence, our research has revealed the prevalence of Attention Patterns ([P2] and [P3]) and warning patterns ([P4], [P5], and [P6]) in this unique traffic environment. These alternative patterns result in a substantial increase in horn sound volume, ranging from 13 to 17 decibels, compared to single horn usage. Furthermore, our analysis has elucidated the acoustic characteristics of each horn pattern, including variations in low-frequency and high-frequency components. Understanding these acoustic differences is crucial for both road safety and addressing noise pollution concerns.
As our findings suggest, the current motorcycle horn regulations in Vietnam, adapted from Japanese standards, may not be suitable for the local traffic conditions. Given the narrow roads and high congestion, revising these regulations to better align with Vietnam’s specific needs is a necessary step toward reducing road traffic noise and improving the overall road environment. To reduce road traffic noise, we propose lowering the sound levels of motorcycle horns. Our study analyzes various horn patterns, focusing on differences in sound pressure levels and acoustic properties. Based on our findings, a significant reduction in overall traffic noise can be achieved.
Author Contributions
Conceptualization, T.N., Y.N. and S.N.; methodology, T.N., Y.N. and S.N.; investigation, T.N., Y.N. and S.N.; writing—original draft preparation, T.N.; writing—review and editing, T.N., Y.N. and S.N.; supervision, Y.N. and S.N. All authors have read and agreed to the published version of the manuscript.
Funding
This research received no external funding.
Data Availability Statement
The original contributions presented in this study are included in the article. Further inquiries can be directed to the corresponding author.
Acknowledgments
The authors thank all the students and drivers who participated in the interviews and field observations.
Conflicts of Interest
The authors declare no conflicts of interest.
References
- Huong, L.T.; Tuan, V.A.; Man, N.D.V. Commuter exposure to ultrafine particles (UFPs), lung deposited surface area (LDSA), and noise in Ho Chi Minh City, Vietnam. J. Transp. Health 2024, 38, 101896. [Google Scholar] [CrossRef]
- Guha, A.K.; Gokhale, S. Urban workers’ cardiovascular health due to exposure to traffic-originated PM2.5 and noise pollution in different microenvironments. Sci. Total Environ. 2023, 859 Pt 1, 160268. [Google Scholar] [CrossRef] [PubMed]
- Phan, H.Y.T.; Yano, T.; Phan, H.A.T.; Nishimura, T.; Sato, T.; Hashimoto, Y. Community responses to road traffic noise in Hanoi and Ho Chi Minh City. Appl. Acoust. 2010, 71, 107–114. [Google Scholar] [CrossRef]
- Phan, H.Y.T.; Yano, T.; Sato, T.; Nishimura, T. Characteristics of road traffic noise in Hanoi and Ho Chi Minh City, Vietnam. Appl. Acoust. 2010, 71, 479–485. [Google Scholar] [CrossRef]
- Gelb, J.; Apparicio, P. Noise exposure of cyclists in Ho Chi Minh City: A spatio-temporal analysis using non-linear models. Appl. Acoust. 2019, 148, 332–343. [Google Scholar] [CrossRef]
- Nguyen, T.L.; Yano, T.; Nguyen, H.Q.; Nishimura, T.; Fukushima, H.; Sato, T.; Morihara, T.; Hashimoto, Y. Community response to aircraft noise in Ho Chi Minh City and Hanoi. Appl. Acoust. 2011, 72, 814–822. [Google Scholar] [CrossRef]
- Gjestland, T.; Nguyen, T.L.; Yano, T. Community response to noise in Vietnam: Exposure-response relationships based on the Community Tolerance Level. J. Acoust. Soc. Am. 2015, 137, 2596–2601. [Google Scholar] [CrossRef]
- Brown, A.L.; Lam, K.C.; van Kamp, I. Quantification of the exposure and effects of road traffic noise in a dense Asian city: A comparison with western cities. Environ. Health 2015, 14, 22. [Google Scholar] [CrossRef]
- Nguyen, Q.C.; Chu, A.T.T.; Truong, B.G.; Nguyen, D.H.T. Noise pollution in developing countries: Loopholes and recommendations for Vietnam law. City Environ. Interact. 2025, 25, 100187. [Google Scholar] [CrossRef]
- Kalaiselvi, R.; Ramachandraiah, A. Honking noise corrections for traffic noise prediction models in heterogeneous traffic conditions like India. Appl. Acoust. 2016, 111, 25–38. [Google Scholar] [CrossRef]
- Erkan, I. Horn Sounds in Transportation Systems and a Cognitive Perspective on the Instant Mood-Condition Disorder. Procedia Eng. 2017, 187, 387–394. [Google Scholar] [CrossRef]
- Kang, H.-S.; Shin, T.; Lee, S.-K.; Park, D.C. Design optimization of a dual-shell car horn for improved sound quality based on numerical and experimental methods. Appl. Acoust. 2015, 90, 160–170. [Google Scholar] [CrossRef]
- Lee, S.K.; Lee, S.M.; Shin, T.; Han, M. Objective evaluation of the sound quality of the warning sound of electric vehicles with a consideration of the masking effect: Annoyance and detectability. Int. J. Automot. Technol. 2017, 18, 699–705. [Google Scholar] [CrossRef]
- Qiu, S.; Yuan, Z.C.; Fan, R.X.; Liu, J. Effects of exhaust manifold with different structures on sound order distribution in exhaust system of four-cylinder engine. Appl. Acoust. 2019, 145, 179–183. [Google Scholar] [CrossRef]
- Rim, K.H.; Park, S.T.; An, C.H.; Choi, S.K.; Yoo, D.W. Analysis of vibration and acoustic characteristics for a shell horn in a car. Proc. Korean Soc. Noise Vib. Eng. 2009, 2, 573–574. [Google Scholar]
- Hayashi, T.; Ohta, T.; Katagiri, M.; Taira, H. Acoustic simulation of horn. Denso Tech. Rev. 1997, 2, 2. [Google Scholar]
- Munjal, M.L. Acoustics of Ducts and Mufflers, 2nd ed.; Wiley: Chichester, UK, 2014. [Google Scholar]
- Cuong, N.M.; Okda, J. On fitting position of inlet and outlet pipes to elliptic cylindrical muffler chambers. J. Acoust. Soc. Jpn. 1981, 2, 71–78. [Google Scholar] [CrossRef][Green Version]
- José, W.; dos Santos, V.; da Silva, M.; Cêlho, G.B.; da Costa de Ceballos, A.G. Work overload and risk behaviors in motorcyclists. Rev. Bras. Enferm. 2019, 72, 1479–1484. [Google Scholar] [CrossRef]
- Rusli, R.; Oviedo-Trespalacios, O.; Abd Salam, S.A. Risky riding behaviours among motorcyclists in Malaysia: A roadside survey. Transp. Res. Part F Traffic Psychol. Behav. 2020, 74, 446–457. [Google Scholar] [CrossRef]
- Kim, H.K. Ho Chi Minh City’s Urban Transport Challenges; ISEAS–Yusof Ishak Institute Perspective, 65; ISEAS–Yusof Ishak Institute: Singapore, 2017; Available online: https://www.iseas.edu.sg/wp-content/uploads/pdfs/ISEAS_Perspective_2017_65.pdf (accessed on 16 December 2024).
- Kitamura, Y.; Hayashi, M.; Yagi, E. Traffic problems in Southeast Asia featuring the case of Cambodia’s traffic accidents involving motorcycles. IATSS Res. 2018, 42, 163–170. [Google Scholar] [CrossRef]
- Phan, H.A.T.; Yano, T.; Phan, H.Y.T.; Nishimura, T.; Sato, T.; Hashimoto, Y. Annoyance caused by road traffic noise with and without horn sounds. Acoust. Sci. Technol. 2009, 30, 327–337. [Google Scholar] [CrossRef]
- Japan’s Ministry of Land, Infrastructure, Transport and Tourism (MLIT). Safety Standards for Road Transportation Vehicles: Article 141. Available online: https://www.mlit.go.jp/jidosha/jidosha_fr7_000007.html (accessed on 12 May 2025). (In Japanese).
- WHO Environmental Noise Guidelines. Available online: https://ec.europa.eu/environment/noise/directive_en.htm (accessed on 27 March 2025).
- Basner, M.; Babisch, W.; Davis, A.; Brink, M.; Clark, C.; Janssen, S.; Stansfeld, S. Auditory and non-auditory effects of noise on health. Lancet 2014, 383, 1325–1332. [Google Scholar] [CrossRef]


Disclaimer/Publisher’s Note: The statements, opinions and data contained in all publications are solely those of the individual author(s) and contributor(s) and not of MDPI and/or the editor(s). MDPI and/or the editor(s) disclaim responsibility for any injury to people or property resulting from any ideas, methods, instructions or products referred to in the content. |
© 2025 by the authors. Licensee MDPI, Basel, Switzerland. This article is an open access article distributed under the terms and conditions of the Creative Commons Attribution (CC BY) license (https://creativecommons.org/licenses/by/4.0/).