Abstract
In 3.5 wt% NaCl solution used to simulate seawater, the individual (self-corrosion) and coupled (galvanic) corrosion behaviors of TA22 titanium alloy and 304 stainless steel were systematically investigated at 25 °C, 35 °C, 45 °C and 55 °C. Post-corrosion surfaces were characterized by scanning electron microscopy (SEM), three-dimensional profilometry and X-ray photoelectron spectroscopy (XPS). The results demonstrated that elevating temperature decreased the compactness and protective quality of the passive film on both alloys, as indicated by increasing donor densities and positive shifts in flat-band potentials. Distinct pitting corrosion occurred on 304 SS above 45 °C. Upon galvanic coupling, the passive film on TA22 was modified in both structure and composition, exhibiting a decreased TiO2 content and increased lower valence oxides (Ti2O3, TiO). The galvanic effect intensified with temperature, leading to progressively aggravated corrosion of 304 SS, characterized by increased pit density, diameter, and depth compared to its self-corrosion state.
1. Introduction
Titanium alloys and stainless steels are widely employed in marine exploration and shipbuilding because of their excellent corrosion resistance conferred by dense, self-forming passive films [,]. Titanium alloys, such as TA22 (Ti-3Al-1Mo-1Ni-1Zr), are particularly valued in marine applications for their high strength-to-weight ratio, exceptional resistance to seawater and chlorides, and stability under high hydrodynamic conditions, making them ideal for heat exchangers, propeller shafts, and underwater fasteners []. Stainless steels, especially austenitic grades like 304, offer a cost-effective combination of good mechanical properties and corrosion resistance, widely used in ship hulls, piping systems, and offshore platform structures []. However, the service environment of marine equipment often involves fluctuating temperatures, which can significantly influence the stability and protective nature of the passive films on these alloys, thereby affecting their corrosion behavior and, crucially, their performance when coupled together.
Elevated temperatures are known to accelerate electrochemical reactions, alter ion transport processes, and potentially degrade the protective properties of passive films []. However, its specific role in modulating the galvanic interaction between passive alloys with relatively small potential differences, like titanium alloys and stainless steels, remains less explored and is critical for predicting long-term performance in non-isothermal marine environments. For example, some researchers [,,,] have investigated the temperature-dependent variation of galvanic corrosion effects among various materials such as carbon steel, copper, and stainless steel. Their findings consistently indicate that galvanic current density increases with rising solution temperature, signifying an intensification of galvanic corrosion effects. Titanium alloys can operate in most harsh environments without experiencing corrosion [,]. To date, comprehensive advances have been achieved in understanding the galvanic corrosion of dissimilar metals with large potential differences, such as stainless steel/carbon steel [] and titanium alloy/aluminium alloy couples. By contrast, the influence of key environmental factors like temperature on this complex interplay between self-passivation and galvanic interaction is not yet fully understood, representing a significant knowledge gap for marine applications where temperature variations are common. Therefore, conducting research on galvanic corrosion between titanium alloys and stainless steel under varying temperature conditions, and clarifying its corrosion patterns and mechanisms, is of significant importance for extending the service life of marine engineering equipment and safeguarding vessel safety.
2. Experimental
TA22 titanium alloy (Ti-3Al-1Mo-1Ni-1Zr) and 304 stainless steel were selected for this study, with temperature as the sole environmental variable. Their chemical compositions correspond to Table 1 and Table 2 respectively.

Table 1.
Chemical composition of TA22 titanium alloy (wt%).

Table 2.
Chemical composition of 304SS (wt%).
The test temperatures of 25, 35, 45, and 55 °C were selected to cover a range commonly encountered in marine environments and to systematically investigate the transition from mild to accelerated corrosion conditions, particularly aiming to identify potential critical pitting temperatures for the materials and the couple []. Both materials were sectioned into 10 mm × 10 mm × 10 mm cubes to form the galvanic couples. Each specimen was mounted in epoxy resin inside a PVC tube, leaving an exposed working area of 1 cm2; the inter-electrode gap was fixed at 30 mm. After the epoxy had fully cured, the working surfaces were successively ground with SiC abrasive papers up to 2000 grit and then polished to a mirror finish. (geometric area; the average surface roughness (Ra) of the polished samples was < 0.05 μm, measured by profilometry)
All electrochemical measurements in this study were performed on a Biologic VMP3 potentiostat using a three-electrode configuration with an Ag/AgCl reference electrode (RE), a platinum foil counter electrode (CE), and the test metal as the working electrode (WE) []. The electrolyte was 3.5 wt% NaCl solution prepared using analytical grade NaCl (≥99.8%, Shanghai, China, Sinopharm Chemical Reagent Co., Ltd.) and deionized water (resistivity > 18 MΩ·cm). Temperature was controlled using a thermostatically controlled water bath (Julabo CF41, accuracy ±0.5 °C) throughout the experiments. The solution was equilibrated at the target temperature for at least 1 h before immersion of the samples and maintained under static conditions. During galvanic-corrosion testing, a multi-channel galvanic-corrosion analyzer was employed to record the galvanic current density (Icoupled) and the coupling potential (Ecoupled). The experimental setup was designed and assembled in accordance with the three-electrode system specified in the Chinese National Standard GB/T 15748-2013, “Test Method for Galvanic Corrosion of Metallic Materials for Ships” []; the galvanic-corrosion measurement system and apparatus are illustrated in Figure 1.
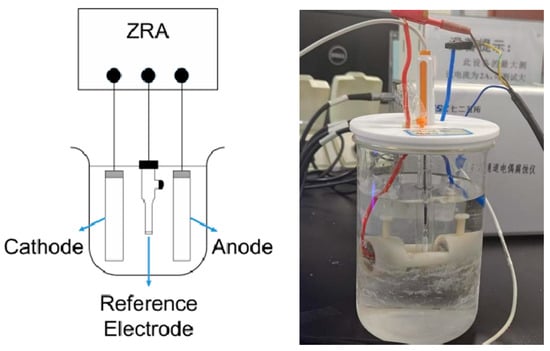
Figure 1.
Schematic diagram of galvanic corrosion measurement system.
Open circuit potential (OCP) was monitored for 1 h prior to galvanic coupling or other electrochemical tests to ensure stability. Potentiodynamic polarization curves were measured for individual materials at a scan rate of 0.167 mV/s starting from −0.25 V vs. OCP to +1.2 V vs. OCP (or until significant current increase was observed). The corrosion current density (Icorr) was estimated using Tafel extrapolation of the cathodic branch. For Mott-Schottky (M-S) measurements, a 10 mV AC perturbation was applied at a frequency of 1 kHz. The potential was scanned from −1.0 V Ag/AgCl to +0.8 V Ag/AgCl (for TA22) or −1.0 V Ag/AgCl to +0.5 V Ag/AgCl (for 304 SS) at a scan rate of 50 mV/s. Electrochemical impedance spectroscopy (EIS) was recorded over the frequency range 0.01 Hz–100 kHz with an applied sinusoidal potential amplitude of 10 mV vs. EIS spectra were fitted with equivalent circuits using ZView2 software (Scribner Associates Inc., Southern Pines, NC, USA). The fitting procedure involved manual adjustment of parameters to achieve the best visual fit to the experimental data.
Surface micro-morphology was examined with a Zeiss Ultra-55 (ZEISS Germany GmbH & Co. KG, Oberkochen, Germany) field-emission scanning electron microscope (FE-SEM) operated at 20 kV and working distance of ~10 mm and a HiRox RH-8800 (HiRox Corporation, Tokyo, Japan) three-dimensional digital video microscope. All SEM images include scale bars. For pit analysis, multiple pits (n ≥ 20) were measured for each condition to obtain statistically significant average values for diameter and depth. The composition of the passive films formed on TA22 under different conditions was analysed with a ESCALAB 250XI X-ray photoelectron spectrometer (XPS, Thermo Scientific, Waltham, MA, USA) using a monochromatic Al Kα X-ray source (1486.6 eV). The X-ray spot size was 500 μm. Survey spectra were acquired with a pass energy of 150 eV and step size of 1.0 eV. High-resolution spectra were acquired with a pass energy of 30 eV and step size of 0.1 eV. The sample surface was pre-cleaned by Ar+ ion sputtering for 60 s (2 keV, 1 μA, rastered over 2 mm × 2 mm area) prior to analysis to remove adventitious carbon and surface contaminants. All spectra were charge-corrected by referencing the C 1s peak of adventitious carbon to 284.8 eV. Spectra were processed with Avantage6.9 software using a Smart background and fitted with Gaussian-Lorentzian (GL(30)) line shapes. The full width at half maximum (FWHM) for similar chemical states was constrained to be equal within a reasonable range. Depth profiling was performed by alternating between Ar+ ion sputtering (2 keV, 1 μA, rastered, estimated sputter rate 0.1 nm/s relative to SiO2) and spectral acquisition.
3. Results and Discussion
3.1. Potential and Corrosion Current Measurements
Figure 2 shows the open-circuit potential (OCP) versus time curves for TA22 titanium alloy and 304 stainless steel individually measured in 3.5 wt% NaCl at various temperatures. According to the literature [], a potential difference greater than 50 mV between dissimilar metals is sufficient to trigger galvanic corrosion. As illustrated, the potential difference between TA22 and 304 stainless steel increases with temperature, rising from 75 mV to 350 mV. Consequently, when the two metals are electrically coupled, galvanic corrosion will occur and its severity will intensify as the temperature is elevated.
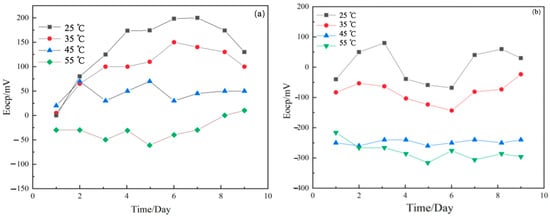
Figure 2.
Open circuit potential diagram of TA22 (a) and 304 (b).
Coupled Current Measurements. Figure 3 presents the time-dependent evolution of the coupling potential and galvanic current density for the TA22/304 stainless steel couple over 10 days at different temperatures. With increasing exposure time and temperature, the galvanic current density exhibits a three-stage trend-an initial decrease, followed by an increase, and finally reaching a quasi-steady state. The initial decrease may correspond to the stabilization of the passive films and the establishment of the galvanic couple. The subsequent increase likely reflects the temperature-accelerated degradation of the passive films, particularly on 304 SS, reducing the overall circuit resistance. The final quasi-steady state suggests a balance between film degradation and repassivation attempts, though at a higher corrosion rate for the anode at higher temperatures. At 25 °C, the stable galvanic current density for the TA22/304 stainless steel couple is negligible at 0.108 μA·cm−2. As temperature increases, the stable galvanic current density rises to 0.43 μA·cm−2 and 0.84 μA·cm−2, respectively, indicating an intensified galvanic corrosion effect.
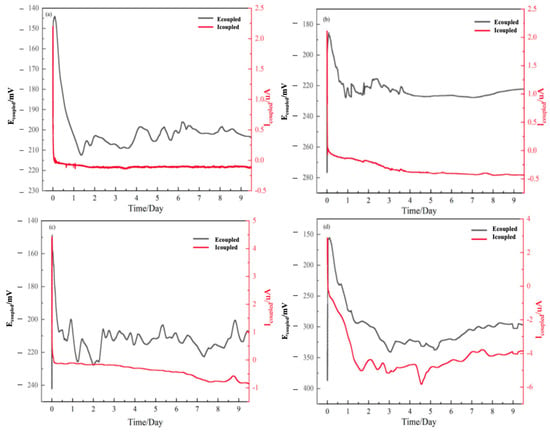
Figure 3.
Coupling potential and coupling current of TA22/304 at different temperatures (a) 25 °C, (b) 35 °C, (c) 45 °C, (d) 55 °C.
Figure 4 shows the cyclic polarization curves of TA22 and 304 film formation at different temperatures. Table 3 presents the corrosion potential (Ecorr) and corrosion current density (Icorr) obtained at different temperatures using the Tafel extrapolation method in the Tafel region. As shown in the figure, the passivation zone of the TA22 film maintains a distinct vertical straight line at different temperatures, indicating that elevated temperatures have little effect on the protective performance of the passivation film. However, the passivation current density of 304 stainless steel (i.e., the current density corresponding to the passivation zone) increases slightly with rising temperature, indicating that elevated temperatures relatively weaken the protective performance of the passivation film.
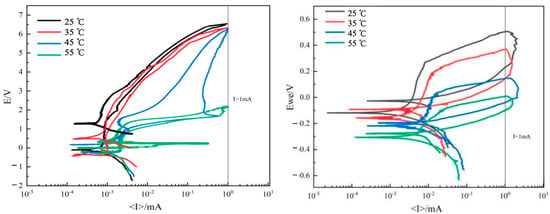
Figure 4.
Cyclic polarization curves of TA22 and 304 under different temperature.

Table 3.
TA22’s (a) and 304’s (b) Tafel region fitting parameters for cyclic polarization curves at different temperatures.
3.2. Electrochemical Impedance Spectroscopy (EIS)
Figure 5 and Figure 6 compare the electrochemical impedance spectra of TA22 and 304 stainless steel under both coupled and self-corrosion conditions at different temperatures. With increasing temperature, the film resistance (Rf) for both materials decreases, indicating that the corrosion resistance of the naturally formed passive films is reduced. TA22 shows a much smaller drop in Rf and maintains values significantly higher than those of 304 stainless steel, suggesting that 304 SS acts as the anode and TA22 as the cathode when the couple reaches a steady state. The greater the temperature, the larger the difference in impedance spectra of TA22, reflecting a stronger galvanic effect []. The coupled TA22 exhibits an inductive loop, implying that the cathodic reaction on TA22 is diffusion-controlled during galvanic corrosion. At 45 °C and 55 °C, the radius of the capacitive arc at the low-frequency end of the coupled 304 SS spectra decreases markedly, indicating that 304 SS is now under charge-transfer control and that pitting has initiated on its passive film [], thereby intensifying the galvanic attack.
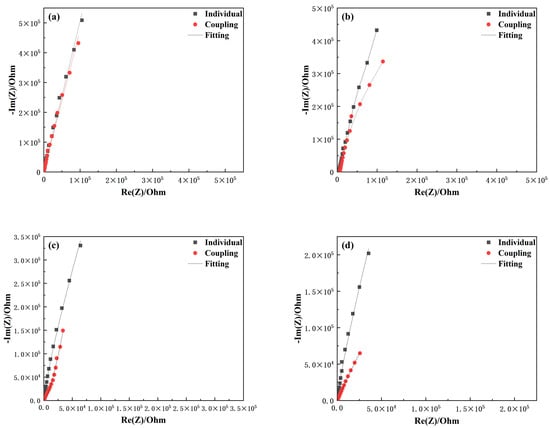
Figure 5.
Comparison of electrochemical impimpedance spectroscopy of TA22 with coupling and self corrosion at different temperatures (a) 25 °C, (b) 35 °C, (c) 45 °C, (d) 55 °C.
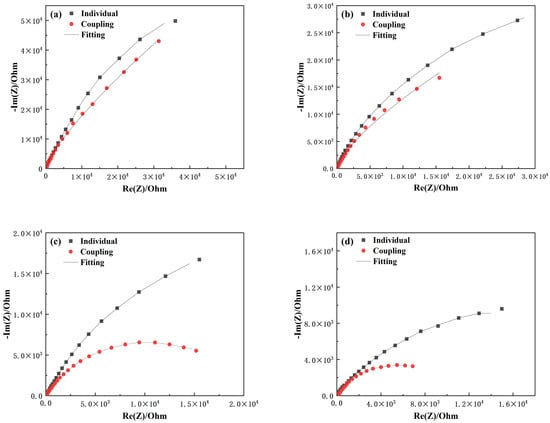
Figure 6.
Comparison of electrochemical impedance spectroscopy of 304 with coupling and self corrosion at different temperatures (a) 25 °C, (b) 35 °C, (c) 45 °C, (d) 55 °C.
Based on the impedance characteristics shown in Figure 5 and Figure 6 and referenced literature [,,], the equivalent circuit shown in Figure 7 was used to fit the EIS data for galvanically coupled TA22 and 304 stainless steel; the fitted parameters are listed in Table 4 and Table 5. Compared with the self-corrosion condition, the film resistance (Rf) of TA22 under galvanic coupling is markedly lower; 304 stainless steel exhibits the same trend. Overall, as the temperature rises to 55 °C, Rf of self-corroding TA22 decreases by only 70%, whereas that of the coupled TA22 drops by about 90% relative to its self-corrosion value. This indicates that galvanic action exerts a far stronger influence on the passive film of TA22 than temperature alone. Moreover, the higher the temperature, the more intense the galvanic effect becomes, and the more pronounced the accelerated corrosion of 304 stainless steel.

Figure 7.
Equivalent circuit diagram of coupled TA22 and 304 in 3.5%NaCl.

Table 4.
Impedance fitting analysis results of coupling TA22 at different temperatures.

Table 5.
Impedance fitting analysis results of coupling 304 at different temperatures.
Mott–Schottky Test. The test results are interpreted using Equation (1) []:
In the equation: CSC is the space-charge capacitance; εr is the relative permittivity of the material (εTi = 60, εss = 15.6); ε0 is the vacuum permittivity, for 8.854 × 10⁻¹⁴ F/cm; e is the elementary charge (1.602 × 10⁻¹⁹ C); Nd and Na are the donor and acceptor concentrations; k is the Boltzmann constant (1.380649 × 10⁻²³ J/K); T is the absolute temperature of the test solution (K); A is the electrode area, 1 cm2. At room temperature, kT/e is small and usually neglected.
For the titanium alloy, the donor density ND [] of TA22 was calculated within the potential range −0.3 V < E < 0.4 V [], As shown in Figure 8a; the positive slopes obtained from the Mott-Schottky fitting [] indicate that the passive film on TA22 exhibits n-type semiconducting behaviour under self-corrosion conditions at all test temperatures. This arises because oxygen vacancies-acting as electron donors-predominate within the film; the formation energy of Ti interstitials (4.7 eV) is higher than that of oxygen vacancies (2.7 eV) []. The M-S slope for TA22 decreases with increasing temperature. According to Equation (1), a smaller slope corresponds to a higher donor density. Table 6a lists the fitted ND values, which rise monotonically with temperature. The flat-band potential Efb of the naturally formed passive film also shifts positively as temperature increases; because the pitting potential moves in the opposite (negative) direction, this positive shift in Efb signifies a decline in film protectiveness. Collectively, the increases in ND and the positive displacement of Efb demonstrate that elevated temperatures introduce more defects into the passive film and degrade its integrity
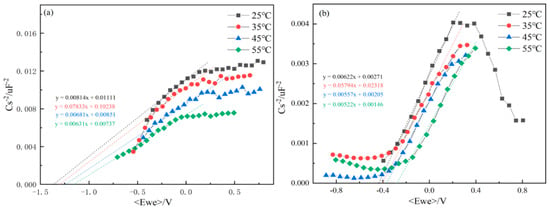
Figure 8.
Mott Schottky curves of TA22 (a) and 304 (b) in 3.5%NaCl at different temperatures.

Table 6.
Key parameters obtained by fitting TA22 (a) and 304 (b) Mott-Schottky curve at different temperatures.
As shown in Figure 8b, the M-S plot of 304 stainless steel exhibits a positive slope between −0.5 V and 0.2 V, indicating n-type semiconducting behaviour [], whereas the slope becomes negative below −0.5 V, revealing p-type characteristics. Table 6b indicates that both the donor density ND and the flat-band potential Efb of 304 SS follow trends analogous to those of TA22 with increasing temperature. These results demonstrate that, as the temperature rises, the passive film formed on 304 stainless steel accumulates more defects and its protective quality deteriorates.
3.3. Corrosion Morphology Observation
As shown in Figure 9, the surface micrographs of TA22 after self-corrosion and after galvanic coupling at the highest test temperature reveal neither pitting nor any other corrosion damage; only the residual polishing scratches and a few defects smaller than 2 µm are visible.
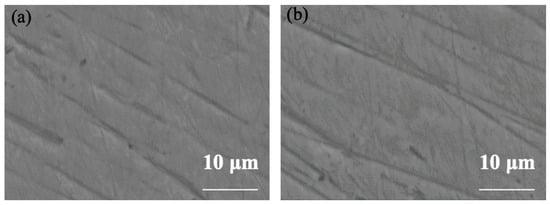
Figure 9.
Micro-morphology comparison of TA22 at 55 °C (a) uncoupled, (b) coupled.
As shown in Figure 10, the morphologies of 304 stainless steel after self-corrosion and galvanic coupling at 25 °C and 35 °C reveal that the metastable pits formed on the coupled specimens are extremely small, with diameters below 15 µm. Owing to the self-repairing ability of the passive film at these temperatures, these metastable pits fail to grow into stable pits.
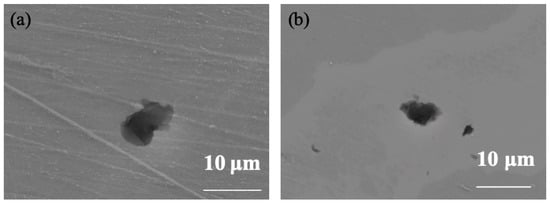
Figure 10.
Micro-morphology comparison of coupling 304 at (a) 25 °C and (b) 35 °C.
As shown in Figure 11 and Figure 12, at 45 °C the individual (self-corroded) 304 stainless steel exhibits pits with an average diameter exceeding 25 µm and a cross-sectional depth of about 5 µm; the pits are irregularly circular. This indicates that the pitting corrosion on the surface of 304 stainless steel has further expanded, and the self-healing capability of the passivation film has failed. Thus, 45 °C is the critical pitting temperature for 304 stainless steel. The pit depth-to-diameter ratio is approximately 0.16. For the coupled 304 stainless steel at the same temperature, the average pit diameter exceeds 30 µm and the depth reaches 8 µm, giving a depth-to-diameter ratio of about 0.22. These results demonstrate that the galvanic current accelerates corrosion, leading to enlarged and deeper pits on the coupled 304 stainless steel.
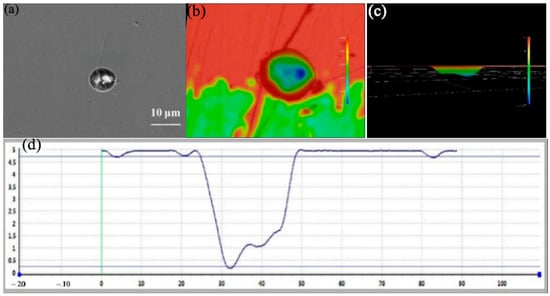
Figure 11.
Size and morphology of self corrosion pits on 304 at 45 °C (a) SEM photo (b) 3D morphology photo (c) 3D morphology side model (d) Section depth measurement.


Figure 12.
Size and morphology of coupling pits on 304 at 45 °C (a) SEM photo, (b) 3D morphology photo, (c) 3D morphology side model, (d) Section depth measurement.
Figure 13 and Figure 14 show the pit morphologies on 304 stainless steel after 10 days of self-corrosion and galvanic coupling at 55 °C, respectively. Compared with Figure 10, raising the temperature above the critical pitting temperature markedly increases both the size and depth of the self-corrosion pits: their diameters are about 60 µm and depths about 9 µm, and the pits appear more regular and circular. This confirms that temperatures above the critical pitting temperature enhance the intrinsic pitting corrosion of 304 stainless steel, enlarging and deepening the pits. After 10 days of galvanic coupling at 55 °C, the pit diameters on the 304 stainless steel surface reach about 80 µm, with the largest pits up to 100 µm, and depths of about 12 µm, yielding a depth-to-diameter ratio of 0.12. The pits remain relatively circular, but several large pits have coalesced. These observations show that the galvanic effect at 55 °C significantly accelerates the corrosion of 304 stainless steel.
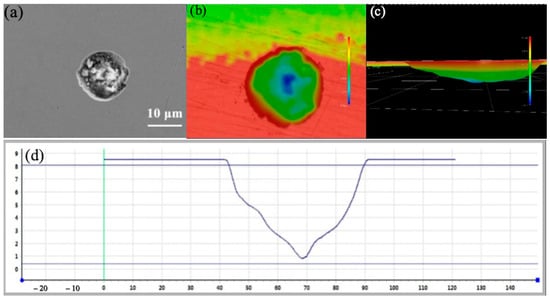
Figure 13.
Size and morphology of self corrosion pits on 304 at 55 °C (a) SEM photo (b) 3D morphology photo (c) 3D morphology side model (d) Section depth measurement.


Figure 14.
Size and morphology of coupling pits on 304 at 55 °C (a) SEM photo, (b) 3D morphology photo, (c) 3D morphology side model, (d) Section depth measurement.
3.4. Analysis of the Surface Film on TA22
X-ray Photoelectron Spectroscopy (XPS) Test Analysis Results. Because SEM revealed no discernible morphological differences on TA22 surfaces after either self-corrosion or galvanic coupling at any temperature, the variations observed in the electrochemical impedance and cyclic polarisation curves could not be ascribed to topography alone. Consequently, XPS depth profiling was performed on the TA22 surfaces to determine how the composition of the passive film evolves with depth under different film-forming conditions, thereby elucidating the influence of coupling and temperature []. Previous work [] has shown that the passive film on titanium alloys consists of titanium oxides of multiple valence states (TiO2, Ti2O3, TiO), with lower-valence Ti3+ and Ti2+ becoming more prevalent closer to the metal/film interface.
Figure 15 and Figure 16 present the XPS-derived depth profiles (at 0 nm, 3 nm and 6 nm sputter depths [,,]) of the various titanium oxidation states within the passive film formed on TA22 after 10 days at 55 °C under self-corrosion and galvanic-coupling conditions, respectively []. At identical depths, the coupled specimen exhibits a lower total TiO2 fraction and higher Ti2O3 and TiO contents. Specifically, after 6 nm of sputtering the self-corroded surface contains 31.6% TiO2, 48.3% Ti2O3 and 19.9% TiO, whereas the coupled surface contains only 26.1% TiO2, 46.7% Ti2O3 and 27.1% TiO. Combined with the EIS results discussed earlier, these findings indicate that galvanic coupling hinders the complete oxidation of titanium, degrades film quality, and ultimately leads to the observed decrease in the fitted film resistance (Rf).

Figure 15.
XPS etching results at different depths of self corrosion TA22 at 55 °C and 3.5% NaCl (a) 0 mn (b) 3 nm (c) 6 nm. (Note: The green line in the figure represents the fitted curve.)

Figure 16.
XPS etching results at different depths of coupling TA22 at 55 °C and 3.5% NaCl (a) 0 mn (b) 3 nm (c) 6 nm. (Note: The green line in the figure represents the fitted curve.)
4. Conclusions
1. Under autoclaving conditions, the passivation film on the surface of TA22 alloy maintains outstanding protective performance even in high-temperature environments. In contrast, 304 stainless steel forms pitting corrosion pits at the critical pitting temperature of 45 °C under these conditions, which expand irreversibly. At 55 °C, pitting intensifies irreversibly, with average pit diameters reaching 60 μm and depths reaching 9 μm.
2. Electrochemical impedance spectroscopy revealed that galvanic coupling significantly reduces the passive film resistance (Rf) of both alloys compared to self-corrosion, with the effect being more pronounced at higher temperatures. The charge transfer resistance (Rct) for the coupled system also decreased with temperature.
Mott-Schottky analysis confirmed the n-type semiconductor character of the passive films on both TA22 and 304 SS. The increase in donor density (ND) and the positive shift of flat-band potential (Efb) with temperature for both materials, and the further modification of the TA22 film composition upon coupling, provide a electronic structure-based explanation for the observed degradation in corrosion resistance and enhancement of galvanic corrosion at elevated temperatures.
3. When titanium alloy serves as the cathode and stainless steel as the anode in a stable galvanic couple system, elevated temperatures increase the galvanic current density from 0.108 μA·cm−2 at 25 °C to 0.84 μA·cm−2 at 55 °C. The deterioration of the protective properties of the TA22 surface film manifests as reduced TiO2 content at equivalent depths e.g., 26.1% vs. 31.6% at 6 nm depth and a significant decrease in film resistance (Rf reduced by 90% at 55 °C compared to its self-corrosion value). Concurrently, the dimensions and depth of pitting pits on 304 stainless steel increase relative to its free-corrosion condition e.g., at 55 °C, average pit diameter increased from 60 μm to 80 μm, depth from 9 μm to 12 μm, thus intensifying the galvanic effect between the coupled metals.
Author Contributions
X.L. and W.C. conceived and designed the experiment, funding acquisition. X.L. and J.M. performed the experiments; R.J. and F.G. performed review & editing; X.L. and J.M. wrote the paper. All authors have read and agreed to the published version of the manuscript.
Funding
This research received no external funding.
Data Availability Statement
Data are available upon request.
Acknowledgments
This work was supported by High-level Talent Research Project of Zhongshan Polytechnic (Grant No. KYG2207) and National Key R&D Program of China (2022YFB3808800).
Conflicts of Interest
The authors declare that the research was conducted in the absence of any commercial or financial relationships that could be construed as a potential conflict of interest.
References
- He, C.Y.; Zhang, L.J. Development and Application of High-Temperature Titanium Alloys at Home and Abroad. World Nonferr. Met. 2016, 1, 21–25. [Google Scholar]
- Fan, X.H.; Yu, Y.; Zhang, Z.R.; Feng, Z.; Chen, L.J.; Dong, L.; Zhang, L. Study on Pitting and Repassivation Behavior of 316L Austenitic Stainless Steel Under Different Potentials. Surf. Technol. 2020, 49, 287–293, 318. [Google Scholar]
- Marcus, P. (Ed.) Corrosion Mechanisms in Theory and Practice, 2nd ed.; CRC Press: New York, NY, USA, 2002. [Google Scholar]
- Li, S.Y.; Chen, W. Galvanic Behavior of Carbon Steel/Copper in NaCl Medium. Corros. Sci. Prot. Technol. 2000, 5, 300–302. [Google Scholar]
- Xing, Q.; Guo, W.M.; Chen, X.X.; Fan, L.; Gong, L.H.; Yang, C. Galvanic Corrosion Behavior of Copper Alloys under Simulated Deep-Sea Low-Temperature Conditions. Equip. Environ. Eng. 2015, 12, 1–5+24. [Google Scholar]
- Wang, C.L. Study on Corrosion Behavior of Complex Coupled Systems in Marine Environment. PhD. Thesis, Harbin Engineering University, Harbin, China, 2013. [Google Scholar]
- Blasco-Tamarit, E.; Igual-Munoz, A.; Anton, J.G.; García-García, D. Galvanic corrosion of titanium coupled to welded titanium in LiBr solutions at different temperatures. Corros. Sci. 2009, 51, 1095–1102. [Google Scholar] [CrossRef]
- Yang, J.; Song, Y.; Dong, K.; Han, E.-H. Research progress on the corrosion behavior of titanium alloys. Corros. Rev. 2023, 41, 5. [Google Scholar] [CrossRef]
- Tal-Gutelmacher, E.; Dan, E. The hydrogen embrittlement of titanium-based alloys. JOM 2005, 57, 46–49. [Google Scholar] [CrossRef]
- Xiao, Y. Study on Galvanic Corrosion Behavior and Protection Technology of Dissimilar Metals. Ph.D. Thesis, North China Electric Power University, Beijing, China, 2021. [Google Scholar]
- ASTM G150-18; Standard Test Method for Electrochemical Critical Pitting Temperature Testing of Stainless Steels. ASTM International: West Conshohocken, PA, USA, 2018.
- Yu, B.; Zhou, P.; Fang, H.J.; Wang, Y.; Pu, J. Effects of the TiO2 content on the mechanical properties and galvanic corrosion resistance of Al2O3 coatings. Ceram. Int. 2023, 49, 38593–38601. [Google Scholar] [CrossRef]
- GB/T 15748-2013; Method of Galvanic Corrosion Test for Metallic Ship Materials. Standards Press of China: Beijing, China, 2014.
- Cui, B.Y.; Zhang, Z.B. Dispersion Effect of AC Impedance Spectrum on Titanium Electrode. Corros. Sci. Prot. Technol. 1994, 6, 123–130. [Google Scholar]
- Dong, K.H.; Song, Y.W.; Chang, F.C.; Han, E.H. Galvanic corrosion mechanism of Ti-Al coupling: The impact of passive films on the coupling effect. Electrochim. Acta 2023, 462, 142662. [Google Scholar] [CrossRef]
- Yuan, S.; Liang, B.; Zhao, Y.; Pehkonen, S.O. Surface chemistry and corrosion behaviour of 304 stainless steel in simulated seawater containing inorganic sulphide and sulfate-reducing bacteria. Corros. Sci. 2013, 74, 353–366. [Google Scholar] [CrossRef]
- Wang, S.L.; Long, F.Y.; Yang, Y. Application and Progress of Electrochemical Measurement Techniques in Pitting Corrosion Research of Stainless Steel. Corros. Prot. 2016, 37, 586–591. [Google Scholar]
- Li, J.; Xie, F.; Wang, D.; Ma, C.; Wu, M.; Gong, K. Effect of magnetic field on stress corrosion cracking induced by Sulfate-reducing bacteria. Constr. Build. Mater. 2021, 303, 124521. [Google Scholar] [CrossRef]
- Burstein, G.T. Revealing corrosion pits. Nature 1991, 350, 188–189. [Google Scholar] [CrossRef]
- Chojnacka, A.; Kawalko, J.; Koscielny, H.; Guspiel, J.; Drewienkiewicz, A.; Bieda, M.; Pachla, W.; Kulczyk, M.; Sztwiertnia, K.; Beltowska-Lehman, E. Corrosion anisotropy of titanium deformed by the hydrostatic extrusion. Appl. Surf. Sci. 2017, 426, 987–994. [Google Scholar] [CrossRef]
- Huang, V.M.; Wu, S.L.; Orazem, M.E.; Pébère, N.; Tribollet, B.; Vivier, V. Local electrochemical impedance spectroscopy: A review and some recent developments. Electrochim. Acta 2011, 56, 8048–8057. [Google Scholar] [CrossRef]
- Fattah-Alhosseini, A.; Soltani, F.; Shirsalimi, F.; Ezadi, B.; Attarzadeh, N. The semiconducting properties of passive films formed on AISI 316 L and AISI 321 stainless steels: A test of the point defect model (PDM). Corros. Sci. 2011, 53, 3186–3192. [Google Scholar] [CrossRef]
- Wang, L.; Yu, H.; Wang, S.; Chen, B.; Wang, Y.; Fan, W.; Sun, D. Quantitative analysis of local fine structure on diffusion of point defects in passive film on Ti. Electrochim. Acta 2019, 314, 161–172. [Google Scholar] [CrossRef]
- Lin, Y.H.; Du, R.G.; Hu, R.G.; Lin, J.C. A Correlation Study of Corrosion Resistance and Semiconductor Properties for the Electrochemically Modified Passive Film of Stainless Steel. Acta Phys. Chim. Sin. 2005, 21, 740–745. [Google Scholar]
- Zhao, P.; Song, Y.; Dong, K.; Shan, D.; Han, E. Effect of passive film on the galvanic corrosion of titanium alloy Ti60 coupled to copper alloy H62. Mater. Corros. 2019, 70, 1745–1754. [Google Scholar] [CrossRef]
- Han, Y.F.; Qiao, H.B.; Sun, H.Z. Galvanic Corrosion Behavior of ZTC4 Titanium Alloy Castings in Artificial Seawater. Hot Work. Technol. 2024, 14, 142–146. [Google Scholar]
- Hai, T.Z.; Lacefield, W.R. XPS EDX and FTIR analysis of pulsed laser deposited calcium phosphate bioceram iccoatings: The effects of various process parameters. Biomaterials 2000, 21, 23–30. [Google Scholar]
- Polzonetti, G.; Iucci, G.; Frontini, A.; Infante, G.; Furlani, C.; Avigliano, L.; Del Principe, D.; Palumbo, G.; Rosato, N. Surface reactions of a plasma-sprayed CaO-P2O5-SiO2 based glass with album in fibroblasts and granulocytes studied by XPS fluorescence and chem ilum inescence. Biomaterials 2000, 21, 1531–15394. [Google Scholar] [CrossRef] [PubMed]
- Milosev, I.; Metikos, H.M.; Strehblow, H.H. Passive film on orthopaedic TiAIV alloy fomed in physiological solution investigated by X-ray photoelectron spectmscopy. Biomaterials 2000, 21, 2103–2113. [Google Scholar] [CrossRef]
- Du, Z.H.; Cui, Z.D.; Zhu, S.L. XPS Study of Anodic Oxide Films on Titanium Alloy. Aerosp. Mater. Technol. 2009, 39, 67–70. [Google Scholar]
Disclaimer/Publisher’s Note: The statements, opinions and data contained in all publications are solely those of the individual author(s) and contributor(s) and not of MDPI and/or the editor(s). MDPI and/or the editor(s) disclaim responsibility for any injury to people or property resulting from any ideas, methods, instructions or products referred to in the content. |
© 2025 by the authors. Licensee MDPI, Basel, Switzerland. This article is an open access article distributed under the terms and conditions of the Creative Commons Attribution (CC BY) license (https://creativecommons.org/licenses/by/4.0/).