Abstract
This study elucidates the effects of the particle size, carbonation time, curing time and pressure on the efficiency of carbon storage in Portland cement mortar. Using pressure chamber experiments, our findings show how carbonation efficiency increases with a decrease in the particle size. Approximately 6.4% and 8.2% (w/w) carbonations were achieved in the coarse-sand and fine-sand based mortar samples, respectively. For the hydration/curing time of 7 h, up to 12% carbonation was achieved. This reduced to 8.2% at 40 h curing period. On the pressure effect, for comparable curing conditions, 2 bar at 7 h carbonation time gives 1.4% yield, and 8.2% at 5 bar. Furthermore, analysing the effect of the carbonation time, under comparable conditions, shows that 4 h of carbonation time gives up to 8.2% yield while 64 h of carbonation gives up to 18.5%. It can be reliably inferred that, under similar conditions, carbonation efficiency increases with lower-sized particles or higher-surface areas, increases with carbonation time and higher pressure but decreases with hydration/curing time. Microstructural analyses with X-ray diffraction (XRD) and scanning electron microscopy (SEM) further show the visual disappearance of calcium-silicate-hydrate (C-S-H) together with the inhibition of ettringite formation by the presence of CO2 and CaCO3 formation during carbonation.
1. Introduction
Global warming arising from climate change is a real global concern. The greenhouse gases, e.g., CO2 and other gases like methane, have been identified as the worst culprits of this menace [1,2,3]. Several efforts have been made to mitigate global warming through the reduction of greenhouse gas emissions. Such efforts centre around carbon capture and storage (CCS) in deep geological aquifers, depleted oil reservoirs, ocean beds and abandoned coal seams [4,5,6,7,8]. Recent evidence reveals that the carbonation of Portland cement concrete is a more promising approach to carbon storage than the geological carbon storage approach. Cement can serve as carbon sink from the reactions of CO2 with the hydrates of tri- and di-calcium silicates (C3S, C2S), which are generally present in cement (during hydration process), as well as the reaction of CO2 with Ca(OH)2, which is a by-product of cement hydration [9,10,11]. The process of carbonation in cement and/or concrete often takes place in various stages. However, the dominant reaction in fresh cement carbonations is as expressed in Equation (1) while Equations (2) and (3) show the early-stage carbonation of hydrated concrete [9].
Further, the presence of AFm phases in cement offers additional routes to carbonate formation with myriads of other products. AFm are a family of hydrated calcium aluminates based on the hydrocalumite-like structure [12], [13]. Yaseen et al. [13] express the decomposition of AFm phases during carbonation with graphene oxide (GO) as follows:
Equation (4) shows that, in addition to carbonates from calcium hydroxide (CH) and calcium-silicate-hydrate (C-S-H) phases, the carbonation of AFm phases generates more carbonates and produces gypsum and alumina gel. This increased productivity of carbonates contributes substantially to CaCO3 polymorph formation, and it is frequently mentioned that the formed CaCO3 amount far exceeded that which could be obtained from the entire CH dissolution [14,15].
The manufacturing of cement follows a process whereby CO2 emissions are generated into the atmosphere. Besides the emissions from fuel combustion in the cement manufacturing process, the chemistry of the reactions is responsible for almost two-thirds (64%) of the CO2 emissions emanating from the Portland cement industry [16,17]. Eventually, the cement is used in the making of concrete for building houses, bridges, road constructions, etc. However, these structures made with cement can reabsorb some of those emissions over time, reversing a portion of the calcination reaction in a process referred to as carbonation [18].
Among the factors expatiated in the literature, the quantity of carbonation in concrete is strongly connected to the available microstructural space in the matrix of the concrete. Galan et al. [19] state that available pore space decreases as the carbonation process continues over time, owing to the formation of calcium carbonate, which contains larger molecules than calcium hydroxide, thus decreasing the available pore space with time. Additionally, if the humidity is too high, the porous system can be blocked off by condensed water, so the carbonation could be obstructed [20]. Zhang [21] reports that the fastest carbonization rate will be reached in the relative humidity of 50–70%, while carbonization will stop when the relative humidity reaches 100% (or in water) or when it is less than 25% (or in the dry environment). Wang et al. [22] also acknowledge the importance of moisture in efficient carbonation. Thus, an effective management of concrete humidity and microstructural space will enhance the carbonization of concrete.
Apart from humidity, the pore size of the concrete can also be affected by the precipitation of the carbonation reaction products owing to the fact that calcium carbonate is formed, which is a larger molecule than calcium hydroxide, thereby reducing the available pore microstructure, making it difficult for the diffusion of carbon dioxide into the sample core as time progresses [19]. This behaviour makes carbonization a surface-based reaction that discontinues after a layer of calcium carbonate has covered the concrete, while calcium hydroxide lies underneath [21]. Therefore, the task of improving carbonation efficiency in concrete involves exposing the available calcium hydroxide as well as the hydrates of tri- and di-calcium silicates (C3S, C2S) for further reaction with incoming CO2. This can be achieved in various ways, including the flow mixing of the concrete with CO2 before the concrete is set. In a semi-batch system, this involves turning the concrete continuously while CO2 is being poured in. Increasing the surface area of the cement aggregate phase is another viable means. Since the reactions take place at the exposed surface, the use of particles with larger surface areas can bring about an improvement in carbonation efficiency.
Furthermore, concrete being exposed to a higher CO2 concentration in the environment might accelerate the carbonation process [23]. Besides cement variety, the water–cement ratio and the relative humidity, an important external factor that can limit carbonization is the concentration of CO2 [21]. Haselbach and Thomas [21] investigated the carbonation of decades-old concrete sidewalk samples. They found the carbonation level decreasing with increasing thickness from the surface of the sample. Up to 80% carbonation was calculated for surface samples. The effects of curing and the time of carbonation were demonstrated on carbonation efficiency by [24], with up to 24% carbonation found for an initial curing time of 18 h, but 8.5% efficiency observed in the absence of initial curing. The authors reported up to 35% efficiency for 4-day carbonation time, when using slag in the concrete. For 2 h of carbonation after 1 h of cooling, [9] recorded only 15% efficiency in hollow-core concrete slab.
Furthermore, the carbonation process improves the mechanical properties of concrete [25,26]. This indicates that mankind will benefit immensely from the practice of concrete carbonation. The quality of calcium carbonate generated by the carbonation process and the developed mechanical strength are both affected by the internal water content [27].
On the strength of the above reports, it can be argued that the simultaneous influences of particle sizes and operating pressures have not been involved in the earlier investigations. The particle sizes, distribution and arrangement will definitely influence the effective microstructural spaces in concrete. This will further determine the pore-scale diffusivity of the CO2, in order to improve the carbonation yield. This work presents a scientific effort to distinguish the effects of various particles sizes on carbonation efficiency under various operating parameters of pressure, carbonation time, the hydration stage and so on. Gravimetric and pyrolysis analyses were used to determine carbonation levels, while the microstructures of the carbonated and uncarbonated concrete samples were examined with the X-ray diffraction (XRD) instrument.
2. Materials and Methods
2.1. Sample Preparation
A pressure chamber made of stainless steel was used for the experiment. This has been previously described in [28]. The gas was 99.9% pure CO2 (BOC Gases, Leicester, UK) and the mortar was prepared from Portland cement (Lafarge Nigeria Limited, CEM 11/B-L 32.5N, Ewekoro, Ogun State, Nigeria) with silica aggregates of two different sizes (4.9 mm and 0.9 mm mean particle diameters, respectively) together with tap water. The mortar samples prepared with a 0.9 mm particle size are referred to as the fine-sand sample while those prepared with a 4.9 mm particle size are referred to as the coarse-sand sample. The silica aggregates were industry-sorted into the above sizes. Therefore, no further sieving process was conducted in our laboratory.
The mix proportion recommended in Building Materials in Civil Engineering [21] was used for the sample preparation, i.e., cement: sand, stone, water, at the ratio, 1:2.21:4.09:0.60. The only modification made in this work to the mix proportion of [21] was that the sand and stone ratios were merged for either fine sand or coarse sand. This modification was necessary because this work uses either fine sand or coarse sand, but not both, in each concrete sample. This is to enable the determination of the particle size/surface area effect in the carbonation of concrete. The concrete samples were prepared in a mould of 1 cm thickness and a 5 cm diameter. To ensure uniformity of weight in each sample, 40 g of concrete mixture was weighed into the mould and then compacted uniformly using a tamping rod for each sample made. In order to investigate the effect of particle sizes, uniform size aggregates were used in each concrete sample, i.e., in every sample, either coarse or fine sand was used, but not both. As a result, for each concrete sample, the combined ratios of both aggregates were used as either fine or coarse sand, i.e., a 6.3 ratio of aggregate (i.e., 2.21 + 4.09) was used in each sample. The cement content in concrete was approximately 12.7%, and the water–cement ratio was 0.60. Both the coarse and fine aggregates were mainly of a silicate origin.
The concrete was prepared by pouring a well-mixed concrete mixture into the 1 cm high and 5 cm diameter metallic mould. This was followed by light tamping with a rod to ensure the compactness of the particles. In order to ensure the different samples had similar weight characteristics, an equal amount (40 g) of concrete was weighed into the mould every time. Figure 1 shows samples of the concrete and the sample holder for the experiment.
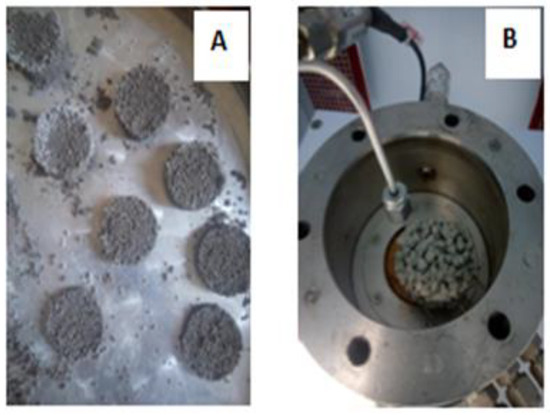
Figure 1.
(A) Mortar samples of a 5 cm diameter and 1 cm thickness. (B) Sample holder with the mortar sample, ready for carbonation experiment [28].
2.2. Experimental Set-Up and Carbonation Quantification
The carbonation experiment was performed in a CO2 pressure chamber at the Chemical Engineering Laboratory of the Loughborough University, Loughborough, Leicestershire, UK. The schematic representation of the experimental set-up is shown in Figure 2. It consists of a sample holder (pressure chamber), which is a steel cell measuring 4 cm high and 10 cm in diameter. It has stainless steel end-pieces at the top and bottom. The top end-piece of the sample holder was connected to the supercritical fluid pump (Model 260D, Isco Teledyne, city, State abbreviation, USA) via a steel tube. The pump was also connected to a pressurised CO2 cylinder. For the purpose of the pressure chamber experiment, the bottom end-piece of the sample holder was plugged to prevent the outflow of gas. The experimental rig was located in a heating cabinet with electric heaters to regulate the system temperature. The instrument used for the temperature regulation was a PID temperature controller (West Control Solutions, Brighton, UK).
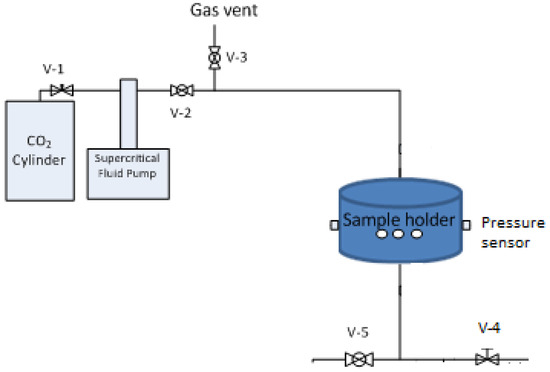
Figure 2.
Experimental set-up for concrete carbonation [28].
A constant temperature of 25 °C was used in all experiments. The pump was filled with CO2 gas at the beginning of the experiment and then set at constant pressure. Three pressure regimes were used: 2, 5 and 20 bars, in order to determine the effect of pressure on the carbonation efficiency. To begin the experiment, connecting valves between the pump and chamber were opened to let gas into the chamber. The system equilibrated readily to maintain pressure and temperature. The experiment continued for different durations, e.g., 4 h, 12 h, 64 h, etc. This was done in order to investigate the influence of time duration on the carbonation efficiency.
Similarly, the effect of the hydration stage or curing time was investigated by subjecting the samples to carbonation after a different curing period or different hydration stages, e.g., 12 h, 24 h, 100 h, etc. Curing is the process in which the concrete is preserved in conditions that prevent the excessive loss of moisture to promote hydration reaction and for the concrete to gain strength. In this work, the hydration time, for the experimental concrete samples, was taken to be the time between concrete preparation and the start of the carbonation experiment for the selected samples.
Gravimetric analysis was primarily used to detect the extent of carbonation in the concrete. The experimental concrete samples were weighed before the beginning of each experiment. They were then carefully placed in the chamber to avoid crumbling or scratching, which might reduce their weights. After the set duration of carbon injection in the pressure chamber, the experiment was stopped, and the carbonated sample weighed again. The differences in the weights of the samples were primarily taken as evidence of percentages of carbonation. The quantification of carbonation was based on the mass of dry cement in the concrete according to Equation (5) [9]:
The cement mass in concrete was determined by two means: (1) by determining the cement percentage applied in the original mix proportion, and (2) by drying selected samples of concrete at 105 °C for 24 h to drive off the water content and to determine the cement and sand content. This was followed by scraping the cement on a sand surface with a metal sponge in hot water with soap. After noting that most of the cement was scraped off, the sand particles were dried again to determine the actual amount of cement in the samples of concrete. This gravimetry method was later corroborated by the pyrolysis technique, using a few samples. The pyrolysis procedure is described below. This approach of determining the carbonation yield essentially relates to weight gain in the gravimetry technique and weight loss in the pyrolysis procedure. Martín et al. [29] relate the measurements of elemental carbon and thermo-gravimetrical weight loss to the amount of captured CO2.
Table 1 presents the summary of the experimental conditions for the different tests performed in this study.

Table 1.
Summary of the experimental conditions of the different tests.
2.3. Pyrolysis Analysis
Pyrolysis analysis was conducted on carbonated and uncarbonated concrete samples by ramping temperature between 550 °C and 1000 °C in a furnace (Carbolite, Eurotherma1, Essex, UK). Before pyrolysis, the samples were first dried in an oven at 105 °C to a constant weight. Following the assumption of Leber and Blakey [30], the weight loss between 550 °C and 1000 °C was attributed to the decomposition of carbonates and was used as a direct measure for the CO2 content with respect to the mass of cement [31,32]. Pyrolysis was only conducted on selected samples of carbonated and uncarbonated concrete. To get the final carbonation percentage, the average CO2 content in the reference/uncarbonated concrete samples was subtracted from that in the carbonated concretes to obtain the CO2 uptake only due to carbonation curing. The CO2 content in the reference samples might have come from limestone used in cement or might have been from CO2 absorbed from the atmosphere [19]. Leber and Blakey [30] estimate the carbonation degree in mortars and concretes based on the assumption that all absorbed CO2 reacts with the limestone to form calcium carbonate. A similar assumption was made in this work
2.4. Microstructural Analysis
X-ray diffraction (XRD) and scanning electron microscopy (SEM) were performed on the carbonated and fresh (reference) concrete samples. The instrument used for the XRD was D2-Phaser Bruker (BX00412, Bruker, Coventry, UK LTD) while that of the SEM was FEGSEM (JSM-7100F, JEOL, Tokyo, Japan). In most cases, the concrete samples were split into halves and one half was carbonated. The two halves were then examined microstructurally for evidence of carbonation.
For the XRD analysis, a powdery layer of cement was extracted from selected samples of the concrete by lightly crushing the sample in a laboratory mortar by pestle. The crushed particles were then sieved in a 80 µm sieve. Wide-angle XRD patterns were obtained using a Bruker D2 Phaser diffractometer fitted with a one-dimensional LynxEye detector. A copper X-ray source (Kα = 1.54184 Å) maintained at 30 kV and 10 mA was used, with the Kβ radiation suppressed by a 0.5 mm thick nickel filter. Patterns were recorded over a 2θ range of 10–90° with a step size of 0.02° and an equivalent step time of 49.2 s. Sample rotation was set at 15 rpm. Bruker’s proprietary Eva 2.0 software (version 5.2) was used to obtain the spectra. The phase identification database used in this work involved the use of the International Centre for Diffraction Data (ICDD) PDF-2.
3. Results
The results of various investigations described above are reported in this section. The results presented here are that of the CO2 involved in the carbonation process, since the average CO2 of the reference (uncarbonated) mortar (1.28%) has been subtracted from the results presented in the following discussion. The average CO2 of 1.28% in the uncarbonated concrete was detected in the pyrolysis analysis. Additionally, the issue of water loss during carbonation, expounded in the work of [9], does not hold here since the carbonation was done in a sealed pressure chamber where gas and moisture did not leave the chamber until the end of the experiment, unlike in [9], where a flow-through process was used and the injected gas, together with the entrained moisture, escaped out of the chamber during the experiment. The CO2 quantity found in reference (uncarbonated) samples might have come from the manufacturing process of cement.
We present the results of the experiments in this section, while a more detailed discussion of the results is presented in the next section (Section 4, discussion).
Gravimetric/Pyrolytic Analysis
Figure 3 shows the comparisons between the analyses conducted on similar samples using gravimetric and pyrolysis methods.
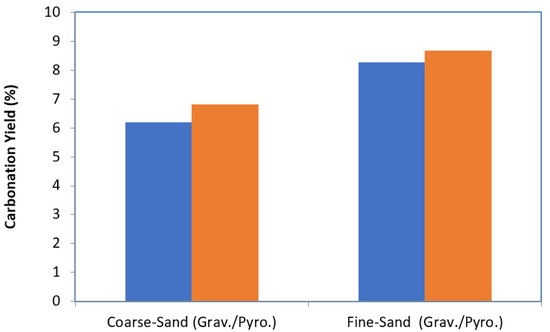
Figure 3.
Comparisons of carbonation yields obtained from gravimetric and pyrolytic analysis (5 bar pressure, 104 h curing time and 6 h carbonation time).
Figure 4 shows the carbonation yield at 5 bar pressure, 4 h carbonation time and 40 h curing time, while Figure 5 shows the carbonation yield at 5 bar pressure, 64 h carbonation time and 40 h curing time. Figure 6 shows the carbonation yield at 5 bar pressure, 6 h carbonation time for 104 h curing time, while Figure 7 shows the carbonation yield at 2 bar pressure, 7 and 24 h carbonation times for 110 and 120 h curing times.
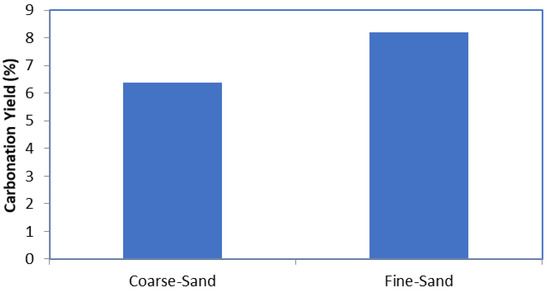
Figure 4.
Carbonation yield at 5 bar pressure, 4 h carbonation time and 40 h curing time.
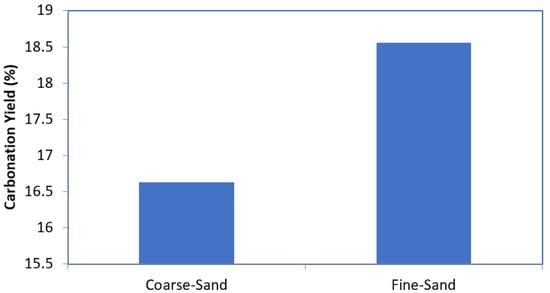
Figure 5.
Carbonation yield at 5 bar pressure, 64 h carbonation time and 40 h curing time.
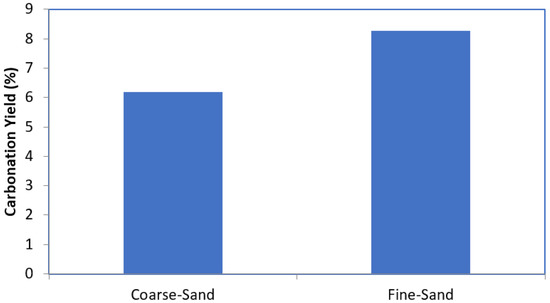
Figure 6.
Carbonation yield at 5 bar pressure, 6 h carbonation time and 104 h curing time.
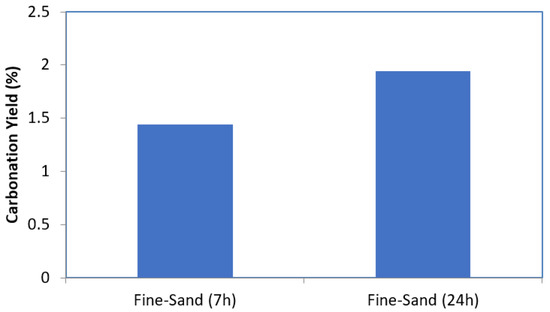
Figure 7.
Carbonation yield at 2 bar pressure, 7 and 24 h carbonation times, 110 and 120 h curing times.
Figure 8 shows the carbonation yields in fine sand mortar at different pressures, namely, 5 bar (104 h curing, 6 h carbonation), and 2 bar (110 h curing, 7 h carbonation). Figure 9 shows the carbonation yield at 5 bar, carbonation/curing times for coarse (26/164 mesh) and fine sand (20/164 mesh) based mortar.
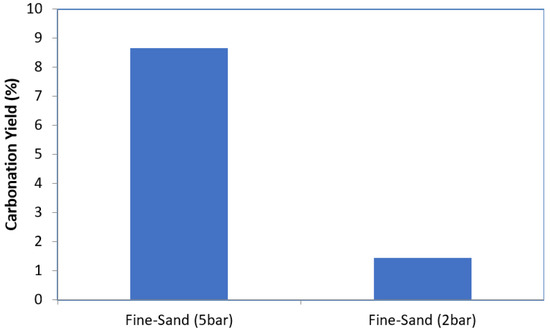
Figure 8.
Carbonation yields in fine sand mortar at different pressures: 5 bar (104 h curing time, 6 h carbonation time) and 2 bar (110 h curing time, 7 h carbonation time).
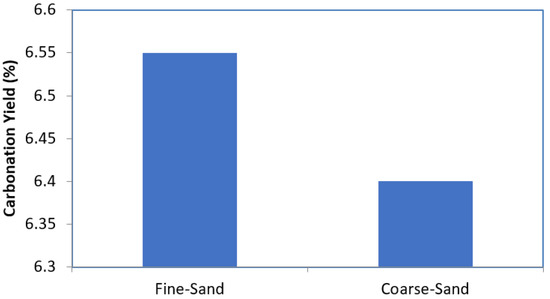
Figure 9.
Carbonation yield at 5 bar, carbonation/curing times for coarse (26/164 mesh) and fine (20/164 mesh) sand mortar.
Figure 10 shows the carbonation yield at 20 bar, 6 h carbonation time, 200 h curing time, while Figure 11 shows the influence of curing time on carbonation yield.
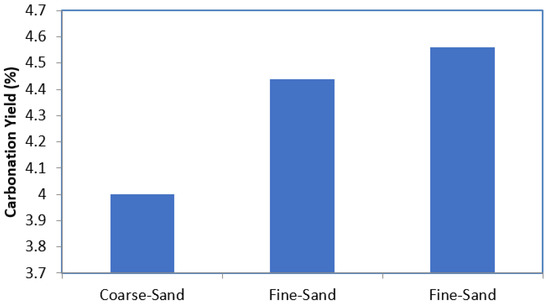
Figure 10.
Carbonation yield at 20 bar, 6 h carbonation time, 200 h curing time.
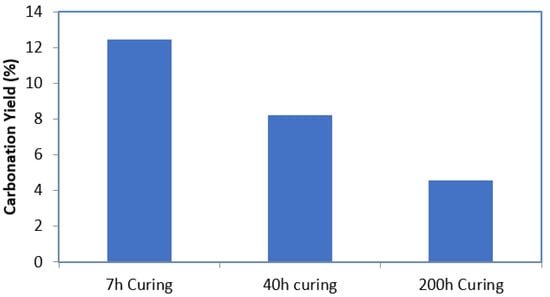
Figure 11.
Influence of curing time on carbonation yield.
Figure 12 is the XRD analysis showing the tricalcium silicate (C3S), Ca(OH)2 and CaCO3 patterns in the carbonated and uncarbonated mortar samples. Carbonation took place at 2 bar for 24 h following 120 h of curing. On the other hand, Figure 13 is the XRD analysis showing tricalcium silicate (C3S), Ca(OH)2 and CaCO3 patterns in carbonated and uncarbonated mortar samples. In this case, carbonation took place at 5 bar for 24 h. In Figure 14 we show the XRD analysis of CaCO3 peaks in carbonated mortar samples. Here, the sample 1 (red line) is 6.55% carbonated, while sample 2 (black line) is 1.94% carbonated.
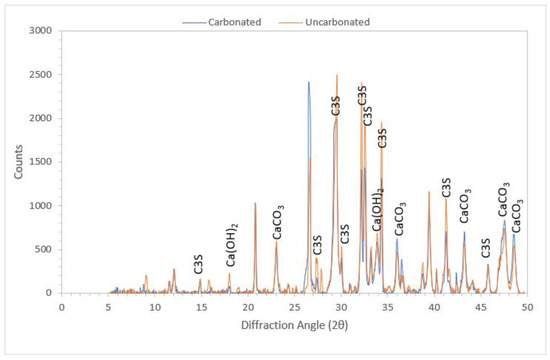
Figure 12.
XRD showing tricalcium silicate (C3S), Ca(OH)2 and CaCO3 patterns in the carbonated and uncarbonated mortar samples. Carbonation took place at 2 bar for 24 h following 120 h of curing [28].
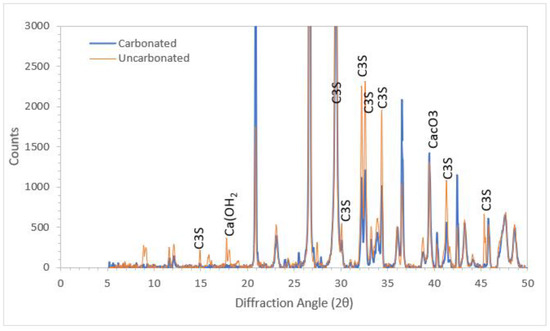
Figure 13.
XRD analysis showing tricalcium silicate (C3S), Ca(OH)2 and CaCO3 patterns in carbonated and uncarbonated mortar samples. Carbonation took place at 5 bar for 24 h [28].
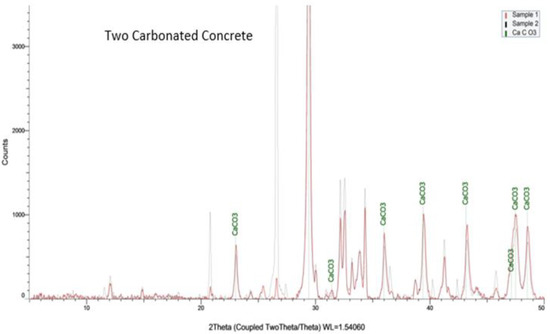
Figure 14.
XRD analysis showing CaCO3 peaks in carbonated mortar samples. Sample 1 (red line) is 6.55% carbonated, while sample 2 (black line) is 1.94% carbonated [28].
Figure 15 shows the SEM images of uncarbonated and carbonated samples. Carbonation took place at 2 bar for 24 h following 120 h of curing. Figure 16 shows the SEM images of uncarbonated and carbonated samples. Carbonation took place at 2 bar for 24 h.
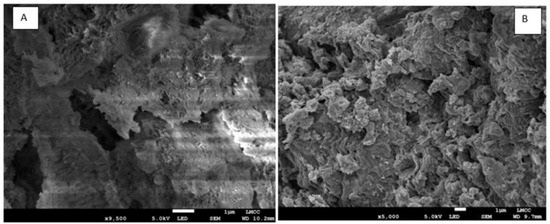
Figure 15.
SEM of (A) uncarbonated and (B) carbonated samples. Carbonation took place at 2 bar for 24 h following 120 h of curing.
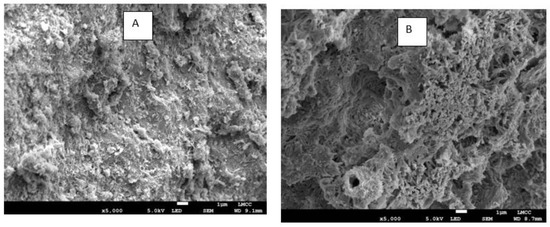
Figure 16.
SEM of (A) uncarbonated and (B) carbonated samples. (2 bar for 24 h).
4. Discussion
The graphical representations of the results from the experiments were described earlier. As a way of affirming the reliability and repeatability of the results, Figure 3 shows the comparisons between the analyses conducted on similar samples using gravimetric and pyrolysis methods. Under similar conditions, the results from the two analyses (gravimetric and pyrolysis (Grav./Pyro.)) were comparable. The figure shows coarse-sand concrete with 6.19% carbonation by gravimetric analysis, while it shows 6.81% carbonation by pyrolysis. In fine-sand concrete, the results show 8.27% carbonation by gravimetric analysis while it shows 8.66% carbonation by pyrolysis. These are close results, and the trends show the reliability of either of the methods.
As shown in Figure 4, following 4 h of carbonation at 5 bar and 25 °C as well as 40 h of curing, approximately 6.4 and 8.2% carbonations were achieved in the coarse-sand and fine-sand mortar samples, respectively. The results showed higher carbonation in fine-sand mortar. Ordinarily, owing to its higher porosity, it is expected that the coarse-sand based mortar will have more interstitial pore spaces to allow CO2 penetration and carbonation reaction to take place. However, the results show that the higher surface area present in fine-sand based concrete is a stronger factor to be considered.
Under similar conditions to that in Figure 4, but with 64 h of carbonation, the carbonation of the mortar increased to 16.6% and 18.3% for coarse-sand and fine-sand based mortar samples, respectively. This also gives higher carbonation in fine-sand based mortar than the coarse-sand type, thereby confirming the influence of particle sizes on the carbonation reactions in mortar. It further shows the influence of carbonation time on the reaction. Thus, under suitable conditions, longer exposure of concrete to CO2 plume will improve the carbonation reaction. The plot of these results is shown in Figure 5.
After 104 h of curing and 6 h of carbonation time, similar levels of carbonation were observed as after 4 h of carbonation (Figure 4), while other conditions were similar. The results show that carbonation efficiency is reduced as curing time increases. This is depicted in Figure 6. In the figure, there are 6.2% and 8.3% carbonations in coarse-sand and fine-sand based concrete samples, respectively, which, again, shows higher carbonation potential in fine-sand mortar.
The results show that the carbonation time and particle sizes are stronger factors in carbonation efficiency while the curing time has a reverse influence. However, the slightly longer carbonation time (6 h) with the slightly lower carbonation yield and longer curing time compared to Figure 4 implies that the carbonation potential reduces as the curing of the mortar progresses. This means that as silicates are consumed during the hydration of concrete, the carbonation potential reduces [9,32]. Early-age carbonation of the concrete has been reported to improve the mechanical strength of concrete composite [25]. Thus, there is a higher advantage in concrete carbonation at a shorter curing period. Further, since the concrete samples used here are not rewetted with water after preparation, the result might imply that as carbonation progresses, concrete loses water, which reduces its potential for reaction with CO2 under dry conditions [21]. It should be noted that the works of [9] as well as [24] employed rewetting of the mortar, which might have enhanced carbonation, while [24] compensates for the water loss during initial curing and carbonation curing with water spray, which was applied to restore the original water content. The early carbonation approach was also employed by [9] by conducting the process after about 2 h of curing. This approach of compensating water loss is also expected to improve carbonation efficiency by making use of the moderate moisture in the mortar. This practice of compensating water loss or rewetting obviously explains the differences in the results of the current work and earlier investigations by [24] as well as by [9]. Adding liquid water into samples at appropriate time intervals could enhance carbonation reactions effectively, with a maximum improvement of 34.1% previously recorded [22].
Figure 7 shows the results of experiments conducted at a lower pressure of 2 bar in order to test the influence of pressure on the carbonation yield in the mortar. The results show that the carbonation yield became lower than before, ostensibly owing to the lower pressure of the experiment. Similar to the earlier observations, the influence of carbonation time is reflected in the results, with the yield at 24 h carbonation time (1.9%) obviously higher than that at 7 h (1.4%). Figure 8 shows the effect of pressure on the carbonation yields in fine sand samples under the similar conditions of the curing and carbonation periods. The results show the clear positive influence of pressure on the carbonation efficiency under similar conditions.
Figure 9 shows another interesting dimension to the previous discussions. In this case, experiments were conducted at 5 bar but at a longer curing period of 164 h. These experiments took place for longer carbonation times of 20 h and 26 h. Despite the higher carbonation time, the yields here (6.5% for fine and 6.4% for coarse) are even lower than those for fine-sand mortar at 4 h carbonation time (8.2% in Figure 4). These results defy the influence of the carbonation time, as propounded earlier. However, the ostensible reason for this can be traced to the longer curing time of 164 h. Owing to this lengthy period of curing, much of the original silicates in the mortar have been consumed by the hydration reaction and much moisture was lost as the hydration progressed. Thus, the hydration stage accounts for the degree of carbonation in concrete. Furthermore, the influence of particle size is evident in the results. The coarse-sand concrete had a lower carbonation yield than fine-sand concrete. This was despite the longer number of hours involved for the carbonation of coarse-sand concrete (26 h) compared to the time involved for the fine-sand concrete (20 h). As stated earlier, a longer curing time often leads to reduced water content in the sample, which hampers the efficiency of the carbonation process. Carbonization will stop when the relative humidity reaches 100% (or in water) or is less than 25% (or in the dry environment) [21].
Figure 10 shows the experimental results obtained at a higher pressure in concrete using 20 bar gas pressure in the chamber. Approximately 4.0% carbonation was achieved in the coarse-sand mortar, while the first and second fine-sand mortars had 4.4% and 4.6% carbonation yields, respectively. This again shows the influence of particle size in the carbonation efficiency of concrete. However, compared to the earlier results (see, e.g., Figure 6), the expected influence of higher pressures is missing in this case (Figure 10). In Figure 6, a more than 8% carbonation yield was obtained at 5 bar, 104 h curing time and 6 h carbonation time. The low carbonation yield in Figure 10 (e.g., 4.6%), was ostensibly as a result of a higher curing period of 200 h, which reduces the carbonation efficiency. Thus, it can be inferred that the curing or hydration stage has great influence on the carbonation in the mortar. After days of hydration, the carbonation effectiveness reduces. The stage of hydration at which this effectiveness starts to decline needs to be investigated in the future. However, rewetting the mortar can reduce the effect of moisture loss on the carbonation potential after a long period of curing. Furthermore, as shown in Figure 10, the results of the repeat experiments for the two fine samples (4.4% and 4.6%) show the repeatability of the results in these investigations. The expected influence of higher pressures can be seen between the performances of the carbonation processes in Figure 6 and Figure 7, under similar curing conditions. In Figure 6, at a pressure of 5 bar, fine-sand concrete recorded 8.27% carbonation at a 104 h curing period and 6 h of carbonation time, while in Figure 7, at a pressure of 2 bar, fine-sand concrete recorded 1.4% carbonation at a 110 h curing period and 7 h of carbonation time. This performance, despite the higher carbonation time in the latter, shows the obvious influence of pressure (5 bar in the former and 2 bar in the latter).
The influence of the curing period on the carbonation yield is comparatively shown in Figure 11, with yields depicted for 7 h of curing (5 bar, 4 h carbonation), 40 h of curing (5 bar, 4 h carbonation) and 200 h of curing (20 bar pressure, 6 h carbonation). After 4 h carbonation time, 12.5% carbonation was achieved in the fine-sand mortar cured for 7 h, while around one-third of the yield (4.56%) was obtained for 200 h-cured concrete. This clearly depicts the strong influence of the curing period on the carbonation efficiency in concrete.
Summary analysis of the gravimetric results shows that for a curing period of 7 h (Figure 11), more than 12% carbonation was achieved. The carbonation reduced to 8.2% at the 40 h curing period (Figure 4 and Figure 11). On the pressure effect, for comparable curing conditions, 2 bar at 7 h carbonation time gave a 1.4% yield (Figure 5) while 5 bar at 6 h carbonation time gave more than 8.2% (Figure 6). Furthermore, analysing the effect of carbonation time for comparable conditions shows that 4 h of carbonation time gave up to a 8.2% yield, while 64 h of carbonation gave up to 18.5%. The carbonation time is effective in ensuring that CO2 diffusion takes place at the surface and core parts of the concrete. Thus, the longer the carbonation time, the further the reach of the gas in the concrete structure.
In comparison, [9] record up to 14.5% carbonation in 2 h of carbonation following 2 h of heat curing. This carbonation yield is comparable to the 64 h of carbonation and 40 h of curing in this work (Figure 5). It may appear that the efficiency is higher in the work of [9], but a consideration of the different experimental processes and conditions explains some underlying factors. In [9], they used a flow-through experiment where CO2 was made to pass through the microstructural pores in the mortar, unlike in this work, where CO2 had to overcome surface inhibition or pore blockage to diffuse further into the mortar matrix. That explains why the authors were able to report the carbonation yields at the top, core and bottom of the carbonated mortar. Furthermore, the carbonation by [9] took place immediately following 2 h of curing. This enhances the performance of the process, unlike in the current case, where carbonation took place after 40 h of curing, which resulted in more loss of moisture. Furthermore, the cement content in the mortar used by [9] was 15% compared to 12.7% used in this work. They used a water content of 0.3 compared to 0.6 in this work. Thus, the mortar samples in [9] had more pore space owing to the lower water content and more binder cement, both of which contributed to their better carbonation performance.
Ref [24] reported up to 24% carbonation with initial curing of up to 18 h. The effect of carbonation time was also reported, with up to 35% carbonation based on 4-day carbonation time (96 h) recorded. Again, this seems to show a better carbonation than recorded in this work. However, it should be noted that the authors used slag in their concrete mixture, which might have enhanced the carbonation efficiency. Pozzolana cement and blast-furnace slag cement readily undergo carbonization [21]. Similar to the current findings, their work corroborated the fact that carbonation increases with CO2 exposure time (carbonation time). The observation that carbonation increases with time is similar to the findings of [18] on the carbonation of decades-old concrete sidewalk samples.
In Figure 12, at 2θ =14.9, 27.5, 29.6, 32.3, 32.6, 34.3 and 41.3, the peaks of tricalcium silicate (C3S) were conspicuously stronger in the uncarbonated mortar samples than in the carbonated ones. The reason for this is that the carbonation reactions reduced the amount of remaining silicates in the concrete [19]. At 2θ = 36.1, 43.3, 47.5 and 48.6, CaCO3 peaks were stronger in the carbonated mortar samples, which shows evidence for carbonation. At 2θ = 18.1 and 34.2, stronger peaks appear for Ca(OH)2 in uncarbonated samples than in the carbonated ones. This observation is similar to the findings by [19]. This observation may be accounted for by the fact that Ca(OH)2 growth is inhibited by carbonation in carbonated mortar while its growth is less-restrained in uncarbonated mortar samples.
Figure 13 shows further evidence of carbonation in mortar samples. In the figure, peaks for Ca(OH)2 and C3S are conspicuously stronger in the uncarbonated samples than in the carbonated ones. This implies that these compounds were consumed by the carbonation process, leading to their reduced quantities in the carbonated sample. Evidence of carbonation is further indicated in the carbonated sample at 2θ = 39.6, with a stronger peak for CaCO3 in the carbonated mortar. Meanwhile, it should be noted that the reaction of CO2 with Ca(OH)2 during the carbonation process leads to reduced pH. Thus, acidity increases in carbonated mortar, which may have a detrimental effect on the steel in reinforced concrete. Therefore, carbonation may be more suitable for unreinforced concrete.
Furthermore, Figure 14 shows relative carbonation in two carbonated mortar samples with CaCO3 peaks. Sample 1 (red line) was 6.55% carbonated while sample 2 (black line) was 1.94% carbonated. At every point considered, there are relatively stronger peaks in sample 1 (6.55%) than sample 2 (1.94%). This indicates the increase of carbonate content in carbonated samples and may be taken as evidence of relative percentages of carbonation.
Micrographs of scanning electron microscopy (SEM) for the carbonated and uncarbonated concrete samples are shown in Figure 15. The uncarbonated sample (Figure 15A) displays the amorphous C-S-H phase with Ca(OH)2 background. The ettringite needles are hardly visible in the uncarbonated sample owing to the early stage curing of the samples (120 h or 5 days). In [9], they did not observe ettringite needles in heat-cured concrete until after 28 days. Therefore, the faint and scarce needle-like structures at the background of the samples may indicate the early formation of the product. In their work, [33] observed a small amount of ettringite at the early stage but more at a later age.
Figure 15B shows a uniform denser and cloudy mass of carbonated concrete with a crispy look and without the elements of connecting needles or a nebulous connection as in Figure 15A. The absence of the needle-like connection in the carbonated concrete can be attributed to the early stage of curing as well as the inhibition of ettringite formation by the presence of CO2 and CaCO3 formation [19,34]. According to [34], early-age carbonation curing decomposed this ettringite into calcium carbonates. In the figure, the CaCO3 has been seamlessly integrated into the C-S-H phase to give a more solid and denser structure. As concrete is carbonated, it becomes denser, because CaCO3 occupies a greater volume than the Ca(OH)2, which it replaces in the concrete [35,36]. Thus, Figure 15B reflects the evidence of carbonation. The darker appearance of the micrograph in Figure 15B is also evidence of carbonation in the sample. The production of crystalline CaCO3 under carbonation had a filling effect that refined the pore sizes [34], thus leading to a uniform denser and cloudy mass of carbonated concrete with a crispy look.
Figure 16 shows another set of carbonated and counterpart uncarbonated concrete samples. In Figure 16A, widespread distribution of the needle form of C-S-H (calcium-silicate-hydrate) is visible together with the background Ca(OH)2 phase. These patterns disappeared in the carbonated concrete, leading to denser-looking structure (Figure 16B). This dense look can mean increased strength in the carbonated concrete. Carbon dioxide reacts with tricalcium silicate (C3S) and this accelerates the setting and early strength development [37].
Similarly, a change in appearance is also noticeable. The carbonated concrete has a darker appearance than the uncarbonated sample. This is likely the effect of carbonation on the sample. The un-hydrated cement particles appear brightest [38], while the carbonated concrete has more grey to dark grey areas [39].
5. Conclusions
Laboratory experiments and micro-structural analyses were carried out to show the performance of Portland cement mortar for storage of carbon dioxide. Particle size, carbonation time, curing time and carbonation pressure exhibited various effects on the efficiency of carbon storage in Portland cement mortar. The carbonation efficiency increased with an increased surface area, which resulted in higher carbonation in fine-sand based mortar samples. The results showed about 28% higher carbonation in fine-sand based mortar samples as compared to coarse-sand based mortar samples. The hydration time had a reversed effect on carbonation, with a reduction in the carbonation level by about 31% recorded, owing to a difference of about 33 h hydration time in the mortar samples. The carbonation efficiency increased with pressure, from 1.4% to 8.2% for a pressure rise from 2 bar to 5 bar. Similarly, the duration of carbonation shows a positive effect, with the carbonation efficiency rising from 8.2% to 18.5% for a change in carbonation duration from 4 to 64 h. It can be reliably inferred that, under similar conditions, the carbonation efficiency will increase with lower-sized particles or a higher-surface area, increase with carbonation time, increase with higher pressure but decrease with hydration time. Microstructural analyses with X-ray diffraction (XRD) and scanning electron microscopy (SEM) further show the consumption of calcium-silicate-hydrate (C-S-H) together with the inhibition of ettringite formation by the presence of CO2 and CaCO3 formation during carbonation. Owing to the consumption of Ca(OH)2, carbonation leads to reduced pH, which engenders corrosion in reinforced concrete. Therefore, carbonation should be limited to unreinforced concrete.
Author Contributions
Conceptualization, L.K.A. and D.B.D.; methodology, L.K.A.; software, D.B.D.; validation, D.B.D.; formal analysis, L.K.A.; investigation, L.K.A.; resources, D.B.D.; data curation, L.K.A.; writing—original draft preparation, L.K.A.; writing—review and editing, L.K.A. and D.B.D.; visualization, L.K.A.; supervision, D.B.D.; project administration, D.B.D.; funding acquisition, D.B.D. All authors have read and agreed to the published version of the manuscript.
Funding
This research received no external funding.
Institutional Review Board Statement
Not applicable.
Informed Consent Statement
Not applicable.
Data Availability Statement
The corresponding author can be contacted for further information and access to raw data.
Acknowledgments
The authors acknowledge Loughborough University, Loughborough, UK, especially the Department of Chemical Engineering for granting Abidoye, L.K. the use of its laboratory in which this work was successfully executed. The authors are also grateful to the technologists in the Department of Chemical Engineering, Loughborough University, especially Sean Creedon and Tony Eyre, for their efforts in the successful academic visit of Abidoye.
Conflicts of Interest
The authors declare no conflict of interest.
References
- Petvipusit, K.R.; Elsheikh, A.H.; Laforce, T.C.; King, P.R.; Blunt, M.J. Robust optimisation of CO2 sequestration strategies under geological uncertainty using adaptive sparse grid surrogates. Comput. Geosci. 2014, 18, 1–16. [Google Scholar] [CrossRef]
- Stephens, J.C. Growing interest in carbon capture and storage (CCS) for climate change mitigation. Sustain. Sci. Pract. Policy 2006, 2, 4–13. [Google Scholar] [CrossRef]
- Rabiu, K.O.; Abidoye, L.K.; Das, D.B. Geo-electrical characterization for CO2 sequestration in porous media. Environ. Process. 2017. [Google Scholar] [CrossRef]
- Abidoye, L.K.; Das, D.B. Tracking CO2 Migration in Storage Aquifer. In Carbon Capture, Utilization and Sequestration; Agarwal, R.K., Ed.; IntechOpen: London, UK, 2018; Available online: https://www.intechopen.com/books/carbon-capture-utilization-and-sequestration/tracking-co2-migration-in-storage-aquifer (accessed on 12 January 2019). [CrossRef]
- Goel, G.; Abidoye, L.K.; Das, D.B.; Chahar, B.R.; Singh, R. Scale dependency of dynamic relative permeability-saturation curves in relation with fluid viscosity and dynamic capillary pressure effect. Environ. Fluid Mech. 2016, 16, 945–963. [Google Scholar] [CrossRef]
- Wang, Z. Effects of Impurities on CO2 Geological Storage. Master’s Thesis, University of Ottawa, Ottawa, ON, Canada, 2015. [Google Scholar]
- Abidoye, L.K.; Das, D.B.; Khudaida, K. Geological carbon sequestration in the context of two-phase flow in porous media: A review. J. Crit. Rev. Environ. Sci. Technol. 2015, 45, 1105–1147. [Google Scholar] [CrossRef]
- Mathieson, A.; Wright, I.; Roberts, D.; Ringrose, P. Satellite imaging to monitor CO2 movement at Krechba, Algeria. Energy Procedia 2009, 1, 2201–2209. [Google Scholar] [CrossRef]
- Shao, Y.; Morshed, A.Z. Early carbonation for hollow-core concrete slab curingand carbon dioxide recycling. Mater. Struct. 2015, 48, 307–319. [Google Scholar] [CrossRef]
- Adedokun, D.A.; Ndambuki, J.M.; Salim, R.W. Improving Carbon Sequestration in Concrete: A Literature Review. Int. Sch. Sci. Res. Innov. 2013, 7, 269–271. [Google Scholar]
- Lagerblad, B. Carbon Dioxide Uptake during Concrete Life Cycle, State of the Art; Swedish Cement and Concrete Research Institute—CBI: Gothenburg, Sweden, 2005; pp. 1–47. ISBN 91-976070-0-2. [Google Scholar]
- Matschei, T.; Lothenbach, B.; Glasser, F. The AFM phase in Portland cement. Cem. Concr. Res. 2007, 37, 118–130. [Google Scholar] [CrossRef]
- Yaseen, S.A.; Yiseen, G.A.; Li, Z. Elucidation of Calcite Structure of Calcium Carbonate Formation Based on Hydrated Cement Mixed with Graphene Oxide and Reduced Graphene Oxide. ACS Omega 2019, 4, 10160–10170. [Google Scholar] [CrossRef]
- Šavija, B.; Lukovic, M. Carbonation of Cement Paste: Understanding, Challenges, and Opportunities. Constr. Build. Mater. 2016, 117, 285–301. [Google Scholar] [CrossRef]
- Stepkowska, E.T.; Perez-Rodríguez, J.L.; Sayagues, M.J.; Martínez-Blanes, J.M. Calcite, Vaterite and Aragonite Forming on Cement Hydration from Liquid and Gaseous Phase. J. Therm. Anal. Calorim. 2003, 73, 247–269. [Google Scholar]
- Hills, T.; Leeson, D.; Florin, N.; Fennell, P. Carbon Capture in the Cement Industry: Technologies, Progress, and Retrofitting. Environ. Sci. Technol. 2016, 50, 368–377. [Google Scholar] [CrossRef]
- Elzinga, D.; Bennett, S.; Best, D.; Burnard, K.; Cazzola, P.; D’Ambrosio, D.; Dulac, J.; Fernandez Pales, A.; Hood, C.; LaFrance, M.; et al. Energy Technology Perspectives 2015: Mobilising Innovation to Accelerate Climate Action; International Energy Agency: Paris, France, 2015. [Google Scholar]
- Haselbach, L.; Thomas, A. Carbon sequestration in concrete sidewalk samples. Constr. Build. Mater. 2014, 54, 47–52. [Google Scholar] [CrossRef]
- Galan, I.; Andrade, C.; Mora, P.; Sanjuan, M.A. Sequestration of CO2 by concrete carbonation. Environ. Sci. Technol. 2010, 44, 3181–3186. [Google Scholar] [CrossRef] [PubMed]
- Pade, C.; Guimaraes, M. The CO2 uptake of concrete in a 100 year perspective. Cem. Concr. Res. 2007, 37, 1348–1356. [Google Scholar] [CrossRef]
- Zhang, H. Building Materials in Civil Engineering; Woodhead Publishing Limited: Cambridge, UK, 2011; ISBN 978-1-84569-955-0. [Google Scholar]
- Wang, D.; Noguchi, T.; Nozaki, T. Increasing efficiency of carbon dioxide sequestration through high temperature carbonation of cement-based materials. J. Clean. Prod. 2019, 238, 117980. [Google Scholar] [CrossRef]
- Monkman, S.; Shao, Y. Assessing the carbonation behavior of cementitious materials. J. Mater. Civ. Eng. 2006, 18, 768–776. [Google Scholar] [CrossRef]
- El-Hassan, H.; Shao, Y. Carbon Storage through Concrete Block Carbonation Curing. J. Clean Energy Technol. 2014, 2, 287–291. [Google Scholar] [CrossRef]
- Junior, A.N.; Ferreira, S.R.; Filho, R.D.T.; Fairbairn, E.M.R.; Dweck, J. Effect of early age curing carbonation on the mechanical properties and durability of high initial strength Portland cement and lime-pozolan composites reinforced with long sisal fibres. Compos. Part B Eng. 2019, 163, 351–362. [Google Scholar] [CrossRef]
- Ashraf, W.; Olek, J.; Sahu, S. Phase evolution and strength development during carbonation of low-lime calcium silicate cement (CSC). Constr. Build. Mater. 2019, 210, 473–482. [Google Scholar] [CrossRef]
- Ho, L.S.; Nakarai, K.; Ogawa, Y.; Sasaki, T.; Morioka, M. Effect of internal water content on carbonation progress in cement-treated sand and effect of carbonation on compressive strength. Cem. Concr. Compos. 2018, 85, 9–21. [Google Scholar] [CrossRef]
- Abidoye, L.K.; Das, D.B. Carbon storage in concrete: Influences of hydration stage, carbonation time and aggregate characteristics. In Proceedings of the 1st International Conference on Engineering and Environmental Sciences, Osun State University, Osogbo, Nigeria, 5–7 November 2019; pp. 212–224. [Google Scholar]
- Martin, D.; Flores-Alés, V.; Aparicio, P. Proposed Methodology to Evaluate CO2 Capture Using Construction and Demolition Waste. Minerals 2019, 9, 612. [Google Scholar] [CrossRef]
- Leber, I.; Blakey, F.A. Some effects of carbon dioxide on mortars and concrete. J. Am. Concr. Inst. 1956, 53, 295–308. [Google Scholar] [CrossRef][Green Version]
- Young, J.F.; Berger, R.L.; Breese, J. Accelerated curing of compacted calcium silicate mortars on exposure to CO2. J. Am. Ceram. Soc. 1974, 57, 394–397. [Google Scholar] [CrossRef]
- Khoshnazar, R.; Shao, Y. Characterization of carbonation-cured cement paste using X-ray photoelectron spectroscopy. Constr. Build. Mater. 2018, 168, 598–605. [Google Scholar] [CrossRef]
- Siedel, H.; Hempel, S.; Hempel, R. Secondary ettringite formation in heat treated portland cement concrete: Influence of different W/C ratios and heat treatment temperatures. Cem. Concr. Res. 1993, 23, 453–461. [Google Scholar] [CrossRef]
- Liu, Y.; Zhuge, Y.; Chow, C.-W.K.; Keegan, A.; Li, D.; Pham, P.N.; Huang, J.; Siddique, R. Properties and microstructure of concrete blocks incorporating drinking water treatment sludge exposed to early-age carbonation curing. J. Clean. Prod. 2020, 261, 121257. [Google Scholar] [CrossRef]
- You, K.; Jeong, H.; Hyung, W. Effects of Accelerated Carbonation on Physical Properties of Mortar. J. Asian Archit. Build. Eng. 2014, 13, 217–221. [Google Scholar] [CrossRef]
- Mors, R.; Jonkers, H. Effect on Concrete Surface Water Absorption upon Addition of Lactate Derived Agent. Coatings 2017, 7, 51. [Google Scholar] [CrossRef]
- De Weerdt, K.; Ben Haha, M.; Le Saout, G.; Kjellsen, K.O.; Justnes, H.; Lothenbach, B. Hydration mechanisms of ternary Portland cementscontaining limestone powder and fly ash. Cem. Concr. Res. 2011, 41, 279–291. [Google Scholar] [CrossRef]
- Zhao, H.; Darwin, D. Quantitative backscattered electron analysis of cement paste. Cem. Concr. Res. 1992, 22, 695–706. [Google Scholar] [CrossRef]
- Supit, S.W.M.; Shaikh, F.U.A. Effect of Nano-CaCO3 on Compressive Strength Development of High Volume Fly Ash Mortars and Concretes. J. Adv. Concr. Technol. 2014, 12, 178–186. [Google Scholar] [CrossRef]


Publisher’s Note: MDPI stays neutral with regard to jurisdictional claims in published maps and institutional affiliations. |
© 2021 by the authors. Licensee MDPI, Basel, Switzerland. This article is an open access article distributed under the terms and conditions of the Creative Commons Attribution (CC BY) license (https://creativecommons.org/licenses/by/4.0/).