Abstract
Heavy metal contamination in agricultural soils poses serious threats to food safety, ecosystem integrity, and public health. This study investigates the concentrations, ecological risks, and human health impacts of nine heavy metals Cr, Mn, Co, Ni, Cu, Zn, Pb, As, and V in homestead agricultural soils collected from two depths, surface (0–20 cm) and subsurface (21–50 cm), across industrial and non-industrial regions of Bangladesh, using inductively coupled plasma mass spectrometry (ICP-MS). Results revealed that surface soils from industrial areas exhibited the highest metal concentrations in order of Mn > Zn > Cr > Pb > V > Ni > Cu > As > Co. However, maximum As levels were detected in non-industrial areas, suggesting combined influences of local geology, intensive pesticide application, and prolonged irrigation with As-contaminated groundwater. Elevated concentrations in surface soils indicate recent contamination with limited downward migration. Multivariate statistical analyses indicated that industrial and urban activities are the major sources of contamination, whereas Mn remains primarily geogenic, controlled by natural soil forming processes. Contamination factor (CF) and pollution load index (PLI) analyses identified Pb and As as the principal pollutants, with hotspots in Nairadi, Majhipara (Savar), Gazipur sadar, and Chorkhai (Mymensingh). Ecological risk (ER) assessment highlighted As and Pb as the dominant environmental stressors, though overall risk remained low. Human health risk analysis showed that ingestion is the primary exposure pathway, with children being more susceptible than adults. Although the hazard index (HI) values were within the acceptable safety limits, the estimated carcinogenic risks for As and Cr exceeded the USEPA thresholds, indicating potential long term health concerns. Therefore, the cumulative carcinogenic risk (CCR) results demonstrate that As is the primary driver of lifetime carcinogenic risk in homestead soils, followed by Cr, while contributions from other metals are minimal. These findings emphasize the urgent need for continuous monitoring, improved industrial waste management, and targeted mitigation strategies to ensure safe food production, a cleaner environment, and better public health.
1. Introduction
Home gardens, often referred to as homestead agriculture, are increasingly recognized as vital components of sustainable food systems. They contribute significantly to food and nutritional security, income generation, and climate resilience worldwide [1]. As one of the oldest forms of cultivation, homestead gardens continue to provide fresh produce and supplementary income, particularly during economic or environmental crises [2]. For instance, the COVID-19 pandemic, which disrupted global food supply chains and disproportionately affected vulnerable populations, underscored the urgency of achieving Sustainable Development Goals (SDGs), particularly “No Poverty” and “Zero Hunger” [3]. With more than 295 million people still facing chronic food insecurity and malnutrition [4] and the global population projected to surpass 9 billion by 2050, food production systems must evolve to meet increasing demands. In this context, homestead agriculture plays a pivotal role by ensuring access to nutritious food. In Bangladesh, approximately 0.88 million hectares are dedicated to homestead gardening, contributing 3–44% of household caloric intake and 4–32% of protein intake [5], while also supporting poverty alleviation and providing employment for women [6].
Despite their importance, the sustainability and safety of homestead food production in Bangladesh are threatened by heavy metal contamination, particularly in industrially dense regions. Elevated concentrations of arsenic (As), Nickel (Ni), chromium (Cr), lead (Pb), and zinc (Zn) in agricultural soils often result from industrial effluents, untreated sewage, atmospheric deposition, agrochemicals, and contaminated irrigation water [7,8]. Industrial hubs engaged in textile manufacturing, battery recycling, metal plating, and e-waste processing tend to exhibit higher contamination levels than non-industrial areas, though agricultural runoff and waste mismanagement also contribute significantly [9,10]. Soil depth further influences contamination patterns: surface soils are directly exposed to deposition, while subsurface layers accumulate pollutants through leaching and percolation [11]. The degradation of soil quality poses long-term risks to food safety and ecosystem, as heavy metals can enter crops and subsequently reach the human body via ingestion, dermal contact, or inhalation [12]. In addition to human exposure pathways, pollutants from agricultural and industrial activities including excessive fertilizers, pesticides, waste dumping, and emissions further degrade soil, water, and air quality [13], disrupt microbial communities, reduce soil fertility, and threaten biodiversity and ecosystem stability [14].
Chronic exposure to heavy metals is associated with a wide range of severe health outcomes. As, a well-known carcinogen, is linked to cancers of the skin, lungs, and bladder, as well as liver damage and cardiovascular diseases [15]. In Bangladesh, this issue is further aggravated by the use of arsenic-contaminated groundwater for irrigation, which facilitates its transfer into the food chain [16]. Pb exposure from industrial sources is associated with neurological disorders, developmental delays, and cognitive impairment in children [17]. Similarly, cadmium, Cr, Ni, and mercury are linked to kidney dysfunction, respiratory illness, and various cancers [18]. As contamination becomes more widespread, these health risks have emerged as major public health concerns in both industrial and non-industrial regions.
Globally, numerous studies have reported heavy metal contamination in soils, crops, water bodies, and sediments, including research from Italy [19], the United States [20], China [21], Croatia [22], Africa [23], and Bangladesh [24]. However, comparatively little attention has been given to contamination in homestead agricultural soils in Bangladesh, even though produce from these systems is consumed directly by households without any commercial processing or safety checks. This knowledge gap is particularly concerning, given the vital role of homestead gardens in supporting rural food security.
Considering the clear links between environmental contamination and human health, regular monitoring of homestead agricultural soils is essential [25]. Therefore, the present study aims to (i) quantify heavy metal concentrations in surface and subsurface soils of industrial and non-industrial homestead areas in Bangladesh, (ii) assess spatial variability in contamination, and (iii) evaluate ecological and human health risks using standardized pollution indices and risk assessment models. The findings from this research provide a deeper understanding of the environmental and public health risks posed by heavy metal contamination in homestead-based agricultural systems.
2. Materials and Methods
2.1. Study Area Description
This study was conducted across four districts surrounding the capital city Dhaka, Bangladesh: Savar, Narayanganj, Gazipur, and Mymensingh (Figure 1). These sites were strategically selected to represent contrasting levels of industrial activity and their potential influence on homestead agriculture. Savar, Narayanganj, and Gazipur are heavily industrialized, whereas Mymensingh served as a non-industrial, agriculturally dominant control site.
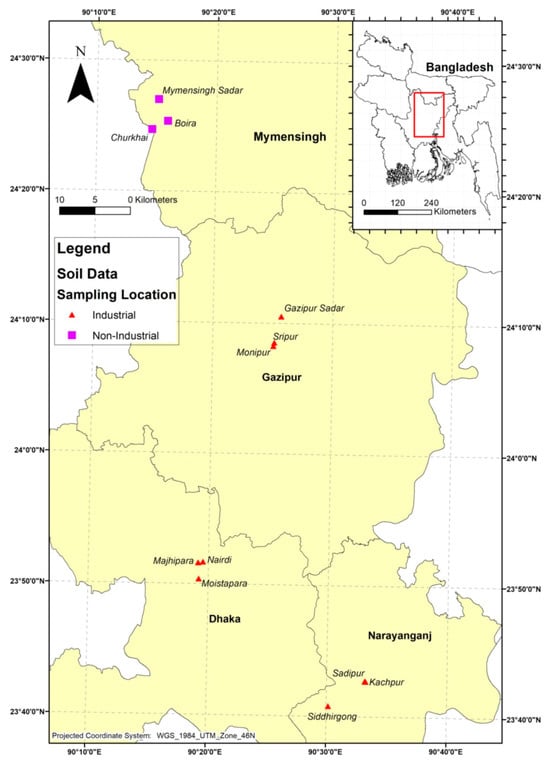
Figure 1.
Map of the homestead agricultural soil sampling areas in Bangladesh, with red triangles indicating industrial areas and purple quadrilaterals indicating non-industrial areas.
Savar hosts diverse industries including tanneries, textiles, dyeing, and pharmaceuticals, often located near residential settlements. Narayanganj, one of the oldest industrial hubs, is renowned for textile, dyeing, and printing sectors. Gazipur has undergone rapid urbanization with growth in garment manufacturing, electronics, and plastics. The sampling locations were selected based on their proximity to major industrial zones. In these districts, homesteads are typically situated near industrial sites and are therefore highly vulnerable to contamination from multiple sources, including irrigation with polluted water, atmospheric deposition, and improper disposal of industrial effluents and solid wastes [26]. Small and medium-scale industries lacking proper waste management further exacerbate this risk. In contrast, Mymensingh was selected as a control due to its minimal industrial activity and reliance on traditional agriculture with natural irrigation. Its rural setting, dominated by subsistence farming and homestead gardening, provides a baseline for comparing contamination in industrial and non-industrial contexts. The general features of the selected study areas are summarized in Table 1.

Table 1.
Overview of the selected study areas, including soil type, vegetation cover, and potential contamination sources.
2.2. Soil Sampling and Processing
Soil sampling was carried out in mid-July 2024, immediately after the monsoon season, to record the post-monsoon contamination status. Soil samples were collected from four districts, with three sampling sites per district. At each site, soils were sampled from two depths: surface (0–20 cm) and subsurface (21–50 cm). For each site depth combination, three subsamples were collected using a stainless-steel hand auger (country made), and homogenized to form one composite sample, resulting in a total 72 composite samples. All sampling tools were made of stainless steel to avoid contamination. The soil samples were air-dried, homogenized, and wrapped in laboratory-grade, acid-washed aluminum foil. Since the samples were completely dry and aluminum was not among the target analytes, the foil posed no risk of contamination. The wrapped samples were then placed in clean polyethylene containers for transport and storage to avoid external contamination, in compliance with phytosanitary regulations [27,28]. The general soil properties for each location and depth are presented in Table 2.
Table 2.
Physicochemical properties of soils at varying depths across selected locations.
In the laboratory, soil samples were cleaned, air-dried, and then ground and sieved using a mechanical shaker (AS 200-digit Retsch AS200, Retsch GmbH, Haan, Germany). The sieved samples were wrapped in aluminum foil and stored under refrigeration until analysis. Subsequently, the samples were oven-dried at 105 °C to a constant weight, further ground using an agate mortar, and passed through a 20 µm mesh to ensure homogenization. For digestion, 0.5 g of soil was treated with aqua regia (HNO3:HCl = 1:3) [29] and heated on hotplate (Zojirushi EA-DD10-TA, Zojirushi Corporation, Osaka, Japan) at 150 °C for approximately 90 min or until brown fumes ceased. The digested samples were then cooled, diluted with deionized water, filtered, and stored at 4 °C until heavy metal analysis (Figure 2).
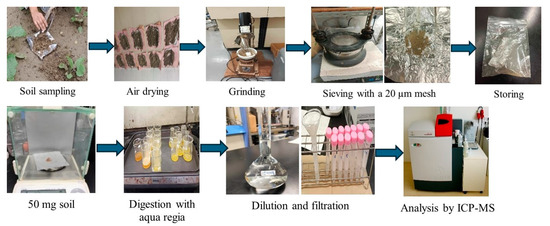
Figure 2.
Workflow of soil sample collection, preparation, and laboratory analysis for heavy metal determination.
2.3. Heavy Metal Analysis
The concentrations of heavy metals in the soil samples were measured using Inductively Coupled Plasma Mass Spectrometry (ICP-MS; PerkinElmer NexION 350D, Shelton, CT, USA) at the Center for Environmental Science in Saitama, Japan (Figure 2). The instrument was operated under standard conditions, including a plasma gas flow rate of 18.00 L/min, auxiliary gas flow of 1.20 L/min, nebulizer gas flow of 0.98 L/min, and plasma power of 1600 W. Prior to analysis, digested samples were diluted with 3% HNO3 and spiked with an internal standard solution (Y). To ensure that heavy metal concentrations fell within the optimal detection range of the instrument (0.001–0.1 µg/L), the final digested solution was diluted tenfold with deionized water before measurement. The ICP-MS system was warmed up, tuned using a standard tuning solution, and its stability verified prior to analysis. Calibration curves were prepared using multi-element standard solutions (XSTC-662, Spex CertiPrep, Metuchen, NJ, USA), and only curves with R2 > 0.999 were accepted for quantification.
2.4. Quality Assurance and Quality Control (QA/QC)
Comprehensive QA/QC procedures were implemented throughout soil sampling, preparation, digestion, and ICP-MS analysis to ensure data accuracy and reliability. Method blanks prepared with ultrapure water (Milli-Q) were included in each batch to monitor contamination during sample processing. All glassware was acid-washed and thoroughly rinsed with deionized water prior to use. Reagent blanks were digested using the same procedure as the soil samples and processed simultaneously. Analytical accuracy was evaluated using certified reference material (CRM), which was digested and analyzed in triplicate. Each digested sample solution was analyzed three times, and the relative standard deviation of repeated measurements remained below 5%. Elemental recoveries obtained from the CRM were within acceptable ranges for all analyzed metals. Therefore, QA/QC procedures including method blanks, reagent blanks, and CRM validation showed no evidence of contamination from storage materials. Additionally, we obtained excellent recovery percentages for the examined heavy metals from the CRMs, ranging from 93% to 104%. After every ten determinations, the instrument was recalibrated using standard solutions. The limits of detection (LOD) for Mn, Cr, Cu, Ni, Co, Zn, As, and Pb were 0.041, 0.018, 0.048, 0.088, 0.009, 0.067, 0.001, and 0.085 ng/mL, respectively, as previously reported [30]. It is important to note that certain toxic metals such as mercury (Hg), despite their environmental significance [31], were not analyzed due to methodological limitations.
2.5. Assessment of Contamination Levels
To comprehensively assess heavy metal contamination in homestead agricultural soils, several widely used indices were employed in this study. These include the Contamination Factor, Pollution Load Index, and Ecological Risk Index. Each was calculated relative to background concentrations of heavy metals, representing their natural geochemical abundance in soils and sediments. The accuracy and reliability of these assessments largely depend on the selection of appropriate background reference values [32] (Table 3).
Table 3.
Reference Doses (RfD) and Cancer Slope Factors (CSF) applied in health risk assessment through three exposure pathways.
In the absence of localized baseline data for homestead agricultural soils in Bangladesh, this study adopted globally recognized geochemical background values, as recommended [41]. The background concentrations used were as follows: Cr (59.5 mg/kg), Mn (488 mg/kg), Ni (29 mg/kg), Zn (70 mg/kg), Cu (38.9 mg/kg), Pb (27 mg/kg), Co (11.3 mg/kg), V (82.4 mg/kg), and As (5.2 mg/kg). The CF index assesses contamination from individual metals by expressing the ratio of observed concentration to background levels. In contrast, the PLI and Er provide integrated assessments of overall pollution levels and the potential ecological risks posed by multiple metals. These indices were chosen for their simplicity, interpretability, and applicability in various environmental contexts.
2.5.1. Contamination Factor
The Contamination Factor (CF) is used to assess the degree of metal contamination in relation to its geochemical background and is calculated using the following equation [42]:
where concentration of the heavy metal in the soil, and background value of the heavy metal mentioned in Section 2.5. Based on its value, CF can be categorized into four levels of contamination: when CF values < 1 indicate low contamination, 1–3 moderate contamination, 3–6 considerable contamination, and > 6 very high contamination.
2.5.2. Pollution Load Index
The Pollution Load Index (PLI) provides a cumulative indication of overall heavy metal pollution at a sampling site. It is calculated as the geometric mean of the CF values for the metals assessed using the following formula:
where CFn is the contamination factor of each individual metal and n is the number of metals evaluated. Interpretation of PLI values: PLI < 1: No pollution; PLI = 1: Baseline (background) pollution level and PLI > 1: Progressive site deterioration due to pollution.
2.5.3. Ecological Risk Assessment
The Ecological Risk Index (Er) is used to assess the potential ecological threat posed by heavy metals in soil, indicating the level of environmental risk they may present to local ecosystems. This index accounts for both the contamination level and the toxicological characteristics of each metal [42]. The Er value is calculated using the following formula:
where Er is the ecological risk factor of a single metal; Tr is the toxic response factor for a given heavy metal, and CF is the contamination factor as previously described. The Tr reflects the metal’s potential to cause ecological harm. The Tr values used in this study are as follows: Cr = 2, Mn = 1, Pb = 5, Co = 5, Cu = 5, Ni = 5, Zn = 1, As = 10 and V = 2. Based on ecological risk factors, the classification is defined as follows: Er < 40 indicates a low potential ecological risk; 40 ≤ Er < 80 represents a moderate potential ecological risk; 80 ≤ Er < 160 corresponds to a considerable ecological risk; 160 ≤ Er < 320 denotes a high ecological risk; and Er > 320 reflects a very high ecological risk [43].
2.6. Human Health Risk Assessment
Assessing the human health risks posed by heavy metals is essential for understanding the potential adverse effects they may have on both children and adults living in contaminated areas. This study evaluates the non-carcinogenic and carcinogenic health risks associated with exposure to heavy metals specifically Cr, Mn, Ni, Zn, Pb, Co, Cu, As, and V through three main exposure pathways: ingestion, inhalation, and dermal contact.
The risk assessment approach followed the guidelines and equations outlined by the United States Environmental Protection Agency (USEPA). So, Equations (4)–(17) were used to calculate average daily intake for each pathway, hazard quotient (HQ), hazard index (HI), and cancer risk (CR), allowing for a comprehensive evaluation of health hazards linked to heavy metal exposure in homestead agricultural soils.
These quantitative methods enable the identification of populations at risk and help prioritize contaminants requiring mitigation efforts in both industrial and non-industrial zones. Prolonged environmental exposure to heavy metals can lead to serious human health risks. To evaluate the potential health risks associated with exposure to heavy metals in the study area, both non-carcinogenic and carcinogenic risks were assessed following the standard methodology recommended by the United States Environmental Protection Agency [44].
2.6.1. Estimated Daily Intake
Human exposure to heavy metals occurs predominantly via three pathways: ingestion, inhalation, and dermal contact, as supported by previous studies [45,46]. The Average Daily Dose (ADD, mg·kg−1·d−1) for each pathway is calculated using the following equations:
Parameters: C = Concentration of heavy metal in soil (mg/kg), Ring, Rinh = Ingestion and inhalation rates (mg/day), EF = Exposure frequency (days/year), ED = Exposure duration (years), BW = Body weight (kg), AT = Averaging time (days), PEF = Particle emission factor, AF = Skin adherence factor (mg/cm2), SA = Exposed skin surface area (cm2), ABS = Dermal absorption factor.
2.6.2. Cancer Risk Assessment
The cancer risk associated with lifetime exposure to carcinogenic heavy metals was evaluated using the Lifetime Average Daily Dose (LADD) and the Cancer Slope Factor (CSF). The LADD for ingestion, inhalation, and dermal contact was followed [30,47] and calculated using the following equations:
2.6.3. Non-Carcinogenic Risk
The Hazard Quotient (HQ) is the ratio of the ADD to the Reference Dose (RfD) for each pathway. If HQ > 1, it suggests a potential for non-carcinogenic effects. The Hazard Index (HI) is the sum of HQ values across all pathways:
2.6.4. Carcinogenic Risk
The Carcinogenic Risk (CR) estimates the probability of an individual developing cancer over a lifetime due to exposure to a carcinogen. The Cumulative Carcinogenic Risk (CCR) is the sum of CRs across all exposure pathways:
2.7. Statistical Analysis
Data were analyzed using IBM SPSS Statistics Version 20, Microsoft Excel 2013, and R software (version 4.3.2). The mean, minimum, and maximum, were used to summarize heavy metal concentrations in soils from industrial and non-industrial areas. Mean differences among sampling sites were evaluated using Duncan’s Multiple Range Test (DMRT). Pearson correlation analysis was performed to evaluate relationships among heavy metals and potential contamination sources. Additionally, principal component analysis (PCA) and Hierarchical cluster analysis (HCA) were conducted in R to identify major contributing factors and classify sampling sites based on their contamination profiles.
3. Results and Discussion
3.1. Heavy Metal Concentrations in Industrial and Non-Industrial Homestead Agricultural Soils
The distribution of heavy metals in homestead agricultural soils showed distinct differences between industrial and non-industrial areas, as well as between surface (0–20 cm) and subsurface (21–50 cm) layers (Table 4). In general, industrial soils contained consistently higher concentrations than non-industrial soils, except for As. Industrial soils consistently exhibited higher contamination levels, underscoring the strong influence of industrial activities on local soil quality and the enrichment can be attributed to discharges from leather tanning, electroplating, and textile industries [41,48]. Mn was abundant in both zones, with similar average concentrations, indicating a predominantly geogenic origin. However, the maximum value in industrial soils slightly exceeded the critical threshold of 860 mg/kg, pointing to localized enrichment from atmospheric deposition, sewage irrigation, sludge application, animal manure, mineral fertilizers, and pesticides [49]. Both Co and Ni exhibited comparable levels across land use types. Cu and Zn were more concentrated in surface soils of industrial areas compared to subsurface soils in non-industrial sites, likely due to emissions from stainless steel production and electroplating activities [50].
Table 4.
Heavy metal concentrations (mg/kg) in surface and subsurface soil of homestead agricultural soils.
Additionally, Pb demonstrated the pronounced contrast, averaging 47.91 mg/kg in industrial soils compared with 14.42 mg/kg in non-industrial areas. The maximum Pb concentration exceeded the FAO/WHO guideline of 100 mg/kg, likely due to emissions from battery manufacturing, smelting, and vehicular activities [30]. In contrast, As levels were higher in non-industrial subsurface soils than in industrial soils. This unexpected trend may reflect natural geological variability, prolonged irrigation with As-contaminated groundwater or agrochemical inputs in rural areas [41,48]. V concentrations were nearly identical across both zones and depths, indicating predominantly geogenic origins. The consistently higher concentrations of Cr, Ni, Cu, Zn, and Pb in industrial soils confirm the strong anthropogenic footprint of local industries. These findings align with previous reports from Bangladesh and other developing countries, where inadequate waste management and unregulated industrial discharge contribute to heavy metal accumulation in peri-urban agricultural soils [48,51]. Conversely, Mn, Co, As, and V appear to be primarily geogenic or influenced by non-industrial activities. Notably, the elevated Pb levels in Savar and Narayanganj reflect the impacts of informal smelting and vehicular emissions, whereas the higher As concentrations in Mymensingh likely result from irrigation with contaminated groundwater [39], suggesting that not all metals are equally influenced by industrial sources.
3.2. Heavy Metal Concentrations in Surface and Subsurface Layers of Different Homestead Agricultural Soils
Across all study sites, surface soils exhibited higher mean concentrations of Cr, Mn, Cu, Zn, Pb, and As than subsurface soils, indicating pronounced anthropogenic enrichment in the topsoil. The pattern of surface accumulation aligns with previous studies that attribute elevated metal levels to atmospheric deposition, wastewater irrigation, and solid waste disposal in industrial regions [48]. Depth-wise comparisons (Figure 3) further revealed distinct contamination patterns across different districts.
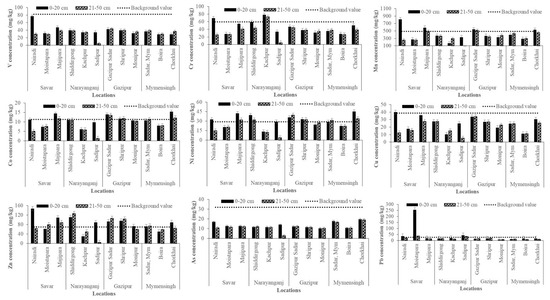
Figure 3.
Concentrations of heavy metals (mg/kg) in soils at 0–20 cm (surface) and 21–50 cm (subsurface) depths across different study areas.
However, V showed wide variability, with the highest surface concentration recorded at Nairadi (Savar) and the lowest at Boira (Mymensingh). Subsurface levels were consistently lower, reflecting deposition primarily from industrial emissions rather than natural sources. Cr was particularly elevated in surface soils at Kanchpur (Narayanganj) and Nairadi (Savar), both exceeding the global background value of 35 mg/kg [41]. Subsurface enrichment at Kanchpur suggests possible vertical migration in sandy soils, with tanneries, dyeing, and electroplating industries as major contributors [52]. Mn was abundant at both depths, with the highest surface concentrations observed in Nairadi, Savar. Subsurface values were comparatively lower, consistent with its limited mobility under near neutral pH conditions [43,53]. Co generally remained within the global soil range (1–40 mg/kg), though localized surface enrichment occurred at Chorkhai (Mymensingh) and Majhipara (Savar), possibly reflecting minor industrial and agrochemical inputs.
Moreover, Ni concentrations reached 45.17 mg/kg at Chorkhai (Mymensingh) and 42.30 mg/kg at Majhipara (Savar), approaching the WHO guideline of 50 mg/kg [50]. Cu was also enriched in surface soils, particularly at Nairadi and Majhipara (Savar), with values nearing phytotoxic thresholds [48]. Lower concentrations in subsurface soils suggest that surface enrichment is primarily due to agrochemical use and industrial dust deposition. Zn concentrations ranged from 29.61 mg/kg at Kanchpur to 147.37 mg/kg at Nairadi (Savar), indicating inputs from galvanizing industries, tire wear, and wastewater irrigation [54]. As reached critical levels in surface soils at Chorkhai (Mymensingh) and Nairadi (Savar), most likely driven by local geology, long-term irrigation with As-rich groundwater, and pesticide use [55]. Furthermore, Pb showed the most alarming enrichment, with extreme concentrations in Moistapara (Savar) far exceeding the FAO/WHO guideline of 100 mg/kg, likely resulting from emissions associated with battery recycling, paints, and vehicular exhaust [51]. Therefore, industrial zones (Savar, Narayanganj, and Gazipur) exhibited markedly higher enrichment of Cr, Zn, Pb, Cu, and V compared to non-industrial sites. Interestingly, however, elevated concentrations of Co, Ni, and As were recorded in the non-industrial area of Mymensingh (Chorkhai), which may be attributed to a combination of anthropogenic and natural sources, including agricultural inputs (fertilizers, irrigation, sewage sludge), vehicular emissions, improper waste disposal, and possible industrial influences [39]. The pronounced surface accumulation indicates recent and ongoing contamination, with limited downward migration into deeper layers. These findings underscore the vulnerability of peri-urban homestead agricultural soils to industrial emissions and highlight the urgent need for continuous monitoring and site-specific management strategies to mitigate heavy metal contamination and ensure food safety.
3.3. Source Assessment for the Heavy Metal Contaminations in Homestead Agricultural Soils
To evaluate potential sources of heavy metals, principal component analysis (PCA), Pearson’s correlation analysis, and hierarchical cluster analysis (HCA) were conducted. These multivariate approaches allowed discrimination between lithogenic and anthropogenic influences and provided insights into depth dependent contamination dynamics.
3.3.1. Principal Component Analysis (PCA)
Principal Component Analysis (PCA) was conducted to examine the spatial distribution of and variation in heavy metals in both surface soils (0–20 cm) and subsurface soils (21–50 cm) in homestead agricultural areas. The analysis provides valuable insights into the relationships between various soil samples and the heavy metals present at different soil depths (Figure 4).
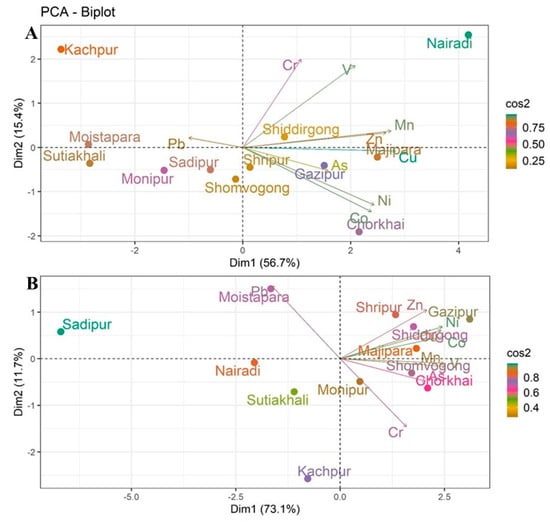
Figure 4.
Principal Component Analysis (PCA) of heavy metals in homestead agricultural soils: (A) surface soils (0–20 cm) and (B) subsurface soils (21–50 cm).
In surface soils, the first two components explained 72.1% of the total variance (Dim1: 56.7%, Dim2: 15.4%), effectively capturing the major patterns of metal accumulation (Figure 4A). The PCA biplot shows clear separation among locations based on their metal concentrations. Kachpur is placed distinctly along the positive axis of Dim1, indicating unique heavy metal characteristics compared to other locations. Sadipur, Monipur, and Sutiakhali clustered on the negative side of Dim1, indicating similar contamination profiles. Cu, Zn, and Ni show strong alignment with Dim1, indicating higher concentrations of these metals in locations like Shiddirgong and Majipara. The association of these metals with Dim1 suggests that their accumulation is likely influenced by anthropogenic factors, such as industrial activities [56,57]. As and Mn showed higher correlations with Dim2, with elevated concentrations in Gazipur and Chorkhai, likely reflecting agricultural inputs or localized environmental factors [58].
For subsurface soils, PCA explained 84.3% of the variance (Dim1: 73.1%, Dim2: 11.2%), suggesting clear discrimination of deeper soil contamination (Figure 4B). Sadipur and Nairadi are distinctly positioned, showing significant differences in the metal concentrations compared to other locations. Moistapara showed strong association with Pb, while Gazipur was dominated by Co, Ni, Cu, and Zn, indicating contamination from industrial activities such as chemical manufacturing, wastewater discharge, urbanization, and vehicular emissions, as well as agricultural practices involving contaminated fertilizers and manure [58]. Chorkhai and Mymensingh Sadar clustered with As and V, indicating possible influences from agrochemical applications and lithogenic sources [39]. Kanchpur was dominated by Cr, likely from tannery and metallurgical activities, while Sadipur and Nairadi showed weaker associations with heavy metals.
However, surface soils exhibited stronger site clustering, indicative of recent and ongoing deposition, whereas subsurface soils reflected more selective associations, suggesting element specific mobility and vertical migration that is supported by previous research [59]. The clustering of certain locations, such as Kachpur, Shiddirgong, and Majipara, in both surface and subsurface soil layers indicates consistent contamination patterns, potentially tied to local industrial and agricultural activities. Meanwhile, other regions, such as Sadipur and Sutiakhali, demonstrate more localized or homogenous patterns of contamination. Further research is needed to pinpoint the exact sources of these metals, especially in industrialized areas, and to understand their long-term effects on soil health and agricultural productivity.
3.3.2. Correlation Analysis
Pearson’s correlation matrix (Figure 5) revealed strong positive associations among several heavy metals, suggesting common anthropogenic sources or shared geochemical behaviors in homestead agricultural soils. Notably, Mn-Ni (r = 0.93, p < 0.001), Mn-Cu (r = 0.93, p < 0.001), and Co-Ni (r = 0.92, p < 0.001) exhibited highly significant correlations, indicating shared industrial or lithogenic origins and similar mobilization tendencies in soil environments [41,53]. Similarly, strong correlations between Cu-Ni (r = 0.81, p < 0.001) and Zn-Pb (r = 0.78, p < 0.01) suggest co-contamination likely originating from alloy production, galvanizing, and battery related industries [60]. In contrast, negative correlations were observed between Pb-pH (r = −0.64, p < 0.05) and As-pH (r = −0.49, p < 0.05), indicating enhanced solubility and mobility of these metals under acidic soil conditions [59]. Correlations that were statistically insignificant (p > 0.05) suggest heterogeneous contamination pathways involving mixed industrial, vehicular, and agrochemical sources. The correlation coefficient (r) ranges from −1 to +1, with 0 indicating no linear relationship between variables. The strength of correlation coefficients was interpreted based on standard statistical conventions, where r < 0.3 denotes a weak correlation, 0.3 ≤ r ≤ 0.7 denotes a moderate correlation, and r > 0.7 denotes a strong correlation [61]. These results underscore soil pH as a key regulator of the geochemical behavior of potentially toxic elements, particularly Pb and As, whose bioavailability tends to increase in low-pH environments [62].
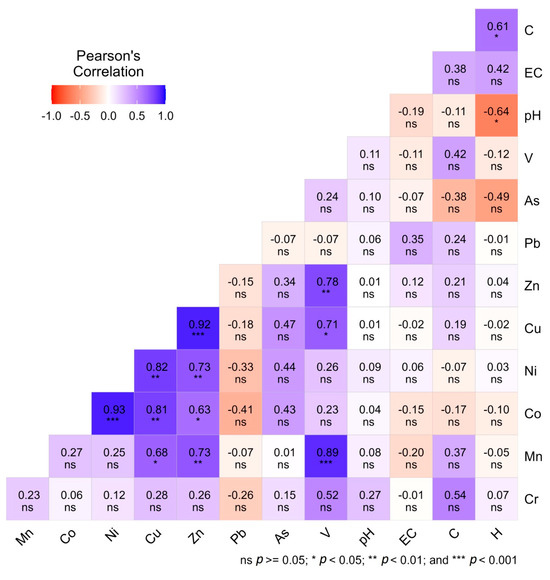
Figure 5.
Correlation matrix showing the relationships among different heavy metals in homestead agricultural soils.
Furthermore, non-significant correlations among certain metal pairs (p > 0.05) indicate diverse and heterogeneous contamination pathways, likely resulting from the combined influence of industrial discharges, vehicular emissions, and agrochemical inputs across different study sites. These weak or insignificant relationships suggest that not all metals share identical sources or geochemical behaviors, reflecting complex and overlapping contamination dynamics within homestead agricultural soils. However, the strong inter metal relationships further support the PCA findings, where site-specific clustering was primarily driven by metals with shared industrial sources. Therefore, the correlation analysis suggests that homestead soils in industrially influenced areas are simultaneously exposed to multiple heavy metals from common anthropogenic sources, while soil pH exerts a controlling role in their retention and mobility. These results are consistent with previous studies conducted in South and Southeast Asia, which have reported similar co-mobilization patterns in industrial and peri-urban agricultural landscapes [59].
3.3.3. Hierarchical Cluster Analysis (HCA)
The HCA dendrograms further clarified the interrelationships among heavy metals in surface and subsurface soils, corroborating the PCA and correlation findings (Figure 6). In surface soils, two major clusters were evident: Cluster-I grouped Zn, Cr, Cu, Ni, As, Co, V, and Pb, whereas Cluster-II was dominated solely by Mn (Figure 6A). The strong association of Zn, Cr, Cu, and Ni within Cluster-I suggests common contamination sources such as electroplating, galvanizing, and alloy related industries [63]. The separation of Mn into an independent cluster highlights its lithogenic dominance and weaker anthropogenic contribution compared to other metals [41].
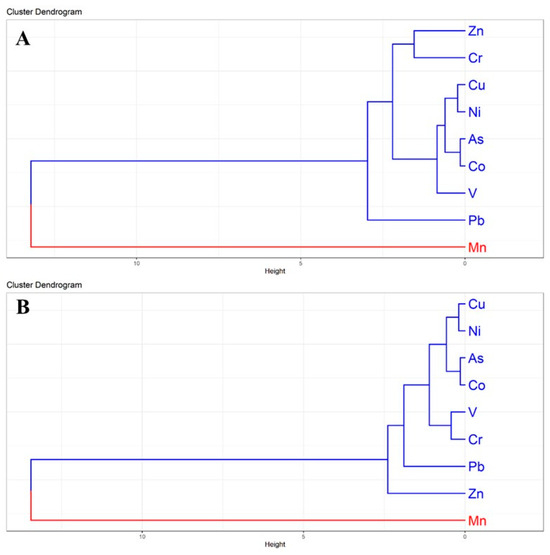
Figure 6.
Hierarchical Cluster Analysis (HCA) dendrogram illustrating the grouping and categorization of heavy metals in homestead agricultural soils: (A) surface soils (0–20 cm) and (B) subsurface soils (21–50 cm). Colors represent the major clusters.
In subsurface soils, a similar clustering trend was observed, where Cu, Ni, As, Co, V, Cr, Pb, and Zn formed a single large group, while Mn remained distinct (Figure 6B). The persistence of Mn as an isolated cluster across both depths underscores its geogenic origin and limited mobility. The tight association of Cu-Ni-As-Co suggests selective migration of these metals into deeper layers, likely due to their higher solubility and affinity for organic matter [53]. The persistence of Mn separation across soil depths reinforces its predominantly geogenic origin, whereas the grouping of Cu, Ni, As, and Pb underscores the strong influence of anthropogenic enrichment in industrial regions [64]. Similar clustering patterns have been reported in peri-urban agricultural soils across South Asia, where multi-metal contamination is driven by rapid industrialization and urban expansion [59]. These insights provide a comprehensive basis for assessing risks and formulating effective management strategies to address heavy metal contamination in the peri-urban agricultural soils of Bangladesh.
3.4. Pollution Assessment of Homestead Agricultural Soils
3.4.1. Contamination Factor of Heavy Metals
The contamination factor (CF) values across industrial and non-industrial sites provided insights into the degree of metal enrichment relative to background concentrations (Table 5). In most sites, Cr, Mn, Co, Ni, Cu, Zn, and V exhibited CF values ranging from 0.26 to 2.11, suggesting predominantly low to moderate contamination [42]. Notably, Zn showed moderate enrichment across several sites, with the highest CF (2.11) at Nairadi, reflecting contributions from galvanizing and metallurgical activities [53]. Similarly, Ni and Co recorded moderate contamination at Chorkhai (1.56 and 1.36, respectively), likely linked to alloy related industries and possible lithogenic inputs.
Table 5.
Contamination factor (CF) of heavy metals in different industrial and non-industrial areas.
As contamination was consistently high across all sites, with CF values ranging from 0.58 (Sreepur) to 3.79 (Chorkhai), placing most locations in the considerable contamination category. This pattern reflects extensive inputs from agrochemicals, industrial effluents, and atmospheric deposition [62]. The most alarming contamination was observed for Pb at Moistapara (9.43) and Majhipara (9.43), which fell into the very high contamination class, suggesting strong influence from battery recycling, vehicular emissions, and Pb-based industries [57]. Therefore, CF analysis demonstrates that while most heavy metals in homestead agricultural soils fall within low-to-moderate contamination ranges, As and Pb pose substantial ecological risks due to their consistently elevated enrichment across sites. These findings align with earlier studies in peri-urban soils of South Asia, where As contamination is largely linked to agricultural inputs and Pb hotspots arise from industrial activities and traffic related emissions [39,59].
3.4.2. Pollution Load Index
The Pollution Load Index (PLI) values varied notably across the study sites, ranging from 0.62 to 1.39, indicating both uncontaminated and polluted conditions (Figure 7). Industrial areas such as Nairadi and Gazipur Sadar exhibited PLI values above unity, suggesting substantial ecological risk and progressive soil quality deterioration, primarily due to emissions from tanneries, metal processing, and galvanizing industries [56]. Moderately elevated contaminations were observed in Majhipara, Sadipur, Moistapara, and Shiddirgonj, reflecting ongoing contamination pressures from peri-urban industrial activities. Interestingly, the non-industrial site Chorkhai also displayed a high PLI, likely due to diffuse pollution from agrochemicals or contaminated/wastewater irrigation and vehicle emission [55]. By contrast, Kanchpur, Monipur, and Boira showed relatively low PLI values, suggesting minimal contamination and safer conditions for agricultural use. However, the PLI assessment indicates that industrial activities are the primary drivers of heavy metal pollution in homestead agricultural soils, with several locations already surpassing the pollution threshold. The findings highlight the need for improved industrial waste management, regular soil quality monitoring, and targeted mitigation strategies to safe food supply and human health in industrial peri-urban communities [47].
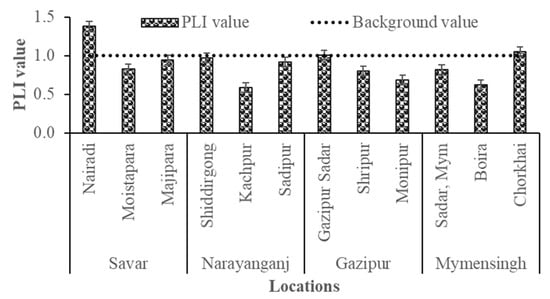
Figure 7.
Pollution Load Index (PLI) values of soil samples collected from industrial and non-industrial homestead agricultural areas in Bangladesh.
3.4.3. Ecological Risk Assessment of Heavy Metals in Homestead Agricultural Soils
The ecological risk (ER) assessment provides valuable insights into the relative contributions of individual heavy metals to potential ecological threats in homestead agricultural soils. As shown in Table 6, considerable variation was observed across both sites and metals, reflecting the combined influence of industrial activities, lithogenic background, and soil properties. As consistently emerged as the dominant contributor, with ER values ranging from 5.84 at Sreepur to 37.87 at Chorkhai (Mymensingh), a pattern consistent with reports linking industrial discharges and irrigation with As-contaminated groundwater to elevated soil As levels [50]. Pb also showed notable contributions, particularly at Majhipara (47.13), likely from battery recycling and informal metal industries [65]. Ni and Cu presented moderate risks, with elevated levels at Chorkhai and Nairadi, attributable to textile dyeing, leather processing, and agrochemical inputs [66]. Zn contributed moderately (2.12–10.53), reflecting both natural and anthropogenic sources. In contrast, Cr, Mn, Co, and V exhibited relatively low ER values (<3), indicating limited ecological threat. According to Hakanson’s classification, both As and Pb exceeded the thresholds for considerable to very high ecological risk at multiple sites, confirming their dominance as critical ecological stressors in Bangladeshi soils [43,50,58]. Accordingly, ER analysis identified As and Pb as the most critical contributors to ecological risk, followed by Zn and Ni, while Cu posed moderate risks. In contrast, Cr, Mn, Co, and V contributed negligible risk levels. Spatially, industrial sites such as Savar, Narayanganj, and Gazipur exhibited higher cumulative ER values than the non-industrial site in Mymensingh, reaffirming the dominant influence of industrial activities as major sources of contamination.
Table 6.
Ecological Risk (ER) of individual metals in homestead agricultural soils.
3.5. Health Risk Assessment
To evaluate potential health risks associated with heavy metal contamination in homestead agricultural soils, the Average Daily Dose (ADD) for both children and adults was calculated through three primary exposure pathways: ingestion, inhalation, and dermal contact. Since several input parameters (e.g., soil ingestion rates for Bangladeshi children, exposure frequency, and body weight) carry inherent uncertainty and natural variability, a probabilistic risk assessment such as a Monte Carlo simulation could be incorporated in future studies to better capture parameter variability and source specific risk estimates [67,68].
3.5.1. ADD of HMs in Homestead Agricultural Soils
The estimated ADD values via ingestion, inhalation, and dermal pathways (Table 7) identified ingestion as the dominant exposure route for both children and adults, consistent with previous studies [47]. Children consistently showed higher ADD values, underscoring their vulnerability due to higher soil intake per body weight. Mn exhibited the highest ingestion ADDs, particularly in Mymensingh (5.1 × 10⁻² mg/kg/day for children), while Cr and Ni were elevated in Narayanganj and Mymensingh, likely linked to dyeing industries and pesticide use. Pb ingestion was highest in Savar (4.9 × 10⁻⁵ mg/kg/day), reflecting inputs from battery recycling and vehicular emissions, whereas As exposure peaked in Mymensingh (9.8 × 10⁻⁵ mg/kg/day), consistent with groundwater irrigation practices [39]. Inhalation and dermal pathways contributed minimally, though chronic dermal absorption of As and Pb remains a concern due to their carcinogenicity. The overall exposure hierarchy was ingestion > dermal > inhalation.
Table 7.
ADD (mg/kg/day) of HMs via ingestion, inhalation, and dermal pathways.
3.5.2. Lifetime Average Daily Dose
The estimated lifetime average daily dose (LADD) of heavy metals (Table 8) showed that ingestion was the primary exposure pathway, followed by inhalation and dermal absorption, aligning with previous findings that oral uptake is the dominant route in contaminated soils [69]. Among the metals, Mn had the highest ingestion dose (3.5 × 10⁻⁴–1.1 × 10⁻³ mg/kg/day), particularly in Savar, reflecting both natural abundance and industrial inputs, while Zn also showed high ingestion levels (9.3 × 10⁻⁵–2.1 × 10⁻⁴ mg/kg/day) in Savar and Gazipur, likely linked to galvanizing and agrochemical activities. Moderate ingestion doses were observed for Cu and Cr, with industrial hotspots such as Savar and Gazipur showing elevated levels, whereas Pb, though lower in ingestion values, posed significant concern due to its toxicity and was highest in Savar. As displayed notable spatial variation, with Mymensingh Sadar recording an unusually high ingestion dose (1.3 × 10⁻⁴ mg/kg/day), suggesting lithological or agricultural influences [39]. Inhalation exposures were generally an order of magnitude lower, with Mn again being the highest contributor, while dermal absorption remained negligible. However, Mn, Zn, and As were the most critical contributors to human exposure, with industrial zones such as Savar and Gazipur showing the greatest vulnerability. These results confirm that ingestion remains the dominant risk pathway in agricultural soils and highlight the need for targeted monitoring and dietary risk management in industrially impacted areas [70].
Table 8.
Estimated LADD (mg/kg/day) of HMs through ingestion, inhalation, and dermal pathways.
3.5.3. Non-Carcinogenic Health Risk of HMs in Homestead Agricultural Soils
The hazard quotient (HQ) and Hazard Index (HI) values were calculated for both children and adults to assess the non-carcinogenic health risks associated with exposure to heavy metals (Cr, Pb, Ni, Mn, Co, Cu, Zn, As, and V) in the four study areas.
Hazard Quotient for HMs in Homestead Agricultural Soils
The non-carcinogenic risk assessment based on Hazard Quotient (HQ) values indicated substantial variations across metals, exposure pathways, and study sites, with ingestion being the dominant pathway compared to inhalation and dermal routes, consistent with earlier findings that oral uptake of heavy metals is the primary route of human exposure from contaminated soils [71]. Among the studied metals, Cr posed significant concern in Mymensingh, where the ingestion HQ for children exceeded the safety threshold (HQ > 1), suggesting considerable non-carcinogenic risk, while other sites showed moderate levels (Table 9). As also emerged as a critical contaminant, with ingestion HQ values above unity in Savar, Gazipur, and Mymensingh, reflecting both geogenic and anthropogenic contributions [57]. Pb values, although below unity, were notable in industrial belts such as Savar and Narayanganj, underscoring the persistent risk of Pb toxicity even at low concentrations [72]. Mn, Co, and Ni presented site specific variations, with elevated ingestion HQs in Gazipur and Mymensingh, suggesting emerging risks from long-term dietary exposure, while Cu and Zn remained within safe limits though still warranting attention due to potential accumulation [53]. V showed relatively higher HQ values in Savar and Gazipur, pointing to localized industrial inputs. However, children were found to be more vulnerable than adults, and hotspots such as Savar, Gazipur, and Mymensingh showed the greatest potential health risks, particularly from Cr and As exposure, corroborating previous reports on elevated health hazards linked to heavy metals in South Asian agricultural soils [50,73].
Table 9.
Hazard Quotient (HQ) and non-carcinogenic risk assessment of HMs through ingestion, inhalation and dermal for children and adults.
Hazard Index for HMs in Homestead Agricultural Soils
The Hazard Index (HI), which represents the cumulative non-carcinogenic risk from multiple heavy metals, showed clear site and age dependent variations, with children consistently exhibiting higher values than adults due to their greater susceptibility and intake rates [71]. Among the study areas, Mymensingh recorded the highest HI values, particularly for Cr (1.61), Cu (0.66), and As (0.33), indicating a significant risk level (HI > 1) for children, while adults in the same area also approached concerning thresholds (Table 10). In contrast, Savar and Gazipur showed moderate HI contributions, primarily from As (0.30 in Savar; 0.20 in Gazipur) and V (0.06 in Savar; 0.04 in Gazipur), reflecting both industrial emissions and geogenic influences [56,57]. Narayanganj, by comparison, displayed generally lower HI values, though Pb (0.04 for adults) and As (0.03 for adults) still suggest a potential health burden. Therefore, As and Cr were the dominant contributors across sites, consistent with their high toxicity and prevalence in South Asian soils [73]. The results revealed that children in Mymensingh, Savar, and Gazipur as the most vulnerable population groups, with cumulative exposure risks exceeding safe thresholds, underscoring the urgent need for soil monitoring, remediation strategies, and dietary risk management in homestead agricultural systems.
Table 10.
Hazard Index (HI) for HMs in homestead agricultural soils.
3.5.4. Carcinogenic Risk Assessment
The carcinogenic risk (CR) assessment of heavy metals via ingestion and inhalation pathways revealed that As and Cr were the primary contributors to potential cancer risks in the studied soils (Table 11). As ingestion values ranged from 1.7 × 10⁻⁴ in Narayanganj to 4.1 × 10⁻⁴ in Mymensingh, all of which exceeded the USEPA’s acceptable risk range of 1 × 10⁻⁶ to 1 × 10⁻⁴, suggesting considerable long-term carcinogenic risk for exposed populations [71]. Cr also showed elevated inhalation related risks, particularly in Narayanganj (1.4 × 10⁻⁴) and Savar (1.3 × 10⁻⁴), both above the threshold, indicating occupational and environmental exposure concerns associated with industrial emissions. In contrast, Co, Ni, and Pb showed comparatively lower carcinogenic risks, suggesting limited but non-negligible contributions to overall cancer risk. Spatially, Mymensingh demonstrated its highest As ingestion risk, while Narayanganj and Savar were hotspots for Cr inhalation risk, highlighting the influence of both geogenic As and industrial Cr contamination. These findings align with earlier studies emphasizing the persistent cancer risk from As and Cr in agricultural soils across South Asia [74,75]. Therefore, the results indicate that long-term exposure to As and Cr in homestead agricultural soils poses a substantial carcinogenic health threat, particularly for children and residents in heavy metals contaminated areas, Bangladesh.
Table 11.
Carcinogenic risk of HMs for children and adults through ingestion and inhalation.
3.5.5. Cumulative Cancer Risk Assessment
The cumulative carcinogenic risk (CCR) assessment across sites displayed As and Cr as the dominant contributors to cancer risk in homestead agricultural soils (Table 12). As recorded the highest CCR values, ranging from 1.8 × 10⁻⁴ in Narayanganj to 4.1 × 10⁻⁴ in Mymensingh, all of which exceeded the USEPA’s acceptable risk threshold of 1 × 10⁻⁴, indicating a serious long term carcinogenic threat for local populations [71]. Cr followed closely, with CCR values between 9.6 × 10⁻⁵ and 1.4 × 10⁻⁴, marginally above or near the threshold, reflecting the strong influence of industrial activities in Savar and Narayanganj. Other metals, including Co, Ni, and Pb, exhibited CCR values within the acceptable range (10−6–10−5), suggesting comparatively minor contributions to total cancer risk. In contrast, Mymensingh presented the highest cumulative risk, primarily driven by elevated As, while Savar and Narayanganj were notable for higher Cr contributions. These findings corroborate earlier studies that identified As and Cr as priority carcinogens in South Asian agricultural soils due to both geogenic sources and anthropogenic pollution [76,77]. However, the CCR analysis confirms that As and Cr contamination poses significant cumulative cancer risks, necessitating continuous monitoring and targeted remediation strategies in vulnerable regions.
Table 12.
CCR of heavy metal in homestead agricultural soil of different areas.
However, Co, Ni, and Pb contributed only minor proportions to the overall CCR, with values ranging from 1.1 × 10⁻⁶ to 7.1 × 10⁻⁶, 1.4 × 10⁻⁶ to 1.6 × 10⁻⁶, and 8.9 × 10⁻⁸ to 6.9 × 10⁻⁷, respectively. These results indicate that their individual carcinogenic risks are minimal in the studied areas. Therefore, the CCR findings clearly show that the potential lifetime carcinogenic risk in homestead soils is predominantly driven by As, followed by Cr, while contributions from other metals remain negligible. This underscores the need for targeted risk mitigation and continuous monitoring, particularly in Mymensingh and Savar, to safeguard human health and reduce long term exposure through soil-based pathways. Moreover, several highly toxic and persistent heavy metals could not be analyzed in this study due to their low concentrations or methodological limitations. Further research is required to accurately identify the sources of these contaminants particularly in industrialized regions and to better understand their long-term impacts on soil health and agricultural productivity.
4. Conclusions
This study investigated the distribution of heavy metal contamination, pollution sources, ecological risks, and human health risks in homestead agricultural soils across industrial and non-industrial regions of Bangladesh. Nine heavy metals, namely Cr, Mn, Co, Ni, Cu, Zn, As, Pb, and V, were detected at varying concentrations. Industrial areas exhibited substantial enrichment of Cr, Ni, Cu, Zn, and Pb, whereas As contamination was more widespread in non-industrial regions. Higher As concentrations in surface soils compared to subsurface layers suggest ongoing inputs from industrial effluents, atmospheric deposition, agrochemical use, and wastewater irrigation.
Multivariate analyses revealed mixed contamination sources with clear site-specific variations, reflecting the influence of local anthropogenic activities on metal distribution. Ecological risk assessment identified As and Pb as the dominant contributors to ecological stress. Human health risk analysis further indicated that children are the most vulnerable population group, with ingestion identified as the primary exposure pathway, signaling potential health threats but the assessment of human health risks via consumption of crops grown in contaminated soil was not conducted in this study. Moreover, CCR results confirmed that As is the major driver of lifetime carcinogenic risk in homestead soils, followed by Cr, while contributions from other metals remain minimal.
Despite some limitations in conducting the study, such as the lack of evaluation of mitigation measures, the findings underscore the urgent need for site-specific monitoring, awareness-building initiatives, improved industrial waste management, and targeted mitigation strategies particularly the promotion of integrated pest management to safeguard food security and public health in studied areas of Bangladesh.
Author Contributions
Conceptualization, methodology, formal analysis, wrote first draft of the manuscript, A.S.; supervision, investigation, funding acquisition, review and editing, Q.W.; supervision, review and editing, M.S.; methodology, data curation, C.E.E.; writing—review and editing, M.S.R.; formal analysis, resources, Y.I.; supervision, review and editing; W.W. All authors have read and agreed to the published version of the manuscript.
Funding
This study was partially supported by the Basic Research (Category B) (No. 25K03267, FY2025-FY2029 and No. 22H03747, FY2022–FY2024) of Grant-in-Aid for Scientific Research of the Japanese Ministry of Education, Culture, Sports, Science, and Technology (MEXT).
Institutional Review Board Statement
Not applicable.
Informed Consent Statement
Not applicable.
Data Availability Statement
All data generated or analyzed during this study are included in the published article. Further information and materials are available from the corresponding author upon reasonable request.
Acknowledgments
The authors gratefully acknowledge the Center for Environmental Science in Saitama, Japan, for conducting the toxic metals analyses. Special thanks are extended to Babul Akter, Bangladesh Institute of Nuclear Agriculture (BINA), Mymensingh-2202, Bangladesh, for his valuable support in soil sample collection.
Conflicts of Interest
The authors declare no conflicts of interest.
References
- Shrestha, S.; Maraseni, T.; Apan, A. Enhancing Food Security through Home Gardening: A Case Study in Phoukhoud District, Lao PDR. Agriculture 2025, 15, 716. [Google Scholar] [CrossRef]
- Baliki, G.; Weiffen, D.; Moiles, G.; Brück, T. Home Garden Interventions in Crisis and Emergency Settings. Front. Sustain. Food Syst. 2023, 7, 1138558. [Google Scholar] [CrossRef]
- Shupler, M.; Mwitari, J.; Gohole, A.; de Cuevas, R.A.; Puzzolo, E.; Čukić, I.; Pope, D. COVID-19 Impacts on Household Energy and Food Security in a Kenyan Informal Settlement: The Need for Integrated Approaches to the SDGs. Renew. Sustain. Energy Rev. 2021, 144, 111018. [Google Scholar] [CrossRef] [PubMed]
- FAO. Global Report on Food Crises; Food and Agriculture Organization of the United Nations: Rome, Italy, 2025. [Google Scholar]
- Torquebiau, E. Are Tropical Agroforestry Home Gardens Sustainable? Agric. Ecosyst. Environ. 1992, 41, 189–207. [Google Scholar] [CrossRef]
- Ghosh, S.; Sen, L.C.; Mali, S.K.; Islam, M.M.; Bakchi, J. The Role of Rural Women in Household Food Security and Nutrition Management in Bangladesh. Asian J. Women’s Stud. 2021, 27, 441–459. [Google Scholar] [CrossRef]
- Alharbi, B.H.; Pasha, M.J.; Al-Shamsi, M.A.S. Influence of different urban structures on metal contamination in two metropolitan cities. Sci. Rep. 2019, 9, 4920. [Google Scholar] [CrossRef]
- Rana, M.S.; Wang, Q.; Wang, W.; Enyoh, C.E.; Islam, M.R.; Isobe, Y.; Kabir, M.H. Sources, Distribution, and Health Implications of Heavy Metals in Street Dust across Industrial, Capital City, and Peri-Urban Areas of Bangladesh. Atmosphere 2024, 15, 1088. [Google Scholar] [CrossRef]
- Hossain, M.K.; Ahmed, S.R.; Chowdhury, M.A.I. Heavy Metal Contamination in Agricultural Soils and Vegetables around Industrial Areas of Dhaka, Bangladesh. Environ. Sci. Pollut. Res. 2020, 27, 16143–16155. [Google Scholar] [CrossRef]
- Dagdag, O.; Quadri, T.W.; Haldhar, R.; Kim, S.C.; Daoudi, W.; Berdimurodov, E.; Akpan, E.D.; Ebenso, E.E. An Overview of Heavy Metal Pollution and Control. In Heavy Metals in the Environment: Management Strategies for Global Pollution; ACS: Washington, DC, USA, 2023; pp. 3–24. [Google Scholar] [CrossRef]
- Seo, Y.; Zhou, Z.; Lai, Y.; Chen, G.; Pembleton, K.; Wang, S.; He, J.Z.; Song, P. Micro- and Nanoplastics in Agricultural Soils: Assessing Impacts and Navigating Mitigation. Sci. Total Environ. 2024, 931, 172951. [Google Scholar] [CrossRef]
- Deng, W.; Li, F.; Chen, X.; Guo, J.; Gao, C.; Zhao, J.; Sun, T.; Zhang, J. Unraveling Co-Contamination Characteristics of Heavy Metals in the Soil–Crop System and Collaborative Management of Their Health Risk across China. Hyg. Environ. Health Adv. 2025, 16, 100151. [Google Scholar] [CrossRef]
- Briffa, J.; Sinagra, E.; Blundell, R. Heavy Metal Pollution in the Environment and Their Toxicological Effects on Humans. Heliyon 2020, 6, e04691. [Google Scholar] [CrossRef]
- Yu, X.; Feng, W.; Song, F.; Han, Y.; Miao, Q.; Gonçalves, J.M. Characterisation of Heavy Metals and Microbial Communities in Urban River Sediments: Interactions and Pollution Origin Analysis. Environ. Res. 2025, 242, 121925. [Google Scholar] [CrossRef] [PubMed]
- Speer, R.M.; Zhou, X.; Volk, L.B.; Liu, K.J.; Hudson, L.G. Arsenic and Cancer: Evidence and Mechanisms. Adv. Pharmacol. 2023, 96, 151–202. [Google Scholar] [CrossRef]
- Yunus, F.M.; Khan, S.; Chowdhury, P.; Milton, A.H.; Hussain, S.; Rahman, M. A Review of Groundwater Arsenic Contamination in Bangladesh: The Millennium Development Goal Era and Beyond. Int. J. Environ. Res. Public Health 2016, 13, 215. [Google Scholar] [CrossRef] [PubMed]
- Ortega, D.R.; Esquivel, D.F.G.; Ayala, T.B.; Pineda, B.; Manzo, S.G.; Quino, J.M.; de la Cruz, V.P. Cognitive Impairment Induced by Lead Exposure during Lifespan: Mechanisms of Lead Neurotoxicity. Toxics 2021, 9, 23. [Google Scholar] [CrossRef]
- Balali-Mood, M.; Naseri, K.; Tahergorabi, Z.; Khazdair, M.R.; Sadeghi, M. Toxic Mechanisms of Five Heavy Metals: Mercury, Lead, Chromium, Cadmium, and Arsenic. Front. Pharmacol. 2021, 12, 643972. [Google Scholar] [CrossRef]
- Fontana, S.; Wahsha, M.; Bini, C. Preliminary Observations on Heavy Metal Contamination in Soils and Plants of an Abandoned Mine in Imperina Valley (Italy). Agrochimica 2010, 54, 218–231. [Google Scholar]
- Zhongqi, H.; Johnson, S.; Spada, A. Soil Contamination and Remediation in Urban Gardens in New York City. Environ. Pollut. 2015, 206, 24–31. [Google Scholar] [CrossRef]
- Wang, C.C.; Zhang, Q.C.; Yan, C.A.; Tang, G.Y.; Zhang, M.Y.; Ma, L.Q.; Gu, R.H.; Xiang, P. Heavy Metal(loid)s in Agricultural Soils, Rice, and Wheat across China: Status Assessment and Spatiotemporal Analysis. Sci. Total Environ. 2023, 882, 163361. [Google Scholar] [CrossRef]
- Puntarić, D.; Vidosavljević, D.; Gvozdić, V.; Puntarić, E.; Puntarić, I.; Mayer, D.; Krivdić, I. Heavy Metals and Metalloid Content in Vegetables and Soil Collected from the Gardens of Zagreb, Croatia. Coll. Antropol. 2013, 37, 957–964. [Google Scholar]
- Bvenura, C.; Afolayan, A.J. Heavy Metal Contamination of Vegetables Cultivated in Home Gardens in the Eastern Cape. S. Afr. J. Sci. 2012, 108, 1−6. [Google Scholar] [CrossRef]
- Zeb, M.; Khan, K.; Younas, M.; Farooqi, A.; Cao, X.; Kavil, Y.N.; Alelyani, S.S.; Alkasbi, M.M.; Al-Sehemi, A.G. A review of heavy metals pollution in riverine sediment from various Asian and European countries: Distribution, sources, and environmental risk. Mar. Pollut. Bull. 2024, 206, 116775. [Google Scholar] [CrossRef] [PubMed]
- López, M.I.; Biswas, J.K. Heavy Metal Contamination in Homestead Garden Soils and Implications for Food Safety in South Asia. Environ. Pollut. Health 2021, 36, 151–163. [Google Scholar]
- Rasmussen, K.H.; Setiawati, M.D.; Gomes, K. Water vulnerability in Dhaka, Narayanganj, and Gazipur districts of Bangladesh: The role of textile dye production. Water 2025, 17, 2475. [Google Scholar] [CrossRef]
- Enyoh, C.E.; Verla, A.W.; Verla, E.N. Heavy Metals Contamination of Topsoil and Dispersion in Roadside Soil from Automobile Workshops in Owerri, Southeastern Nigeria. Environ. Anal. Health Toxicol. 2020, 35, e2020002. [Google Scholar] [CrossRef]
- Shahamat, Y.D.; Rokni, H.R.; Bakhshi, K.; Faraji, H. Assessment of Heavy Metal Contamination of Water, Soil and Cultivated Vegetables in the Juybar Landfill Area (North-Eastern Iran). Food Chem. Adv. 2025, 6, 100892. [Google Scholar] [CrossRef]
- Ding, A.; Li, M.; Liu, C.; Zhang, X.; Lei, L.; Xiao, C. Salt aqua regia as a green solvent for recovering precious metals. Cell Rep. Phys. Sci. 2022, 3, 101159. [Google Scholar] [CrossRef]
- Rabin, M.H.; Wang, Q.; Kabir, M.H.; Wang, W. Pollution characteristics and risk assessment of potentially toxic elements of fine street dust during COVID-19 lockdown in Bangladesh. Environ. Sci. Pollut. Res. 2023, 30, 4323–4345. [Google Scholar] [CrossRef]
- Edo, G.I.; Samuel, P.O.; Oloni, G.O.; Ezekiel, G.O.; Ikpekoro, V.O.; Obasohan, P.; Ongulu, J.; Otunuya, C.F.; Opiti, A.R.; Ajakaye, R.S.; et al. Environmental persistence, bioaccumulation, and ecotoxicology of heavy metals. Chem. Ecol. 2024, 40, 322–349. [Google Scholar] [CrossRef]
- Jiang, Y.; Ma, J.; Wang, Y.; Yang, Y. Background values of soil heavy metals in the Huang-Huai-Hai Plain in Henan Province, China. Toxics 2025, 13, 93. [Google Scholar] [CrossRef]
- Li, X.; Poon, C.S.; Liu, P.S. Heavy metal pollution of urban soils and street dusts in Hong Kong. Appl. Geochem. 2001, 16, 1361–1368. [Google Scholar] [CrossRef]
- Ali, M.U.; Liu, G.; Yousaf, B.; Abbas, Q.; Ullah, H.; Munir, M.A.; Fu, B. Pollution characteristics and human health risks of potentially (eco) toxic elements (PTEs) in suspended street dust from metropolitan area of Hefei, China. Chemosphere 2017, 181, 111–121. [Google Scholar] [CrossRef]
- Zheng, N.; Liu, J.; Wang, Q.; Liang, Z. Health risk assessment of heavy metal exposure to street dust in the zinc smelting district, northeast of China. Sci. Total Environ. 2010, 408, 726–733. [Google Scholar] [CrossRef]
- Office of Emergency and Remedial Response, United States Environmental Protection Agency. Risk Assessment Guidance for Superfund; Office of Emergency and Remedial Response, US Environmental Protection Agency: Washington, DC, USA, 1989. [Google Scholar]
- Mohmand, J.; Eqani, S.A.; Fasola, M.; Alamdar, A.; Mustafa, I.; Ali, N.; Liu, L.; Peng, S.; Shen, H. Human exposure to toxic metals via contaminated dust: Bio-accumulation trends and their potential risk estimation. Chemosphere 2015, 132, 142–151. [Google Scholar] [CrossRef]
- Kurt-Karakus, P.B. Determination of heavy metals in indoor dust from Istanbul, Turkey: Estimation of the health risk. Environ. Int. 2012, 50, 55. [Google Scholar] [CrossRef] [PubMed]
- Rokonuzzaman, M.; Ye, Z.; Wu, C.; Li, W.C. Arsenic elevated groundwater irrigation: Farmers’ perception of rice and vegetable contamination in a naturally arsenic endemic area. Int. J. Environ. Res. Public Health 2023, 20, 4989. [Google Scholar] [CrossRef] [PubMed]
- Elgammal, S.M.; Khorshed, M.A.; Ismail, E.H. Determination of heavy metal content in whey protein samples from marketsin Giza, Egypt, using inductively coupled plasma optical emission spectrometry and graphite furnace atomic absorptionspectrometry: A probabilistic risk assessment study. J. Food Compos. Anal. 2019, 84, 103300. [Google Scholar] [CrossRef]
- Kabata-Pendias, A. Trace Elements in Soils and Plants, 4th ed.; CRC Press: Boca Raton, FL, USA; Taylor and Francis Group, LLC: New York, NY, USA, 2011. [Google Scholar] [CrossRef]
- Hakanson, L. An Ecological Risk Index for Aquatic Pollution Control. A Sedimentological Approach. Water Res. 1980, 14, 975–1001. [Google Scholar] [CrossRef]
- Saha, A.; Gupta, B.S.; Patidar, S.; Martínez-Villegas, N. Evaluation of Potential Ecological Risk Index of Toxic Metals Contamination in the Soils. Chem. Proc. 2022, 10, 59. [Google Scholar] [CrossRef]
- Khatoon, N.; Ali, S.; Hussain, A.; Huang, J.; Yu, Z.; Liu, H. Evaluating the Carcinogenic and Non-Carcinogenic Health Risks of Heavy Metals Contamination in Drinking Water, Vegetables, and Soil from Gilgit-Baltistan, Pakistan. Toxics 2024, 13, 5. [Google Scholar] [CrossRef]
- Han, Q.; Wang, M.; Cao, J.; Gui, C.; Liu, Y.; He, X.; He, Y.; Liu, Y. Health Risk Assessment and Bioaccessibilities of Heavy Metals for Children in Soil and Dust from Urban Parks and Schools of Jiaozuo, China. Ecotoxicol. Environ. Saf. 2020, 191, 110157. [Google Scholar] [CrossRef] [PubMed]
- Pan, L.; Wang, Y.; Ma, J.; Hu, Y.; Su, B.; Fang, G.; Xiang, B. A Review of Heavy Metal Pollution Levels and Health Risk Assessment of Urban Soils in Chinese Cities. Environ. Sci. Pollut. Res. 2018, 25, 1055–1069. [Google Scholar] [CrossRef] [PubMed]
- Sharmin, S.; Wang, Q.; Islam, M.R.; Isobe, Y.; Enyoh, C.E.; Shangrong, W. Unveiling Heavy Metal Distribution in Different Agricultural Soils and Associated Health Risks Among Farming Communities of Bangladesh. Environments 2025, 12, 198. [Google Scholar] [CrossRef]
- Bhuyan, M.S.; Bakar, M.A.; Akhtar, A.; Hossain, M.B.; Ali, M.M.; Islam, M.S. Heavy metal contamination in surface water and sediment of the Meghna River, Bangladesh. Environ. Nanotechnol. Monit. Manag. 2017, 8, 273–279. [Google Scholar] [CrossRef]
- Yan, X.; Chen, X.; Zheng, W.; Zhang, G.; Dong, A. Heavy metals in the sediments of Dongshan Bay, China: Sources, distribution, and controlling factors. Water 2024, 16, 905. [Google Scholar] [CrossRef]
- Islam, M.A.; Das, B.; Quraishi, S.B.; Khan, R.; Naher, K.; Hossain, S.M.; Karmaker, S.; Latif, S.A.; Hossen, M.B. Heavy metal contamination in industrial areas of Bangladesh: Sources and ecological risk assessment. Environ. Nanotechnol. Monit. Manag. 2020, 14, 100345. [Google Scholar] [CrossRef]
- Ayaz, H.; Nawaz, R.; Nasim, I.; Irshad, M.A.; Irfan, A.; Khurshid, I.; Okla, M.K.; Wondmie, G.F.; Ahmed, Z.; Bourhia, M. Comprehensive Human Health Risk Assessment of Heavy Metal Contamination in Urban Soils: Insights from Selected Metropolitan Zones. Front. Environ. Sci. 2023, 11, 1260317. [Google Scholar] [CrossRef]
- He, S.; Li, Y.; Tang, L.; Yang, F.; Xie, Y.; Liu, X.; Xu, L. Migration and accumulation mechanisms of heavy metals in soil from Maoniuping rare earth elements mining, Southwest China. Land 2025, 14, 611. [Google Scholar] [CrossRef]
- Alloway, B.J. Heavy Metals in Soils: Trace Metals and Metalloids in Soils and Their Bioavailability; Springer: Dordrecht, The Netherlands, 2013. [Google Scholar] [CrossRef]
- Fan, Y.; Chen, X.; Chen, Z.; Zhou, X.; Lu, X.; Liu, J. Pollution characteristics and source analysis of heavy metals in surface sediments of Luoyuan Bay, Fujian. Environ. Res. 2022, 203, 111911. [Google Scholar] [CrossRef]
- Islam, M.S.; Ahmed, M.K.; Habibullah-Al-Mamun, M.; Eaton, D.W. Arsenic in the food chain and assessment of population health risks in Bangladesh. Environ. Syst. Decis. 2017, 37, 344–352. [Google Scholar] [CrossRef]
- Mizan, A.; Mamun, M.A.; Islam, M.S. Metal contamination in soil and vegetables around Savar tannery area, Dhaka, Bangladesh: A preliminary study for risk assessment. Heliyon 2023, 9, e13856. [Google Scholar] [CrossRef]
- Ali, H.; Khan, E.; Ilahi, I. Environmental chemistry and ecotoxicology of hazardous heavy metals: Environmental persistence, toxicity, and bioaccumulation. J. Chem. 2019, 2019, 6730305. [Google Scholar] [CrossRef]
- Hassan, M.N.; Reza, A.S.; Rasel, M.I.; Mahim, M.M.; Jannat, M.F. Pollution and health risk assessment of heavy metals in surface water of the industrial region in Gazipur, Bangladesh. Environ. Chem. Ecotoxicol. 2025, 7, 527–538. [Google Scholar] [CrossRef]
- Shahid, M.; Dumat, C.; Khalid, S.; Schreck, E.; Xiong, T.; Niazi, N.K. Foliar heavy metal uptake, toxicity and detoxification in plants: A comparison of foliar and root metal uptake. J. Hazard. Mater. 2017, 325, 36–58. [Google Scholar] [CrossRef]
- Xu, S.; Li, C.; Wang, Y.; Wu, A.; Gao, G.; Zang, F. Characteristics and evaluation of heavy metal pollution in a soil–wheat system of an arid oasis city in northwest China. Ecotoxicol. Environ. Saf. 2024, 271, 115958. [Google Scholar] [CrossRef]
- Ratner, B. The correlation coefficient: Its values range between +1/−1, or do they? J. Target. Meas. Anal. Mark. 2009, 17, 139–142. [Google Scholar] [CrossRef]
- Alengebawy, A.; Abdelkhalek, S.T.; Qureshi, S.R.; Wang, M.Q. Heavy metals and pesticides toxicity in agricultural soil and plants: Ecological risks and human health implications. Toxics 2021, 9, 42. [Google Scholar] [CrossRef]
- Angon, P.B.; Islam, M.S.; Das, A.; Anjum, N.; Poudel, A.; Suchi, S.A. Sources, effects and present perspectives of heavy metals contamination: Soil, plants and human food chain. Heliyon 2024, 10, e28357. [Google Scholar] [CrossRef] [PubMed]
- Saha, N.; Rahman, M.S. Multivariate statistical analysis of metal contamination in surface water around Dhaka export processing industrial zone, Bangladesh. Environ. Nanotechnol. Monit. Manag. 2018, 10, 206–211. [Google Scholar] [CrossRef]
- Zhao, G.; Ma, Y.; Liu, Y.; Cheng, J.; Wang, X. Source analysis and ecological risk assessment of heavy metals in farmland soils around heavy metal industry in Anxin County. Sci. Rep. 2022, 12, 10562. [Google Scholar] [CrossRef] [PubMed]
- Noor, A.E.; Fatima, R.; Aslam, S.; Hussain, A.; un Nisa, Z.; Khan, M.; Mohammed, A.A.; Sillanpaa, M. Health risks assessment and source admeasurement of potentially dangerous heavy metals (Cu, Fe, and Ni) in rapidly growing urban settlement. Environ. Res. 2024, 242, 117736. [Google Scholar] [CrossRef] [PubMed]
- Miletić, A.; Vesković, J.; Lučić, M.; Onjia, A. Monte Carlo simulation of source-specific risks of soil at an abandoned lead-acid battery recycling site. Stoch. Environ. Res. Risk Assess. 2024, 38, 3313–3329. [Google Scholar] [CrossRef]
- Vesković, J.; Bulatović, S.; Miletić, A.; Tadić, T.; Marković, B.; Nastasović, A.; Onjia, A. Source-specific probabilistic health risk assessment of potentially toxic elements in groundwater of a copper mining and smelter area. Stoch. Environ. Res. Risk Assess. 2024, 38, 1597–1612. [Google Scholar] [CrossRef]
- USEPA. Guidelines for Carcinogen Risk Assessment; US Environmental Protection Agency: Washington, DC, USA, 2005. [Google Scholar]
- Mohammed, A.M.; Saleh, I.A.; Zahran, H.R.; Abdel-Latif, N.M. Ecological and risk assessment of heavy metals in a diverse industrial area of Al-Akrasha, Egypt. Atmosphere 2023, 14, 1745. [Google Scholar] [CrossRef]
- USEPA (United States Environmental Protection Agency). Integrated Risk Information System (IRIS) on Carcinogenicity. 2011. Available online: https://www.epa.gov/iris (accessed on 16 November 2025).
- Collin, M.S.; Venkatraman, S.K.; Vijayakumar, N.; Kanimozhi, V.; Arbaaz, S.M.; Stacey, R.S.; Anusha, J.; Choudhary, R.; Lvov, V.; Tovar, G.I.; et al. Bioaccumulation of lead (Pb) and its effects on humans: A review. J. Hazard. Mater. Adv. 2022, 7, 100094. [Google Scholar] [CrossRef]
- Shin, D.Y.; Lee, S.M.; Jang, Y.; Lee, J.; Lee, C.M.; Cho, E.M.; Seo, Y.R. Adverse human health effects of chromium by exposure route: A comprehensive review based on toxicogenomic approach. Int. J. Mol. Sci. 2023, 24, 3410. [Google Scholar] [CrossRef] [PubMed]
- Chen, H.; Teng, Y.; Lu, S.; Wang, Y.; Wang, J. Contamination features and health risk of soil heavy metals in China. Sci. Total Environ. 2015, 512, 143–153. [Google Scholar] [CrossRef]
- Hou, D.; Xie, H.; Yang, L. Risk-targets identification and source apportionment associated with heavy metals for different agricultural soils in Sunan Economic Region, China. Land 2025, 14, 1058. [Google Scholar] [CrossRef]
- Aradhi, K.K.; Dasari, B.M.; Banothu, D.; Manavalan, S. Spatial distribution, sources and health risk assessment of heavy metals in topsoil around oil and natural gas drilling sites, Andhra Pradesh, India. Sci. Rep. 2023, 13, 10614. [Google Scholar] [CrossRef]
- Tahir, M.A.; Shaheen, H.; Rathinasabapathi, B. Health risk associated with heavy metal contamination of vegetables grown in agricultural soil of Siran Valley, Mansehra, Pakistan: A case study. Environ. Monit. Assess. 2022, 194, 551. [Google Scholar] [CrossRef]


Disclaimer/Publisher’s Note: The statements, opinions and data contained in all publications are solely those of the individual author(s) and contributor(s) and not of MDPI and/or the editor(s). MDPI and/or the editor(s) disclaim responsibility for any injury to people or property resulting from any ideas, methods, instructions or products referred to in the content. |
© 2025 by the authors. Licensee MDPI, Basel, Switzerland. This article is an open access article distributed under the terms and conditions of the Creative Commons Attribution (CC BY) license (https://creativecommons.org/licenses/by/4.0/).