Assessment of Soil and Water Quality Indices in Agricultural Soils of Manouba Governorate, North-East Tunisia
Abstract
1. Introduction
2. Materials and Methods
2.1. Study Area
2.2. Statistical Analysis and SQI Mapping
3. Results
3.1. Soil Quality
3.2. Water Quality
4. Discussion
5. Conclusions
Author Contributions
Funding
Data Availability Statement
Conflicts of Interest
Abbreviations
| SQI | Soil quality index |
| WQIs | Water quality indices |
| PCA | Principal component analysis |
| TDS | Total data set |
| MSD | Minimum soil data set |
References
- Telo da Gama, J. The role of soils in sustainability, climate change, and ecosystem services: Challenges and opportunities. Ecologies 2023, 4, 552–567. [Google Scholar] [CrossRef]
- Lal, R. Restoring Soil Quality to Mitigate Soil Degradation. Sustainability 2015, 7, 5875–5895. [Google Scholar] [CrossRef]
- Munns, R. Comparative physiology of salt and water stress. Plant Cell Environ. 2002, 25, 239–250. [Google Scholar] [CrossRef]
- Qadir, M.; Quillérou, E.; Nangia, V.; Murtaza, G.; Singh, M.; Thomas, R.J.; Drechsel, P.; Noble, A.D. Economics of salt-induced land degradation and restoration. Nat. Resour. Forum 2014, 38, 282–295. [Google Scholar] [CrossRef]
- FAO; ITPS. Global Salt-Affected Soils Map (v2.0); Food and Agriculture Organization of the United Nations and Intergovernmental Technical Panel on Soils: Rome, Italy, 2015. [Google Scholar]
- Daliakopoulos, I.; Tsanis, I.; Koutroulis, A.; Kourgialas, N.; Varouchakis, A.; Karatzas, G.; Ritsema, C. The threat of soil salinity: A European scale review. Sci. Total Environ. 2016, 573, 727–739. [Google Scholar] [CrossRef] [PubMed]
- Prăvălie, R.; Patriche, C.; Borrelli, P.; Panagos, P.; Roșca, B.; Dumitraşcu, M.; Nita, I.A.; Săvulescu, I.; Birsan, M.V.; Bandoc, G. Arable lands under the pressure of multiple land degradation processes. A global perspective. Environ. Res. 2021, 194, 110697. [Google Scholar] [CrossRef] [PubMed]
- Bhardwaj, A.K.; Mandal, U.K.; Bar-Tal, A.; Gilboa, A.; Levy, G.J. Arable lands under the pressure of multiple land degradation processes. A global perspective. Agric. Water Manag. 1994, 25, 271–297. [Google Scholar] [CrossRef]
- Schacht, K.; Marschner, B. Treated wastewater irrigation effects on soil hydraulic conductivity and aggregate stability of loamy soils in Israel. J. Hydrol. Hydromech. 2015, 63, 47–54. [Google Scholar] [CrossRef]
- Adeyemo, T.; Kramer, I.; Levy, G.J.; Mau, Y. Salinity and sodicity can cause hysteresis in soil hydraulic conductivity. Geoderma 2022, 413, 115765. [Google Scholar] [CrossRef]
- FAO. The State of Food and Agriculture: Overcoming Water Challenges in Agriculture; FAO: Rome, Italy, 2020. [Google Scholar]
- De la Rosa, D.; Sobral, R. Soil Quality and Methods for Its Assessment. In Land Use and Soil Resources; Braimoh, A.K., Vlek, P.L.G., Eds.; Springer: Dordrecht, The Netherlands, 2008; pp. 167–200. [Google Scholar] [CrossRef]
- Li, Y.; Ma, J.; Li, Y.; Jia, Q.; Shen, X.; Xia, X. Spatiotemporal variations in the soil quality of agricultural land and its drivers in China from 1980 to 2018. Sci. Total Environ. 2023, 892, 164649. [Google Scholar] [CrossRef]
- Emami, N.S.; Chavoshi, E.; Ayoubi, S.; Honarjoo, N. Comprehensive assessment of soil quality in various land uses: A comparative analysis of soil quality index model. Environ. Earth Sci. 2024, 83, 498. [Google Scholar] [CrossRef]
- Bixio, D.; Thoeye, C.; Koning, J.D.; Joksimovic, D.; Savic, D.; Wintgens, T.; Melin, T. Comparative physiology of salt and water stress. Desalination 2006, 187, 89–101. [Google Scholar] [CrossRef]
- Lado, M.; Bar-Tal, A.; Azenkot, A.; Assouline, S.; Ravina, I.; Erner, Y.; Fine, P.; Dasberg, S.; Ben-Hur, M. Changes in chemical properties of semiarid soils under long-term secondary treated wastewater irrigation. Soil Sci. Soc. Am. J. 2012, 76, 1358–1369. [Google Scholar] [CrossRef]
- Omarova, A.; Tussupova, K.; Hjorth, P.; Kalishev, M.; Dosmagambetova, R. Water Supply Challenges in Rural Areas: A Case Study from Central Kazakhstan. Int. J. Environ. Res. Public Health 2019, 16, 688. [Google Scholar] [CrossRef] [PubMed]
- Ben Alaya, M.; Zemni, T.; Mamou, A.; Zargouni, F. Acquisition de salinité et qualité des eaux d’une nappe profonde, Tunisie: Approche statistique et géochimique. Hydrol. Sci. J. 2014, 59, 395–419. [Google Scholar] [CrossRef]
- Elsayed, S.; Hussein, H.; Moghanm, F.S.; Khaled, M.K.; Eid, E.M.; Gad, M. Application of irrigation water quality indices and multivariate statistical techniques for surface water quality assessments in the Northern Nile. Water 2020, 12, 3300. [Google Scholar] [CrossRef]
- Ukoha-Onuoha, E.; Fubara-Manuel, I.; Jumbo, R.B.; Ikrang, E. Assessment of River Water Quality for Irrigation Using Multiple Indices. Quest J. Res. Environ. Earth Sci. 2022, 8, 53–60. [Google Scholar]
- Rawat, K.S.; Singh, S.K. Water Quality Indices and GIS-based evaluation of a decadal groundwater quality. Geol. Ecol. Landsc. 2018, 2, 240–255. [Google Scholar] [CrossRef]
- Smaali, H. Une alternative cartographique pour l’évaluation des performances de la gestion collective de l’irrigation: Le cas des GDA du gouvernorat de la Manouba (Nord-Est de la Tunisie). Geo-Eco-Trop 2021, 4, 681–698. [Google Scholar]
- Kallel, R.; Bouzaiane, S.; Eoche duval, J.M.; Colombani, J.; Claude, J.; Lamachere, J.M. Monographie de la Medjerda; ORSTOM: Tunis, Tunisia, 1974; p. 261, Available online:; http://horizon.documentation.ird.fr/exl-doc/pleins_textes/divers14-11/08162.pdf (accessed on 25 May 2024). [Google Scholar]
- Ben Ayed, L.; Horry, M.; Sabbahi, S.; Nouiri, I.; Karanis, P. Water and sediment quality assessment of Medjerda River in Tunisia. Arab. J. Geosci. 2022, 15, 463. [Google Scholar] [CrossRef]
- Abidi, S.; Bejaoui, M.; Jemli, M.; Boumaiza, M. Water Quality of the Oued Medjerda, Tunisia and Algeria, and Three of Its Northern Tributaries. Hydrol. Sci. J. 2015, 60, 1607–1619. [Google Scholar] [CrossRef]
- Weil, N.C.; Brady, R.R.; Weil, R.R. The Nature and Properties of Soils, 15th ed.; Pearson: Columbus, OH, USA, 2016. [Google Scholar]
- Doran, J.W.; Parkin, T.B. Defining and assessing soil quality. In Defining Soil Quality for a Sustainable Environment; Doran, J.W., Ed.; SSSA Special Publication 35; Soil Science Society of America: Madison, WI, USA, 1994; pp. 3–21. [Google Scholar] [CrossRef]
- Andrews, S.S.; Karlen, D.L.; Mitchell, J.P. A comparison of soil quality indexing methods for vegetable production systems in Northern California. Agric. Ecosyst. Environ. 2002, 90, 25–45. [Google Scholar] [CrossRef]
- Karlen, D.L.; Andrews, S.S.; Weinhold, B.J.; Doran, J.W. Soil quality: Humankind’s foundation for survival—A research editorial by conservation professionals. J. Soil Water Conserv. 2003, 58, 171–179. [Google Scholar] [CrossRef]
- Bünemann, E.K.; Bongiorno, G.; Bai, Z.; Creamer, R.E.; De Deyn, G.; de Goede, R.; Brussaard, L. Soil quality–a critical review. Soil Biol. Biochem. 2018, 120, 105–125. [Google Scholar] [CrossRef]
- Abuzaid, A.S.; Abdel-Salam, M.A.; Ahmad, A.F.; Fathy, H.A.; Fadl, M.E.; Scopa, A. Effect of Marginal-Quality Irrigation on Accumulation of some Heavy Metals (Mn, Pb, and Zn) in Typic Torripsamment Soils and Food Crops. Sustainability 2022, 14, 1067. [Google Scholar] [CrossRef]
- Ditzler, C.A.; Tugel, A.J. Soil Quality Field Tools. Agron. J. 2002, 94, 33–38. [Google Scholar] [CrossRef]
- Sun, H.; Jin, Q.; Wang, Q.; Shao, C.; Zhang, L.; Guan, Y.; Tian, H.; Li, M.; Zhang, Y. Effects of soil quality on effective ingredients of Astragalus mongholicus from the main cultivation regions in China. Ecol. Indic. 2020, 114, 106296. [Google Scholar] [CrossRef]
- Alexander, M. Agriculture’s responsibility in establishing soil quality criteria. In Environmental Improvement–Agriculture’s Challenge in the Seventies; National Academy of Sciences: Washington, DC, USA, 1971. [Google Scholar]
- Mandal, U.K.; Bhardwaj, A.K.; Warrington, D.N.; Goldstein, D.; Bar-Tal, A.; Levy, G.J. Changes in soil hydraulic conductivity, runoff, and soil loss due to irrigation with different types of saline sodic water. Geoderma 2008, 144, 509–516. [Google Scholar] [CrossRef]
- Xia, R.; Zhang, S.-Q.; Li, J.; Li, H.; Ge, L.-S.; Yuan, G.-L. Spatial distribution and quantitative identification of contributions for nutrient and beneficial elements in top-and sub-soil of Huairou District of Beijing, China. Ecol. Indic. 2023, 154, 110853. [Google Scholar] [CrossRef]
- Nortcliff, S. Standardization of soil quality attributes. Agric. Ecosyst. Environ. 2002, 88, 161–168. [Google Scholar] [CrossRef]
- Diaz-Gonzalez, F.A.; Vuelvas, J.; Correa, C.A.; Vallejo, V.E.; Patino, D. Machine learning and remote sensing techniques applied to estimate soil indicators–review. Ecol. Indic. 2022, 135, 108517. [Google Scholar] [CrossRef]
- Dengiz, O.; İç, S.; Saygın, F.; İmamoğlu, A. Assessment of Soil Quality Index for Tea Cultivated Soils in Ortaçay Micro Catchment in Black Sea Region. J. Agric. Sci. 2020, 26, 42–53. [Google Scholar] [CrossRef]
- Andrews, S.S.; Karlen, D.L.; Cambardella, C.A. The soil management assessment framework: A quantitative soil quality evaluation method. Soil Sci. Soc. Am. J. 2004, 68, 1945–1962. [Google Scholar] [CrossRef]
- Rojas, J.M.; Prause, J.; Sanzano, G.A.; Arce, O.E.A.; Sanchez, M.C. Soil quality indicators selection by mixed models and multivariate techniques in deforested areas for agricultural use in NW of Chaco, Argentina. Soil Tillage Res. 2016, 155, 250–262. [Google Scholar] [CrossRef]
- Leul, Y.; Assen, M.; Damene, S.; Legass, A. Effects of land use types on soil quality dynamics in a tropical sub-humid ecosystem, western Ethiopia. Ecol. Indic. 2023, 147, 110024. [Google Scholar] [CrossRef]
- Schloter, M.; Nannipieri, P.; Sorensen, S.J.; van Elsas, J.D. Microbial indicators for soil quality. Biol. Fertil. Soils 2018, 54, 1–10. [Google Scholar] [CrossRef]
- Liu, X.; Zhang, W.; Wu, M.; Ye, Y.; Wang, K.; Li, D. Changes in soil nitrogen stocks following vegetation restoration in a typical karst catchment. Land Degrad. Dev. 2019, 30, 60–72. [Google Scholar] [CrossRef]
- Jahany, M.; Rezapour, S. Assessment of the quality indices of soils irrigated with treated wastewater in a calcareous semi-arid environment. Ecol. Indic. 2020, 109, 105800. [Google Scholar] [CrossRef]
- Vasu, D.; Sahu, N.; Tiwary, P.; Chandran, P. Modelling the spatial variability of soil micronutrients for site-specific nutrient management in a semi-arid tropical environment. Model. Earth Syst. Environ. 2021, 7, 1797–1812. [Google Scholar] [CrossRef]
- Samaei, F.; Emami, H.; Lakzian, A. Assessing soil quality of pasture and agriculture land uses in Shandiz County, northwestern Iran. Ecol. Indic. 2022, 139, 108974. [Google Scholar] [CrossRef]
- Song, Q.; Gao, X.; Song, Y.; Li, Q.; Chen, Z.; Li, R.; Zhang, H.; Cai, S. Estimation and mapping of soil texture content based on unmanned aerial vehicle hyperspectral imaging. Sci. Rep. 2023, 13, 14097. [Google Scholar] [CrossRef] [PubMed]
- Nehrani, S.H.; Askari, M.S.; Saadat, S.; Delavar, M.A.; Taheri, M.; Holden, N.M. Quantification of soil quality under semi-arid agriculture in the northwest of Iran. Ecol. Indic. 2020, 108, 105770. [Google Scholar] [CrossRef]
- Davari, M.; Gholami, L.; Nabiollahi, K.; Homaee, M.; Jafari, H.J. Deforestation and cultivation of sparse forest impacts on soil quality (case study: West Iran, Baneh). Soil Tillage Res. 2020, 198, 104504. [Google Scholar] [CrossRef]
- Ma, C.W.; Meng, J.J.; Shangguan, Y.X.; He, M.J.; Chen, K.; Yu, H.; Zeng, X.; Qin, Y.; Guo, S.; Wang, L. Enrichment and Correlation Evaluation of Heavy Metals in Farmland Soil and Maize in the Northwestern Sichuan Basin. Agric. Res. Appl. 2022, 3, 59–67. [Google Scholar]
- FAO. Statistical Yearbook 2024; World Food and Agriculture: Rome, Italy, 2024. [Google Scholar]
- CRDA Manouba. Atlas du Gouvernorat de Manouba; Commissariat Régional au Développement Agricole: Manouba, Tunisia, 2019.
- DGRE (Direction Générale des Ressources en Eau). Flood risk assessment using GIS- MCDM-AHP model: Case of the Wadi Chafrou watershed (Northern Tunisia). In General Directorat of Water Resources.426 Annuaire Hydrologique de la Tunisie; Ministère de l’Agriculture: Tunis, Tunisia, 2021. [Google Scholar]
- Boutib, L. Disposition et Géométrie des plis de l’Atlas Centro-Méridional de Tunisie: Découpage et Cisaillement en Lanières Tectoniques. Ph.D. Thesis, Université Tunis, Tunis, Tunisia, 1998; 326p. [Google Scholar]
- Ben Chelbi, M. Analyse Tectonique des Structures Liées à la Faille de Tunis-Ellès. Ph.D. Thesis, Université Tunis, Tunis, Tunisia, 2007; 265p. [Google Scholar]
- Robinson, M.F.; Very, A.A.; Sanders, D.; Mansfield, T.A. How can stomata contribute to salt tolerance? Ann. Bot. 1997, 80, 387–393. [Google Scholar] [CrossRef]
- Rhoades, J.D. Soluble salts. In Methods of Soil Analysis, Part 2. Chemical and Microbiological Properties. Agronomy Monograph No. 9, 2nd ed.; Page, A.L., Ed.; ASA and SSSA: Madison, WI, USA, 1982; pp. 167–179. [Google Scholar]
- Walkley, A.; Black, I.A. An examination of the Degtjareff method for determining soil organic matter, and a proposed modification of the chromic acid titration method. Soil Sci. 1934, 37, 29–38. [Google Scholar] [CrossRef]
- Lu, R.K. Analysis Method of Soil Agricultural Chemistry; China Agricultural Science and Technology Press: Beijing, China, 2000. [Google Scholar]
- Metson, A.J. Methods of chemical analysis for soil survey samples. Soil Sci. 1957, 83, 245. [Google Scholar] [CrossRef]
- Rodier, J.; Bazin, C.; Broutin, J.; Chambon, P.; Champsaur, H.; Rodi, L. L’Analyse de l’Eau: Eaux Naturelles, Eaux Résiduaires et Eaux de Mer, 8th ed.; Dunod: Paris, France, 1996; p. 1383. [Google Scholar]
- Chaudhari, P.R.; Ahire, D.V.; Ahire, V.D.; Chkravarty, M.; Maity, S. Soil bulk density as related to soil texture, organic matter content and available total nutrients of Coimbatore soil. Int. J. Sci. Res. 2013, 3, 1–8. [Google Scholar]
- Namr, K.I.; Bel-Lahbib, S.; Rerhou, B.; Masmoudi, Y.A.; Hajjaj, H.; Said, B.A. Comparative scoring indicators methods of different soil types to modelling soil quality through constructing Minimum Data Set in the Doukkala irrigated perimeter—Western region of Morocco. Environ. Earth Sci. 2025, 84, 132. [Google Scholar] [CrossRef]
- Andrews, S.S.; Carroll, C.R. Designing a soil quality assessment tool for sustainable agroecosystem management. Ecol. Appl. 2001, 11, 1573–1585. [Google Scholar] [CrossRef]
- Yu, P.; Liu, S.; Zhang, L.; Li, Q.; Zhou, D. Selecting the minimum data set and quantitative soil quality indexing of alkaline soils under different land uses in northeastern China. Sci. Total Environ. 2018, 616, 564–571. [Google Scholar] [CrossRef]
- Amorim, H.C.S.; Ashworth, A.J.; Brye, K.R.; Wienhold, B.J.; Savin, M.C.; Owens, P.R.; Silva, S.H.G. Soil Quality Indices as Affected by Long-Term Burning, Irrigation, Tillage, and Fertility Management. Soil Syst. 2021, 5, 188. [Google Scholar] [CrossRef]
- Kaiser, H.F. The application of electronic computers to factor analysis. Educ. Psychol. Meas. 1960, 20, 141–151. [Google Scholar] [CrossRef]
- Mamehpour, N.; Rezapour, S.; Ghaemian, N. Quantitative assessment of soil quality indices for urban croplands in a calcareous semi-arid ecosystem. Geoderma 2021, 363, 114781. [Google Scholar] [CrossRef]
- Raiesi, F.; Beheshti, A. Evaluating Forest Soil Quality after Deforestation and Loss of Ecosystem Services Using Network Analysis and Factor Analysis Techniques. Catena 2022, 208, 105778. [Google Scholar] [CrossRef]
- Marzaioli, R.; D’Ascoli, R.; De Pascale, R.A.; Rutigliano, F.A. Soil quality in a Mediterranean area of Southern Italy as related to different land use types. Appl. Soil Ecol. 2010, 44, 205–212. [Google Scholar] [CrossRef]
- Pouladi, N.; Jafarzadeh, A.A.; Shahbazi, F.; Ghorbani, M.A.; Greve, M.H. Assessing the Soil Quality Index as Affected by Two Land Use Scenarios in Miandoab Region. SN Appl. Sci. 2020, 2, 1875. [Google Scholar] [CrossRef]
- Nabiollahi, K.; Taghizadeh-Mehrjardi, R.; Kerry, R.; Moradian, S. Assessment of soil quality indices for salt-affected agricultural land in Kurdistan Province, Iran. Ecol. Indic. 2017, 83, 482–494. [Google Scholar] [CrossRef]
- Marion, L.F.; Schneider, R.; Cherubin, M.R.; Colares, G.S.; Wiesel, P.G.; Costa, A.B.; Lobo, E.A. Development of a Soil Quality Index to Evaluate Agricultural Cropping Systems in Southern Brazil. Soil Tillage Res. 2022, 218, 105293. [Google Scholar] [CrossRef]
- Singh, R.; Syed, T.H.; Kumar, S.; Kumar, M. Hydrogeochemical assessment of surface and groundwater resources of Korba coalfield, Central India; environmental implications. Arab. J. Geosci. 2018, 10, 318. [Google Scholar] [CrossRef]
- Richards, L.A. Diagnosis and Improvement of Saline Alkali Soils. In Agriculture Handbook No. 60; U.S. Department of Agriculture: Washington, DC, USA, 1954. [Google Scholar]
- Tilman, D.; Fargione, J.; Wolff, B.; D’Antonio, C.; Dobson, A.; Howarth, R.; Schindler, D.; Schlesinger, W.H.; Simberloff, D.; Swackhamer, D. Forecasting agriculturally driven global environmental change. Science 2001, 292, 281–284. [Google Scholar] [CrossRef]
- Bijay-Singh; Craswell, E. Fertilizers and nitrate pollution of surface and ground water: An increasingly pervasive global problem. SN Appl. Sci. 2021, 3, 51. [Google Scholar] [CrossRef]
- Tlili-Zrelli, B.; Hamzaoui-Azaza, F.; Gueddari, M.; Bouhlila, R. Geochemistry and quality assessment of groundwater using graphical and multivariate statistical methods. A case study: Grombalia phreatic aquifer (Northeastern Tunisia). Arab. J. Geosci. 2013, 6, 3545–3561. [Google Scholar] [CrossRef]
- Alexakis, D. Assessment of water quality in the Messolonghi-Etoliko and Neochorio region (West Greece) using hydrochemical and statistical analysis methods. Environ. Monit. Assess. 2011, 182, 397–413. [Google Scholar] [CrossRef]
- Etteieb, S.; Cherif, S.; Tarhouni, J. Hydrochemical assessment of water quality for irrigation: A case study of the Medjerda River in Tunisia. Appl. Water Sci. 2017, 7, 469–480. [Google Scholar] [CrossRef]
- Hamzaoui-Azaza, F.; Ketata, M.; Bouhlila, R. Hydrogeochemical characteristics and assessment of drinking water quality in Zeuss–Koutine aquifer, Southeastern Tunisia. Environ. Monit. Assess. 2011, 174, 283–298. [Google Scholar] [CrossRef]
- Al-Shammiri, M.; Al-Saffar, A.; Bohamad, S.; Ahmed, M. Waste water quality and reuse in irrigation in Kuwait using microfiltration technology in treatment. Desalination 2005, 185, 213–225. [Google Scholar] [CrossRef]
- Kumar, K.; Jaiswal, A.; Koppolu, U.M.; Kumar, K.R.R. Alkaline stress disrupts growth, biochemistry, and ion homeostasis of chickpea (Cicer arietinum L.) roots. Front. Agron. 2024, 6, 1497054. [Google Scholar] [CrossRef]
- Li, P.; Wu, M.C.; Kang, G.D.; Zhu, B.J.; Li, H.X.; Hu, F.; Jiao, J.G. Soil quality response to organic amendments on dryland red soil in subtropical China. Geoderma 2020, 373, 114416. [Google Scholar] [CrossRef]
- Zeraatpisheh, M.; Bakhshandeh, E.; Hosseini, M.; Alavi, S.M. Assessing the effects of deforestation and intensive agriculture on the soil quality through digital soil mapping. Geoderma 2020, 363, 114139. [Google Scholar] [CrossRef]
- Raiesi, F. A minimum data set and soil quality index to quantify the effect of land use conversion on soil quality and degradation in native rangelands of upland arid and semiarid regions. Ecol. Indic. 2017, 75, 307–320. [Google Scholar] [CrossRef]
- Silva, C.M.M.; Fay, E.F. Effect of salinity on soil microorganisms. In Soil Health and Land Use Management; Hernandez-Soriano, M.C., Ed.; IntechOpen: London, UK, 2012. [Google Scholar] [CrossRef]
- Raghavendra, M.; Sharma, M.P.; Ramesh, A.; Richa, A.; Billore, S.D.; Verma, R.K. Soil health indicators: Methods and applications. In Soil Analysis: Recent Trends and Applications; Hernandez-Soriano, M.C., Ed.; Springer: Singapore, 2020. [Google Scholar] [CrossRef]
- Panda, D.; Baliarsingh, A.; Achary, K.G. Impact of salinity stress on crop plants and its management: A review. J. Appl. Bot. Food Qual. 2017, 90, 83–93. [Google Scholar]
- Guo, L.L.; Sun, Z.; Zhu, O.; Han, D.R.; Li, F.D. A comparison of soil quality evaluation methods for Fluvisol along the lower Yellow River. Catena 2017, 152, 135–143. [Google Scholar] [CrossRef]
- Mustafa, A.A. Utilizing principal component analysis and geographic information system approach for assessing soil quality index under different land uses: Case study. SVU Int. J. Agric. Sci. 2023, 5, 41–53. [Google Scholar] [CrossRef]
- Ayers, A.D.; Brown, J.W.; Wadleigh, C.H. Salt tolerance of barley and wheat in soil plots receiving several salinization regimes. Agron. J. 1952, 44, 307–310. [Google Scholar] [CrossRef]
- Francois, L.E. Salinity effects on bud yield and vegetative growth of artichoke (Cynara scolymus L.). HortScience 1995, 30, 69–71. [Google Scholar] [CrossRef]
- Kumar, A.; Rai, H.K.; Yadav, S.L.; Gulaiya, S.; Inwati, D.K. Impact of different land use practices on size of soil aggregates and its mean weight diameter under vertisols of Central India. Int. J. Environ. 2023, 13, 46–54. [Google Scholar] [CrossRef]
- FAO. Soils for Nutrition: State of the Art; FAO: Rome, Italy, 2022. [Google Scholar] [CrossRef]
- Ivanov, V.F. Main principles of fruit crop salt resistance determination. Pochvovedenie 1970, 4, 78–85. [Google Scholar]
- Groot Obbink, J.; Alexander, D.M. Response of six grapevine cultivars to a range of chloride concentrations. Am. J. Enol. Vitic. 1973, 24, 65–68. [Google Scholar] [CrossRef]
- Raiesi, F.; Tavakoli, M. Developing a Soil Quality Index Model for Assessing Landscape-Level Soil Quality along a Toposequence in Almond Orchards Using Factor Analysis. Model. Earth Syst. Environ. 2022, 8, 4035–4050. [Google Scholar] [CrossRef]
- Bhunia, G.S.; Shit, P.K.; Maiti, R. Comparison of GIS-based interpolation methods for spatial distribution of soil organic carbon (SOC). J. Saudi Soc. Agric. Sci. 2018, 17, 114–126. [Google Scholar] [CrossRef]
- Shukla, K.; Kumar, P.; Mann, G.S.; Khare, M. Mapping spatial distribution of particulate matter using Kriging and Inverse Distance Weighting at supersites of megacity Delhi. Sustain. Cities Soc. 2020, 54, 101997. [Google Scholar] [CrossRef]
| Soil Properties | Methods of Analysis |
|---|---|
| Texture (Sand, Silt, and Clay Content) | Twenty grams of air-dried surface soil were mixed with 20 mL of 30% hydrogen peroxide (H2O2) in a 250 mL Erlenmeyer flask to oxidize the organic matter. The mixture was left to react at room temperature for 48 h and then heated on a hot plate at approximately 90–100 °C for 3 h to complete the oxidation process. After cooling, 50 mL of distilled water was added, and the suspension was filtered using Whatman No. 42 filter paper to remove residual debris. The remaining soil was transferred to a clean beaker, and 10 mL of 1 M potassium chloride (KCl) was added, followed by 40 mL of a sodium hexametaphosphate solution (25 g.L−1). To adjust the pH and enhance dispersion, a few drops of 0.1 N ammonia (NH3) were added. The mixture was left to stand for 24 h after being stirred thoroughly and having distilled water added to bring the total volume to 100 mL. After dispersion, 20 mL of the suspension was transferred to a pre-weighed container, dried at room temperature until it reached a constant mass, and weighed. The sample was then oven-dried at 150 °C for 2 h and weighed again. The mass difference between the room-dried and oven-dried samples was used to estimate the number of dispersed particles [57]. |
| Soil and Water pH (Suspension (1:2.5 Soil/Water)) | To determine the pH of the water directly in situ, a CyberScan pH 110 Portable pH/mV Meter (Eutech Instruments, Singapore, Singapore) calibrated pH meter was used to measure the pH of the water sample at the site without any prior treatment. For soil pH determination, 20 g of air-dried soil was weighed and placed into a beaker and then mixed with 50 mL of distilled water. To ensure a uniform suspension, the mixture was thoroughly stirred and then left to settle undisturbed for 2 h at room temperature. After settling, the suspension was filtered using Whatman No. 42 filter paper and the clear filtrate was collected. The pH of the filtration was then measured with the CyberScan pH 110 Portable pH/mV Meter. The pH meter was allowed to stabilize for approximately one minute, and then, the reading was taken. |
| ECe (Saturated Paste (SP) Method) | A 200 g mass of air-dried soil was gradually moistened with distilled water in a container, and thoroughly mixed until a saturated paste consistency was achieved. The saturated paste was then covered to prevent evaporation and left to equilibrate for 24 h at room temperature. This allowed the soluble salts to fully dissolve into the pore water. After equilibration, the pore water was extracted by suction filtration using a Buchner funnel lined with Whatman No. 42 filter paper. This solution, representing the soil saturation extract, was collected, and its electrical conductivity was measured immediately using a calibrated bench-type conductivity meter Model: BCT-4308 (Lutron Electronic Enterprise, Taipei, Taiwan) [58]. |
| EC (Water) | A direct in situ measurement via a bench-type conductivity meter (Model: BCT-4308). |
| Soil Organic Matter (SOC) | The soil organic carbon content in the soil was determined by placing 1 g of air-dried soil into a conical flask and mixing it with 10 mL of 1 N potassium dichromate (K2Cr2O7) solution. Then, 20 mL of concentrated sulfuric acid (H2SO4) was added to initiate the oxidation reaction. The mixture was then gently swirled for 1 min and left to react for 30 min at room temperature. A standardization blank (without soil) was run at the same time. Following the reaction period, a small quantity of silver sulfate crystals (approximately 0.5 g) was added to catalyze the oxidation. After half an hour, 200 mL of distilled water was added, along with 0.5 mL of ferroin indicator (typically 0.025 M in 1,10-phenanthroline and iron (II) sulfate). The solution was titrated with 0.5 N ferrous ammonium sulfate [Fe (NH4)2(SO4)2·6(H2O)2] until the color changed from olive green to reddish-brown, indicating the endpoint. The volume of titrant consumed was used to calculate the amount of oxidizable organic carbon [59]. |
| Total Nitrogen Content (TN) | The Kjeldahl digestion–distillation method was used to determine the total nitrogen content in the soil. A 1 g mass of finely crushed air-dried soil was placed into a digestion tube. A pinch of selenium powder (approximately 0.1 g) was added. This was used as a catalyst. Then, 5 mL of 30% sulfuric acid (H2SO4, ~5.4 M) was added under a fume hood to initiate digestion. The mixture was heated at 300 °C for 10 min to ensure the complete mineralization of the organic nitrogen into ammonium sulfate. Once digestion was complete, the tube was left to cool to room temperature, after which 20 mL of distilled water was added to dilute the digestate. The solution was then transferred to a distillation unit. To monitor the titration endpoint, we added five drops of methyl red indicator (typically 0.02% w/v in ethanol). During distillation, if boric acid was used, the ammonia released was captured in this, and the final solution was titrated with standard 0.01 N sulfuric acid until the color changed from green to pink, indicating the endpoint. The total nitrogen content in the soil sample was calculated using the amount of acid that had been consumed [60]. |
| Iron (Fe) | A 0.5 g mass of finely ground, air-dried soil was placed in a Teflon digestion beaker. Under a fume hood, 10 mL of hydrofluoric acid (HF, 48%) and 5 mL of perchloric acid (HClO4, 70%) were added to the sample to initiate complete mineral digestion. The beaker was loosely covered and left to react for 24 h at room temperature to allow the silicate matrices to break down gradually. The mixture was then heated on a digestion plate at approximately 150–200 °C for 15 min to accelerate the reaction. After cooling slightly, 2 mL of nitric acid (HNO3, 65%) was added, and the solution was stirred and reheated for an additional 15 min to ensure the complete oxidation and dissolution of iron compounds. Once the reaction had finished and the sample had reached boiling point, the digest was cooled, transferred quantitatively into a 100 mL volumetric flask, and then diluted to volume with deionized water. The iron concentration in the final solution was measured using a Bench atomic absorption spectrophotometer (AAS-900), manufactured by Labtron Scientific Ltd., Grand Rapids, MI, USA. |
| Calcium Carbonate Content (CaCO3) | The Bernard calcimeter method was used to determine the calcium carbonate content. One gram of finely ground, air-dried soil was placed in the reaction flask of the calcimeter. Then, 10 mL of concentrated hydrochloric acid (HCl, 0.5 N) was added to the flask to initiate the reaction with calcium carbonate. As the acid reacted with the carbonate compounds in the soil, carbon dioxide gas (CO2) was released. The volume of CO2 produced was measured using a burette connected to the calcimeter setup. This volume was directly proportional to the amount of calcium carbonate present in the sample. |
| Cation Exchange Capacity (CEC) | A 2 g mass of sieved, air-dried soil was placed in a clean container and mixed with 25 mL of a 10% barium acetate solution (0.4 M). The mixture was stirred vigorously for 90 s to saturate the exchange sites with barium ions. The mixture was then centrifuged at 300 rpm for five minutes, and the supernatant was discarded. The residue was subsequently treated with 25 mL of a 0.1 M magnesium sulfate solution (MgSO4) to displace the adsorbed barium ions. After stirring for a further 90 s, the mixture was centrifuged again under the same conditions. A 10 mL volume of the resulting extract was collected and diluted with 150 mL of distilled water. To buffer the solution, 10 mL of an ammonium chloride (NH4Cl, 0.1 M) buffer solution at pH 10 was added, followed by a few drops of an Eriochrome Black T indicator solution (0.5% w/v in ethanol). Initially pink due to the presence of magnesium ions, the solution was titrated with 0.01 M EDTA (ethylenediaminetetraacetic acid) until it changed color from pink to blue, indicating the endpoint. The volume of EDTA consumed was then used to calculate the soil cation exchange capacity [61]. |
| Water and soils Calcium (Ca2+), Magnesium (Mg2+), Sodium (Na+), Potassium (K+), Carbonates (CO32−), Bicarbonates (HCO3−), Chloride (Cl−), Sulfates (SO4−) | To determine the concentrations of calcium (Ca2+) and magnesium (Mg2+) in the water and soil extracts, complexometric titration using ethylenediaminetetraacetic acid (EDTA) was employed. A 10 mL sample was buffered to pH 10 using 10 mL of ammonium chloride buffer solution. A few drops of 0.5% w/v Eriochrome Black T indicator solution in ethanol was added, producing a pink coloration in the presence of divalent cations. The solution was then titrated with 0.01 M EDTA until the color changed from pink to blue, which indicated the endpoint. Titration was performed using a burette and magnetic stirrer, with the pH monitored using a CyberScan pH 110 Portable pH/mV Meter. The sodium (Na+) and potassium (K+) concentrations were determined using the BWB XP Plus Flame Photometer (BWB Technologies, Newbury, UK). Samples were filtered and diluted appropriately prior to analysis. Calibration curves were prepared using standard sodium and potassium solutions (1000 mg/L stock solutions, serially diluted). Carbonates (CO32−) and bicarbonates (HCO3−) were quantified by acid–base titration. A 25 mL sample was titrated with 0.1 N hydrochloric acid (HCl), using phenolphthalein indicator (0.5% w/v in ethanol) to detect the carbonate endpoint, indicated by a color change from pink to colorless. Following this, methyl orange indicator (0.1% w/v in water) was added to determine the bicarbonate endpoint. The bicarbonate endpoint was marked by a color change from orange to pink. Titrations were performed using a burette and monitored with a CyberScan pH 110 Portable pH/mV Meter to confirm the accuracy of the endpoints. Chloride (Cl−) concentration was measured using the Mohr argentometric method. A 25 mL volume of the sample, placed in a beaker, was titrated with 0.1 N silver nitrate (AgNO3) in the presence of a 5% w/v potassium chromate indicator. The endpoint was indicated by a color change from yellow to reddish-brown, signaling the formation of silver chromate (Ag2CrO4) after all the chloride ions had precipitated as silver chloride (AgCl). Sulfate (SO42−) was determined using a turbidimetric method by mixing 10 mL of sample with 20 mL of conditioning reagent containing 30 g/L sodium chloride (NaCl) and 5 mL/L glycerol, followed by the addition of 1 mL of 0.25 M barium chloride (BaCl2) under stirring. The absorbance was measured at 420 nm using a Bench atomic absorption spectrophotometer (AAS-900). The sulfate levels were calculated from a calibration curve prepared with Na2SO4 standards ranging from 0 to 40 mg/L [62]. |
| Water Nitrate (NO3-N) Ammonium (NH4-N) | The concentration of nitrate (NO3−-N) in water samples was determined using the cadmium reduction method. A 10 mL water sample was treated with a powdered reagent containing cadmium particles and sulfanilic acid (commercially known as NitraVer® 6). In this method, nitrate (NO3−) is chemically reduced to nitrite (NO2−) by cadmium. The nitrite then reacts with sulfanilic acid under acidic conditions to form a diazonium salt, which couples with a second aromatic compound to produce pink azo dye. After 5 min of reaction time, absorbance was measured at 543 nm using a Double Beam UV-Visible Spectrophotometer (Model: UV1720) manufactured by Shanghai Yoke Instrument Co., Ltd., Shanghai, China. The nitrate concentrations were calculated from a standard calibration curve. Ammonium (NH4+-N) was measured by colorimetry using the indophenol blue reaction. A 10 mL volume of water sample was mixed with 1 mL of alkaline phenol solution (containing 0.5% w/v phenol and 0.25% w/v sodium nitroprusside) and 1 mL of sodium hypochlorite solution (0.5% available chlorine) in a beaker. The mixture was allowed to react for 1 h at room temperature to form an indophenol blue-colored complex. The absorbance was measured at 640 nm using a Double Beam UV-Visible Spectrophotometer (Model: UV1720). The ammonium concentrations were determined from a calibration curve prepared using ammonium chloride standards ranging from 0.1 to 10 mg/L NH4+-N. |
| Soil Variables | Minimum | Maximum | Mean | Std. Dev | CV% | Kurtosis | Skewness |
|---|---|---|---|---|---|---|---|
| pH | 7.12 | 8 | 7.38 | 0.07 | 0.95 | 5.54 | 2.03 |
| ECe (dS.m−1) | 1.17 | 5.89 | 2.69 | 0.53 | 19.70 | 0.43 | 1.26 |
| CaCO3 (%) | 11.87 | 13.47 | 12.46 | 0.16 | 1.28 | −0.36 | 0.66 |
| Clay (%) | 41 | 55 | 45.97 | 1.35 | 2.94 | 1.01 | 0.74 |
| Silt (%) | 15.5 | 39.25 | 25.5 | 2.46 | 9.65 | −0.56 | 0.47 |
| Sand (%) | 7.85 | 35.86 | 26.04 | 2.62 | 10.06 | 1.56 | −1.09 |
| SOC (%) | 1.23 | 2.85 | 1.90 | 0.18 | 9.47 | −1.35 | 0.38 |
| TN (%) | 0.02 | 0.20 | 0.12 | 0.01 | 8.33 | −0.73 | 0.09 |
| CEC (meq.100 gr−1) | 11.87 | 31.25 | 23.87 | 1.86 | 7.79 | 0.61 | −0.88 |
| Na (mg.kg−1) | 3.05 | 29.4 | 11.35 | 3.03 | 26.69 | 1.03 | 1.56 |
| Mg (mg.kg−1) | 2 | 11 | 5 | 0.89 | 17.80 | 1.15 | 1.21 |
| Ca (mg.kg−1) | 3 | 19 | 9.60 | 1.94 | 20.21 | −1.36 | 0.68 |
| SO4 (mg.kg−1) | 0.17 | 15.1 | 5.85 | 1.57 | 26.84 | −0.31 | 0.71 |
| Cl (mg.kg−1) | 5.46 | 40.89 | 16.63 | 4.26 | 25.61 | 0.50 | 1.37 |
| Fe2O3 (mg.kg−1) | 0.02 | 0.23 | 0.17 | 0.02 | 11.76 | 0.96 | −1.26 |
| Soil Variables | Minimum | Maximum | Mean | Std. Dev | CV% | Kurtosis | Skewness |
|---|---|---|---|---|---|---|---|
| pH | 7.16 | 7.83 | 7.53 | 0.25 | 3.32 | −1.60 | −0.03 |
| ECe (dS.m−1) | 0.694 | 8.15 | 0.694 | 3.846 | 554.17 | 2.04 | 0.82 |
| CaCO3 (%) | 31.38 | 41.54 | 36.88 | 3.62 | 9.82 | −1.13 | −0.33 |
| Clay (%) | 27.00 | 53.00 | 43.33 | 8.79 | 20.29 | −0.14 | −0.88 |
| Silt (%) | 23.00 | 45.00 | 32.89 | 7.47 | 22.72 | −0.45 | 0.41 |
| Sand (%) | 7 | 50.00 | 23.78 | 14.94 | 62.83 | −0.63 | 0.82 |
| SOC (%) | 0.83 | 3.47 | 1.52 | 0.81 | 53.29 | 4.93 | 2.12 |
| TN (%) | 0.06 | 0.28 | 0.12 | 0.07 | 58.33 | 1.80 | 1.46 |
| CEC (meq.100 gr−1) | 16.25 | 31.25 | 25.83 | 5.01 | 19.55 | 0.02 | −0.89 |
| Na (mg.kg−1) | 2.09 | 36.75 | 16.81 | 12.49 | 74.30 | −1.19 | 0.54 |
| Mg (mg.kg−1) | 5.67 | 60.35 | 28.33 | 17.65 | 62.31 | −0.21 | 0.42 |
| Ca (mg.kg−1) | 73.89 | 514.27 | 280.07 | 150.65 | 53.79 | −0.92 | −0.24 |
| K (mg.kg−1) | 4.60 | 22.65 | 13.80 | 6.51 | 47.17 | −0.86 | −0.15 |
| Soil Properties | Factor 1 | Factor 2 | Factor 3 | Factor 4 | Factor 5 |
|---|---|---|---|---|---|
| pH | 0.039 | 0.097 | 0.485 | 0.837 | −0.130 |
| ECe (dS.m−1) | −0.982 | −0.144 | −0.039 | 0.100 | −0.023 |
| CaCO3 (%) | −0.225 | 0.153 | 0.319 | −0.513 | −0.671 |
| Clay (%) | −0.284 | 0.180 | −0.735 | −0.172 | 0.494 |
| Silt (%) | 0.023 | 0.893 | 0.142 | 0.299 | 0.092 |
| Sand (%) | 0.014 | −0.897 | 0.160 | −0.033 | −0.352 |
| SOC (%) | 0.460 | −0.610 | −0.544 | 0.205 | −0.019 |
| TN (%) | −0.086 | 0.426 | −0.627 | −0.441 | −0.248 |
| CEC (meq.100 gr−1) | −0.135 | 0.126 | −0.744 | 0.322 | −0.447 |
| Na (mg.kg−1) | −0.935 | −0.184 | −0.183 | 0.182 | −0.072 |
| Mg (mg.kg−1) | −0.938 | −0.110 | −0.092 | 0.165 | 0.121 |
| Ca (mg.kg−1) | −0.922 | −0.146 | 0.217 | 0.130 | 0.026 |
| SO4 (mg.kg−1) | −0.976 | 0.042 | −0.072 | −0.066 | 0.084 |
| Cl (mg.kg−1) | −0.965 | −0.218 | 0.006 | 0.133 | −0.042 |
| Fe2O3 | −0.053 | 0.612 | −0.428 | 0.338 | −0.401 |
| Eigenvalue | 6.047 | 3.127 | 2.745 | 1.694 | 1.298 |
| Variance (%) | 37.797 | 19.548 | 17.159 | 10.591 | 8.118 |
| Cumulative variance (%) | 37.797 | 57.346 | 74.505 | 85.096 | 93.215 |
| Soil Properties | Factor 1 | Factor 2 | Factor 3 | Factor 4 | Factor 5 |
|---|---|---|---|---|---|
| pH | −0.456 | −0.378 | −0.692 | −0.038 | 0.078 |
| ECe (dS.m−1) | 0.569 | 0.548 | 0.490 | 0.290 | −0.026 |
| EC 1:5 (dS.m−1) | −0.116 | 0.678 | 0.471 | −0.196 | −0.159 |
| CEC (meq.100 gr−1) | −0.233 | 0.071 | −0.496 | −0.243 | −0.783 |
| OM (%) | −0.006 | 0.788 | −0.563 | −0.125 | 0.198 |
| CaCO3 (%) | −0.796 | 0.106 | 0.486 | 0.241 | −0.012 |
| Na (mg.kg−1) | −0.775 | 0.257 | 0.005 | 0.553 | 0.079 |
| Mg (mg.kg−1) | −0.877 | 0.026 | −0.042 | 0.450 | −0.015 |
| Ca (mg.kg−1) | −0.902 | −0.109 | −0.029 | 0.340 | −0.175 |
| K (mg.kg−1) | −0.871 | 0.161 | −0.052 | 0.039 | −0.106 |
| SOC (%) | −0.006 | 0.789 | −0.563 | −0.124 | 0.198 |
| TN (%) | 0.775 | 0.107 | 0.189 | −0.044 | −0.408 |
| Clay (%) | −0.848 | 0.220 | 0.217 | −0.375 | −0.148 |
| Silt (%) | −0.533 | −0.188 | 0.268 | −0.699 | 0.259 |
| Sand (%) | 0.765 | −0.034 | −0.262 | 0.571 | −0.042 |
| Eigenvalue | 6.37 | 2.36 | 2.29 | 1.86 | 1.03 |
| Variance (%) | 42.47 | 15.78 | 15.27 | 12.40 | 6.88 |
| Cumulative variance (%) | 42.47 | 58.25 | 73.52 | 85.92 | 92.8 |
| ECe (dS.m−1) | CaCO3 (%) | Na (mg.kg−1) | Mg (mg.kg−1) | Ca (mg.kg−1) | K (mg.kg−1) | TN (%) | Clay (%) | Sand (%) | |
|---|---|---|---|---|---|---|---|---|---|
| ECe dS.m−1 | 1 | ||||||||
| CaCO3 (%) | −0.12 | 1 | |||||||
| Na (mg.kg−1) | −0.14 | 0.78 ** | 1 | ||||||
| Mg (mg.kg−1) | −0.34 | 0.76 | 0.94 ** | 1 | |||||
| Ca (mg.kg−1) | −0.46 | 0.73 | 0.84 | 0.96 ** | 1 | ||||
| K (mg.kg−1) | −0.36 | 0.61 | 0.68 | 0.80 | 0.84 ** | 1 | |||
| TN (%) | 0.68 ** | −0.58 | −0.62 | −0.64 | −0.61 | −0.53 | 1 | ||
| Clay (%) | −0.35 | 0.72 | 0.49 | 0.57 | 0.62 | 0.77 ** | −0.49 | 1 | |
| Sand (%) | 0.43 | −0.58 | −0.29 | −0.41 | −0.49 | −0.65 | 0.48 | −0.93 ** | 1 |
| ECe | pH | CaCO3 | Sand | CEC | |
|---|---|---|---|---|---|
| Min | 1.17 | 7.12 | 11.78 | 7.85 | 11.87 |
| Max (Xmax) | 5.89 | 8 | 13.47 | 35.86 | 31.25 |
| Average (X0) | 2.69 | 7.38 | 12.46 | 26.04 | 23.87 |
| Curve Type | Less is better | Optimum | Optimum | Optimum | More is better |
| Weighting Factor a | 0.40 | 0.11 | 0.08 | 0.20 | 0.18 |
| Slope (b Value) | +2.5 | −2.5 | −2.5 | −2.5 | −2.5 |
| Linear Equation | |||||
| Non-Linear Equation |
| Ca | SOC | pH | Silt | CEC | |
|---|---|---|---|---|---|
| Min | 73.89 | 0.83 | 7.16 | 23 | 16.25 |
| Max (Xmax) | 514.27 | 3.47 | 7.83 | 45 | 31.25 |
| Average (X0) | 280.07 | 1.52 | 7.53 | 32.89 | 25.83 |
| Curve Type | Optimum | More is better | Optimum | Optimum | More is better |
| Weighting Factor a | 0.46 | 0.17 | 0.16 | 0.13 | 0.07 |
| Slope (b Value) | −2.5 | −2.5 | −2.5 | −2.5 | −2.5 |
| Linear Equation | |||||
| Non-Linear Equation |
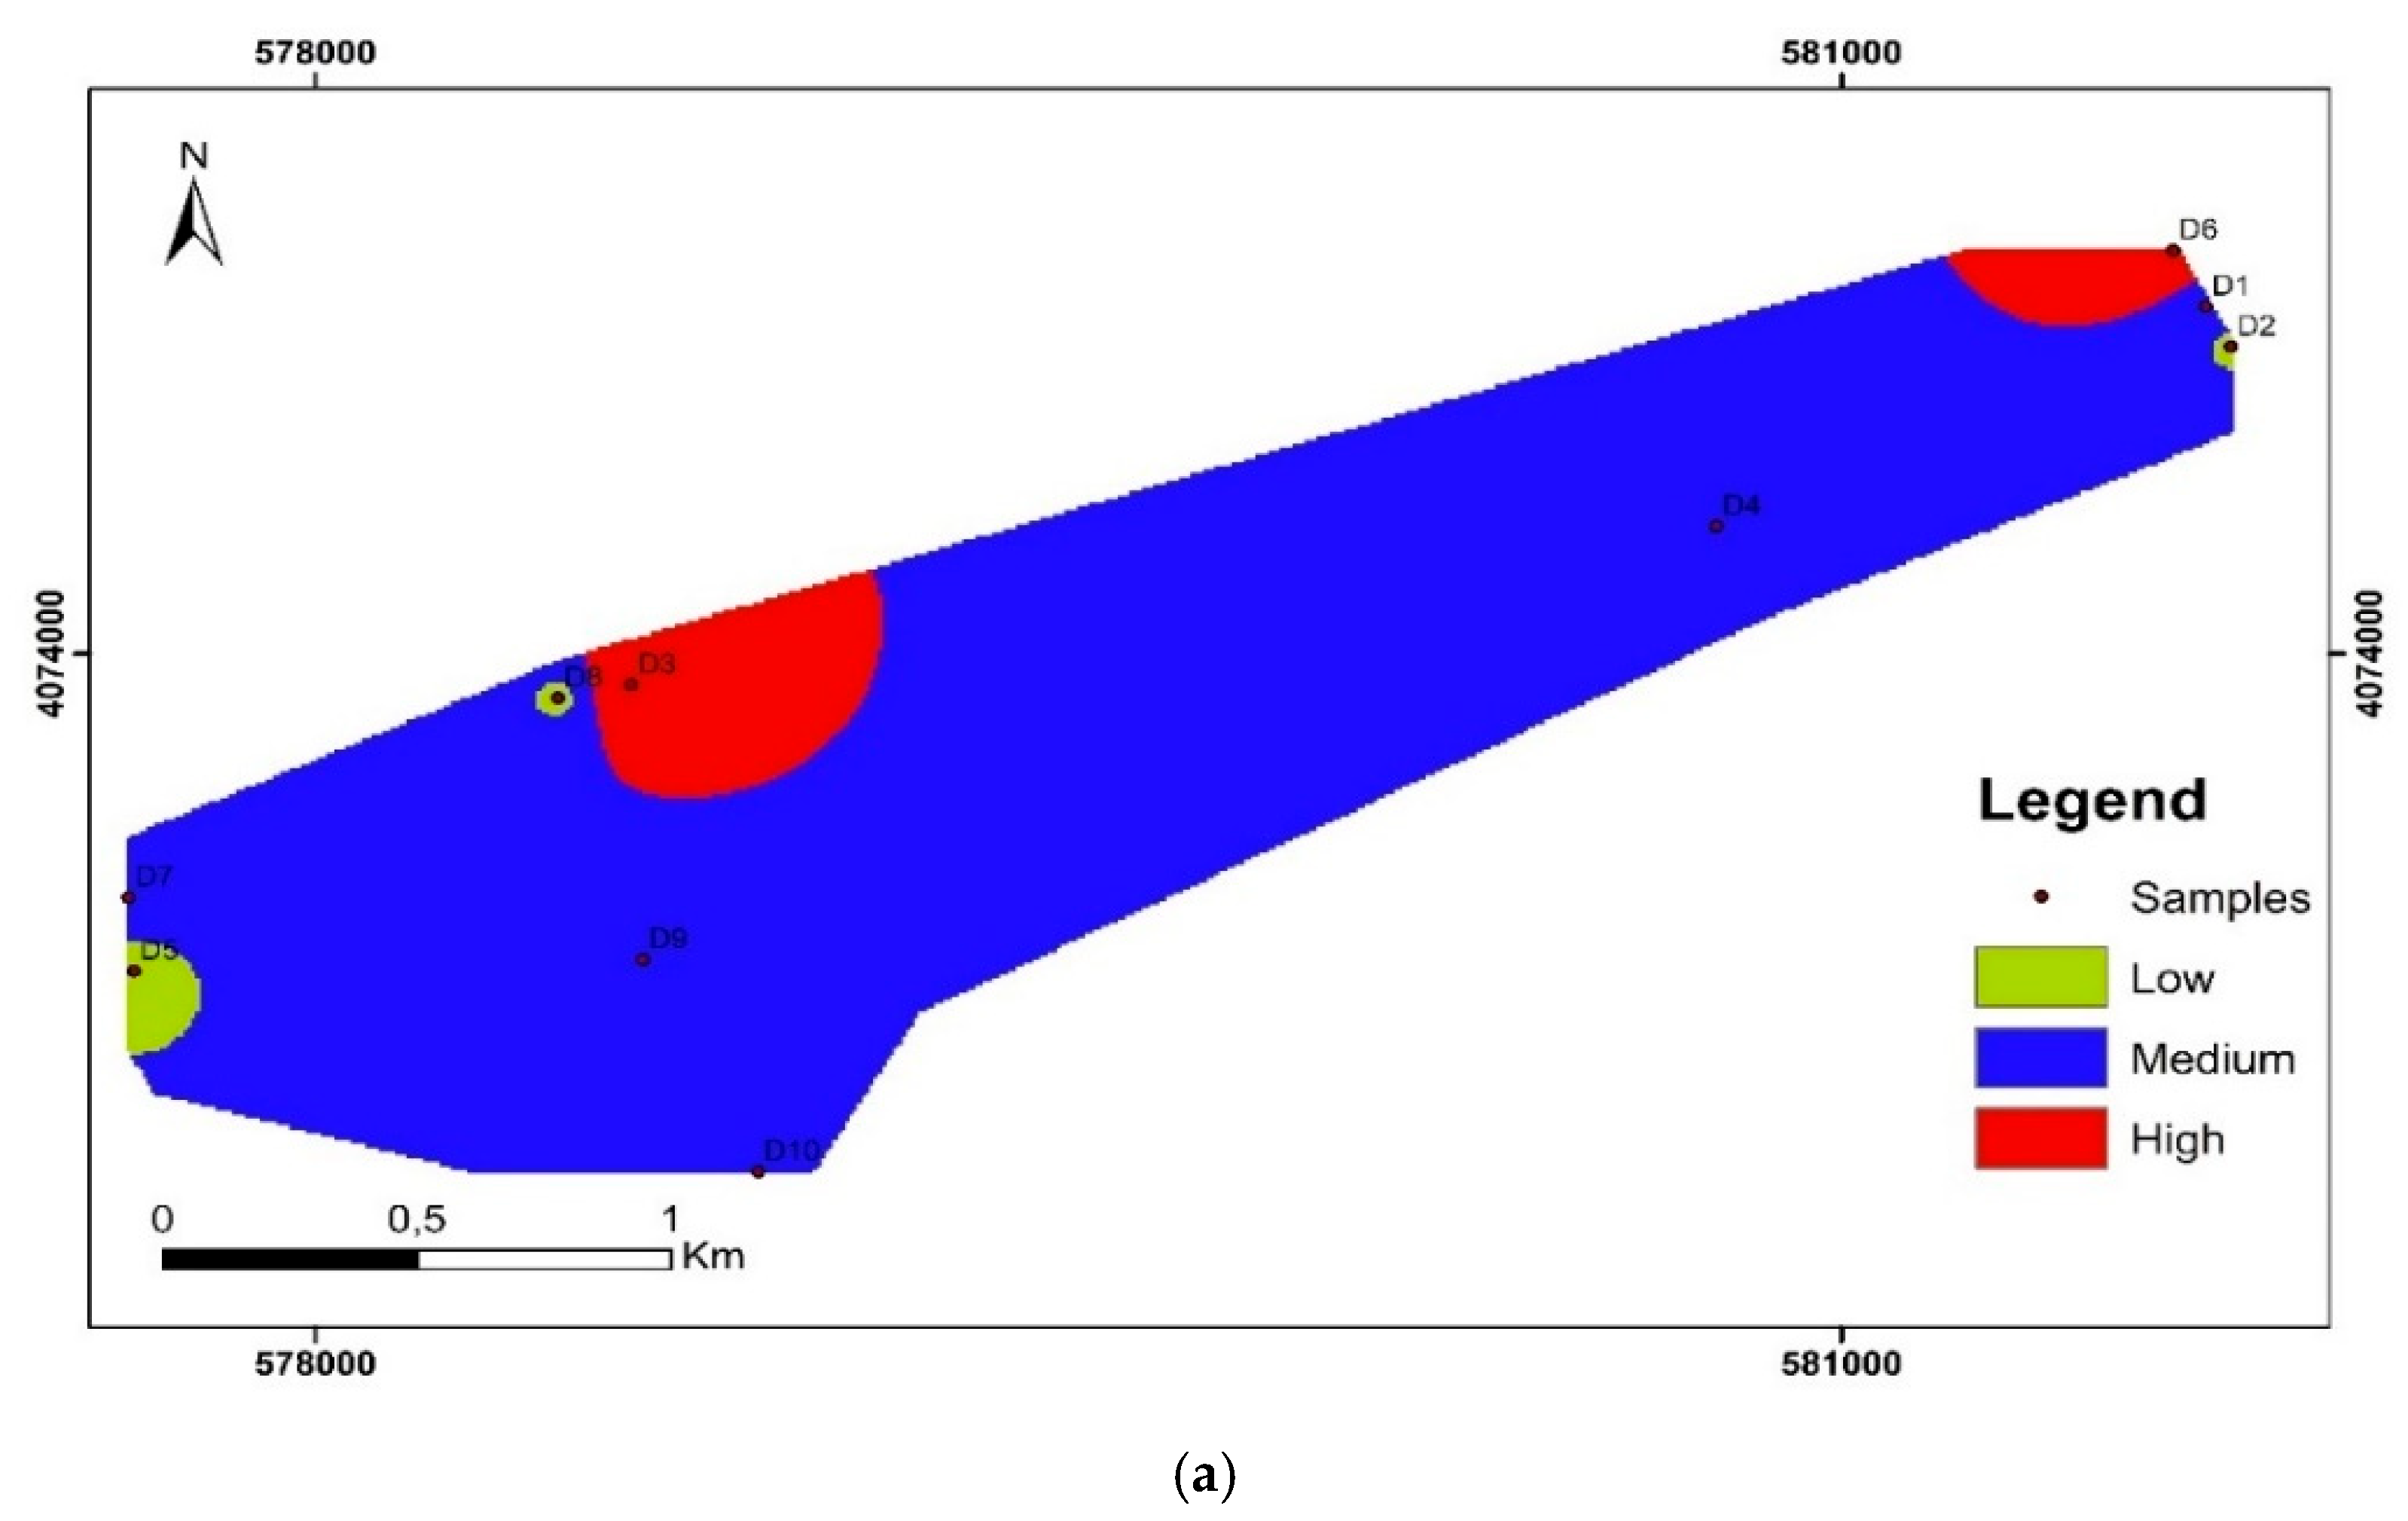
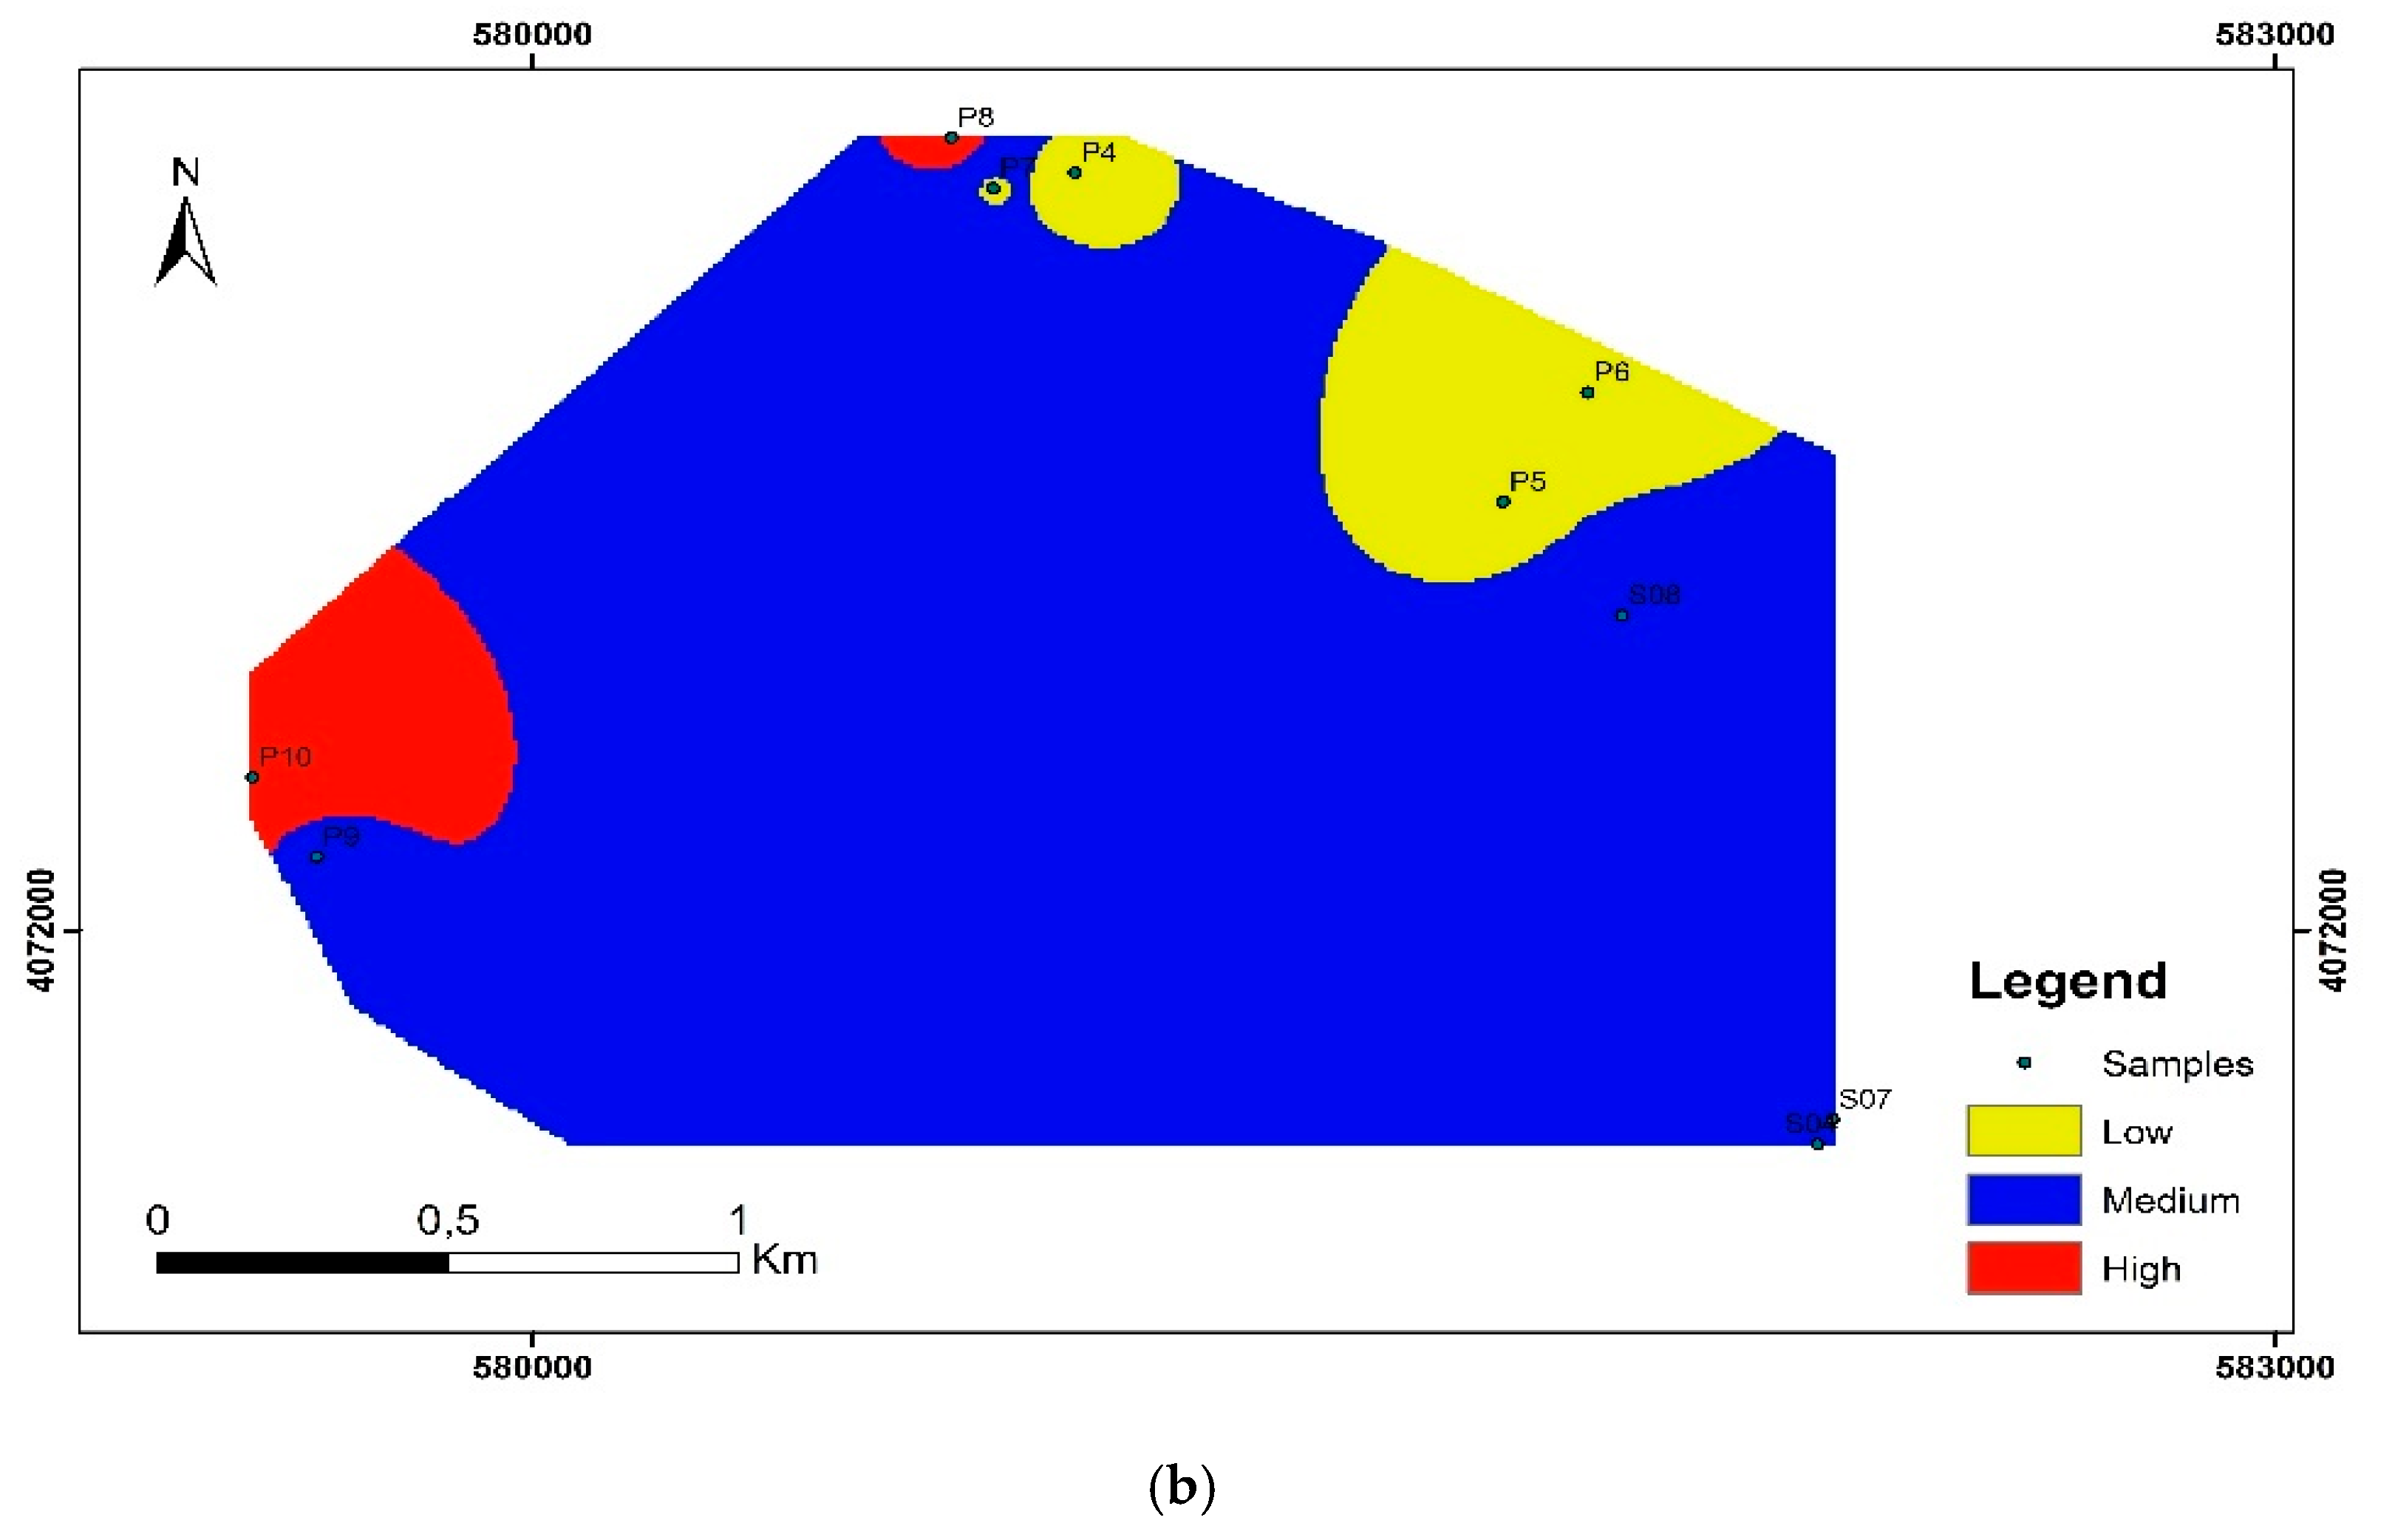
| Zahira Water Samples | KR | Mansoura Water Samples | KR |
|---|---|---|---|
| D1 | 13.67 | S1 | 2.01 |
| D2 | 18.61 | S2 | 2.59 |
| D3 | 19.76 | S3 | 1.26 |
| D4 | 29.75 | S4 | 1.69 |
| D5 | 3.94 | S5 | 1.80 |
| D6 | 33.90 | S6 | 1.92 |
| D7 | 9.58 | S7 | 1.82 |
| D8 | 16.63 | S8 | 1.93 |
| D9 | 11.50 | S9 | 1.55 |
| D10 | 13.20 | S10 | 2.60 |
| D11 | 10.19 | S11 | 3.34 |
| D12 | 8.90 |
Disclaimer/Publisher’s Note: The statements, opinions and data contained in all publications are solely those of the individual author(s) and contributor(s) and not of MDPI and/or the editor(s). MDPI and/or the editor(s) disclaim responsibility for any injury to people or property resulting from any ideas, methods, instructions or products referred to in the content. |
© 2025 by the authors. Licensee MDPI, Basel, Switzerland. This article is an open access article distributed under the terms and conditions of the Creative Commons Attribution (CC BY) license (https://creativecommons.org/licenses/by/4.0/).
Share and Cite
Hmidi, O.; Srarfi, F.; Brahim, N.; Dazzi, C.; Lo Papa, G. Assessment of Soil and Water Quality Indices in Agricultural Soils of Manouba Governorate, North-East Tunisia. Soil Syst. 2025, 9, 105. https://doi.org/10.3390/soilsystems9030105
Hmidi O, Srarfi F, Brahim N, Dazzi C, Lo Papa G. Assessment of Soil and Water Quality Indices in Agricultural Soils of Manouba Governorate, North-East Tunisia. Soil Systems. 2025; 9(3):105. https://doi.org/10.3390/soilsystems9030105
Chicago/Turabian StyleHmidi, Oumayma, Feyda Srarfi, Nadhem Brahim, Carmelo Dazzi, and Giuseppe Lo Papa. 2025. "Assessment of Soil and Water Quality Indices in Agricultural Soils of Manouba Governorate, North-East Tunisia" Soil Systems 9, no. 3: 105. https://doi.org/10.3390/soilsystems9030105
APA StyleHmidi, O., Srarfi, F., Brahim, N., Dazzi, C., & Lo Papa, G. (2025). Assessment of Soil and Water Quality Indices in Agricultural Soils of Manouba Governorate, North-East Tunisia. Soil Systems, 9(3), 105. https://doi.org/10.3390/soilsystems9030105


