Abstract
Artificial intelligence has made remarkable progress across numerous domains, including physics, where machine learning and deep learning methods have become increasingly common. In high-energy physics, these approaches have significantly advanced tasks like event reconstruction, pattern recognition, and large-scale data analysis. The present study explores the application of machine learning techniques to the classification of electromagnetic and hadronic showers in space calorimeter experiments. Leveraging Monte Carlo simulations and a dedicated feature engineering, the findings demonstrate the strong potential of AI to improve classification performance in space calorimetry.
1. Introduction
Cosmic rays are highly energetic particles, mostly protons and atomic nuclei, that constantly reach the Earth from outer space. When they interact with the atmosphere or with detectors, they produce cascades of secondary particles whose measurement provides key information about their origin and composition. Calorimeters, which are detectors designed to measure the energy of these particles through their energy deposition in dense materials, play a crucial role in this field. Cosmic rays provide critical insights into high-energy processes in our galaxy and beyond. Their study enables the investigation of extreme astrophysical phenomena, such as supernova explosions, active galactic nuclei, and potential signatures of dark matter. Accurate determination of their origin, composition, and propagation benefits measurements above the Earth’s atmosphere. Satellite-based detectors allow for direct observations of charged particles and photons up to knee energy (few PeV for charged particles). As space missions become increasingly complex, integrating artificial intelligence (AI) technologies is essential for optimizing their performance and enhancing scientific outcomes. This study focuses on the use of machine learning techniques for calorimeters in space-based experiments. It is important for space-based calorimeter experiments to distinguish between different particle types, such as electrons and protons. In particular, this work focuses on the energy range from a few GeV up to 1 TeV, where the abundance of cosmic ray electrons is significantly lower—by a factor of to —compared to that of cosmic ray protons. This disparity makes precise measurement of the electron spectrum a challenging task. To address this challenge, we propose a novel classification approach leveraging machine learning techniques—specifically Transformer models [1] and the XGBoost algorithm [2] —to enhance particle identification performance in space-based calorimetry experiments. Similar architectures have already been successfully employed at the LHC for jet tagging applications [3].
The HERD (High Energy cosmic-Radiation Detection facility) experiment [4], described later, has been chosen as a test bench for this application, since its custom simulation framework (HerdSoftware), built upon the Geant4 Monte Carlo toolkit, accurately models particle interactions and energy deposition in the detector materials, providing a comprehensive and realistic description of the detector and the interactions of particles with its components [5].
This paper is organized as follows:
- Section 2 provides a brief overview of the HERD experiment,
- Section 3 details the AI-driven analysis pipeline for the calorimeter including data processing and algorithms implementation considered in this paper,
- Section 4 presents the preliminary results obtained from the two machine learning techniques.
2. HERD Experiment as Test Bench
HERD experiment is an upcoming space mission designed for the direct detection of cosmic rays, planned for deployment from the Chinese Space Station in 2027 [6]. The detector will feature a fully homogeneous, isotropic, and finely segmented three-dimensional calorimeter, complemented by multiple sub-detectors for charge, timing, and tracking measurements.
Thanks to its innovative design, HERD will be able to detect particles from five directions, resulting in a large geometric acceptance. Combining it with excellent energy resolution, the HERD geometric factor is expected to be roughly an order of magnitude higher than that of current space-based experiments dedicated to charged particles measurements. This enhanced sensitivity will enable HERD to measure the cosmic ray proton flux up to energies of 1 PeV.
The HERD apparatus is composed of several sub-detectors, organized from the innermost to the outermost:
- CALO: the central calorimeter is the core of the experiment, used to measure particle energies and to distinguish electrons from protons and heavier nuclei. It consists of approximately 7500 LYSO cubic scintillating crystals, each 3 cm per side [7];
- FIT: the FIber Tracker surrounds the CALO on the top and four lateral sides. It is designed for particle tracking and charge measurement and consists of five tracking sectors, each with seven X-Y double layers of closely packed scintillating fibers, allowing for seven independent position measurements of traversing charged particles [8];
- PSD: the Plastic Scintillator Detector is made of plastic scintillator bars and measures particle charges also serving as a trigger for low-energy gamma rays [9];
- SCD: the Silicon Charge Detector is a micro-strip silicon detector for precise particle tracking and charge measurement [10];
- TRD: the Transition Radiation Detector is positioned on one side of the detector and consists of THick Gaseous Electron Multipliers (THGEM), primarily used for calibration of TeV nuclei [11].
A schematic figure of the detector is shown in Figure 1.
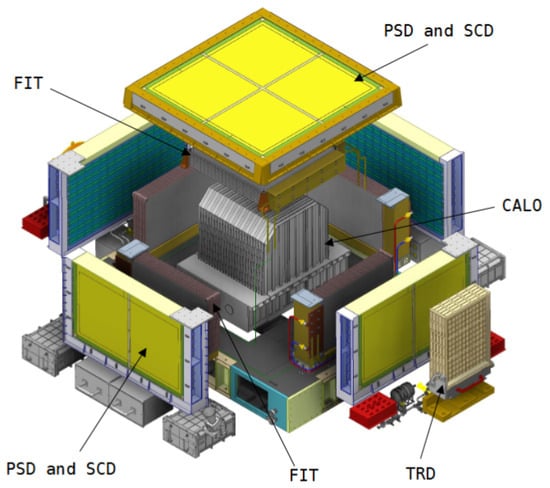
Figure 1.
Schematic picture of HERD apparatus [7].
The HERD Simulation Dataset
The full HERD simulation dataset, generated using the custom HerdSoftware framework, comprises 4,300,000 events, evenly split between 2,150,000 electron events and 2,150,000 proton events. This balanced dataset provides a robust basis for testing classification algorithms under controlled conditions. In order to investigate possible differences in classification performance across energy scales, the dataset was further divided into two balanced subsets: the low-energy range (1 GeV–100 GeV) and the high-energy range (100 GeV–1 TeV). All events are simulated according to a power-law energy spectrum , spanning from 1 GeV to 1 TeV, and distributed within a spherical region surrounding the detector.
3. Pipeline for AI Electron and Proton Discrimination Algorithm
The classification pipeline begins with the extraction of relevant features from the simulated HERD events, two distinct sets of features were defined for the analysis, tailored to the two machine learning approaches considered: Transformers and XGBoost.
For the Transformer-based model, the input consists of low-level detector information. In particular, each event is represented by the spatial coordinates of the activated calorimeter pixels and by the corresponding deposited energies. This raw description of the shower development preserves the full granularity of the detector response, enabling the model to learn directly from the underlying spatial-energy patterns.
For the XGBoost classifier, the input instead relies on higher-level physics variables reconstructed from the calorimeter signals. These include:
- Lateral moment until the fourth order: quantifies the spread of energy deposition perpendicular to the shower axis, providing insight into the transverse size of the shower;
- Longitudinal moment until the fourth order: characterizes the distribution of energy along the depth of the calorimeter, reflecting the shower development along its axis;
- Longitudinal energy profile: which encodes the energy deposition pattern across successive calorimeter layers.
In both cases, all input features were normalized in the range [0, 1] to ensure stable training and to improve convergence of the models.
3.1. The Transformer Classification Algorithm Definition
Transformers are deep learning architectures originally developed for natural language processing, where their attention mechanism enables the efficient modeling of long-range dependencies [1]. Their ability to extract correlations between sequence elements makes them particularly well-suited for analyzing spatially distributed data. In our application, we employ them to classify events based on calorimeter pixel information. Each event is represented by the list of activated pixels and their associated energy deposit, which form the sequential input to the model. The decoder component has been omitted, highlighting how the modular nature of Transformers can be adapted to applications beyond natural language processing. A schematic overview of the original Transformer architecture is provided in Figure 2.
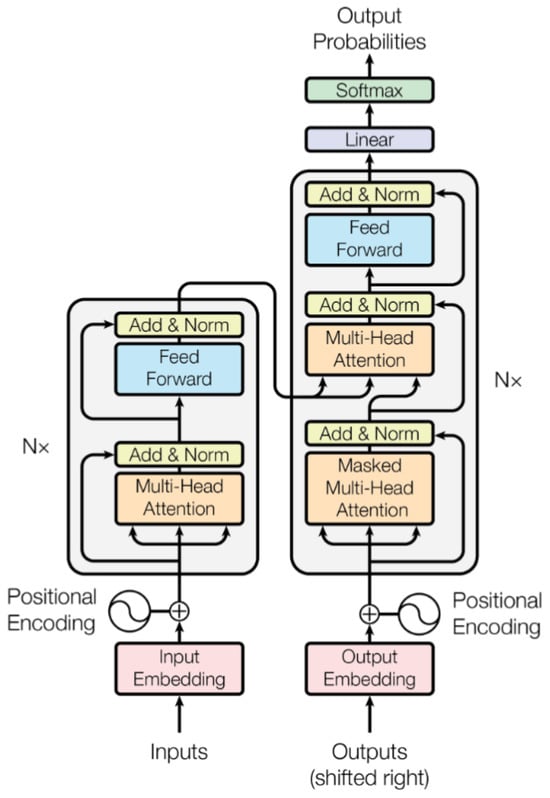
Figure 2.
The Transformer—model architecture [1], specifically designed for generating sequences.
The TransformerClassifier model is a custom architecture specifically developed in this work for the binary classification of particle events, a schematic representation of its architecture is shown in Figure 3, and consists of the following:
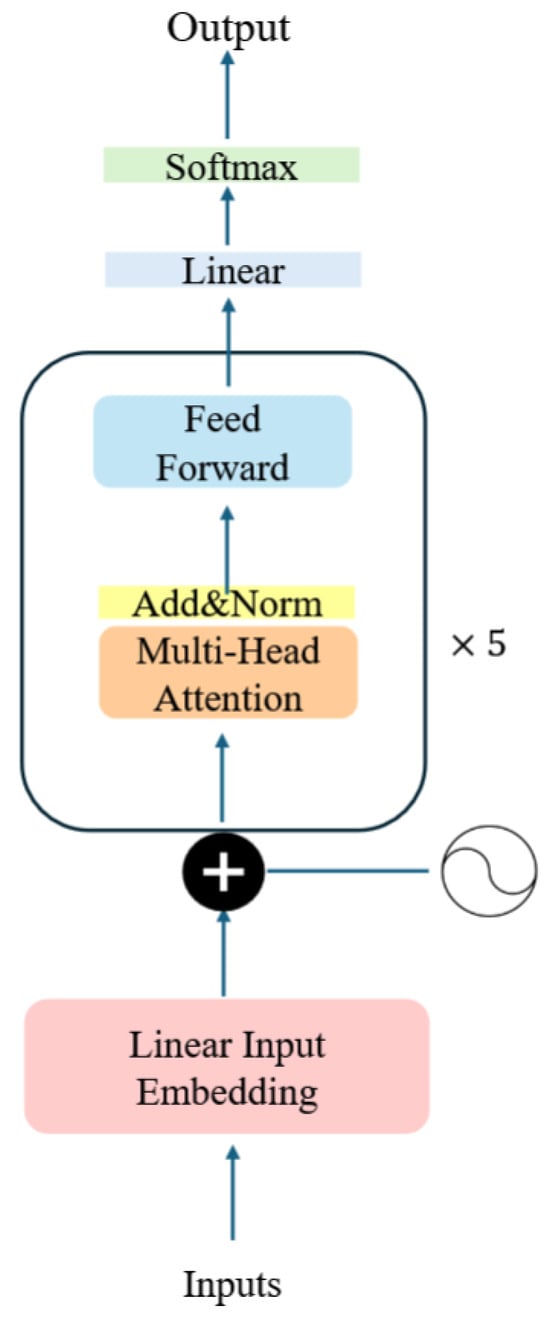
Figure 3.
Architecture of the TransformerClassifier, a custom model tailored for the binary classification of particle events.
- Embedding Layer: Input features are first projected into a higher-dimensional space through a linear embedding layer. This step expands the representational capacity of the model, enabling the subsequent layers to better capture non-trivial correlations in the data.
- Positional Encoding: Since the Transformer framework does not inherently encode sequential or spatial relationships, positional encodings are added to the embedded vectors to convey information about the relative position of each element in the input sequence. In this work, we implemented a custom function that generates fixed sine–cosine positional encodings and adds them to the input embeddings. These encodings use sinusoidal functions at different frequencies, enabling the model to infer distances and relative ordering between elements from their phase relationships. In practice, this allows the Transformer to distinguish, for instance, between energy deposits occurring in different pixels of the calorimeter, even though all inputs are processed in parallel.
- Transformer Encoder: The central component is a stack of five Transformer encoder layers. Each layer contains two sub-blocks: a multi-head self-attention mechanism, which learns long-range dependencies between sequence elements, and a position-wise feed-forward network, which enhances the model’s ability to capture complex high-dimensional structures. Residual connections and layer normalization are automatically handled by the PyTorch (version 2.6.0) nn.TransformerEncoderLayer implementation [12].
- Classification Layer: The encoder outputs are aggregated by computing their mean along the sequence dimension, yielding a fixed-size feature vector. This vector is passed to a fully connected layer that produces the final binary classification output.
For model optimization, we employed the Optuna library [13], which performs hyperparameter search using Bayesian optimization. The full set of tested hyperparameters and their ranges is reported in Table 1, while the optimal configuration identified during the search is summarized in Table 2. Model selection was guided by validation accuracy, with the best-performing configuration chosen as the final architecture.

Table 1.
Hyperparameters considered in the Bayesian search and their values for the TransformerClassifier.
Table 2.
Optimal hyperparameters and best accuracy obtained using Optuna.
3.2. The XGBoost Classification Algorithm
XGBoost is an optimized gradient boosting framework that constructs ensembles of decision trees in a highly efficient manner, making it particularly suitable for handling structured data. It is well known for its ability to combine hand-engineered features with strong predictive performance, while ensuring scalability to large datasets. In this work, a dedicated feature engineering process was carried out to derive a set of physically motivated variables from the calorimeter signals, tailored to maximize the discriminative power between electromagnetic and hadronic showers. The first group of features are the longitudinal and lateral moments of order n.
Equation (1) defines the longitudinal moment of order n: where the sum runs over all calorimeter cells i. Here, denotes the energy deposited in the i-th cell, is the position vector of the cell, and is the shower starting point (typically the interaction vertex). The unit vector defines the shower axis, along which the moment is calculated. This definition provides an energy-weighted characterization of the longitudinal development of the shower.
- For , corresponds to the average longitudinal displacement of the deposited energy along the shower axis.
- For , is related to the longitudinal spread (or variance) of the energy deposition.
- Higher orders () capture more detailed features of the shower profile.
Equation (2) defines the lateral moment of order n: where denotes the energy deposited in the i-th calorimeter cell, and is the transverse distance of the cell from the shower axis (defined by the unit vector passing through the shower starting point ). This quantity provides an energy-weighted characterization of the lateral development of the shower:
- For , represents the mean lateral displacement of the deposited energy with respect to the shower axis.
- For , corresponds to the lateral spread (variance) of the shower profile.
- Higher orders () capture finer details of the transverse distribution.
From a physics perspective, these features capture essential differences between electromagnetic and hadronic showers. Electromagnetic showers, initiated by electrons or photons, tend to be narrower, with a more compact lateral spread and a faster energy deposition along the calorimeter depth. In contrast, hadronic showers, induced by protons or heavier particles, typically exhibit larger fluctuations, broader lateral distributions, and a more irregular longitudinal development due to nuclear interactions. By exploiting these physically motivated observables, XGBoost can effectively learn patterns that distinguish between the two classes of events. Moreover, in addition to these variables, the longitudinal energy profile was also derived, according to the following procedure: for each calorimeter hit, its projection onto the shower axis is determined, allowing the longitudinal position relative to the shower start to be computed. The shower axis is then divided into ten segments of equal length according to Equation (3).
Within each segment, the deposited energy from all hits inside a fixed maximum radius around the axis is summed. This procedure yields the “longitudinal energy profile”, which is then normalized by dividing the total energy in each bin by the step length. The result is an energy density distribution that characterizes the shower development along its axis.
4. Results
4.1. Transformer Results
As a preliminary study, due to time efficiency, we initially trained the Transformer on a smaller dataset of 20,000 events in the energy range 100 GeV–1 TeV subset, comprising 10,000 events produced by electrons and 10,000 events produced by protons. A classic 80%–20% train-test split was applied. The model was trained for 100 epochs using the Adam optimizer [14] to minimize the binary cross-entropy loss. The result is shown in Figure 4.
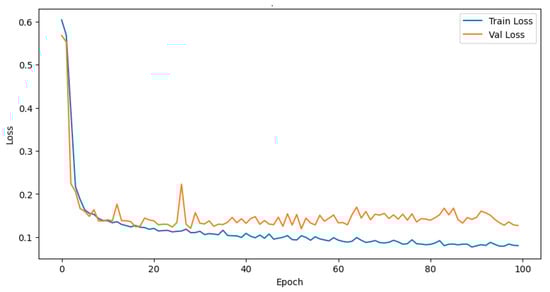
Figure 4.
Training and validation loss curves from the TransformerClassifier training. The observed overfitting and fluctuations in the curves are due to the small size of the dataset.
It is evident that overfitting and fluctuations are present, which can be attributed to the limited size of the dataset. Training on the full dataset is still under investigation to enable a more robust evaluation, leveraging the parallelization of the Optuna search procedure. The performance metrics are summarized in Table 3.
Table 3.
TrasformerClassifier model performance metrics.
4.2. XGBoost Results
The XGBoost classification algorithm was trained and evaluated separately on two distinct energy intervals: the low-energy range from 1 GeV to 100 GeV, and the high-energy range from 100 GeV to 1 TeV. This division allows us to assess the model’s performance across different shower development regimes. The results are shown in Figure 5, and the performance metrics are listed in Table 4.
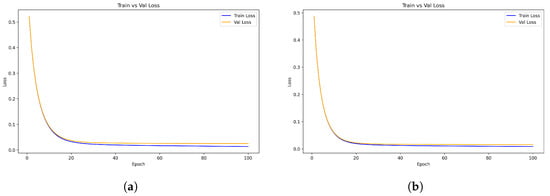
Figure 5.
Comparison of XGBoost training and validation loss curves in two different energy ranges. (a) Training and validation loss curves for the energy range 1 GeV–100 GeV; (b) Training and validation loss curves for the energy range 100 GeV–1 TeV.
Table 4.
Comparison of XGBoost performance metrics for low and high energy datasets.
5. Conclusions
We explored different machine learning approaches to classify electromagnetic and hadronic showers in the HERD calorimeter: XGBoost performed very well on physics-inspired features such as lateral moments and energy profiles; Transformers allowed the direct use of spatial and energy information from activated pixels. The two approaches show complementary strengths, suggesting that combining feature engineering and deep learning can enhance classification performance in high-granularity calorimeters.
Author Contributions
Conceptualization, F.G., F.C. and M.B.; methodology, M.B. and F.C.; software, M.B.; validation, M.B.; formal analysis, M.B.; investigation, M.B.; resources, M.B. and F.C.; data curation, M.B.; writing—original draft preparation, M.B.; writing—review and editing, M.B. and F.C.; visualization, M.B.; supervision, F.G.; project administration, F.G.; funding acquisition, F.G. All authors have read and agreed to the published version of the manuscript.
Funding
This study was supported by Italian Research Center on High Performance Computing Big Data and Quantum Computing (ICSC), project funded by European Union—NextGenerationEU—and National Recovery and Resilience Plan (NRRP)—Mission 4 Component 2 within the activities of Spoke 3 (Astrophysics and Cosmos Observations).
Data Availability Statement
The raw data supporting the conclusions of this article will be made available by the authors on request.
Acknowledgments
Special thanks for the technical support goes to G. Donvito and G. Vino from the INFN Section of Bari, and to Bernardino Spisso from the INFN Section of Naples.
Conflicts of Interest
The authors declare no conflicts of interest.
References
- Vaswani, A.; Shazeer, N.; Parmar, N.; Uszkoreit, J.; Jones, L.; Gomez, A.N.; Kaiser, L.; Polosukhin, I. Attention Is All You Need. arXiv 2017, arXiv:1706.03762. [Google Scholar]
- Chen, T.; Guestrin, C. XGBoost: A Scalable Tree Boosting System. In Proceedings of the 22nd ACM SIGKDD International Conference on Knowledge Discovery and Data Mining, ACM, KDD ’16, San Francisco, CA, USA, 13–17 August 2016; pp. 785–794. [Google Scholar] [CrossRef]
- Wang, A.; Gandrakota, A.; Ngadiuba, J.; Sahu, V.; Bhatnagar, P.; Khoda, E.E.; Duarte, J. Interpreting Transformers for Jet Tagging. arXiv 2024, arXiv:2412.03673. [Google Scholar] [CrossRef]
- Zhang, S.N.; Adriani, O.; Albergo, S.; Ambrosi, G.; An, Q.; Bao, T.W.; Battiston, R.; Bi, X.J.; Cao, Z.; Chai, J.Y.; et al. The high energy cosmic-radiation detection (HERD) facility onboard China’s Space Station. In Proceedings of the Space Telescopes and Instrumentation 2014: Ultraviolet to Gamma Ray, Montréal, QC, Canada, 22–26 June 2014; Takahashi, T., den Herder, J.W.A., Bautz, M., Eds.; SPIE: Bellingham, WA, USA, 2014; Volume 9144, p. 91440X. [Google Scholar] [CrossRef]
- Mori, N. GGS: A Generic GEANT4 Simulation package for small- and medium-sized particle detection experiments. Nucl. Instruments Methods Phys. Res. Sect. Accel. Spectrometers Detect. Assoc. Equip. 2021, 1002, 165298. [Google Scholar] [CrossRef]
- Gu, Y. China space station: New opportunity for space science. Natl. Sci. Rev. 2021, 9, nwab219. [Google Scholar] [CrossRef] [PubMed]
- Betti, P. The HERD experiment: New frontiers in detection of high energy cosmic rays. PoS 2024, TAUP2023, 142. [Google Scholar] [CrossRef]
- Perrina, C.; Frieden, J.M.; Azzarello, P.; Sukhonos, D.; Wu, X.; Gascón, D.; Gómez, S.; Mauricioc, J. The scintillating-fiber tracker (FIT) of the HERD space mission from design to performance. PoS 2024, ICRC2023, 147. [Google Scholar] [CrossRef]
- Serini, D.; Altomare, C.; Alemanno, F.; Ximenes, N.A.; Barbato, F.; Bernardini, P.; Cagnoli, I.; Casilli, E.; Cattaneo, P.; Comerma, A.; et al. Characterization of the nuclei identification performances of the plastic scintillator detector prototype for the future HERD satellite experiment. In Proceedings of the 2023 9th International Workshop on Advances in Sensors and Interfaces (IWASI), Bari, Italy, 8–9 June 2023; pp. 184–189. [Google Scholar] [CrossRef]
- Silvestre, G. The Silicon Charge Detector of the High Energy Cosmic Radiation Detection experiment. J. Inst. 2024, 19, C03042. [Google Scholar] [CrossRef]
- Liu, X.; Adriani, O.; Bai, X.h.; Bai, Y.l.; Bao, T.W.; Berti, E.; Betti, P.; Bottai, S.; Cao, W.W.; Casaus, J. Double read-out system for the calorimeter of the HERD experiment. In Proceedings of the 38th International Cosmic Ray Conference (ICRC2023), Nagoya, Japan, 26 July–3 August 2023; p. 097. [Google Scholar] [CrossRef]
- Paszke, A.; Gross, S.; Massa, F.; Lerer, A.; Bradbury, J.; Chanan, G.; Killeen, T.; Lin, Z.; Gimelshein, N.; Antiga, L.; et al. PyTorch: An Imperative Style, High-Performance Deep Learning Library. arXiv 2019, arXiv:1912.01703. [Google Scholar]
- Akiba, T.; Sano, S.; Yanase, T.; Ohta, T.; Koyama, M. Optuna: A Next-generation Hyperparameter Optimization Framework. arXiv 2019, arXiv:1907.10902. [Google Scholar] [CrossRef]
- Kingma, D.P.; Ba, J. Adam: A Method for Stochastic Optimization. arXiv 2017, arXiv:1412.6980. [Google Scholar] [CrossRef]
Disclaimer/Publisher’s Note: The statements, opinions and data contained in all publications are solely those of the individual author(s) and contributor(s) and not of MDPI and/or the editor(s). MDPI and/or the editor(s) disclaim responsibility for any injury to people or property resulting from any ideas, methods, instructions or products referred to in the content. |
© 2025 by the authors. Licensee MDPI, Basel, Switzerland. This article is an open access article distributed under the terms and conditions of the Creative Commons Attribution (CC BY) license (https://creativecommons.org/licenses/by/4.0/).