Abstract
The natural frequencies and damping characterisation of a new aerospace grade composite material were investigated using a modified impulse method combined with the half power bandwidth method, which is applicable to the structures with a low damping. The composite material of interest was unidirectional carbon fibre reinforced plastic. The tests were carried out with three identical square 4.6 mm thick plates consisting of 24 plies. The composite plates were clamped along one edge in a SignalForce shaker, which applied a sinusoidal signal generated by the signal conditioner exiting the bending modes of the plates. Laser vibrometer measurements were taken at three points on the free end so that different vibrational modes could be obtained: one measurement was taken on the longitudinal symmetry plane with the other two 35 mm on either side of the symmetry plane. The acceleration of the clamp was also recorded and integrated twice to calculate its displacement, which was then subtracted from the free end displacement. Two material orientations were tested, and the first four natural frequencies were obtained in the test. Damping was determined by the half-power bandwidth method. A linear relationship between the loss factors and frequency was observed for the first two modes but not for the other two modes, which may be related to the coupling of the modes of the plate and the shaker. The experiment was also modelled by using the Finite Element Method (FEM) and implicit solver of LS Dyna, where the simulation results for the first two modes were within 15% of the experimental results. The novelty of this paper lies in the presentation of new experimental data for the natural frequencies and damping coefficients of a newly developed composite material intended for the vibration analysis of rotating components.
1. Introduction
The use of advanced composite material in aerospace structures has been steadily increasing due to the high strength to weight and stiffness to weight ratios, allowing for up to 80% lighter design solutions compared to the metallic equivalents. However, their complex anisotropic and heterogeneous behaviour requires thorough characterisation to ensure safe and efficient design. Damping is a critical property in dynamic analysis, especially for rotating machinery operating near resonance. One of these important properties is damping, which is significant for the dynamic analysis, particularly for rotating machines, which may often operate near the resonant frequencies.
Adams and Bacon in [1] theoretically predicted the damping properties of orthotropic beams as a function of material orientation, followed by the analysis of the transverse shear effects and different types of composites.
The vibration of the composite plates has been widely studied, including the applications of numerical methods and finite element methods (FEM) [2]. The analysis also included non-linear vibrations in initially stressed hybrid composited plates [3,4]. L. Kherredine and co-authors investigated natural modes and the damping of anisotropic free–free laminated plates using FEM and experiments and studied how the aspect ratio affects these parameters. However, they did not consider the effects of the ply orientation [2]. Analysis of the effects of the ply orientations can be found in [5,6,7]. D.J. Gorman and co-authors derived analytical solutions for the dynamic equilibrium for a range of boundary conditions [8]. Based on the work published in [2,9,10], a damped element model was developed for narrow angle, ply laminated composite beams by using the energy method. Different shape functions have been used for a range of specific boundary conditions. The numerical results were experimentally validated in [11].
Two noncontact real-time optical methods have been developed and used for the characterisation of the natural frequencies and the vibration modes in [12]. These are the full-field electronic speckle pattern interferometer (ESPI) and the point-wise Laser Doppler Vibrometer (LDV) technique. The former is a stable, noncontact method, based on the full-field measurement in real-time. The image of a non-excited reference plate is compared to the excited plate, and the resultant correlation patterns in the ESPI represent contours of the vibration amplitude or surface displacement. These images are digitalised and processed providing the fringe patterns at resonant frequencies so that both the resonant frequencies and vibration mode shapes can be obtained. The challenges of this procedure are poor image quality, decreased image quality with the vibration amplitude, and the lack of information about the vibration phase. Consequently, Wang and co-workers proposed the ‘amplitude-fluctuation’ ESPE (AF-ESPI) technique based on video-signal subtraction, but instead of taking the reference image from a free state, the image was taken in a vibration state [12]. This approach enhanced the image quality and reduced noise in the fringe patterns.
The LDV optical technique incorporated with the advanced vibrometer/interferometer device (the AVID) was used in [12], which is based on detection of the Doppler shift in coherent laser light aimed at a particular point on the surface of interest. This method has a high resolution (nano order) and a broad dynamic range. However, the 3D measuring response is more time consuming compared to the ESPI, as a test has to be conducted for each point of interest. The AVID system utilises circular polarisation interference configuration, significantly reducing the vibrometer size and avoiding the interference of radio frequencies. This method could be applied to measure the dynamic displacement and responses of almost every object. A dynamic signal analyser (DSA) integrated into the LDS system is also referred to as the LDV-DSA system.
The experimental results of AF-ESPI and LDV methods and the theoretical results achieved by means of FEM were compared in [12], and it was found that the experimental results were consistently greater than the numerical results at the lower frequencies, likely due to the soft sponge used in supporting the sample.
Kherrendine et al. in [2] presented a complete analysis of the damping properties of laminated composite plates relative to the plate aspect ratio. They also studied the case for two different plates with different ply orientations, number of layers, and fibre volume fractions. To achieve the first and second vibrational modes for each plate, Kherrendine supported the plates with the soft sponge blocks placed at the nodes to provide the minimum constraints and damping and assume free–free boundary conditions. The electrodynamic shaker was used for excitation, with a condenser microphone positioned over an antinode so that the frequency of the signal generator was adjusted until resonance was obtained. With the aim of determining the damping, the plate was suspended at two nodal points by means of a nylon thread. The single pulse excitation was processed by the zoom FFT analyser, and the frequency spectrum was obtained for each natural frequency [2]. Kherrendine [2] observed that the predictions of the nodal lines were accurate with respect to the FEM, except where there were close natural frequencies, in which the result is strongly dependent on the excitation position.
Three different numerical formulations were used to evaluate the vibration characteristic of the piezolaminated plates by Hsien-Yang Lin et al. in [12]. The commercial software ABAQUS ver. 5.8. was used in their study and obtained a good agreement between the numerical prediction and the experimental tests. Some vibration modes predicted for the FEM were neither observed in the AF-ESPI nor in the LDV method [12]. This could be due to the sensitivity of the equipment or the fact that the modes are not easily excitable. Two experimental methods for measuring the resonant frequencies and mode shapes of vibrating piezolaminated plates were used in [12], where the vibrations were induced by a current in the piezoelectric lamina. These methods have the advantage of noncontact, real-time, and high-resolution measurement. It was shown that, for low frequencies, the results achieved by AF-ESPI or LDV are considerably higher than in the FEM. This could be a consequence of the supporting sponge that represented a free support condition, which has a significant influence at the low frequencies. This could also be a consequence of the mode vicinity to the equipment sensitivity. Nevertheless, the errors for the measurable natural frequencies were below 10%. Berthelot, J-M, and Sefrani Y. proposed the impulse method in [6], which consists of the impact by an electromagnetic hammer onto the specimen supported as a cantilever beam in a clamp block.
The aim of the work presented here was to experimentally obtain the natural frequencies, mode shapes, and damping coefficients for a new composite plate used in the aerospace applications to support the design of rotating components such as composite blades. These data had not been available for the new composite material. More specifically, the unidirectional carbon fibre reinforced epoxy plates were designed and provided by the Impact Group of Rolls-Royce plc. To account for the effects of the stack sequence, two plate orientations were tested and the first four natural frequencies were obtained. The experiment was also modelled using FEM with the experimentally determined dynamic parameters. The numerical results were verified against the experimental results for the first four frequencies, allowing for the calculation of the natural frequencies beyond the range of the experimental results. The damping coefficients obtained in the experiments and the numerical models were provided to Rolls-Royce plc to be used in the FEM-based vibration analysis of the jet engine composite blades.
The paper consists of four sections. Following the Introduction, the Methodology of the experimental work and simulation programme are described in Section 2, whilst the complete results of the tests and the simulations are given in Section 3. The concluding remarks are presented in Section 4, whilst the simulation results data are given in Appendix A and Table A1.
2. Methodology
2.1. Experimental Work
The tests were conducted on 4.6 mm thick composite plates consisting of 24 plies with the balanced asymmetric layup. The excitation was applied using a SignalForce shaker, by Data Physics Corporation (San Jose, CA, USA) rather than an impulse hammer for better repeatability of the tests. The experiment set up is illustrated in Figure 1. The composite sample was clamped in the shaker along one edge at the same clamping depth of 20 mm, for repeatability reasons and to avoid any relative motion of the panel, see Figure 2. The maximum screw torque applied was 40 N/m, so the panel was firmly clamped without being squashed or being damaged.
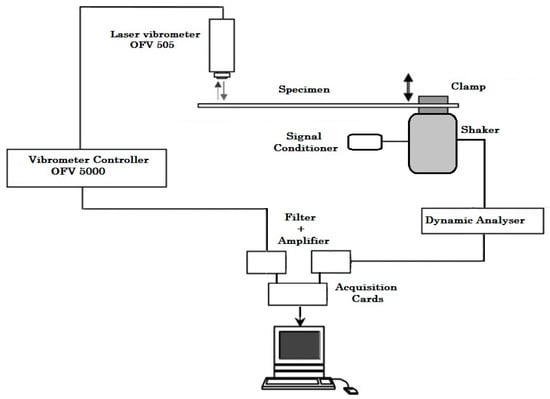
Figure 1.
Experimental set up for material characterisation. The arrows at the vibrometer illustrate the signal motion, whilst the bold arrow near clamp illustrate the shaker motion.
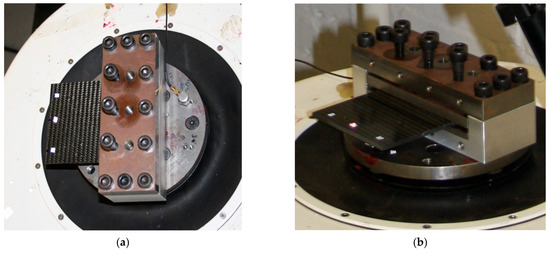
Figure 2.
Composite panel sample clamped in the shaker: (a) top view; (b) side view.
The shaker could generate the excitation frequency up to 2500 Hz, but for safety reasons, all the tests were performed up to 2000 Hz. The minimum tested frequency was set to 300 Hz and 200 Hz for two sweep rates tested to avoid shaker resonance at low frequencies. The tests were conducted with the applied sweep rate of 5 Hz/s, with one test run at the rate of 1 Hz/s to verify the influence of inertial and non-linear effects on the test. The shaker input was in the form of the sinusoidal input signal created by the signal conditioner. The signal setting for the test had a sensitivity of 10.83 and output of 100 without any filtering. The vibration amplitudes were measured at three points at the plate free end at by using laser vibrometer OFV-505 by Polytec (Harpenden, Hertfordshire, UK) [13]. The measurement points were covered with reflective stickers to improve the signal quality during the entire vibration spectrum. Reflective stickers were placed precisely at the identical location on all tested samples and were of sufficient size so that the laser was always pointing on the surface, as significant change in the reflectivity would induce false measurements.
The vibrometer controller OFV-5000 in Figure 1 was used to provide signal to the sensor head, to power the laser vibrometer, and to process the vibration signal. Its digital/analogue decoder was used to transform the analogue electrical signal from the laser to digital signal, which was subsequently filtered. The signals were converted by decoders to obtain velocity and displacement readings from the tested structure [13]. Two filter amplifiers were used to filter and amplify the laser vibrometer and shaker signals before they were sent to the acquisition cards. The acquisition cards transformed the electrical continuous signal from the different equipment to a digital signal for processing in the Labview [14]. The response and excitation signals were digitalised and processed by the dynamic analyser of signals. The analyser connected to the PC performed the acquisition of signals, control of acquisitions conditions, including frequency range and sensibility, and the analysis of the signals acquired, such as signal recording, Fourier transform, and frequency response. This system configuration allows for a real-time Fourier transform.
The acquisition system performance was determined by the maximum sampling frequency and the maximum number of samples that can be stored. The maximum sampling frequency is defined by the equipment performance, specifically 36,036 Hz of the laser vibrometer, meaning that the analysis was not limited by the laser. The velocity and displacement decoders had a suitable response up to 50 kHz with 14 bits for each channel. Consequently, the sampling number that could be acquired with calculation of the Fourier transform in real time was limited to 214 = 16,384. This number, however, could be increased up to 1.5 × 10⁶ if the signal was stored and the Fourier transform was applied offline.
Frequency range and the sweep rate of the shaker were defined in the SignalStart Vector Vibration Controller application. The shaker could withstand the induced acceleration of up to 120 g, but it was limited to a maximum gravity of 2 g so that the samples were not permanently damaged. The maximum velocity was set to 1520 mm/s and the low frequency to 5 Hz. Parameters of the sweep were in the frequency range between 300 and 2000 Hz, with a sampling rate of 5 Hz/s.
Data acquisition was conducted with Labview [14] via three channels for the frequency–time curve, the laser vibrometer velocity, and the acceleration of the clamp, which were used for the calculation of the displacement. The recording rate was the same as the laser sampling rate, meaning 36,000 scans per second, with a buffer size of 20,000 and 10,000 for the scans per loop.
Figure 3 illustrates the composite plate with the positions of the points used for velocity measurements. The three measurement points were chosen to be able to capture different vibration modes. For the sake of repeatability, three equivalent tests were carried out in the same conditions, and the results were compared. The output of the measurements was the velocity at three measuring points in the time domain, .
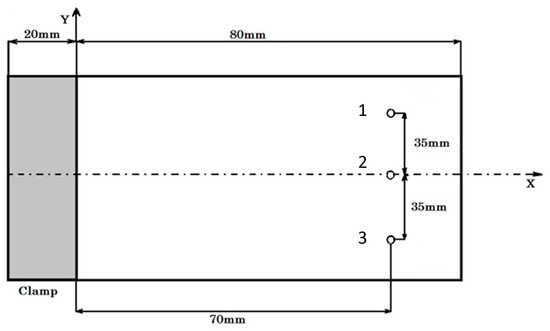
Figure 3.
Clamped composite panel for vibration test. 1 2 and 3 denote positions of the points used for velocity measurements.
The material used in the tests consisted of 24 plies and had the same balanced but not symmetric stack sequence . To check the sensitivity of the results to the laminate orientation, the tests were carried out for two orientations: Orientation 1 with the fibre orientation defined above; and Orientation 2, rotated by 900 relative to the nominal Orientation 1.
Before data was recorded, each test began with the shaker oscillating at the specified frequency and increasing the acceleration gradually until the specified acceleration of 2 g was achieved. Then the shaker began to increase the frequency according to the sweep rate input, and the data recording was started. The recorded data is imported to a Matlab R2021a for further postprocessing.
2.2. Finite Element Analysis
The experiments described in the previous section were modelled using FEM (Finite Element Methods) and the LS Dyna implicit solver [15], which is suitable for static, quasi-static, or dynamic problems with a low frequency. The LS Dyna solver uses an incremental-iterative numerical algorithm with a full Newton method scheme and eight quasi-Newton methods.
The linearised equilibrium equations of an implicit structural dynamics problem is defined as
where is the mass matrix, is the damping matrix, is the positive definite tangent stiffness matrix, is , and and are the vectors of displacement increments, velocity, and acceleration at time n + 1, respectively. and are the external load vector and stress divergence vector, respectively.
Equation (1) is solved in LS Dyna by using the Newmark-β time integration scheme:
where is time increment; and are the free parameters of integration. Numerical damping is included in the solution as a consequence of the loss of energy and momentum if
Substituting (2) into (1) leads to
where
From Equation (4), , the displacement, velocity, and acceleration vectors are updated as follows:
The equilibrium iterations begin with the following equation written in the static form as
where
The complete FEM programme consisted of two modelling approaches: (1) a plate modelled with the constrained end by using shell and solid element formulations and (2) a solid model with the plate and clamp, developed for the analysis of potential coupling modes between the clamp and the plate in the range of frequencies of interest. The latter FEM model of the composite plate and the shaker clamp is shown in Figure 4. The components were modelled using hexahedral solid elements and two discretisation densities for the composite plate: four elements through the thickness, shown in Figure 4, and eight elements through the thickness, both with Jacobian equal to 1.0. The number of solid elements used for the modelling plate was 40,000 and 320,000, respectively, whilst the total number of elements was 130,528 and 410,528. Several element formulations where investigated, with fully integrated 8-node solid elements (elform = 18) was selected in all simulations due to its accuracy. The bottom part of the clamp was fully constrained.

Figure 4.
FEM model of the composite plate (navy blue) and the shaker’s clamp.
Steel and Aluminium parts of the clamping systems were modelled using linear elastic material models, with the material properties given in Table 1, whilst the composite plates were modelled using orthotropic material models, with the equivalent material properties calculated using the lamination theory. The equivalent lamina elastic material properties used in the LS Dyna models are given in Table 2. The analysis was conducted using Block Shift and Invert Lanczos, which is a default for the LS Dyna solver [15].

Table 1.
Material properties for metallic clamp parts.
Table 2.
UD lamina elastic properties.
Viscous damping was modelled using the Damping_global function in LS Dyna, where mass weighted nodal damping was applied to all the nodes of deformable bodies. The damping coefficient was assigned using a curve in the time domain and the values for the loss factors obtained from the experiment. Namely, the force vector due to system damping is defined as
where , is the modal mass, is the natural frequency, and is the damping coefficient. Namely, is calculated as
For a low frequency domain, one can obtain the from the loss factor :
Simulations for two-plate orientation were conducted, and the results are presented in Section 3.3.
3. Results and Discussion
3.1. Natural Frequency
The row data recorded in the time domain in one experiment conducted with Orientation 1 is shown in Figure 5. The first column in the matrix is the velocity measured at the points and the second column is the acceleration recorded at the shaker clamp. One can observe that, for the symmetric points of the symmetry plane (Point 1 and Point 3), there are two peaks in the velocity recording, with the second resonance at the time around 150 s, which cannot be seen at Point 2. The result suggests that Point 2 is a node of this mode, which may either be a flexural mode in the y-axis with a node in the middle or, most likely, a torsional vibration mode.
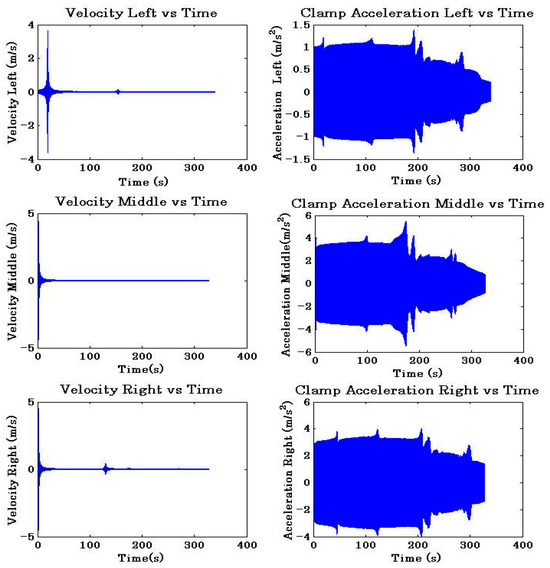
Figure 5.
Row data reading from the channels recorded at three points: Point 1 is recorded in the top row; Point 2 is recorded in the middle row; and Point 3 is recorded in the bottom row.
Although the number of data points recorded by the laser vibrometer was around 13,000,000, this amount of data is challenging, as only 1,300,000 points were used in postprocessing. The same approach was applied for the data recorded at the clamp.
Fourier transformation could be applied during the test recording, but that would lead to a significant reduction in the number of data points that can be recorded [6]. Consequently, Fourier transformations were applied offline in postprocessing, with the signals recorded in the time domain transformed to the frequency domain using the fast Fourier transformation (FFT) algorithm [6,16], available in Matlab [17], which returns the discrete Fourier transformation (DFT).
The velocity results at Point 1 and Orientation 1 in the frequency domain obtained by Fourier transformation, DAF 11-01, are shown in Figure 6. It is of note that the minimum frequency in the test was set to 300 Hz so that the curves below the minimum frequency should be discarded. The results were obtained with the working sampling frequency of 3603 Hz, i.e., 1800 Hz due to symmetry. Figure 7 shows the equivalent results in the decibel scale without any filter applied. The amplitude of the first mode of around 75 dB is 15 times larger than the amplitude of the second mode, which suggests that the first vibration mode is by far more significant for structural applications compared to the subsequent modes.
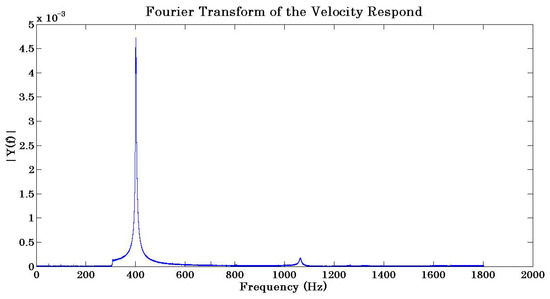
Figure 6.
Fourier transformation result of velocity recording at Point 1 with Orientation 1, DAF 11-01.
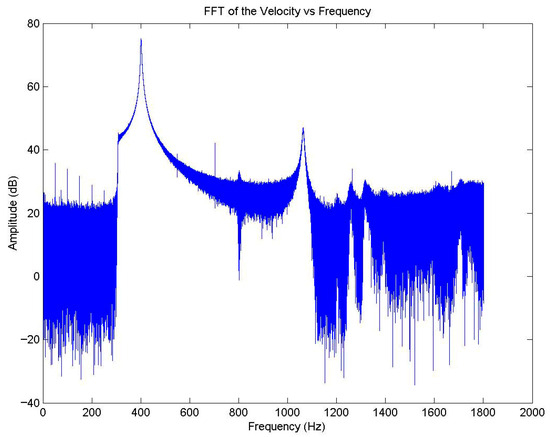
Figure 7.
Fourier transformation of the velocity at Point 1 of the daf 11-01 panel in decibel scale.
The noise in the results is due to the logarithm applied to the low amplitude values and has to be filtered out, but the obtained result is consistent with the results reported in [6] for the Fourier transformation of the beam response to an impulse loading.
The equivalent results in the test of Orientation 2 are given in Figure 8 in the time domain and frequency domain at a sweep rate of 1 Hz/s, starting from the minimum frequency of 200 Hz. It is well known that the sweep rate applied affects the results of the natural frequency due to inertia and non-linear effects, so that for the high excitation rates, the measured resonance frequency is much higher than the real natural frequency. On the other hand, the tests at the lower sweep rates are more time consuming and require a larger capacity for data recording. Consequently, the tests were conducted at 1 Hz/s and 5 Hz/s and the results obtained for the natural frequencies for the first four modes are given in Table 3. As expected, the results obtained at the higher rate are below the results obtained at the lower sweep rate, but the difference was only 0.55%, hence the subsequent results were obtained at the higher sweep rate.
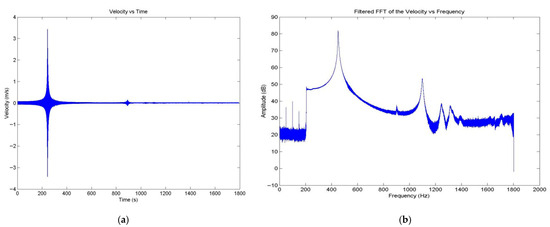
Figure 8.
Velocity results obtained with Orientation 2 at 1 Hz/s of sweep rate: (a) time domain and (b) frequency domain.
Table 3.
Frequency results for the first four modes obtained at the sweep rates of 1 Hz/s and 5 Hz/s.
The results were filtered using the Savitzky–Golay filter [17] and the one-dimensional median filter [17], where the analysis of the error was conducted based on the calculation of the integral on the curve with and without the applied filters.
The Savitzky–Golay FIR smoothing filter is available in Matlab as a function [17], where the arguments are data to be filtered in vector x, the polynomial order k must be less than the frame size f, which must be an odd number. For k = f − 1, the filter produces no smoothing. With the frame size of and a range of the polynomial orders, the calculated errors of the filtering are reported in Figure 9. It is well known that for the polynomial order higher than twelve, the matrix within the filter approaches singularity, and the results are inaccurate.
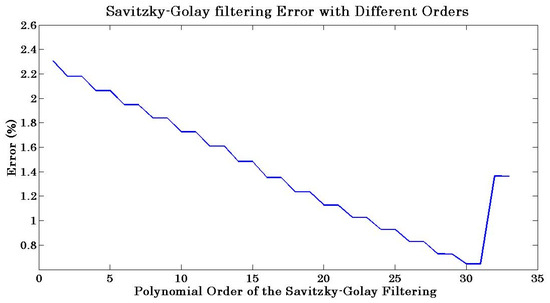
Figure 9.
Errors obtained for a range of the polynomial orders of the Savitzky–Golay filter.
For the polynomial order of and , the obtained error is 2.2%, and the resultant curve compared with the unfiltered data is shown in Figure 10.
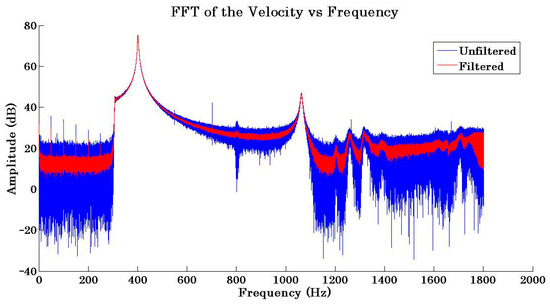
Figure 10.
FFT of the velocity with and without third-order Savitzky–Golay filter.
The one-dimensional median filter is available in Matlab as a function [17], where the arguments are the order of the one-dimensional median filter n and the data vector x. More smoothing corresponds to the higher order of the filter, with the errors for different orders presented in Figure 11. One can observe that the error stabilises around 1.8% without having mathematical singularity or other problems. Therefore, a 41 order was selected, and the filtered results with unfiltered results are shown in Figure 12.
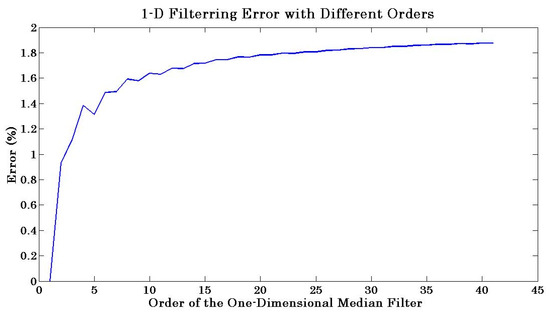
Figure 11.
Errors obtained for different polynomial orders of the one-dimensional media filter.
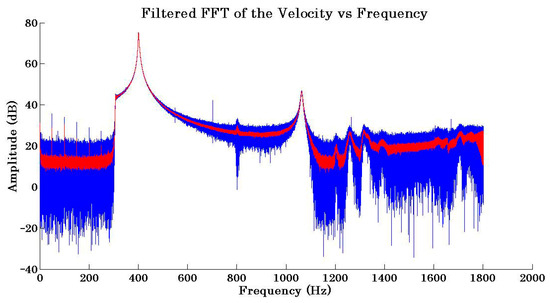
Figure 12.
FFT of the velocity with (red) and without (blue) a three-order one-dimensional median filter.
Analysis of the filtered results revealed that the Savitzky–Golay filter suffered with singularities for soft smoothed data. For the values of , the smoothed curve had an error of 2.2%, which was acceptable. However, the one-dimensional median filter was mathematically stable for the considered range and had a stable error around 1.8%. Consequently, the 41-order one-dimensional median filter was selected for data postprocessing.
For the considered test cases, the plate orientation did not have a significant effect on the overall behaviour of the shaker, as illustrated in Figure 13, where the test with Orientation 2 was deliberately started at 400 Hz to demonstrate the overlap, with the level of noise of both curves being within 15 dB.
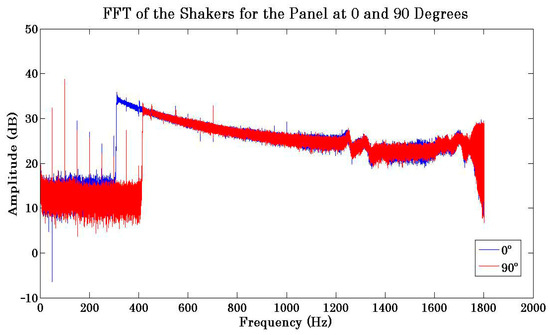
Figure 13.
FFT of the shaker’s motion during the tests with panels with Orientation 1 (blue) and Orientation 2 (red).
To compensate for the motion of the clamp, it is necessary to subtract the clamp’s displacement from the panel response. For that purpose, different integration methods of the acceleration achieved by means of the accelerometer arrangement at the clamp were considered, including the fourth order Runge–Kutta and forward and backward Euler methods, which required over a million integration steps and unacceptable accumulation of the numerical errors. To minimise the error, the measurement was taken with the laser vibrometer pointing to the clamp and the same sampling frequency aiming at the clamp, so an analogous signal was obtained and easily compared with the plate response. It was impossible to subtract the two signals directly in the time domain due to the difficulty of synching the two signals; hence, the subtraction was carried out in the frequency domain following the Fourier transformation. Analysis of the subtracted signals also revealed that this step needed to be conducted with the filtered data. Figure 14 shows the filtered plate response in the frequency domain after the subtraction of the filtered motion of the clamp where the obtained noise in the unexcited areas was below 5 dB.
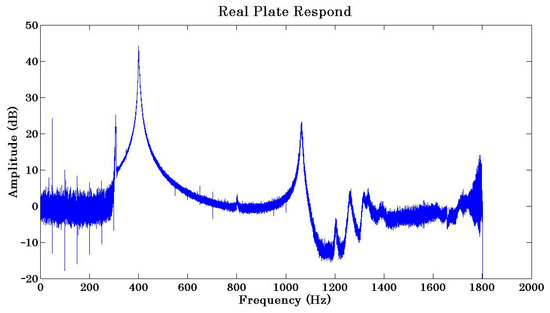
Figure 14.
FFT results for the plate response with the shaker’s motion subtracted.
3.2. Damping Results
The damping of the structure was evaluated based on the half-power bandwidth method, which finds a band of frequencies with a −3 dB amplitude, with respect to the amplitude of the natural frequency , and divides it by the natural frequency , as is shown in Equation (12):
where is the loss factor of the mode i.
Table 4 and Table 5 provide the experimental results for all natural frequencies and calculated loss factors for every test. The results also include average values and the standard deviation , calculated as
Table 4.
Natural frequencies and damping results for all tests with Orientation 1.
Table 5.
Natural frequencies and damping results for all tests with Orientation 2.
The first and second modes are at 397.4 Hz (±13.06 Hz) and 1056.5 Hz (±22.25 Hz), respectively, for Orientation 1 and 453.7 Hz (±8.42 Hz) and 1094 Hz (±20.59 Hz), respectively, for Orientation 2. It is clear that Orientation 2 is stiffer than Orientation 1.
The standard deviation of the natural frequencies is below 5%, whilst the standard deviation of the damping results is higher, with a maximum of 16.48% for the two first modes. The results obtained for the loss factor are shown in Figure 15 and consistent with the results available in the literature for the first two modes, with the damping increasing linearly with the natural frequency [6]. However, this trend does not apply for the other two frequencies, 1249.14 Hz and 1316 Hz, which might be due to the fact that these two modes are not necessarily composite plate modes but coupled with the shaker’s modes, see Figure 13.
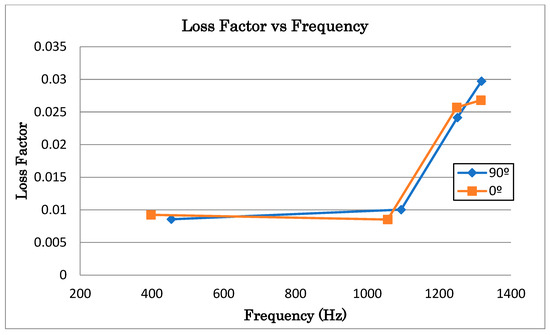
Figure 15.
Experimental results for the damping versus natural frequency of panel Orientation 1 (amber) and Orientation 2 (blue).
3.3. Finite Element Analysis Results
A FEM analysis of the experiment described above was performed to verify the experimental results and to determine the vibrational modes beyond the range of the frequencies determined experimentally. Consequently, simulation results for the first 10 natural frequences for Orientation 1 and Orientation 2 are given in Figure 16, with the data provided in Appendix A, Table A1. The first natural frequencies in all tests are above the minimum frequency at the beginning of the experiments, which justify the experimental plan. The simulation results agree well with the experimental results for the first two modes, with the discrepancy for the first and second modes being within 15% and 9%, respectively, which makes the simulation results valid. The mode shapes calculated for the two-plate orientation are shown in Figure 17 and Figure 18. The first mode is pure plate bending, whilst the second mode is symmetric bending about the longitudinal axis. The first coupling mode is obtained to be mode 6, at a frequency close to 4000 Hz for both plate orientations, which suggests that this vibrational mode was driven by the clamp response.
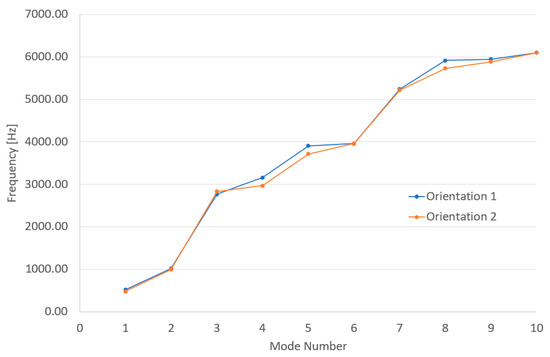
Figure 16.
The first 10 frequencies calculated for two plates orientations.
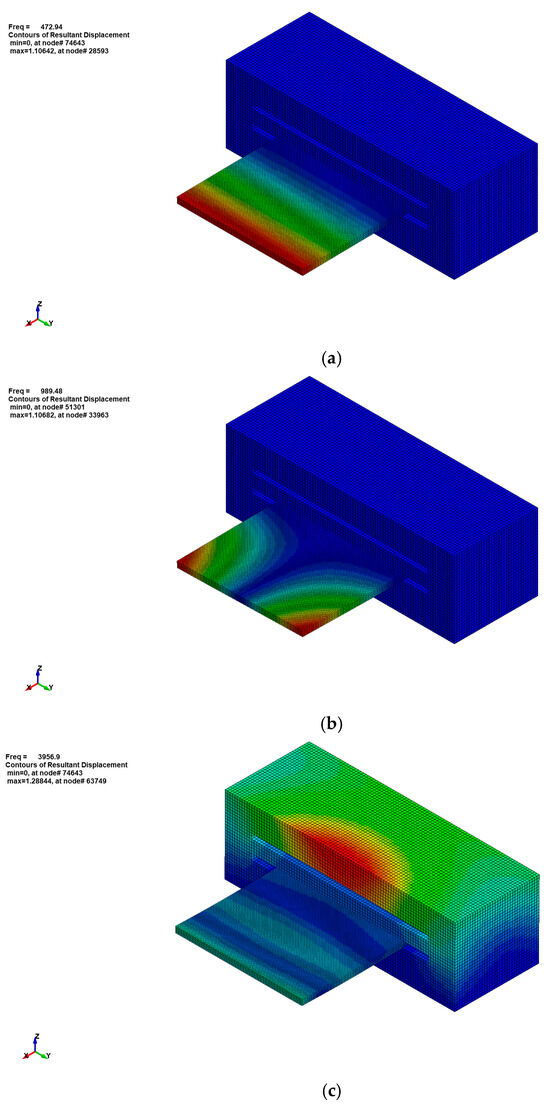
Figure 17.
FEM results for the composite panel with Orientation 1 mode shapes: (a) mode 1 with ; (b) mode 2 with ; and (c) mode 6 with .
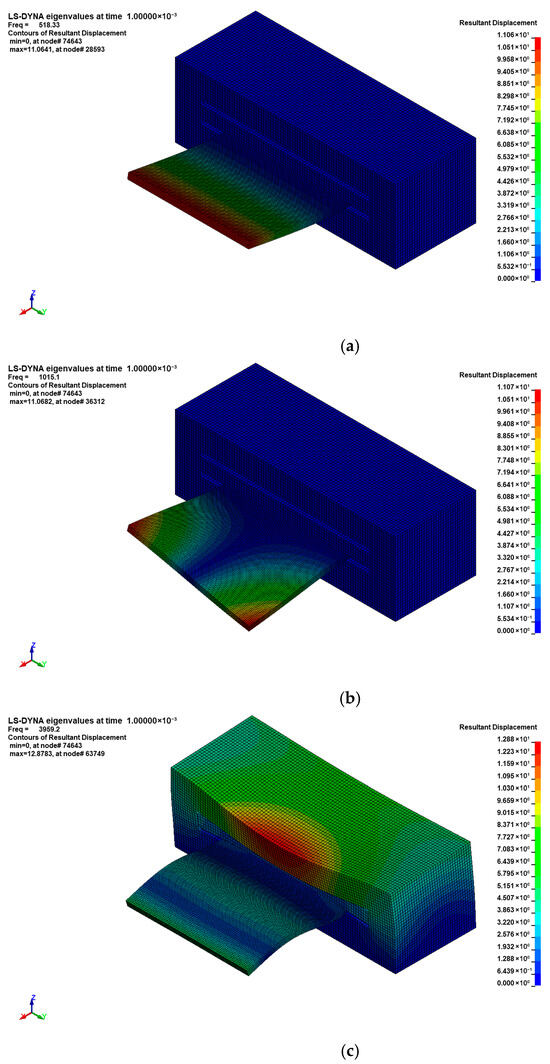
Figure 18.
FEM results for the composite panel with Orientation 2 mode shapes: (a) mode 1 with ; (b) mode 2 with ; and (c) mode 6 with .
4. Conclusions
Three aerospace composite plates were tested for two different orientations, and consistent sets of results for natural frequencies were obtained so that the repeatability was demonstrated. Two panel orientations were tested to analyse the effects of the stack sequence on the natural frequencies, and the results clearly demonstrated the influence: Orientation 2 was stiffer compared to Orientation 1. The measurements taken in the time domain were transformed into the frequency domain by using the fast Fourier transformation algorithm available in Matlab. A couple of filtering options for the data were analysed in terms of the quality of the results, and the one-dimensional median filter demonstrated the stable and good quality of the results. The first two natural frequencies were significant and used for further analysis, including the determination of the damping coefficients. The experimental results obtained for the third and fourth mode were not reliable because these modes seemed to be coupling modes between the plate and the shaker, which require further investigation.
The tests were also modelled in LS Dyna, and the first 10 natural frequencies were obtained using the implicit solver and damping coefficient calculated from the tests. The results for the first two natural frequencies agreed well with the experiment, with the maximum discrepancy in the natural frequencies being within 15%.
The key contribution of the work presented here is in new experimental data on the natural frequencies and damping coefficients of the novel composite material, which is designed for application in the vibration analysis of rotating components.
Author Contributions
Conceptualization, R.V. and N.D.; Methodology, R.V., N.D., N.F. and G.J.; Software, J.d.C.P.; Validation, R.V., N.D., J.d.C.P. and M.J.; Formal analysis, R.V., N.D., J.d.C.P., N.F., M.J. and G.J.; Investigation, N.D. and J.d.C.P.; Resources, R.V.; Data curation, N.D.; Writing—original draft, N.D.; Writing—review and editing, R.V., N.F., M.J. and G.J.; Supervision, R.V. and N.D.; Project administration, N.D. All authors have read and agreed to the published version of the manuscript.
Funding
This research received no external funding.
Data Availability Statement
The data presented in this study are available upon request from the corresponding author.
Acknowledgments
The authors would like to thank Impact Group of Rolls-Royce plc for the material provided.
Conflicts of Interest
The authors declare no conflict of interest.
Appendix A
Table A1.
Natural frequencies for two tests with two orientations.
Table A1.
Natural frequencies for two tests with two orientations.
| MODE | Orientation 1 [Hz] | Orientation 2 [Hz] |
|---|---|---|
| 1 | 5.18 × 10² | 4.73 × 10² |
| 2 | 1.02 × 10³ | 9.89 × 10² |
| 3 | 2.77 × 10³ | 2.83 × 10³ |
| 4 | 3.16 × 10³ | 2.97 × 10³ |
| 5 | 3.91 × 10³ | 3.71 × 10³ |
| 6 | 3.96 × 10³ | 3.96 × 10³ |
| 7 | 5.24 × 10³ | 5.21 × 10³ |
| 8 | 5.91 × 10³ | 5.73 × 10³ |
| 9 | 5.94 × 10³ | 5.88 × 10³ |
| 10 | 6.10 × 10³ | 6.10 × 10³ |
References
- Admas, R.; Bacon, D. Effect of fiber orientation and laminate geometry on the dynamic properties of CFRP. J. Compos. Mater. 1973, 7, 402–408. [Google Scholar] [CrossRef]
- Kherredine, L.; Gouasmi, R.; Zeghib, N.E. Evaluation and measurement of the damping properties of laminated CFRP composite plates. In IOP Conference Series: Materials Science and Engineering; IOP Publishing: Bristol, UK, 2012; Volume 28. [Google Scholar]
- Chen, C.-S.; Fung, C.-P. Non-Linear vibration of initially stressed hybrid composite plates. J. Sound Vib. 2004, 274, 1013–1029. [Google Scholar] [CrossRef]
- Singh, G.; Rao, G.V. Non-Linear vibrations of simply supported rectangular cross-ply plates. J. Sound Vib. 1990, 154, 213–226. [Google Scholar] [CrossRef]
- Adams, R.; Maheri, M.R. Dynamic flexural properties of anisotropic fibrous composite beams. Compos. Sci. Technol. 1994, 50, 497–514. [Google Scholar] [CrossRef]
- Berthelot, J.; Sefrani, Y. Damping analysis of unidirectional glass and Kevlar fibre composites. Compos. Sci. Technol. 2004, 64, 1261–1278. [Google Scholar] [CrossRef]
- Yim, J.H.; Jang, B.Z. An analytical method for prediction of the damping in symmetric balanced laminated composites. Polym. Compos. 1999, 20, 192–199. [Google Scholar] [CrossRef]
- Gorman, D. Exact Solution for the Free In-plane Vibration of Rectangular Plates with Two Opposite Simply Supported. J. Sound Vib. 2006, 294, 131–161. [Google Scholar] [CrossRef]
- Adams, R.; Bacon, D. Measurement of the flexural damping capacity and dynamic Young’s modulus if metals and reinforced plastics. J. Phys. D Appl. Phys. 1973, 6, 27–41. [Google Scholar] [CrossRef]
- Adam, R.; Fox, M.; Floor, R.; Friend, R.; Hewitt, R. The dynamic properties of unidirectional carbon and glass fiber reinforced plastics in torsion and flexure. J. Compos. Mater. 1969, 3, 594–603. [Google Scholar] [CrossRef]
- Ni, R.G.; Adams, R.D. The Damping and Dynamic Moduli of Symmetric Laminated Composite Beams—Theoretical and Experimental Results. J. Compos. Mater. 1984, 18, 104–121. [Google Scholar] [CrossRef]
- Lin, H.-Y.; Huang, J.-H.; Ma, C.-C. Vibration analysis of angle-ply laminated composite plates with an embedded piezoceramic layer. IEEE Trans. Ultrason. Ferroelectr. Freq. Control 2003, 50, 1084–1099. [Google Scholar] [PubMed]
- Polytec. OFV-5000 Vibrometer Controller and OFV-505/503; Polytec: Waldbronn, Germany.
- LabVIEW User Manual; National Instruments: Austin, TX, USA, 2003.
- Hallquist, J.O. LS-DYNA Theory Manual; Livermore Software Technology Corporation: Livernore, CA, USA, 2006. [Google Scholar]
- Bergland, G.D. A Guided Tour of the Fast Fourier Transform. IEEE Spectr. 2009, 6, 41–52. [Google Scholar] [CrossRef]
- “Matlab Help,” MathWorks. Available online: https://www.mathworks.com/help/matlab/index.html?s_tid=hc_panel (accessed on 2 November 2025).
Disclaimer/Publisher’s Note: The statements, opinions and data contained in all publications are solely those of the individual author(s) and contributor(s) and not of MDPI and/or the editor(s). MDPI and/or the editor(s) disclaim responsibility for any injury to people or property resulting from any ideas, methods, instructions or products referred to in the content. |
© 2025 by the authors. Licensee MDPI, Basel, Switzerland. This article is an open access article distributed under the terms and conditions of the Creative Commons Attribution (CC BY) license (https://creativecommons.org/licenses/by/4.0/).