1. Introduction
The InBridge4EU project (
https://inbridge4eu.eu/) started on 1 September 2023. The project is funded by Europe’s Rail Joint Undertaking under Horizon Europe research and innovation program. The overall objective of InBridge4EU is to develop a dynamic interface between railway bridges and rolling stock by proposing new methods that are compatible with existing regulations—namely, INF TSI [
1], LOC&PAS TSI [
2], EN 15528 [
3], EN 1990-Annex A2 [
4], and EN 1991-2 [
5]—while also addressing the analysis of existing infrastructures, whose role is critical for the sustainability of the European rail system. The project is articulated in seven work packages, including the following objective: identification of critical bridge parameters for the assessment of the economic impact of the new dynamic train categories (DTCs).
During the first year of the project, an extensive and representative set of European railway bridges was selected, and relevant data were retrieved and stored in a database. Starting from the beginning of the second year, time-step calculation (TSC) transient dynamic analyses were performed over the complete database under real train models/multiple unit (MU) classes and under the new DTCs. Based on the analysis of the database, realistic worst-case combinations of critical parameters will be identified for use in parametric studies. From the detection and evaluation of the bridges that do not meet the economic technical acceptance criteria, an estimation of the resources required for implementing each DTC on a particular line will be presented. Relevant results will also be presented regarding the suitability of the classical beam model, along with various model updates, for analyzing specific bridge configurations.
So far, ten railway lines from five EU countries have been selected, covering different maximum design speeds. Relevant information from about 50 bridges per line has been retrieved with the intensive participation of the corresponding infrastructure managers, including technical drawings and experimental data. In parallel, a cloud database has been designed and made accessible to all the partners in the consortium. The database will accommodate the bridge data and the results of posterior analyses.
To understand the bridge’s behavior, it is crucial to identify the modal parameters. Natural frequencies, mode shapes, and modal dampings of large scale structures are usually estimated from operational modal analysis (OMA) using the ambient vibration response. A comprehensive review of the modal identification algorithms utilized within the OMA framework for these structures can be found in References [
6,
7]. These methods assume linearity and time-invariant conditions. In the case of high-speed railway bridges, modal identification is performed using two types of recorded signals: (i) the long duration pure ambient vibration between train passages and (ii) the free vibration response after their passage of short duration. Due to the high stiffness of railway bridges, the amplitude of the natural ambient response is low, and certain mode shapes may not be excited. Additionally, this scenario of low vibration amplitude is not representative of the operational conditions of a train crossing a bridge, particularly in terms of amplitude of vibration, This can lead to uncertainties in the identification of modal parameters. Liu et al. [
8] provide a comparison between the identified natural frequencies and damping ratios in a composite multi-span railway bridge, using different vibration recordings comprising pure ambient vibration measurements, free vibrations after train passages, and forced vibrations during the circulation of trains. The results showed a decrease in the identified first bending frequency when the forced vibration recording was used. Leqia et al. [
9] performed a vibration measurement campaign on the Jalon viaduct, a six-span box girder railway bridge for high-speed trains at Calatayud, Spain. From the pure ambient measurements, 11 modes were identified. However, when the free vibration response after the train passages was combined with a small interval of ambient vibrations, six more modes were extracted. Rebelo et al. deal with the dependency of the modal parameters with the amplitude of vibration for certain bridges [
10]. In the cited work, the identification was performed using two types of recorded signals (pure ambient and free vibration) and different identification techniques (enhanced frequency domain decomposition, EFDD, and free decay analysis). The identification of modal damping becomes particularly challenging as various energy dissipation mechanisms take place during train passages. A number of works are devoted to the study of efficient techniques for a reliable estimation of this modal parameter from experimental measurements [
11,
12,
13].
Vibration signals generated by circulating trains constitute complex dynamic data. These signals are inherently non-stationary, characterized by rapidly changing spectral content as the moving load traverses the span. However, the application of modal identification techniques that account for the time-varying nature of railway bridge vibrations under operating conditions is still limited. The use of the wavelet transform for modal identification was proposed and validated in the scientific literature by several researchers (e.g., [
14,
15]). This mathematical tool enables the capture of the temporal evolution of frequency contributions to the structural response during train passages, i.e., when the train is on the bridge and after it leaves. More recent works have also applied this technique to detect the non-stationary variations in the bridge vibrations [
16,
17]. From the view of the authors, there is still a lack of time–frequency characteristics analysis on bridge response.
For this reason, this work presents a time–frequency analysis of the experimental responses of two bridges included in the database developed within the framework of the InBridge4EU research project. Both structures had previously been investigated by the authors in [
18,
19], where their modal parameters were identified by ambient vibration. The present study extends those analyses by incorporating the free responses recorded after train passages. A comparative evaluation is carried out to identify modal contributions that may arise under one excitation condition but not under the other. For this purpose, the wavelet transform is employed to discriminate between free and forced responses of the bridges induced by different train crossings. The proposed methodology enables the estimation of actual structural modal damping values, which exhibit a strong dependence on vibration amplitude, thereby allowing a more comprehensive assessment of bridge behavior under service loads. In addition, the wavelet analysis provides insight into the predominant frequencies governing the structural response before, during, and after the passage of trains, while explicitly accounting for the influence of vehicle characteristics.
2. Description of the Bridges: Experimental Set-Up and Ambient Vibration Analysis
In this section, the structures under study are briefly presented. More information about them can be found in [
18,
19]. In all the cases, the railway track is a classical ballasted track. The rails have a UIC60 cross section and are continuously welded. The rails are supported on rail pads and fixed with clips on monoblock concrete sleepers with a spacing of
.
As per the acquisition equipment, a portable acquisition system LAN-XI of Brüel and Kjaer was used. The acquisition system fed the accelerometers, and it also performed the analog/digital conversion (A/D). The A/D was carried out at a high sampling frequency that avoided aliasing effects using a low-pass filter with a constant cut-off frequency. The sampling frequency was
. The acquisition equipment was connected to a laptop for data storage. Endevco model 86 piezoelectric accelerometers were used with a nominal sensitivity of 1000 mV/g and a lower frequency limit of approximately 0.1 Hz. The structural response recordings were decimated by a factor of 16 to enable efficient analysis of the data within the frequency range of interest. Structural responses were filtered applying two third-order Chebyshev filters with high-pass and low-pass frequencies of 1 Hz and 30 Hz, respectively, in order to study the bridges within the frequency range of interest defined in [
20], Appendix A2.4.4.2 (criteria for traffic safety).
The modal properties of the bridges were identified from ambient vibration measurements using state-space models [
6]. Ambient responses were recorded for 3600 and 4184 s per channel during the tests conducted on the Jabalón and Arroyo Bracea I bridges, respectively, while no train passages occurred. Particular attention was devoted to modal phase collinearity, complexity, damping ratios, and MAC values [
21], which were used as criteria for distinguishing real natural frequencies from spurious peaks. Since excitation forces were not measured, only unscaled mode shapes could be estimated, and an additional procedure is required to determine the scaling factor [
22].
During the recording time, RENFE Class 100 (S100), 102 (Talgo 350 or S102), 112 (S112), 103 (ICE 3 or S103), 104 (S104), and 130 (Talgo 250 or S130) trains in single and duplex compositions crossed the bridges with circulating velocities in the range [100, 290] km/h.
Table 1 shows the characteristic distance of each train. The characteristic distance of a train depends on its typology: for regular trains (S102/S112/S130), it corresponds to the distance between axles; for articulated trains (S100), it is defined as the distance between bogie centers; and for conventional trains (S103/S104), it is taken as the car length.
2.1. Jabal ón HSL Bridge in Madrid–Sevilla HS Line
Jabalón HSL Bridge (
Figure 1), is a railway bridge composed of three identical S-S bays of 24.9 m equal spans. The structure crosses Jabalón River with a 134° skew angle. Each deck consists of a cast-in-situ concrete slab with dimensions 11.6 m × 0.3 m (wide × thickness). The slab is supported by five prestressed concrete I-girders with a height of 2.05 m separated 2.625 m. The girders lean on the supports through laminated rubber bearings. The substructure consists of two outer reinforced concrete abutments and two inner wall piers.
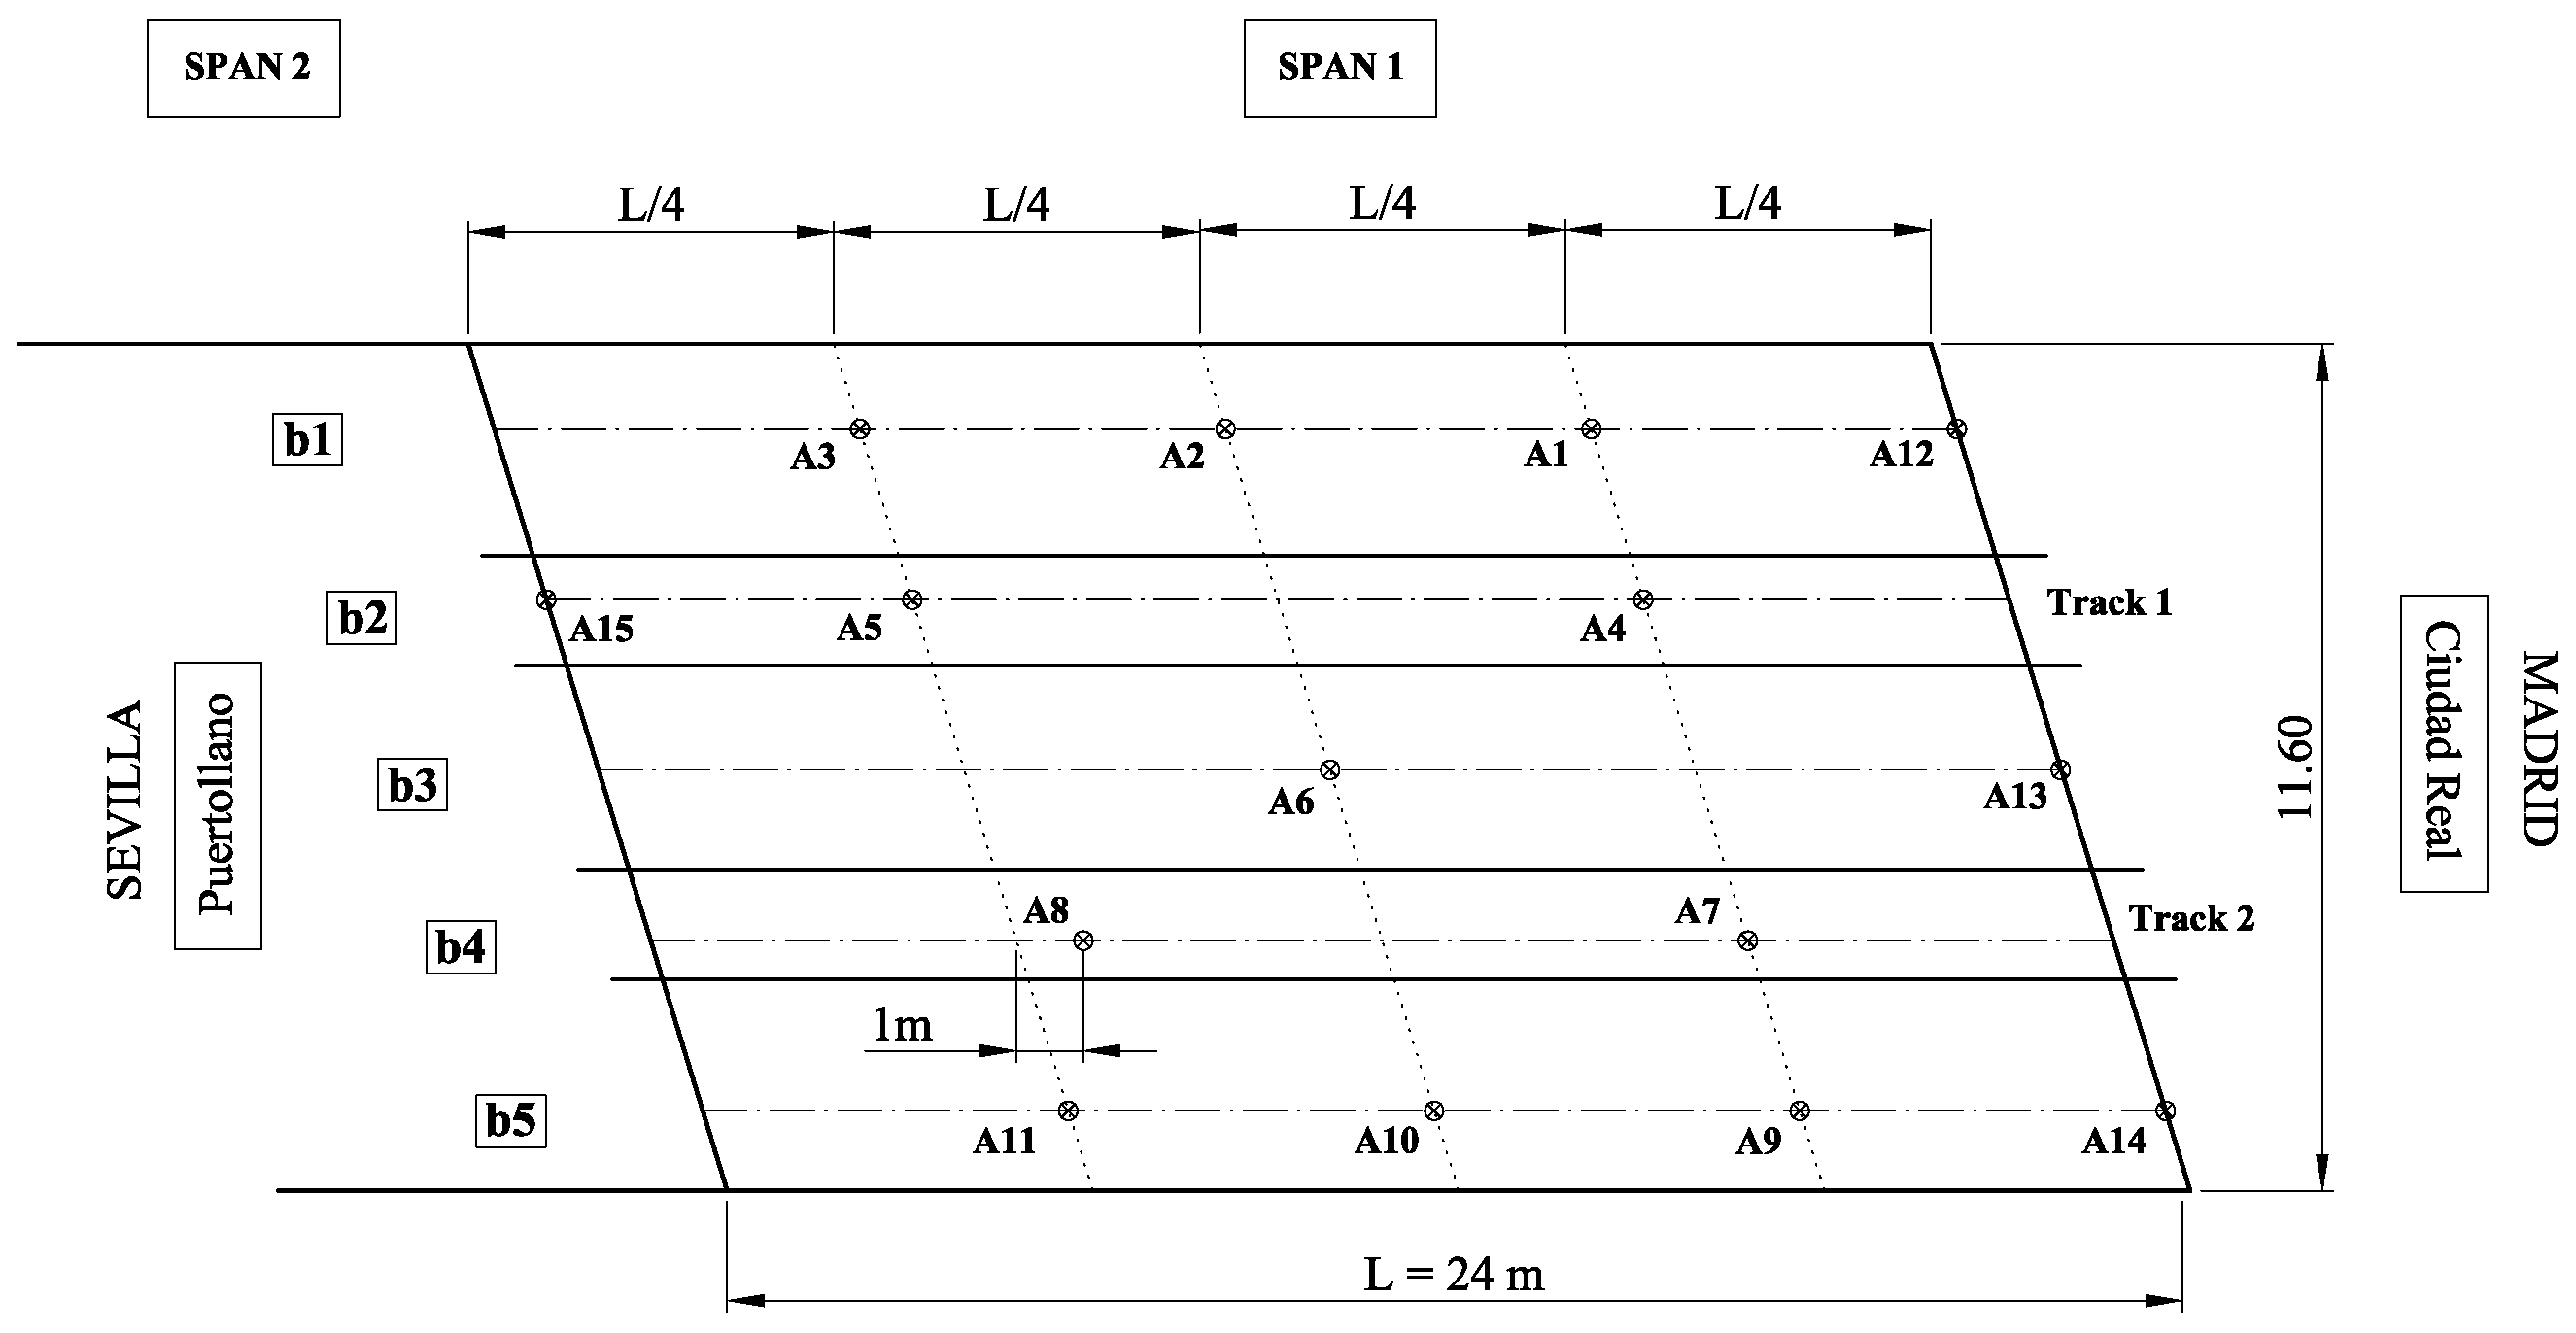
Figure 2 shows the distribution of sensors, all of which were installed on the first span. Unfortunately, it was only possible to record the response of the first span due to the pier’s height and the river flow.
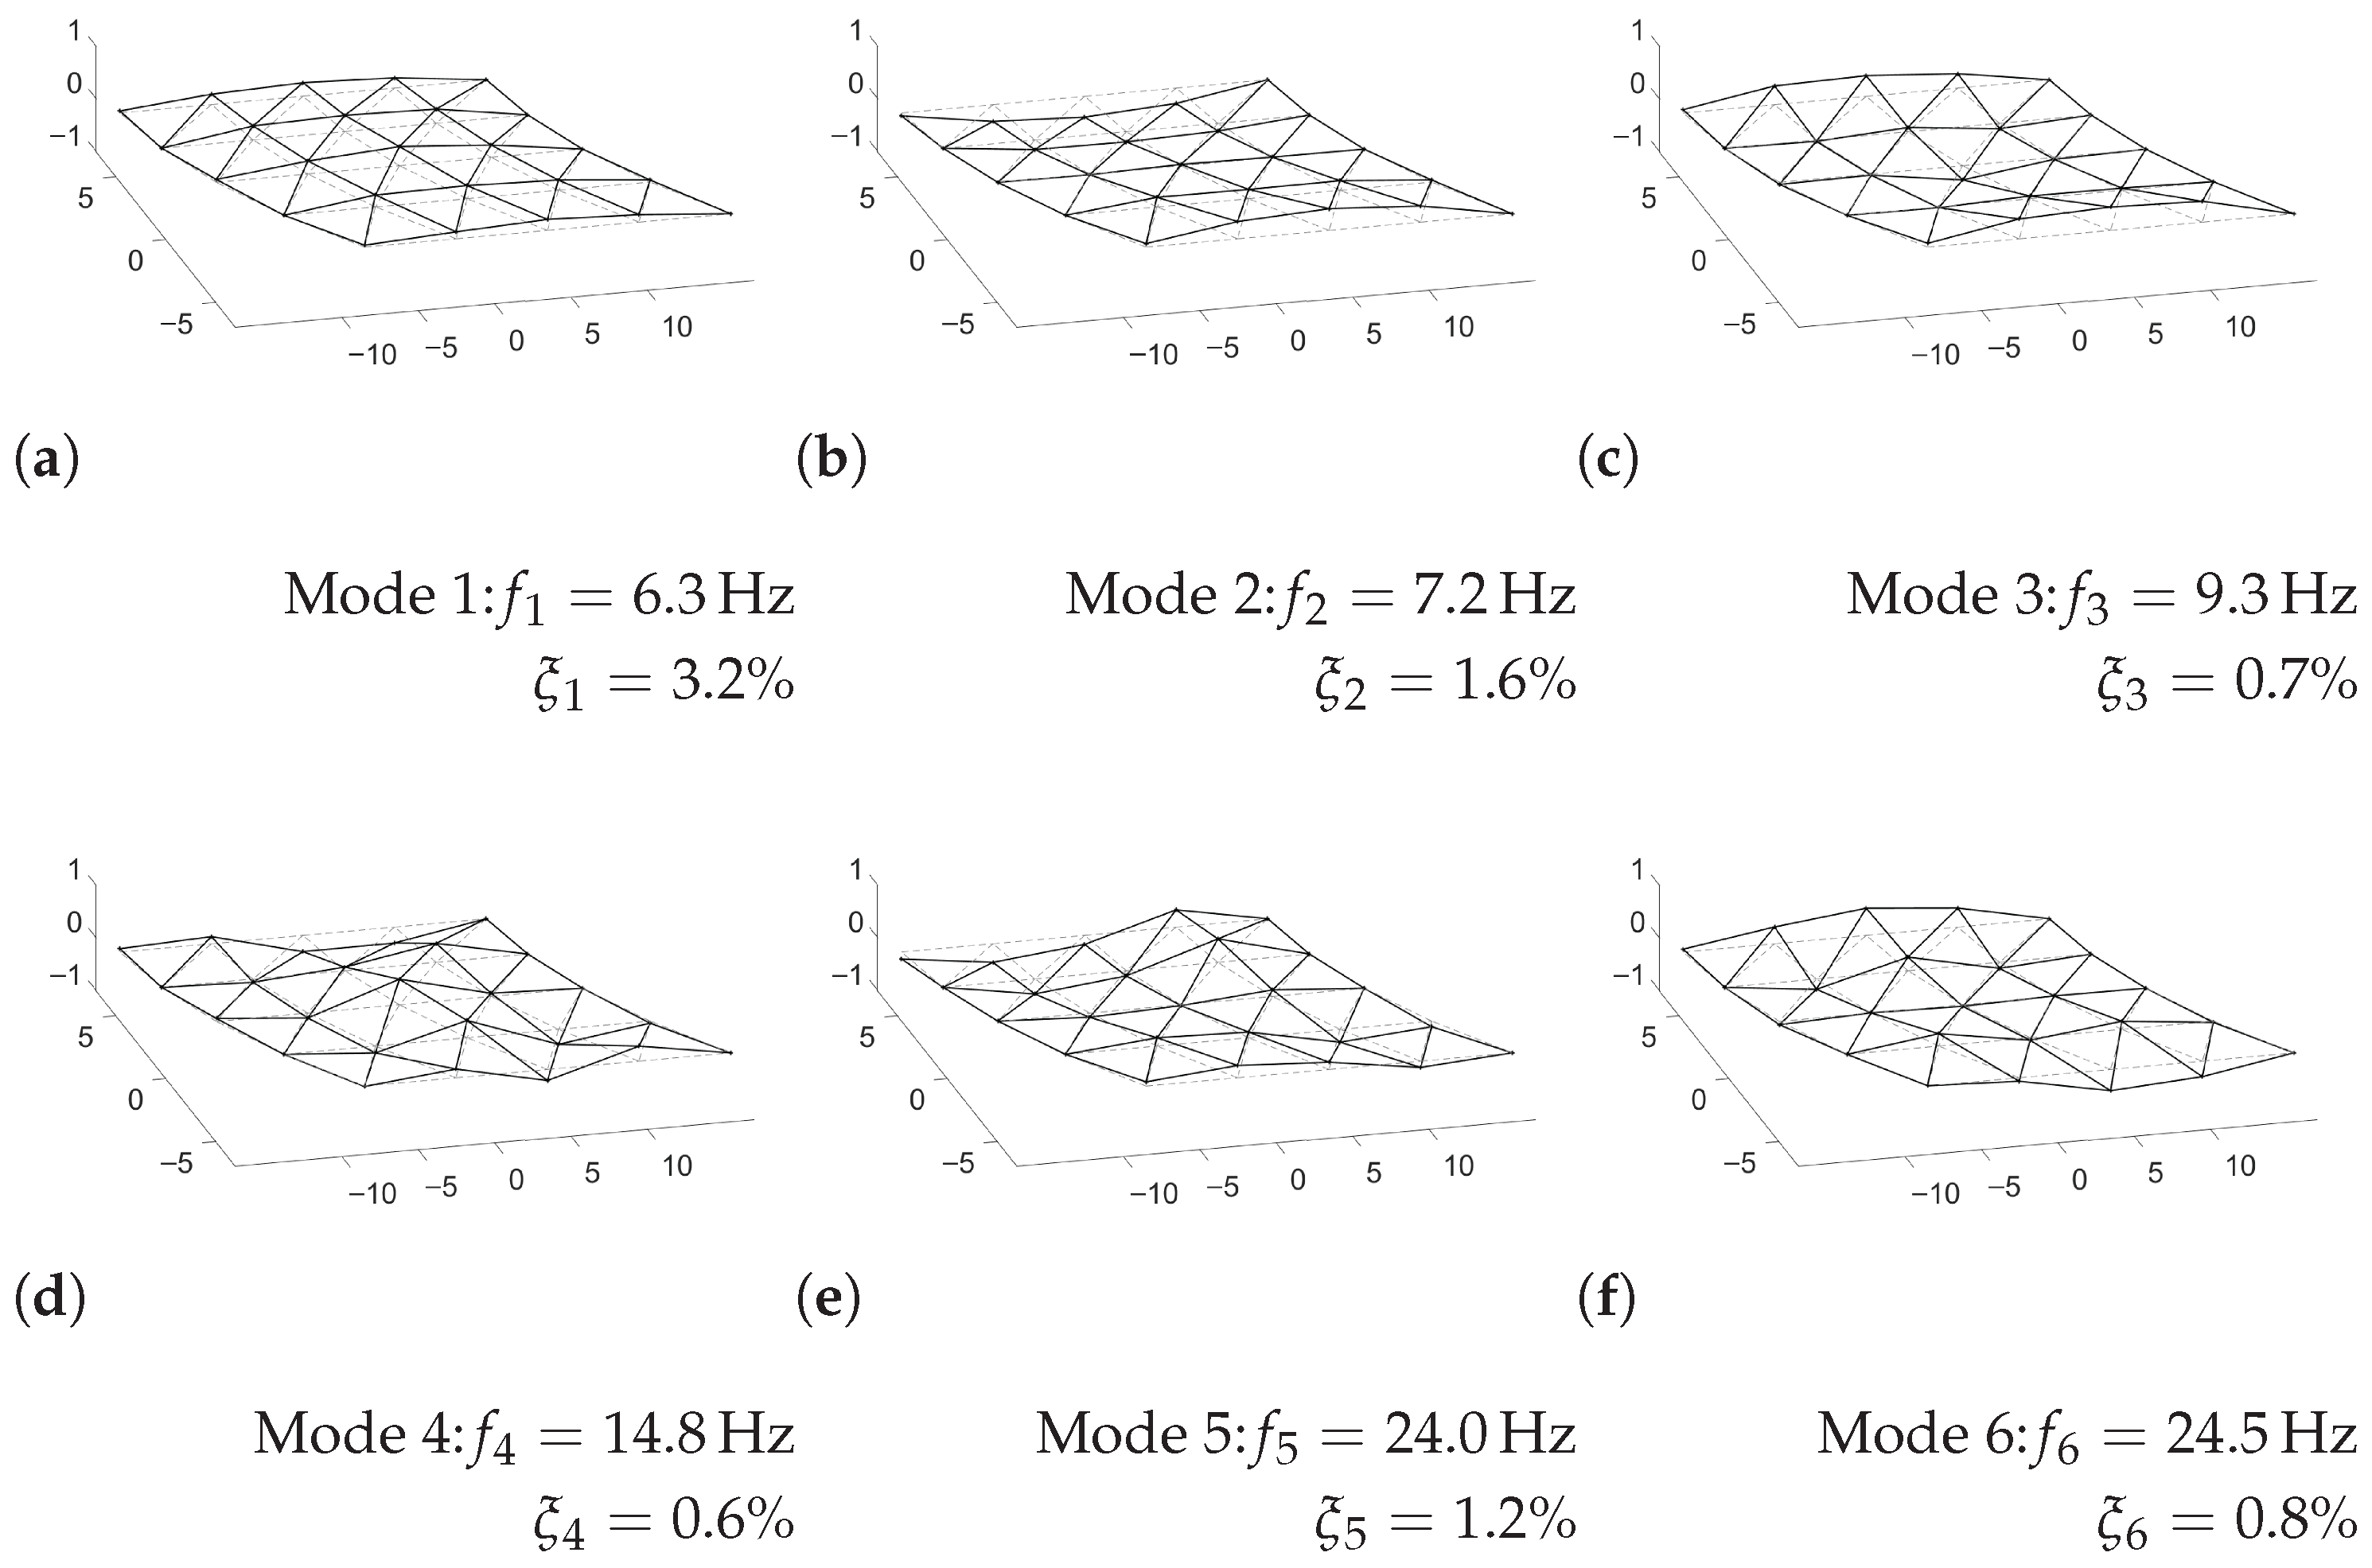
Figure 3 presents the identified modal parameters of the structure by ambient loads. The first, second, and third modes in frequency order correspond to the first longitudinal, first torsion, and first transverse bending modes, typical in S-S decks with an orthotropic plate-type behavior. Modal damping has been estimated for the first six modes (modes under 30 Hz). The identified damping ratio for the fundamental mode (3.2%) is higher than the value prescribed by standards (1%) [
20].
2.2. Arroyo Bracea I Bridge in Madrid–Sevilla HS Line
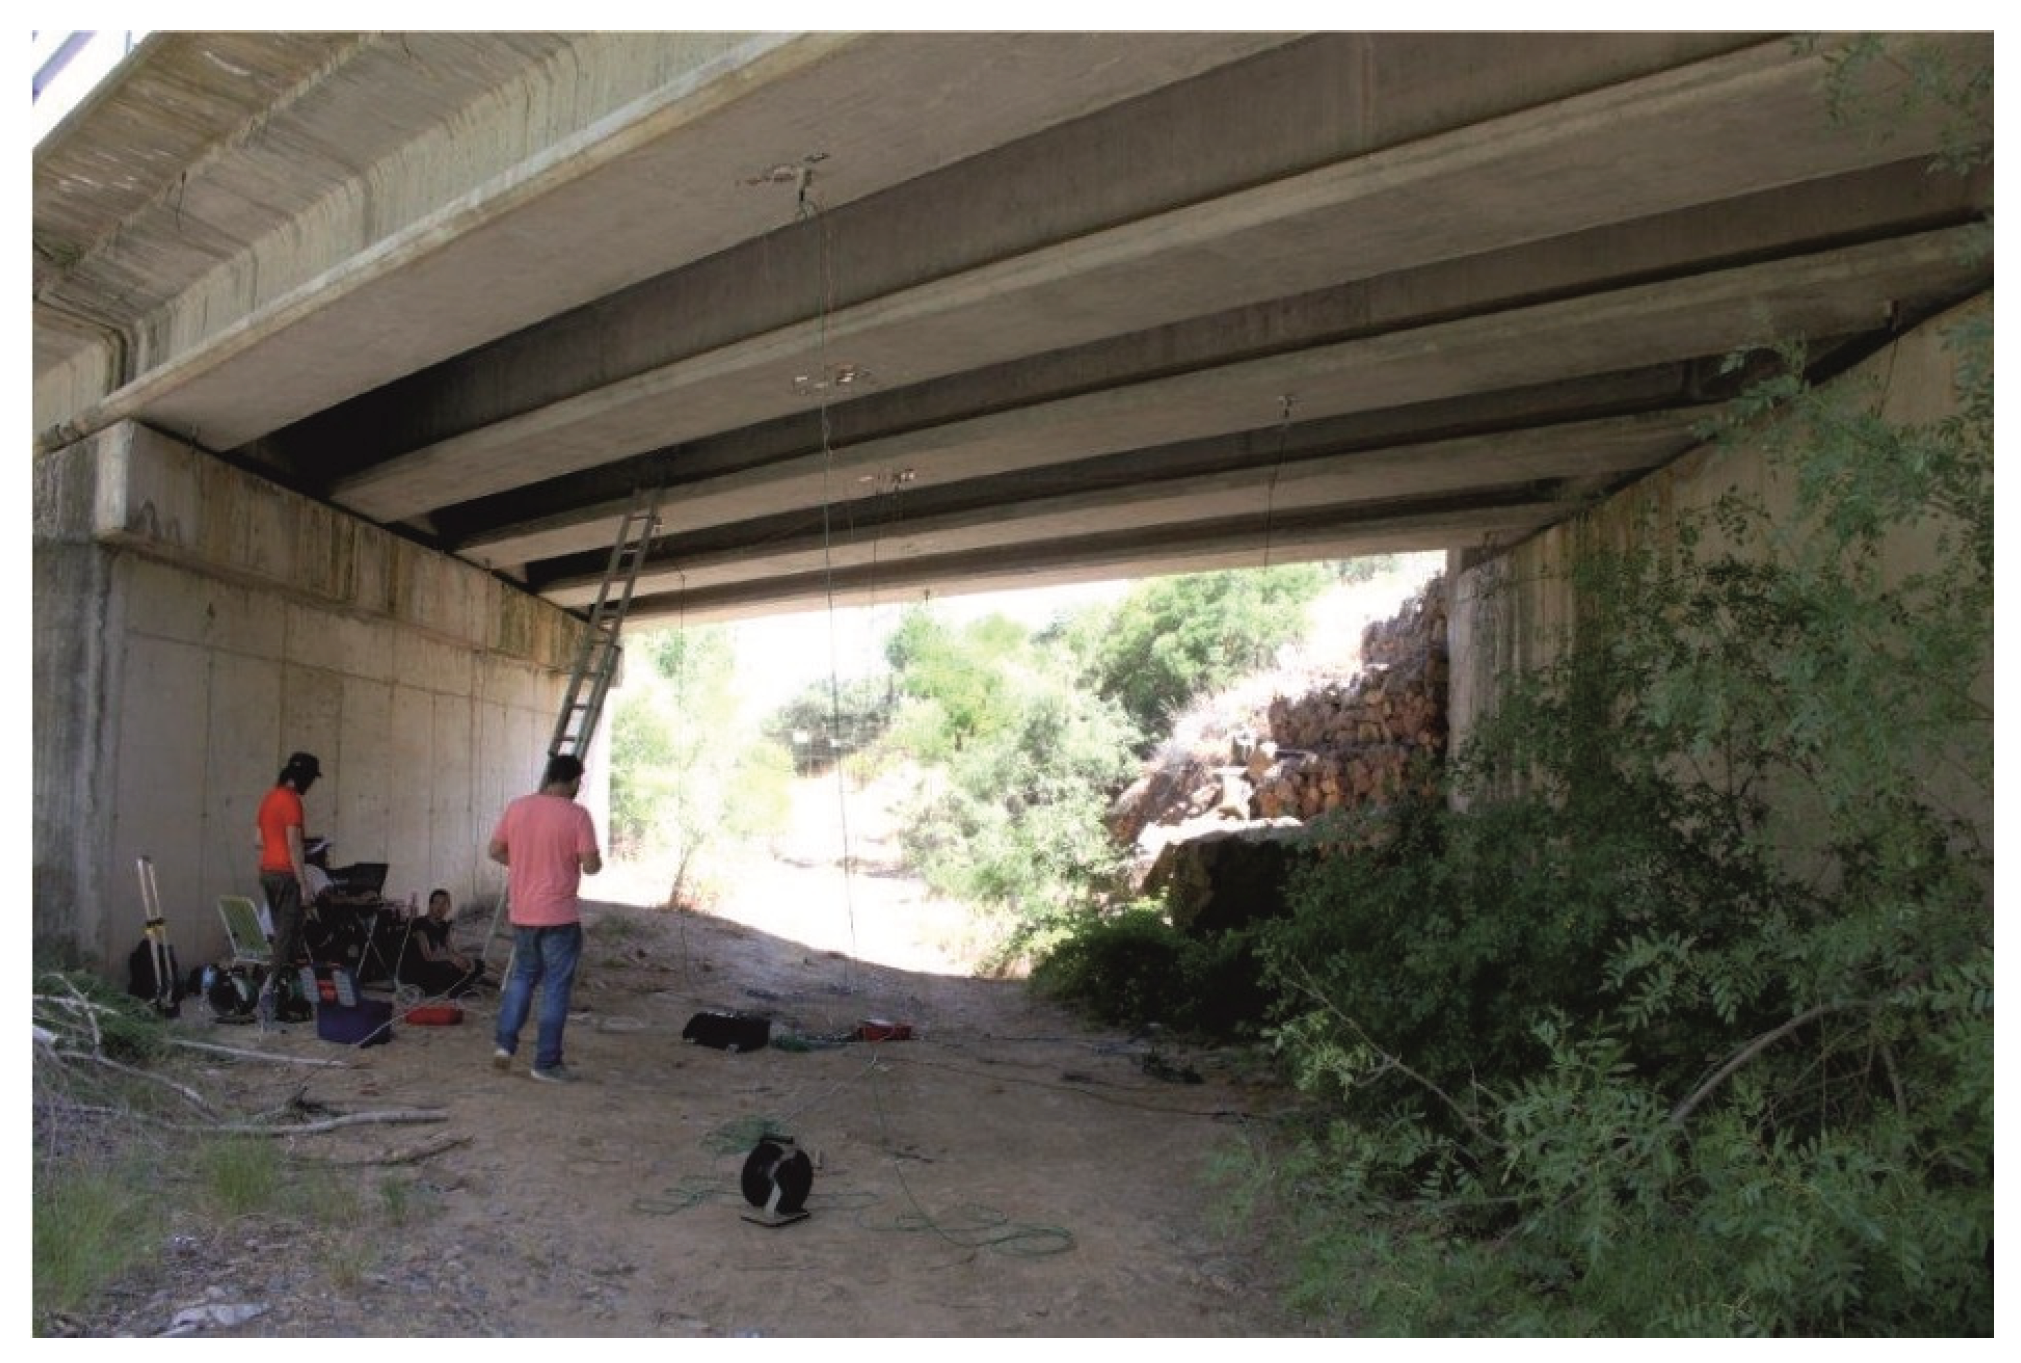
The structure under study, designated as Arroyo Bracea I bridge (
Figure 4), is a railway bridge composed of two identical simply supported (S-S) bays of 15.25 m equal spans. The structure crosses the Bracea stream with a 45° skew angle. Each deck consists of a 25 cm thick, 11.6 m width concrete slab resting over five 1.05 m height prestressed concrete I girders. The girders lean on the supports through laminated rubber bearings. The slab carries two ballasted tracks with an equal eccentricity of 2.15 m from its longitudinal axis, two sidewalks, and handrails. As per the substructure, the bridge deck is supported on reinforced concrete abutments in its outermost sections, and the inner sections of both bays lean on a pile foundation.
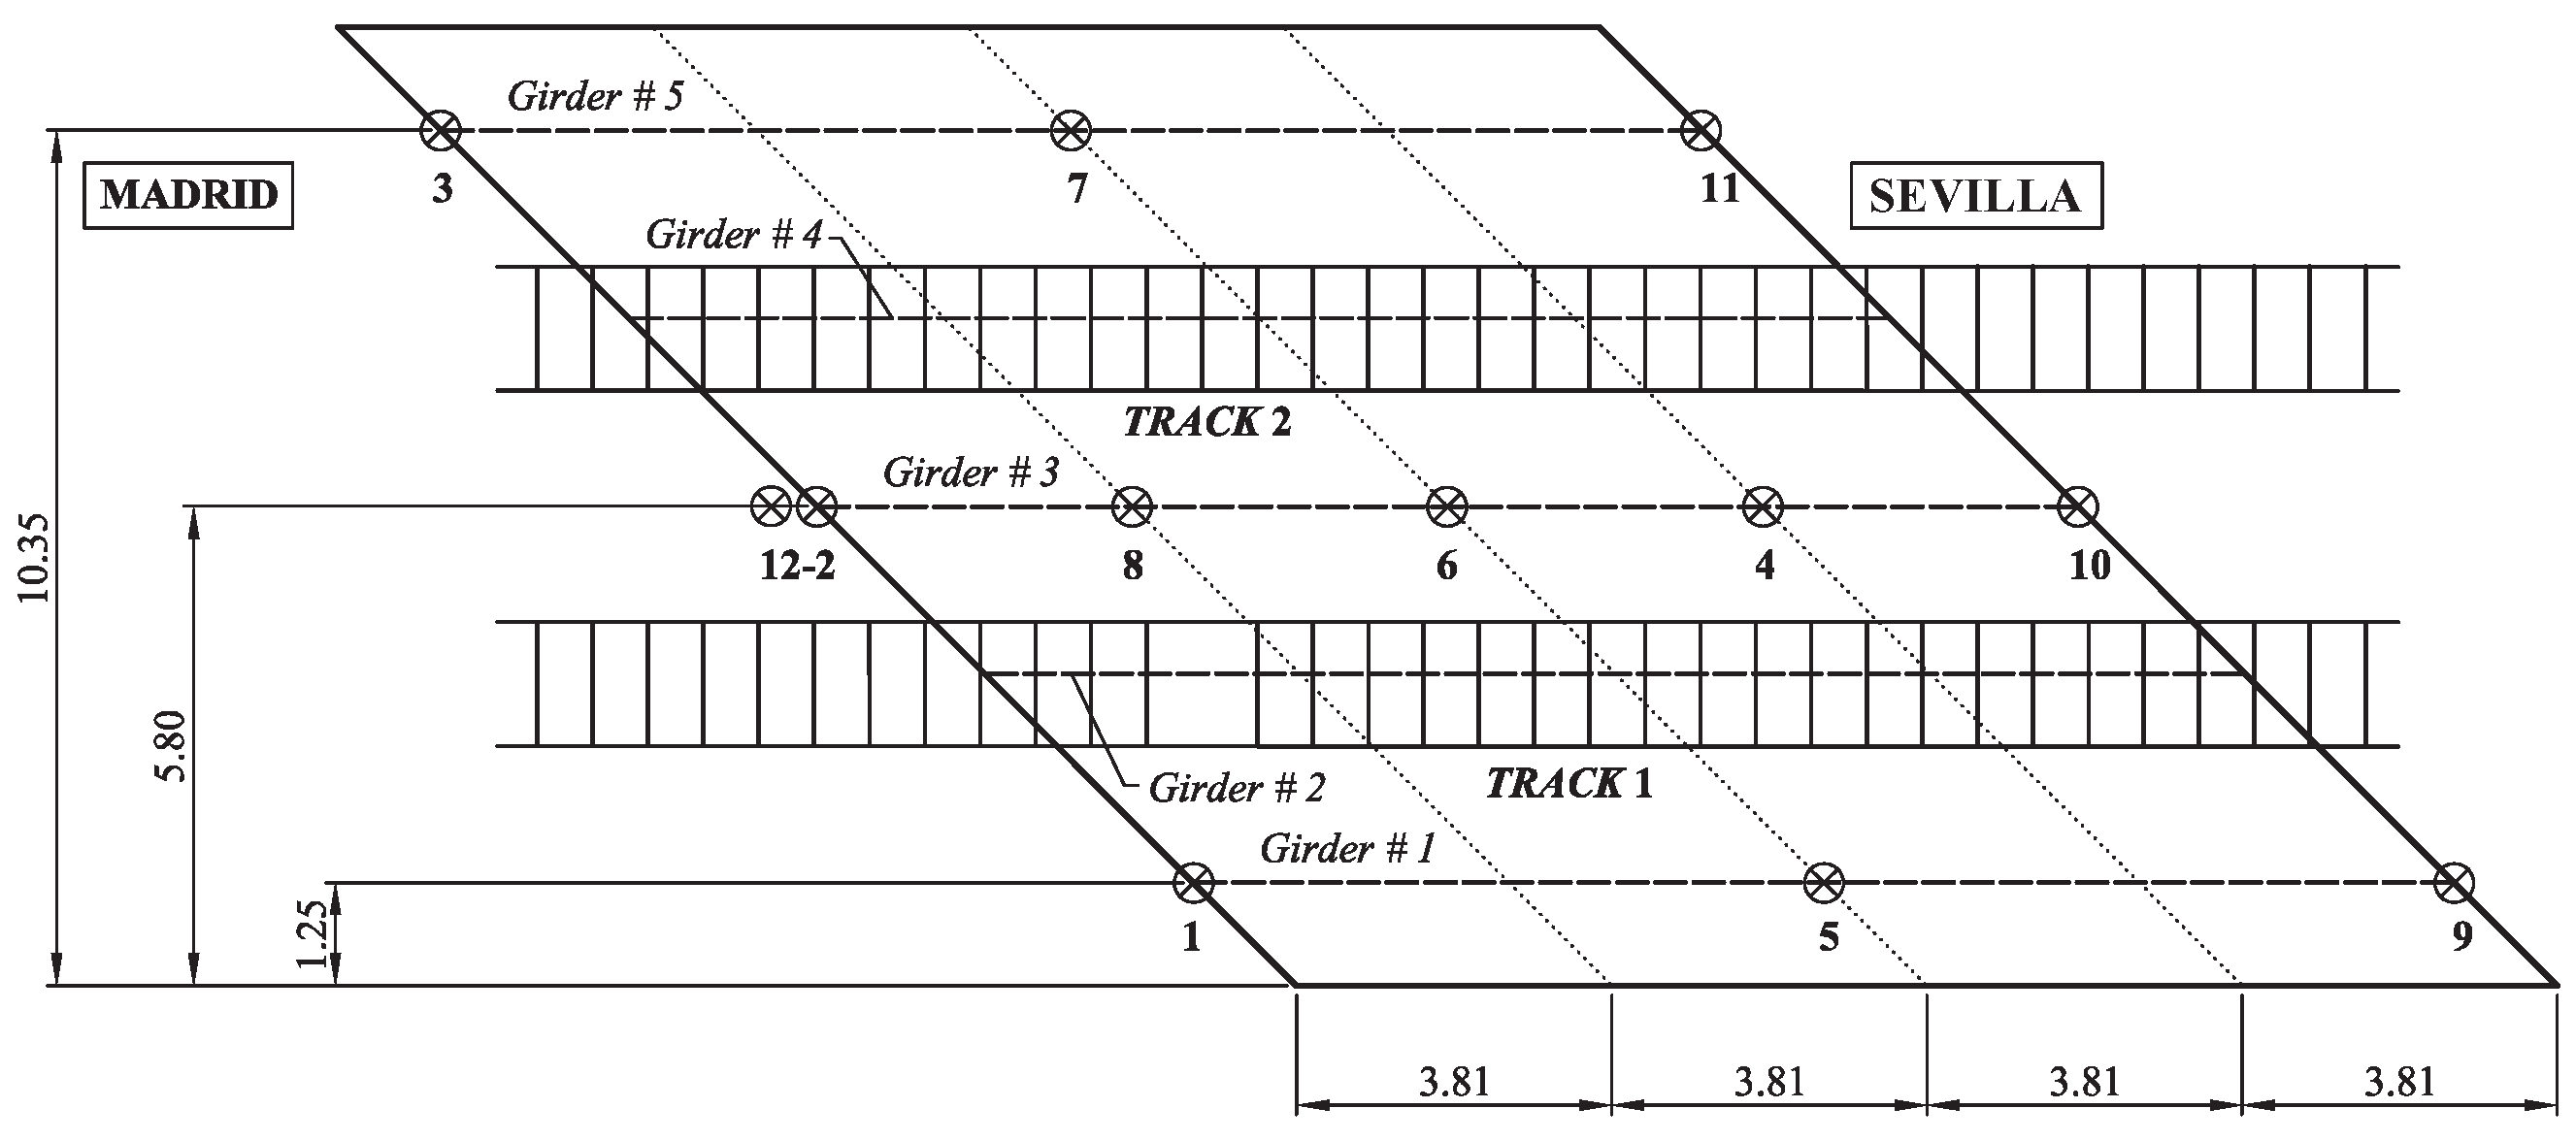
During the experimental campaign, the vertical acceleration response of the bridge deck was recorded at 11 measurement points distributed along the lower horizontal face of the flange of the prestressed concrete girders (points 1–11 in
Figure 5) and at the pile foundation upper horizontal surface, close to the central girder support (point 12 in
Figure 5).
First, the modal parameters of the bridge were identified from ambient vibration. The deck presents five modes in the frequency range from 1 Hz to 30 Hz, where the lowest ones in frequency order correspond to the first longitudinal bending, first torsion, and first transverse bending mode shapes. In
Figure 6, the identified natural frequencies and the damping ratios are included for the first six modes. Mode six was not taken into account in [
18] because of its proximity to 30 Hz. The identified damping for the fundamental mode reaches 2.0%, a value higher than that prescribed by standards for design purposes for this length and bridge typology (1.3%) [
20].
3. Free and Forced Vibration Analysis Through Wavelet Analysis
The behavior of railway bridges while the train crosses (forced vibration) differs from right after the train leaves the structure (free vibration). In the latter case, the response of the bridge is influenced by the modal frequencies, which are determined by the stiffness, mass, damping, and support conditions. In the former case, in addition, the characteristic frequencies of the train excitation, which are a function of the passing speed and axle distances, contribute to the response of the structure. In order to determine the modal parameters of the structure, the determination of the free vibration response is decisive. From this response, using different methodologies, the natural frequencies and modal dampings of the structure can be determined. In order to identify the modal damping, it is also necessary to analyze the maximum amplitude of the free vibration response and the duration of the recording, as this is a parameter that presents considerable uncertainty in its estimation. To identify forced and free vibrations, the use of the wavelet transform is proposed in this work. The wavelet transform has been previously used by the authors to detect damage [
23,
24,
25,
26,
27] and non-stationary behavior of railway bridges during vehicle crossing events [
17]. Other authors [
16] have also applied the wavelet transform to analyze the vibrations of railway bridges.
Basic concepts about the wavelet transform can be found in Reference [
28]. In addition, the drawbacks that arise when applying the wavelet transform to data analysis, as well as some proposed solutions, have been discussed by some of the authors in [
23,
24,
25,
26]. What follows is a brief presentation of some of them.
3.1. Continuous Wavelet Transform
The Continuous Wavelet Transform (CWT) of a function
can be defined as
where
indicates the complex conjugate of the wavelet function.
indicates the content of the scaled wavelet shape in the original function
at a specific instant. This can be understood in the sense of time evolution of frequency content. Parameter
u is known as the translation parameter. Parameter
s is defined as the scale of the wavelet transform. It defines the shrinking or stretching of the wavelet function. The resulting wavelet transformed function will depend on scale and translation parameters
s and
u, respectively. The inverse of
s can be interpreted as a pseudo frequency, since it modulates the frequency content of the wavelet function. A value of the corresponding pseudo frequency for each scale can be obtained from the following expression:
where
is the pseudo frequency for scale
a, and
is the center frequency of the wavelet. The center frequency is a convenient and simple characterization of the dominant frequency of the wavelet.
The wavelet transform gives time information for the frequency content of the signal. On the other hand, the wavelet analysis can provide higher time resolution for higher frequencies and lower time resolution for lower frequencies, since the convolution parameter () can be adapted according to the frequency.
In this paper, the analytic Morse wavelet [
29] with the symmetry parameter
and the time-bandwidth product equal to 120 has been used. This wavelet allows us to analyze signals with wider variance in time. The wavelet coefficients are normalized to the maximum value in each scale.
The main advantage of applying the wavelet transform to railway bridge analysis lies in its ability to capture the temporal evolution of frequency contributions to the structural response during train passages, i.e., when the train is on the bridge and after it leaves. This aspect is particularly relevant because the modal properties of railway bridges depend on multiple uncertain factors, such as soil–structure interaction, vehicle–track interaction, and vehicle–bridge interaction. Some of these factors give rise to non-linearities that affect the identification of modal properties and cannot be detected under ambient or free vibration conditions. They may only become apparent during train crossings.
The transformation of the time history response of the bridge using the wavelet function makes it possible to detect changes that occur in the structure. Since the entry and exit of the train severely affects the behavior of the bridge, which was previously only subjected to ambient loads, the wavelet transform allows us to identify the entrance and exit instants of the convoy.
Figure 7a shows the time history of the acceleration at point 10 induced by Renfe S130 train circulating along track 1 of Jabalón bridge at
. The time history of the maximum coefficient of the wavelet transform to the power of 4 is presented in
Figure 7b. The time span during which the train is on the bridge is defined as the time window in which the maximum wavelet coefficient of the acceleration exceeds 25% of its standard deviation as is indicated in
Figure 7 by vertical dashed lines.
3.2. Time and Frequency Response
In the following, the response of Jabalón and Arroyo Bracea I bridges due to two different train passages is presented.
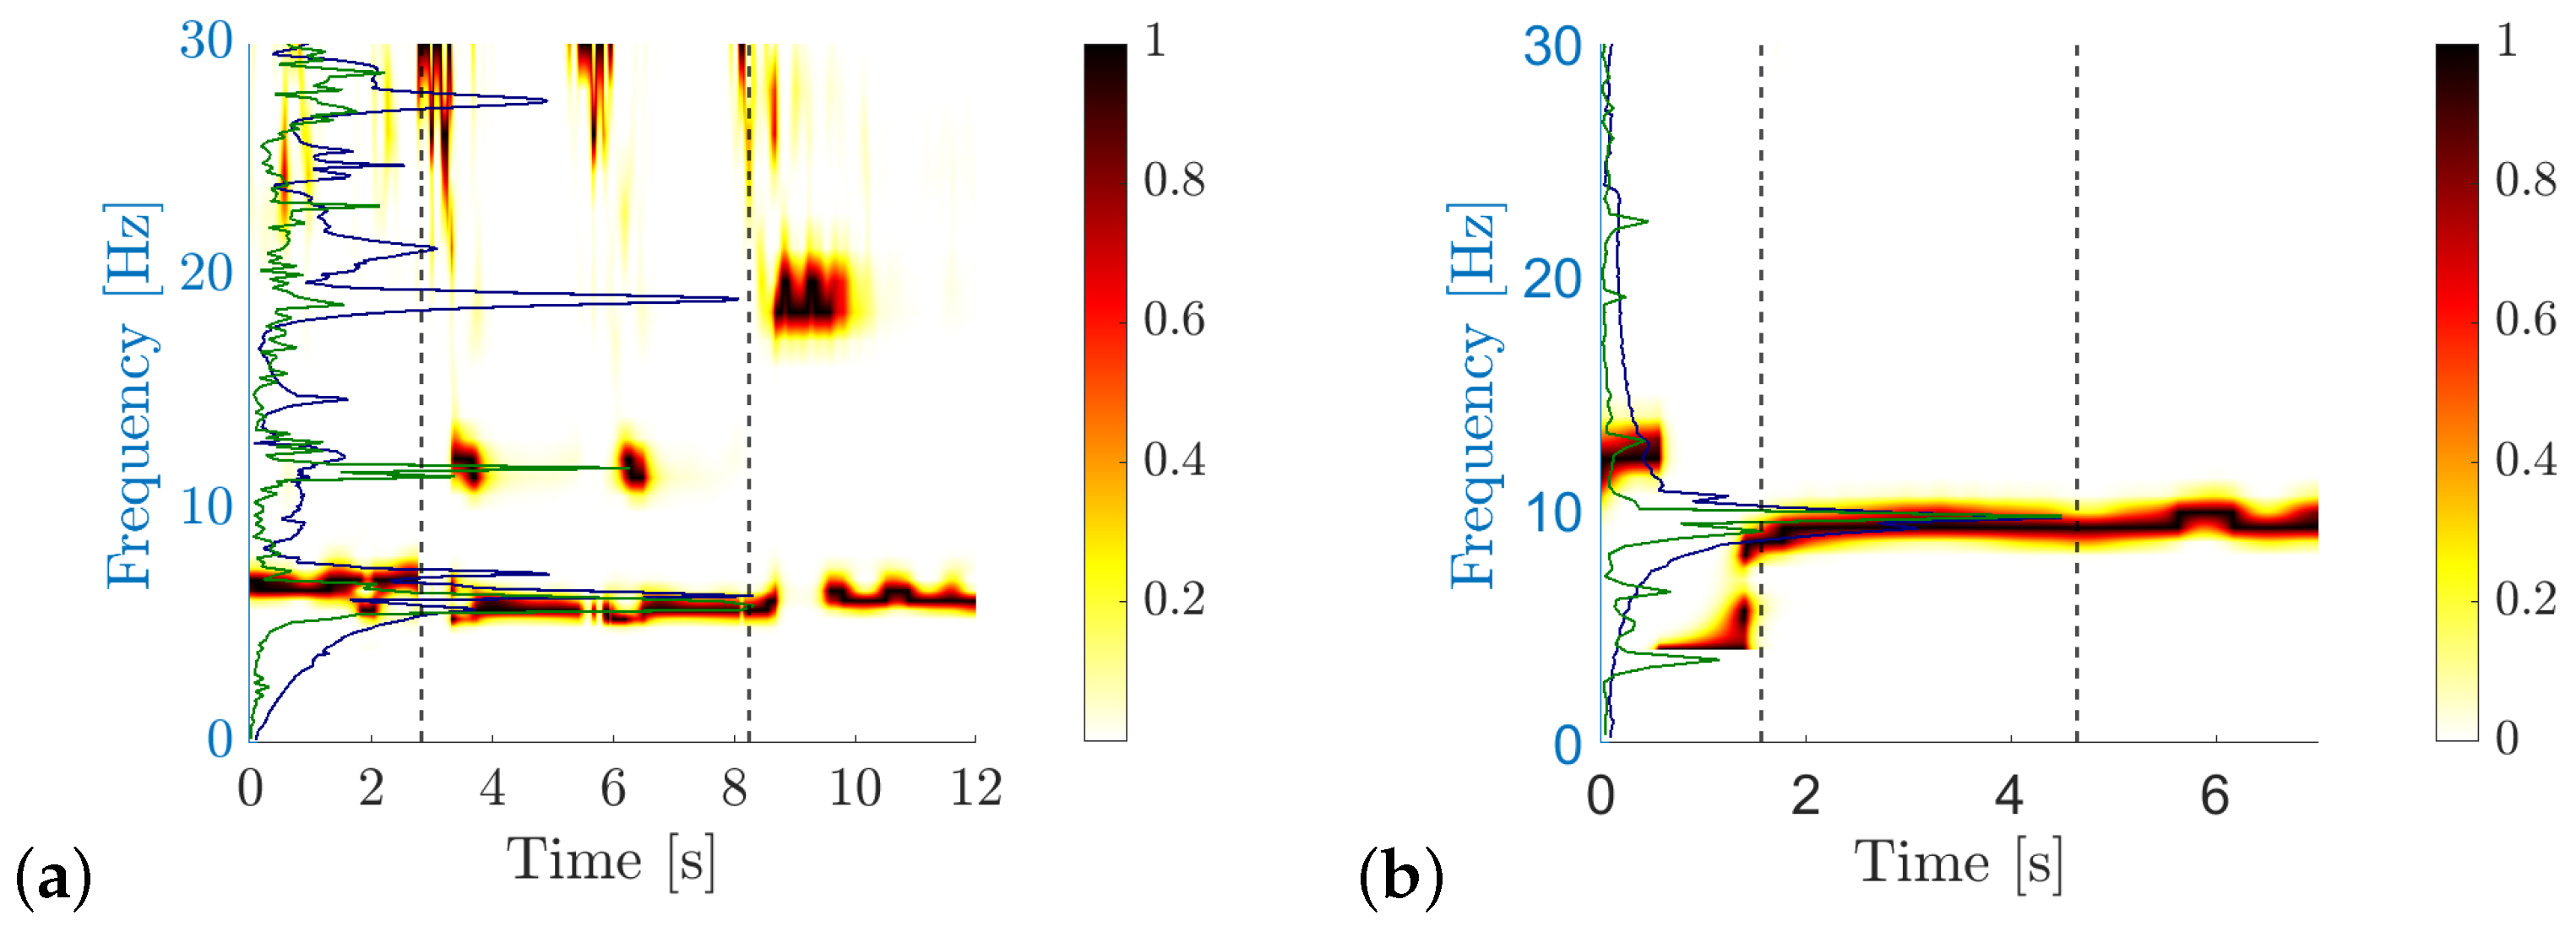
Figure 8 shows the time history responses due to Renfe S102 Duplex and Renfe S103 trains. The black trace corresponds to the recording period before the train arrival. The green line represents the time span of forced vibration. Finally, the blue line shows the free vibration, once the train has left the structure. In
Figure 9, the wavelet scalograms and frequency responses induced by the two passages in both bridges are shown. As in
Figure 8, the green line is the frequency response associated with forced vibration, and the blue line is obtained from the free vibration identified by the wavelet transform analysis previously presented.
The response shown in
Figure 8a and
Figure 9a from a particular train passage (Renfe S102) over Jabalón bridge does not induce resonance. In this case, the excitation frequency associated with the axle distance (
) is 5.6 Hz and Jabalón bridge’s fundamental frequency is 6.3 Hz. Both peaks are visible in the scalogram and in the frequency response. Before the arrival of the train, the bridge is subjected to ambient vibration, and the fundamental frequency of the bridge at 6.3 Hz dominates its response. As the vehicle crosses the bridge, it is clear that the dominant frequency shifts to a lower value, i.e., the frequency associated with the passage of the axles (5.6 Hz), with its harmonic also appearing at 11.2 Hz. Once the train leaves the bridge, the contribution of the fundamental frequency is clearly appreciated again, the contribution of a natural frequency close to 19 Hz being also relevant. This frequency content was not identified in [
19] and will be discussed hereafter.
On the other hand,
Figure 8b and
Figure 9b show a resonant response of the Arroyo Bracea I bridge due to Renfe S103 passage traveling along track 1 at
. The third theoretical resonant (or critical) speed of the fundamental mode is given by
, where 1 denotes the mode number, 3 the resonance order, and
d the characteristic vehicle distance (
Table 1). The calculated resonant speed closely matches the estimated train speed of
. In this case, frequency contents at 9.25 Hz predominate both the forced and the free vibrations. Moreover, the frequency response of the forced vibration exhibits peaks at the lower and higher harmonics:
where
.
Free and forced vibration responses may be automatically detected from the presented methodology based on the wavelet transform.
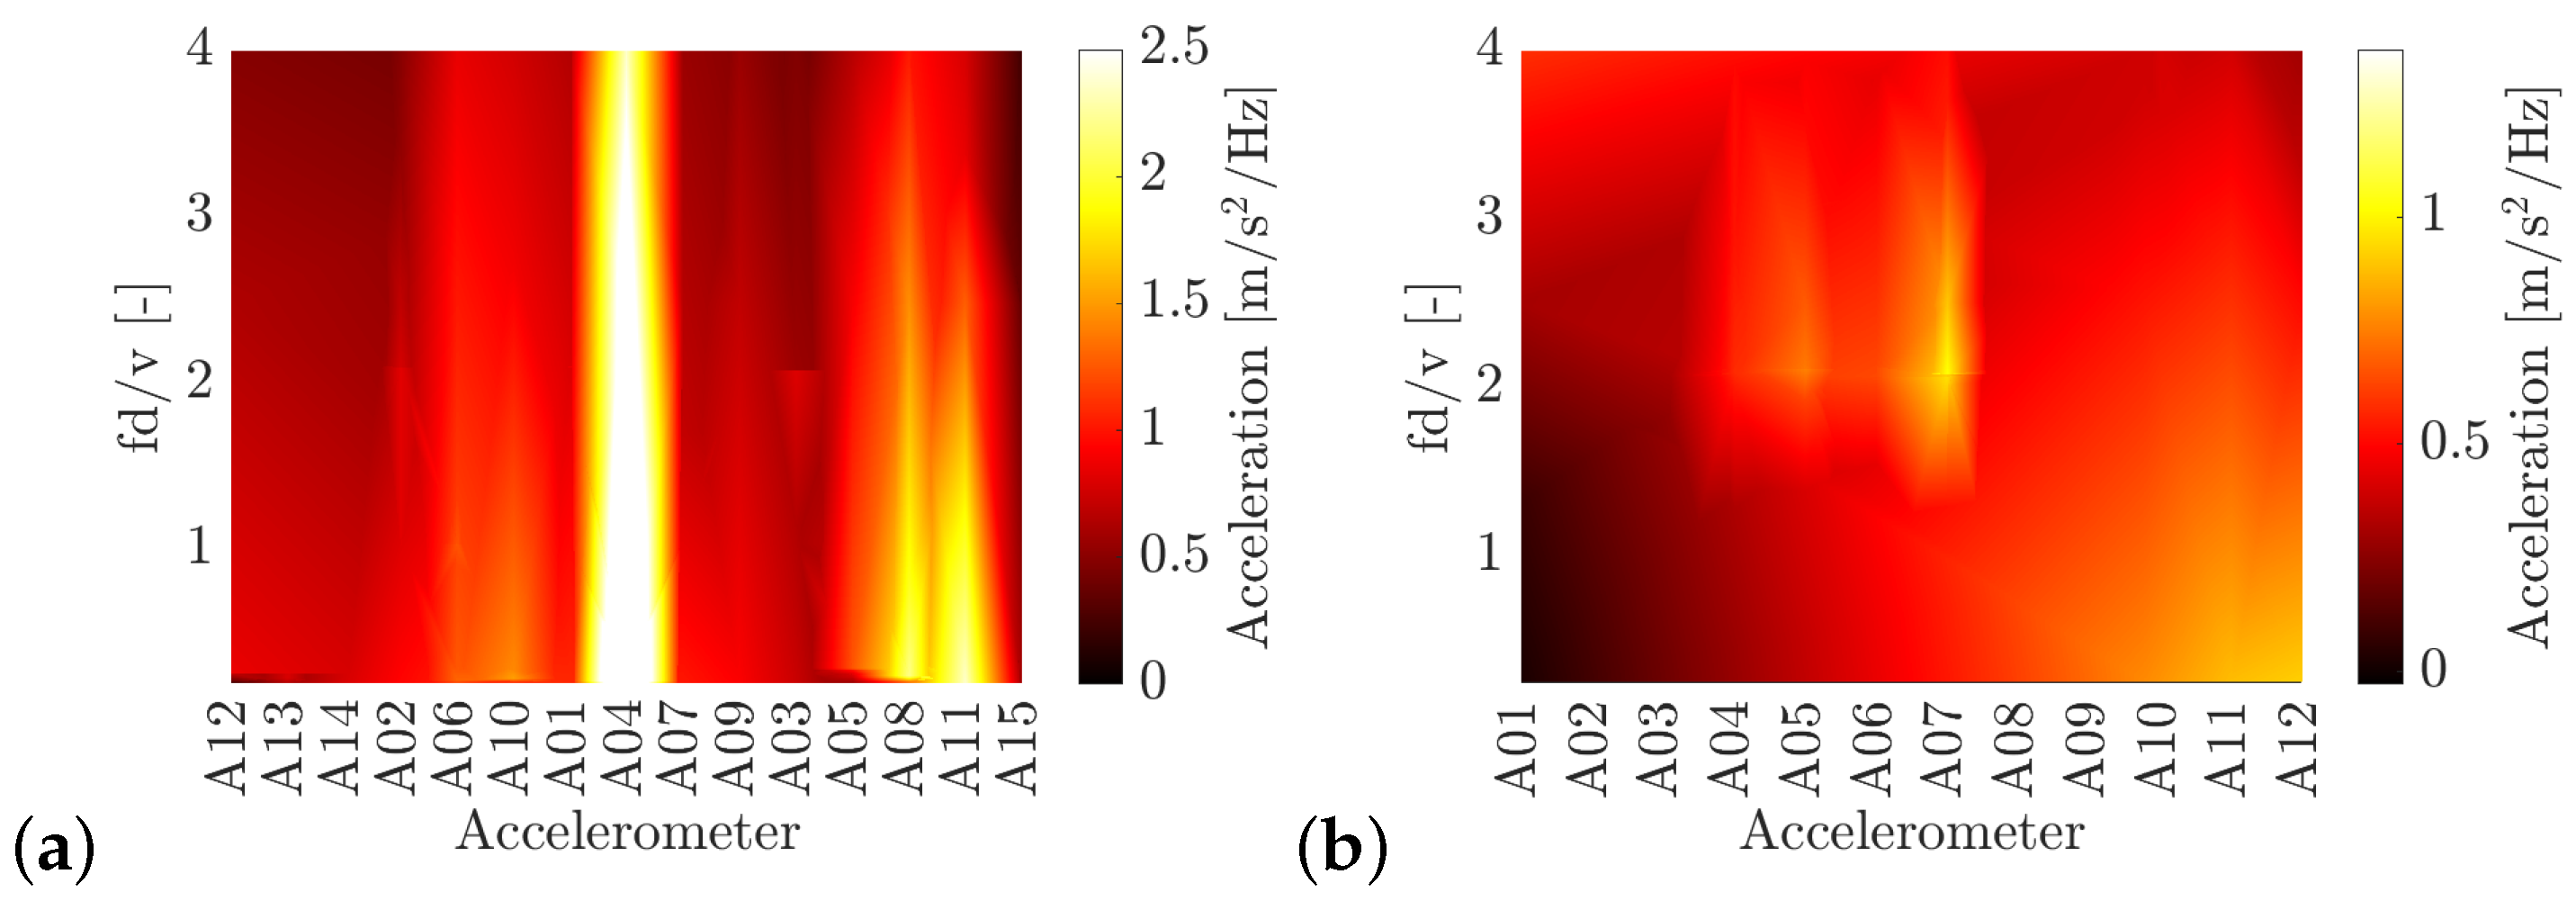
Figure 10 shows the amplitude of the peaks at the frequency response of the forced vibration for all train passages and sensors in both bridges. The frequency is normalized, accounting for the passing frequency of the train. It can be observed that the amplitude of the response is similar in both bridges. However, the response at accelerometers 4 and 8 prevails in the case of the Jabalón bridge in the complete frequency range, while accelerometers 6 and 7 contribute to the response mainly for Arroyo Bracea I bridge, at the frequencies of the second and third harmonics of the excitation.
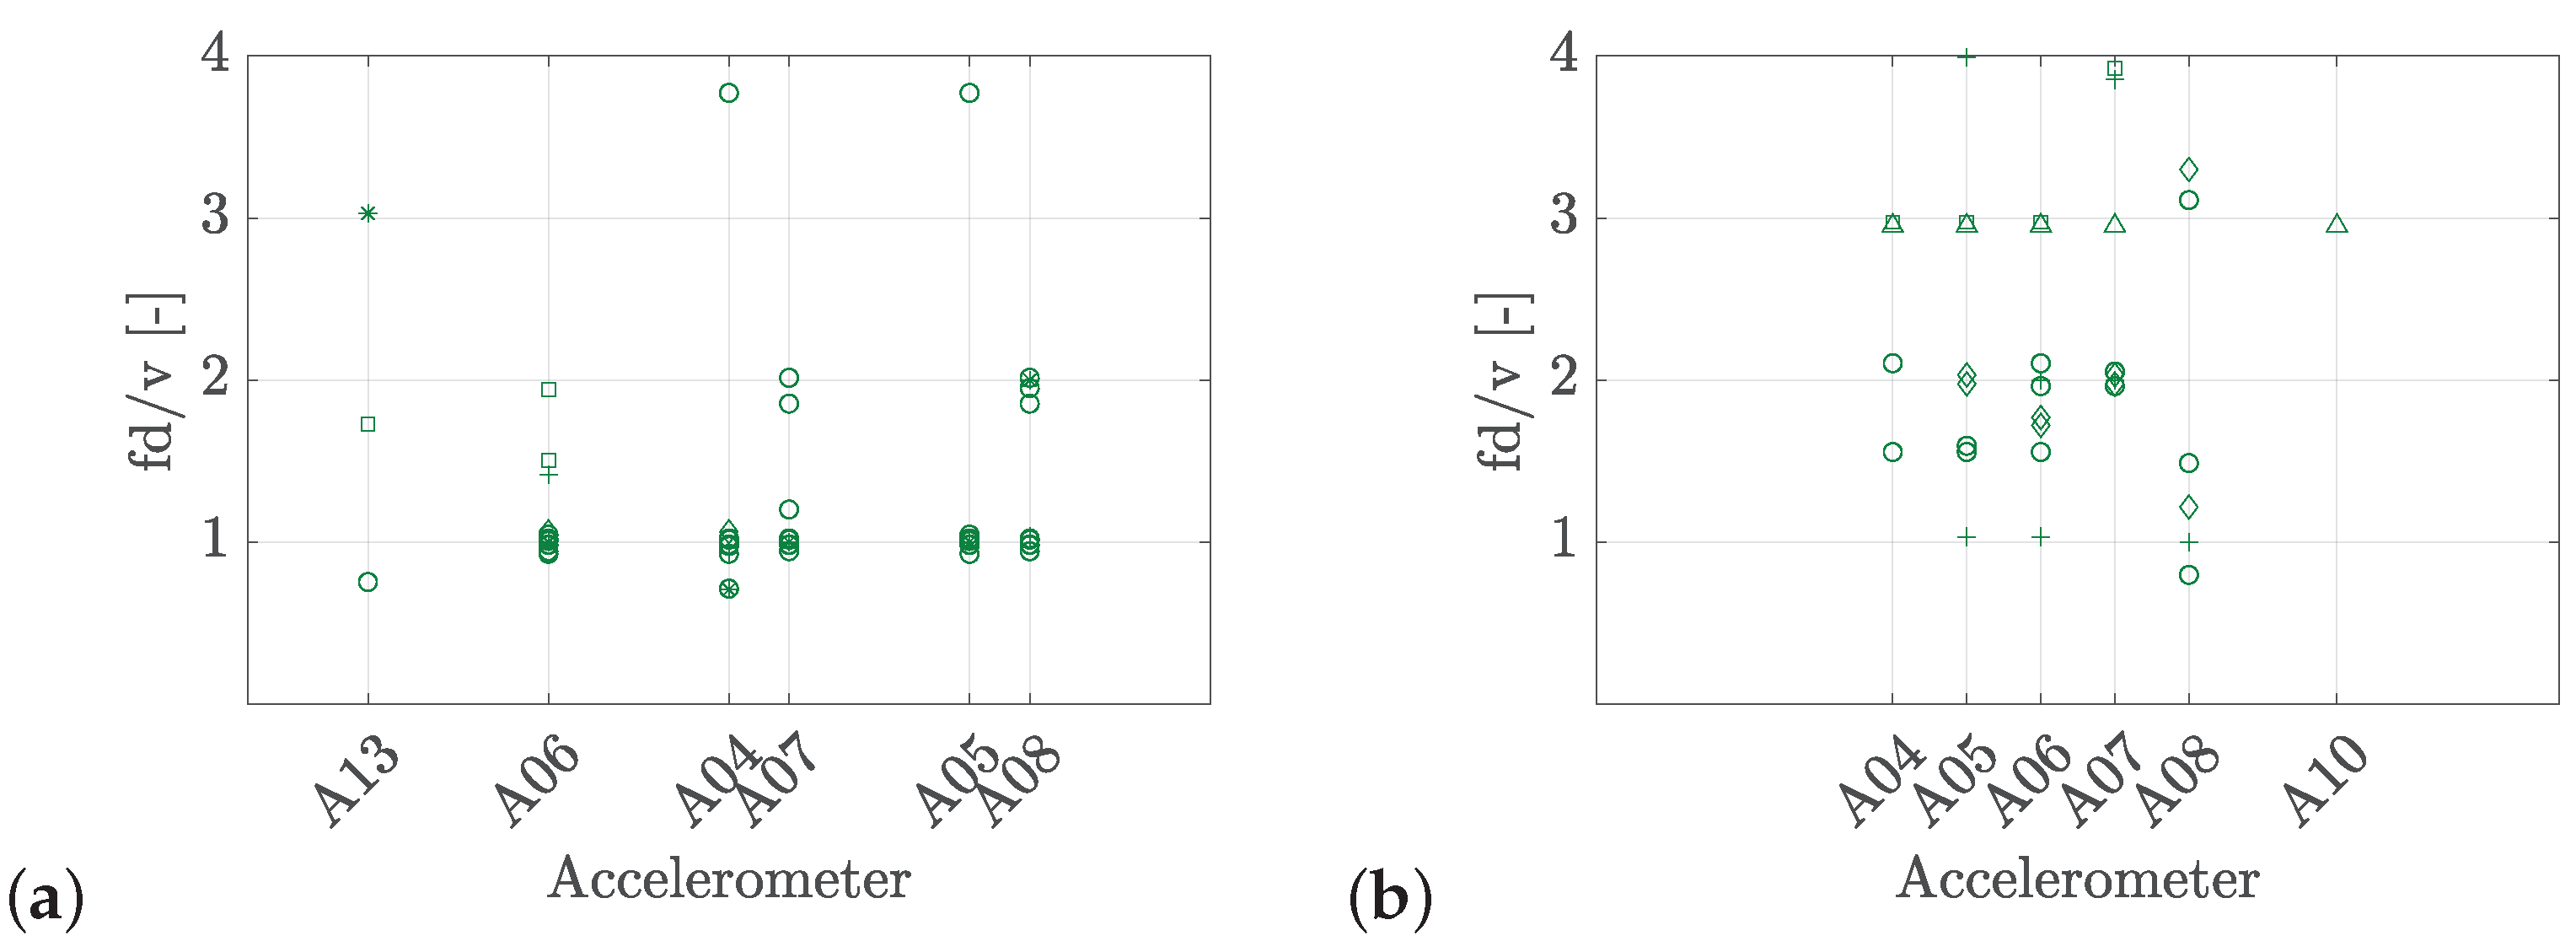
Figure 11 shows, for the sensors that contribute most to the structural response, the position of the peaks that appear in the forced vibration response in the frequency domain, differentiating the type of train. In the case of Jabalón (
Figure 11a), it can be seen that peaks appear mostly in the axle-passing frequency and also in its second and third harmonics. The S102 and S112 trains (very similar and with a short characteristic distance) lead to peaks at all three frequencies mentioned. The longer characteristic distance of the S104 train causes amplifications or peaks mainly at the second harmonic of the axle-passing frequency. In the case of Arroyo Bracea I (
Figure 11b), with a higher fundamental frequency, the S100 train induces higher responses at the pass frequency, the S102 and S130 types at the second harmonic, while the S103 and S104 types cause peaks at the third harmonic.
Following,
Figure 12 and
Figure 13 show the maximum acceleration recorded at the decks of the bridges for resonant and non-resonant passages, respectively. Consistently with
Figure 10, the resonant response is localized in the region where the excited mode has its maximum amplitude. In the case of Arroyo Bracea I bridge, the resonance associated with the fundamental mode at 9.25 Hz and the third order is again considered. For Jabalón bridge, this train passage corresponds to a speed close to the resonant speed for mode 1 and resonance order 1,
. However, in the case of a non-resonant response, there is no predominant participation of a single mode, but different modes contribute with lower frequency response amplitudes. This is also reflected in the space distribution of the maximum.
In the next section, this procedure is used for the estimation and validation of the modal parameters of the bridges.
4. Analysis of Modal Parameter Estimation from Combined Ambient and Free Vibrations
In this section, from the records of the bridge response in free vibration, the natural frequencies of the structure and their corresponding modal dampings are estimated. In relation to the natural frequencies, a validation procedure is proposed, taking into account that normally, an analysis of the bridge subjected to ambient loads is carried out in addition to the analysis of the bridge response due to the train passages. Regarding the identification of modal damping, two techniques have been applied: half-power bandwidth method [
30] and random decrement technique [
31].
The natural frequencies from free vibrations are identified by the peak picking methodology [
32] based on the fact that when the frequency response function reaches a peak at a certain frequency, it can be associated to the force or to a resonance frequency of the structure. This procedure produces a good estimate of natural frequencies for weakly damped structures.
The half-power bandwidth method [
30] provides a straightforward approach for damping estimation. This technique evaluates the peak width of the frequency response around the natural frequencies, attributing the response to the corresponding vibration mode. The method was originally formulated based on the frequency response of a single-degree-of-freedom system, yet it is widely employed for damping estimation in complex structural systems [
33].
An interesting overview of the random decrement technique was recently published by Brincker and Amador [
34]. It is a time-domain method for extracting modal parameters from random responses. In this analysis, segments of the signal that exceed a trigger level—set at 0.5 times the standard deviation—are averaged. This averaging removes the random excitation, leaving a deterministic signal that represents the structure’s free vibration, from which damping ratios can be estimated.
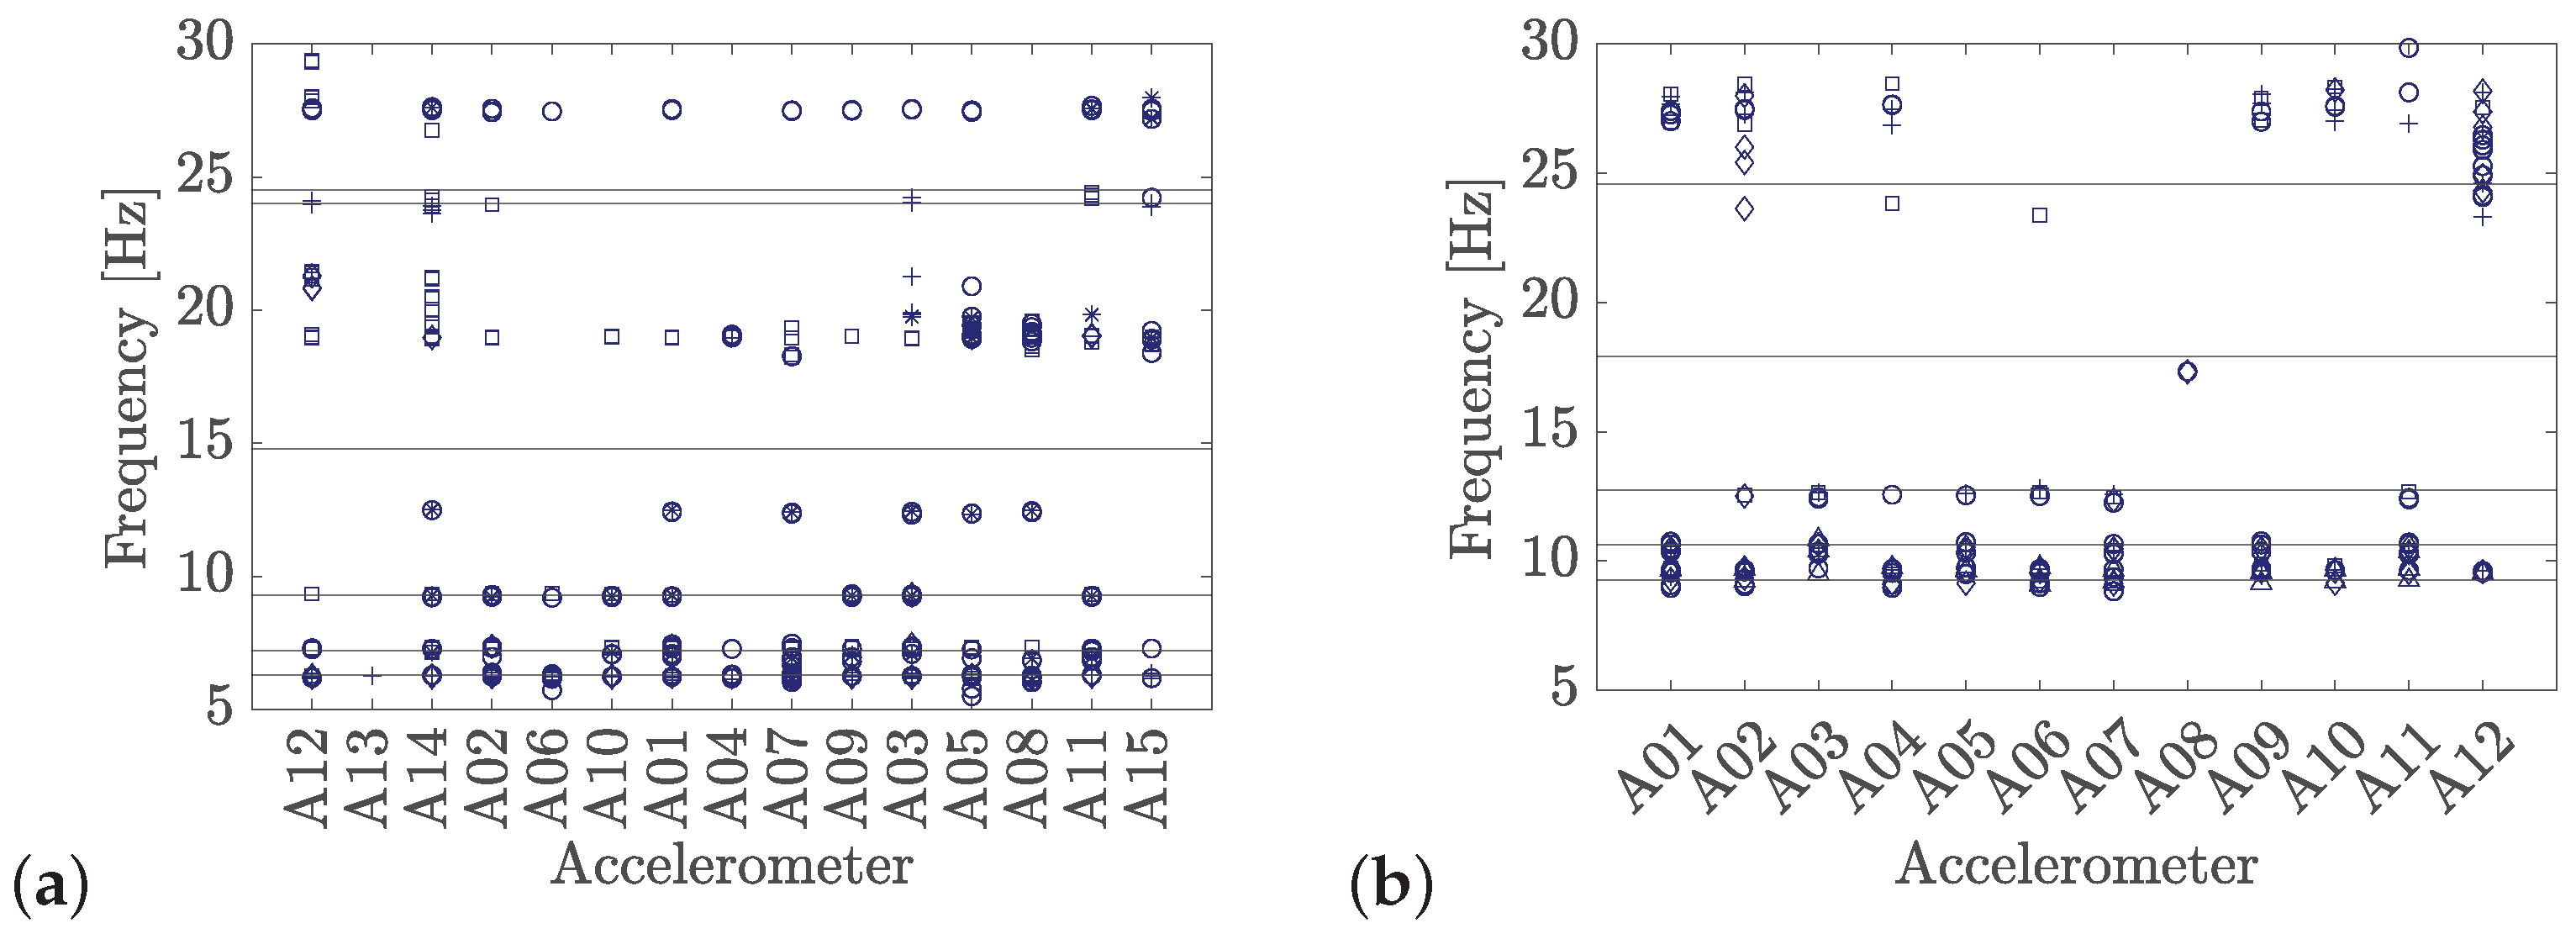
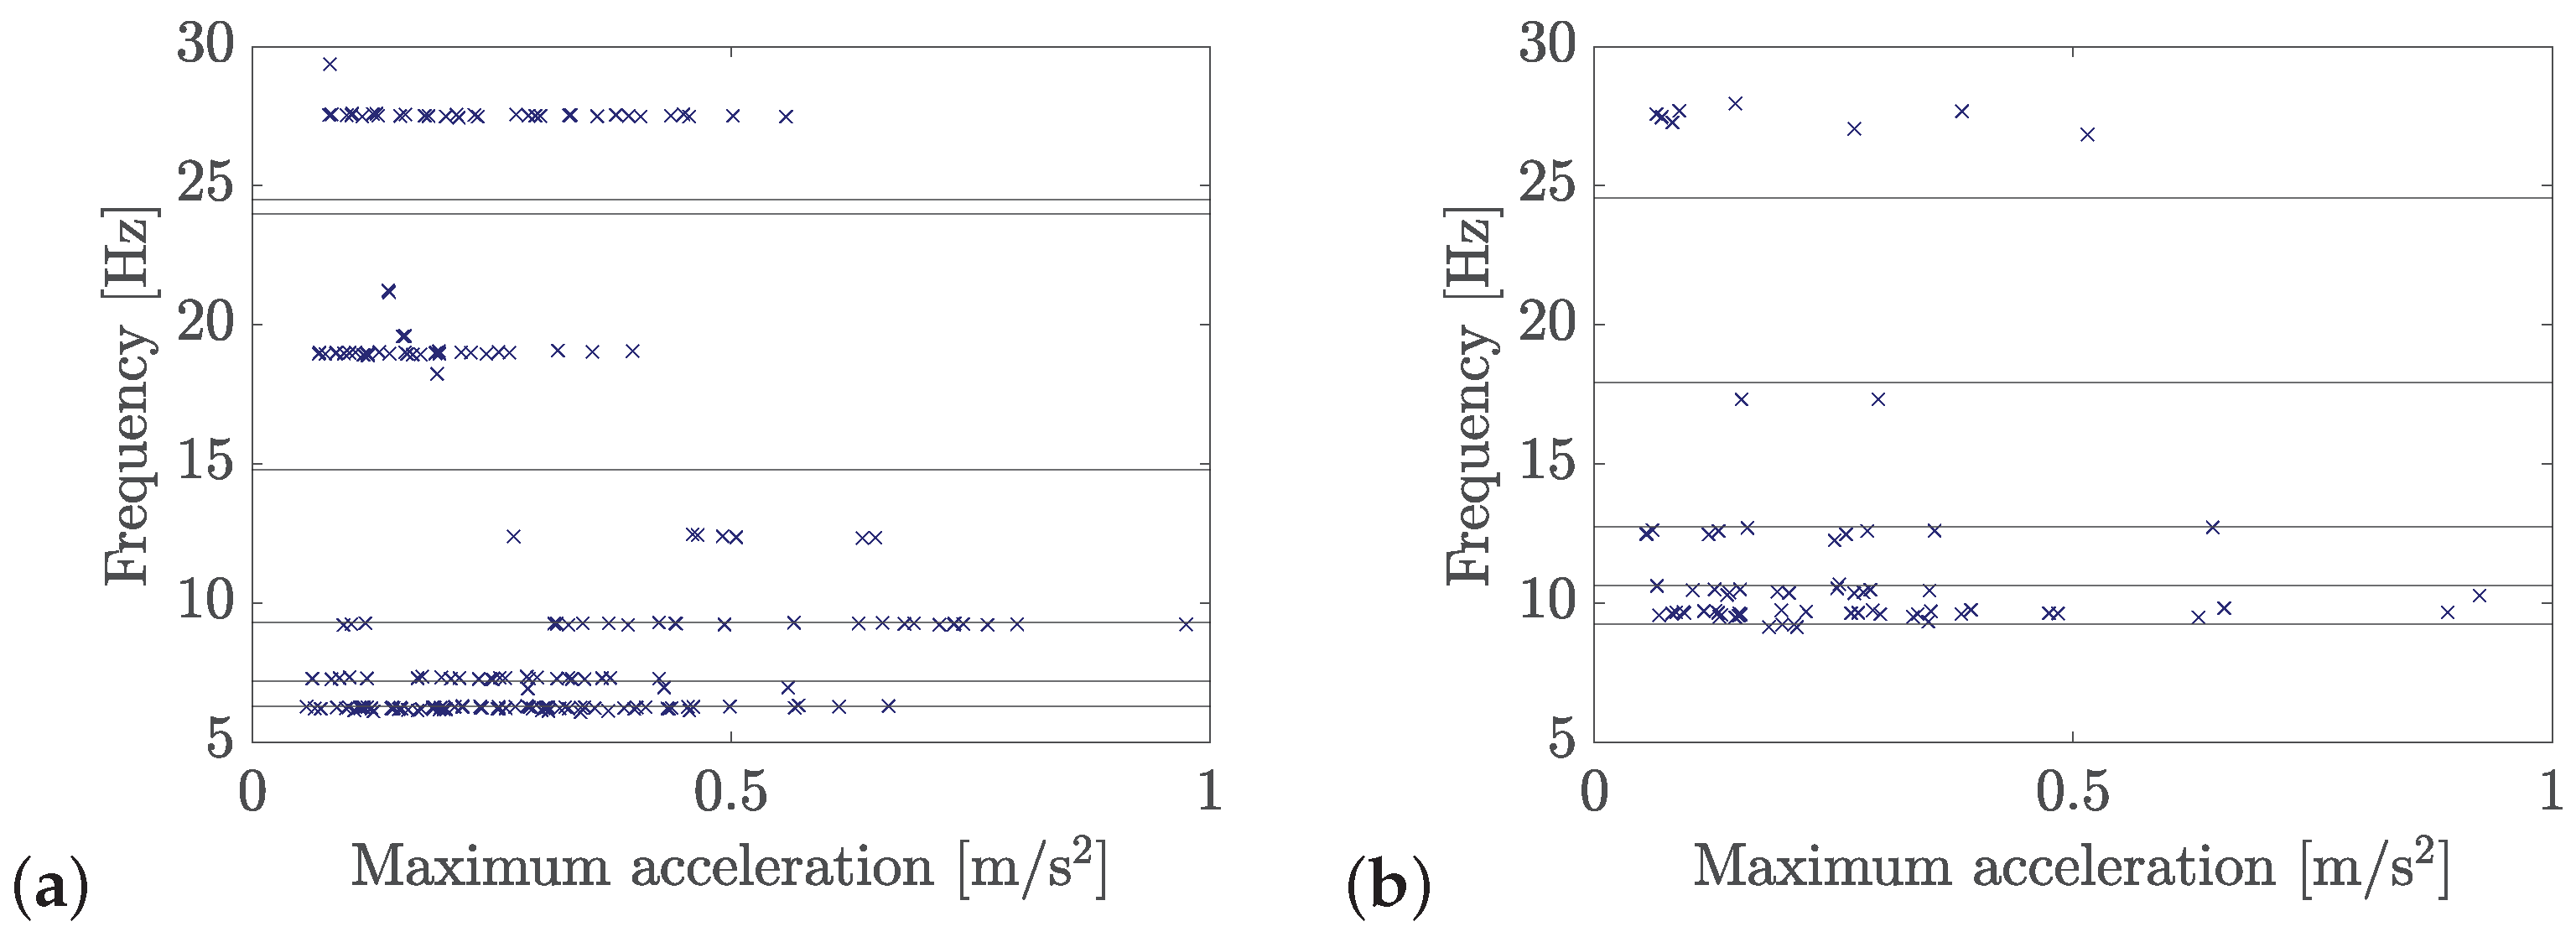
Figure 14 presents the peaks identified in the frequency response of the free vibration for all the sensors and train passages. The horizontal lines stand for the natural frequencies estimated by operational modal analysis using ambient excitation. It is clearly visible that some natural frequencies were not identified in the case of Jabalón bridge (
Figure 14a). These modes were obtained from the stabilization diagram analyzed in [
19] but discarded due to their high complexity. However, the structural response indicates that these seem to be real mode shapes.
The operational modal analysis is extended in this case, taking into account both the response to ambient loads and the free responses after train passages.
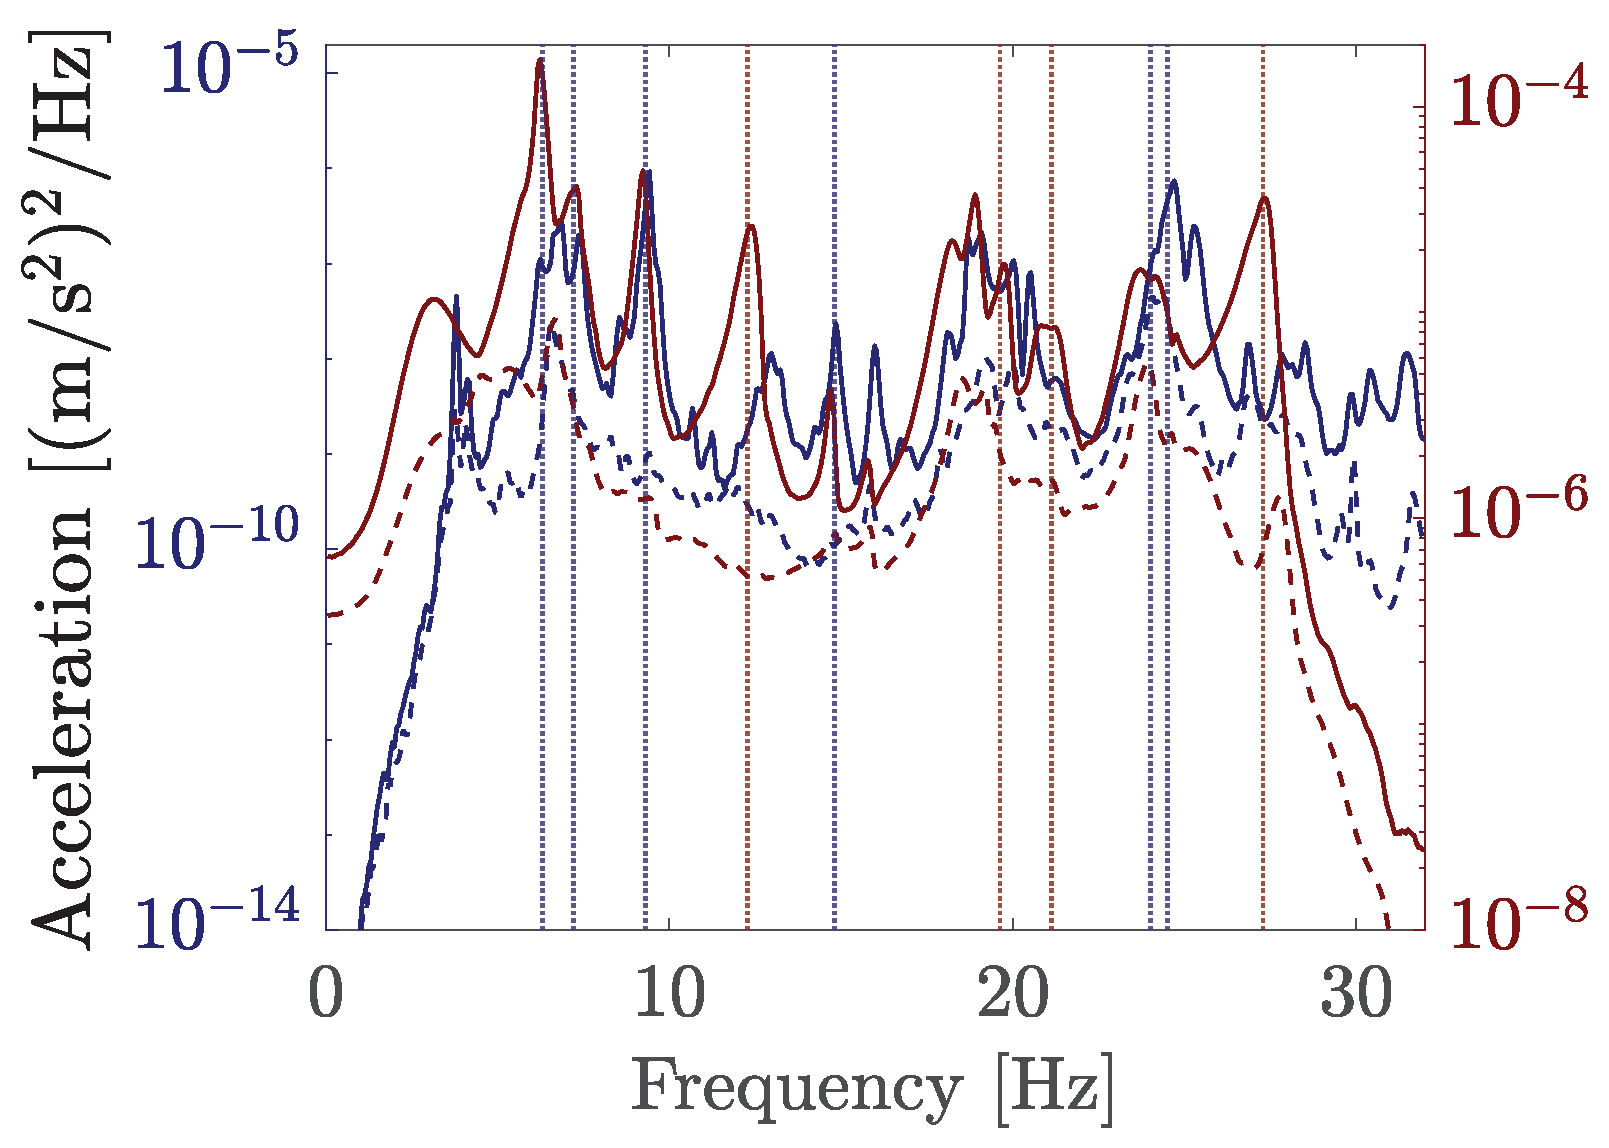
Figure 15 shows the singular value decomposition of the spectral density matrices obtained considering both responses (red lines) and only ambient loads (blue lines). It should be noted that the acceleration scales for the two compared spectra are different. The peaks appear clearer than when only the ambient load response is taken into account, as the structural modes contribute more significantly to the overall dynamic response.
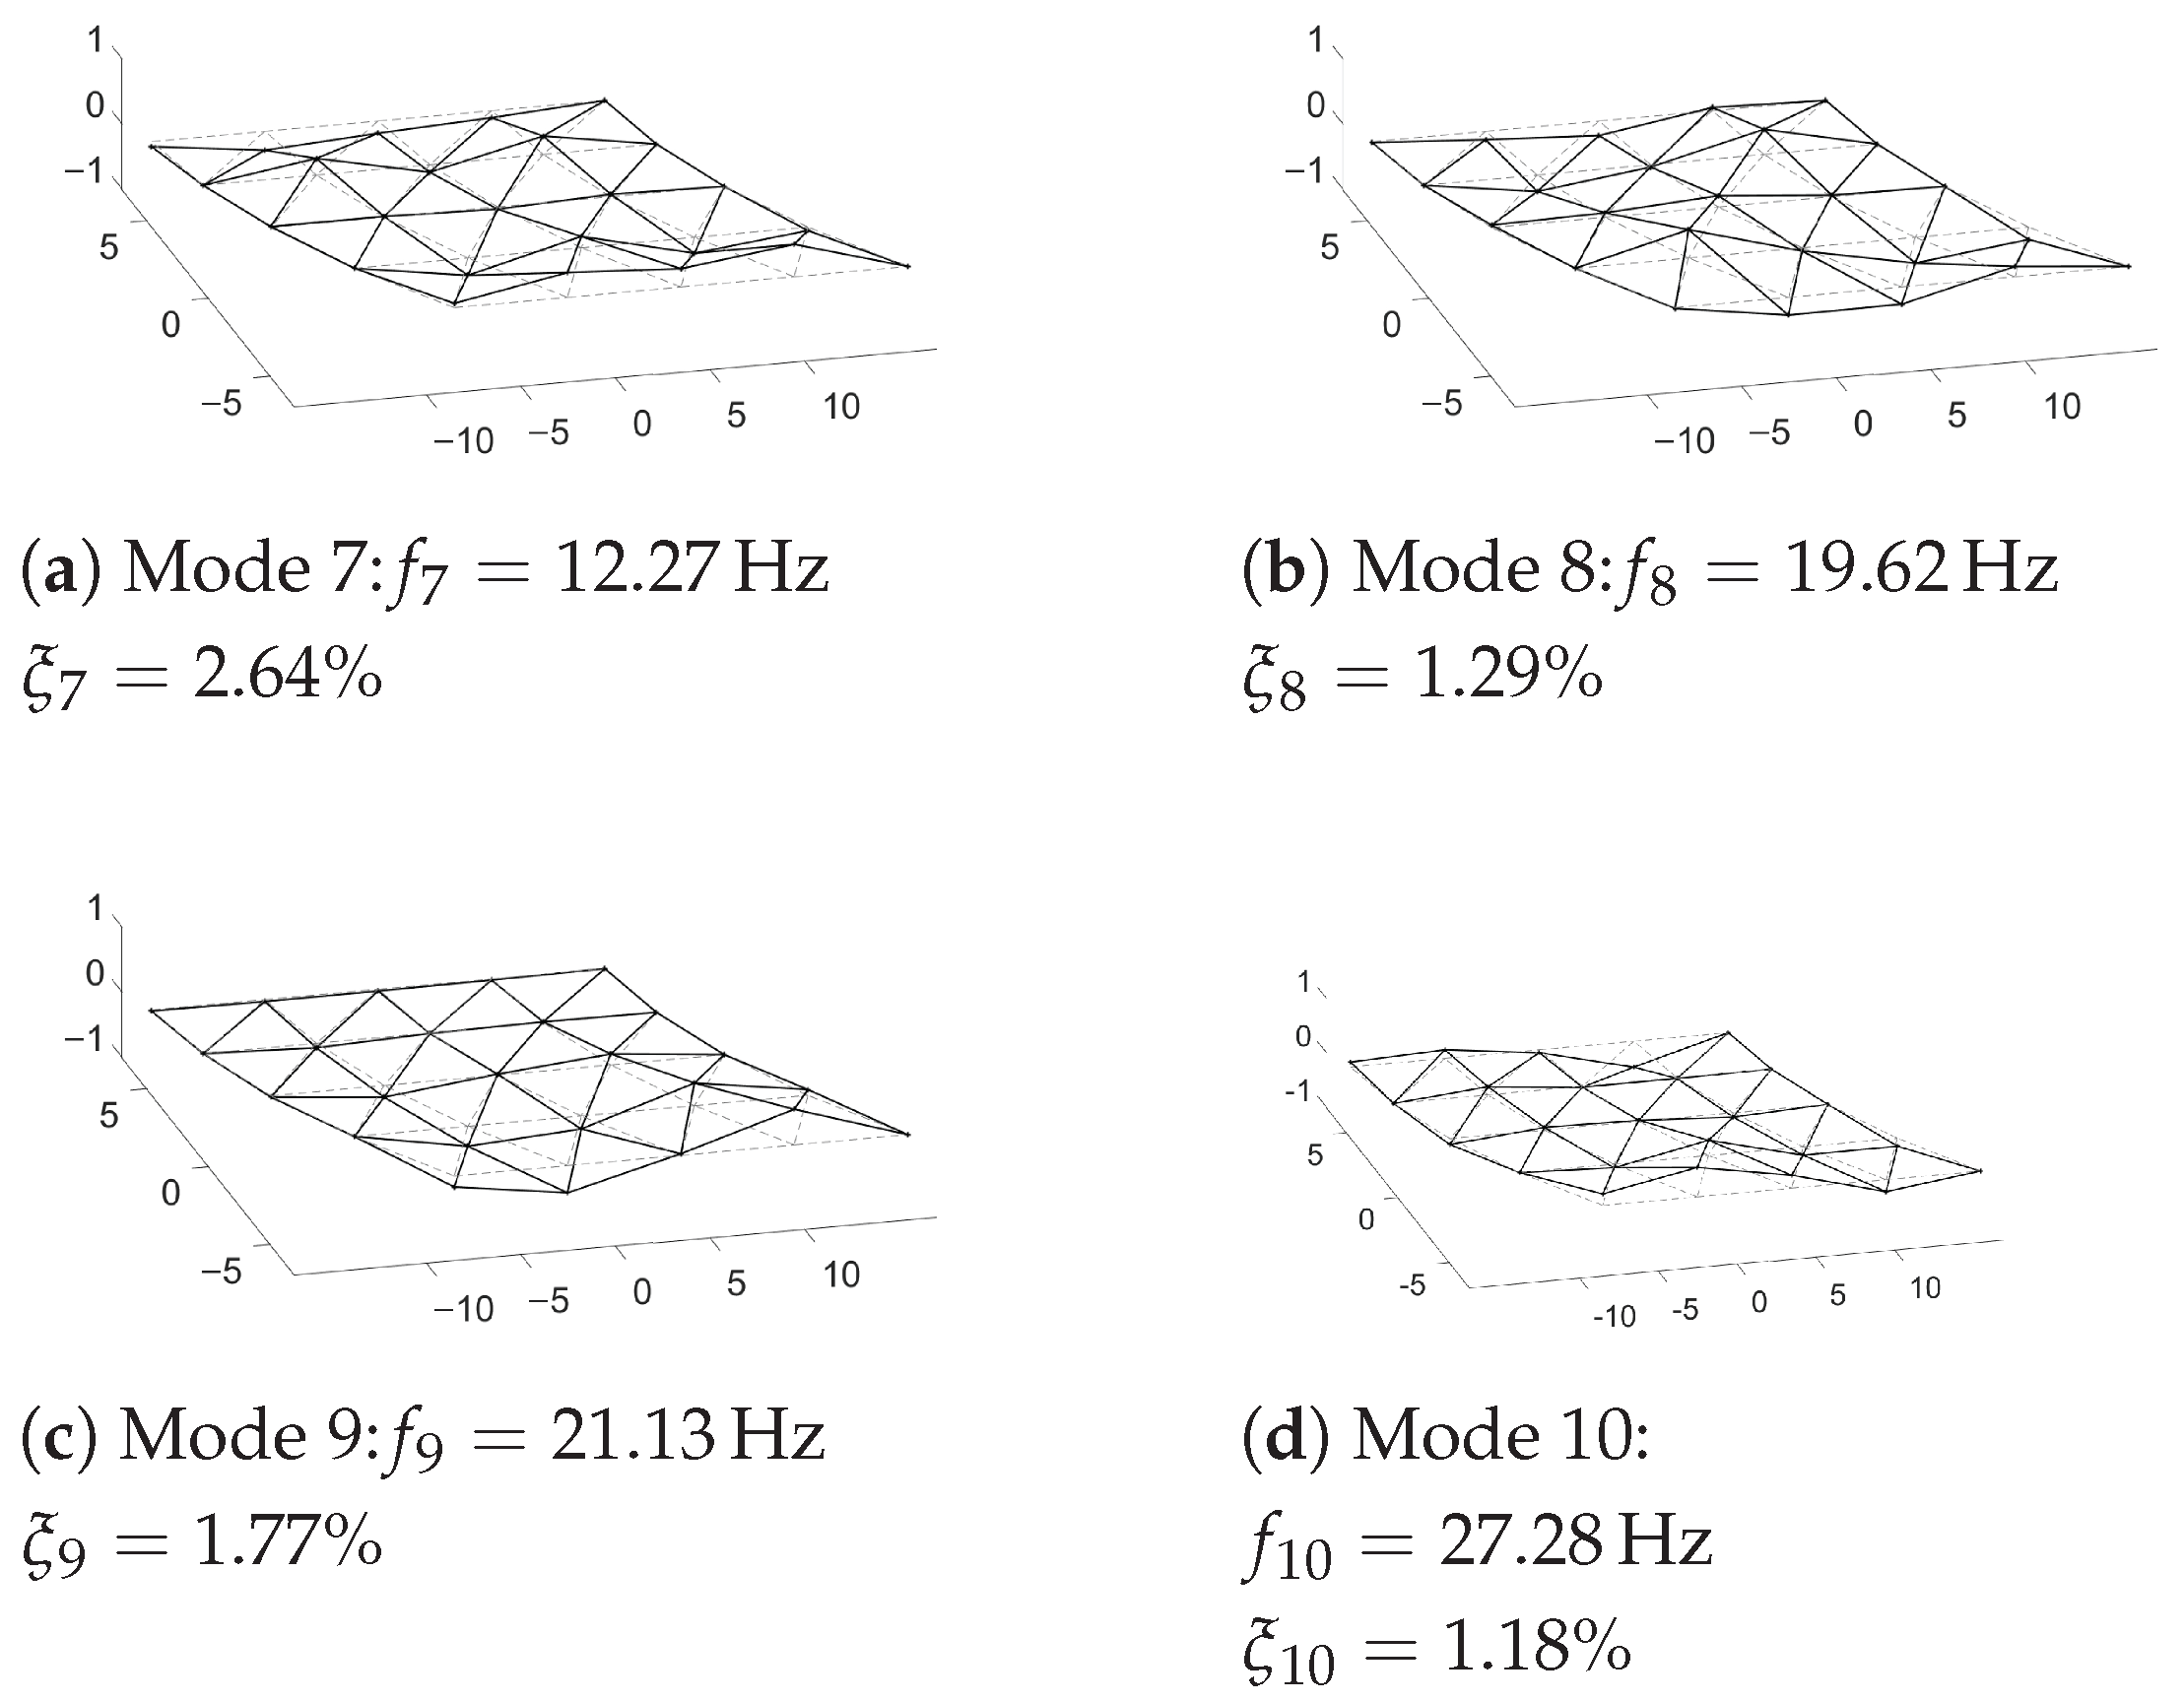
Figure 16 shows the additional mode shapes identified in the Jabalón bridge using both ambient and free vibration after train passages. Some of them are visible in
Figure 9. In the case of Arroyo Bracea I bridge (
Figure 14b), the mode shapes were identified with reasonable accuracy.
Figure 17 shows the influence of the maximum amplitude of the free vibration on the estimation of the natural frequency. This effect was previously discussed in [
16], which showed a decrease in the natural frequencies with increasing amplitude. For the cases considered in the present work (high-speed railway bridges that are stiffer than those presented in [
16]), the natural frequencies do not depend on the amplitude of the response within the frequency range of interest. The mass of the Jabalón bridge can be estimated as
and, in the case of the Arroyo Bracea I bridge,
. The mass of a high-speed train is at most 2500 kg/m. Therefore, the mass of the train entails less than 10% of that of the bridge deck, and the effect of the vehicle on the natural frequencies during the train passage is expected to be lower than 5%, and here, it has no significance.
Finally,
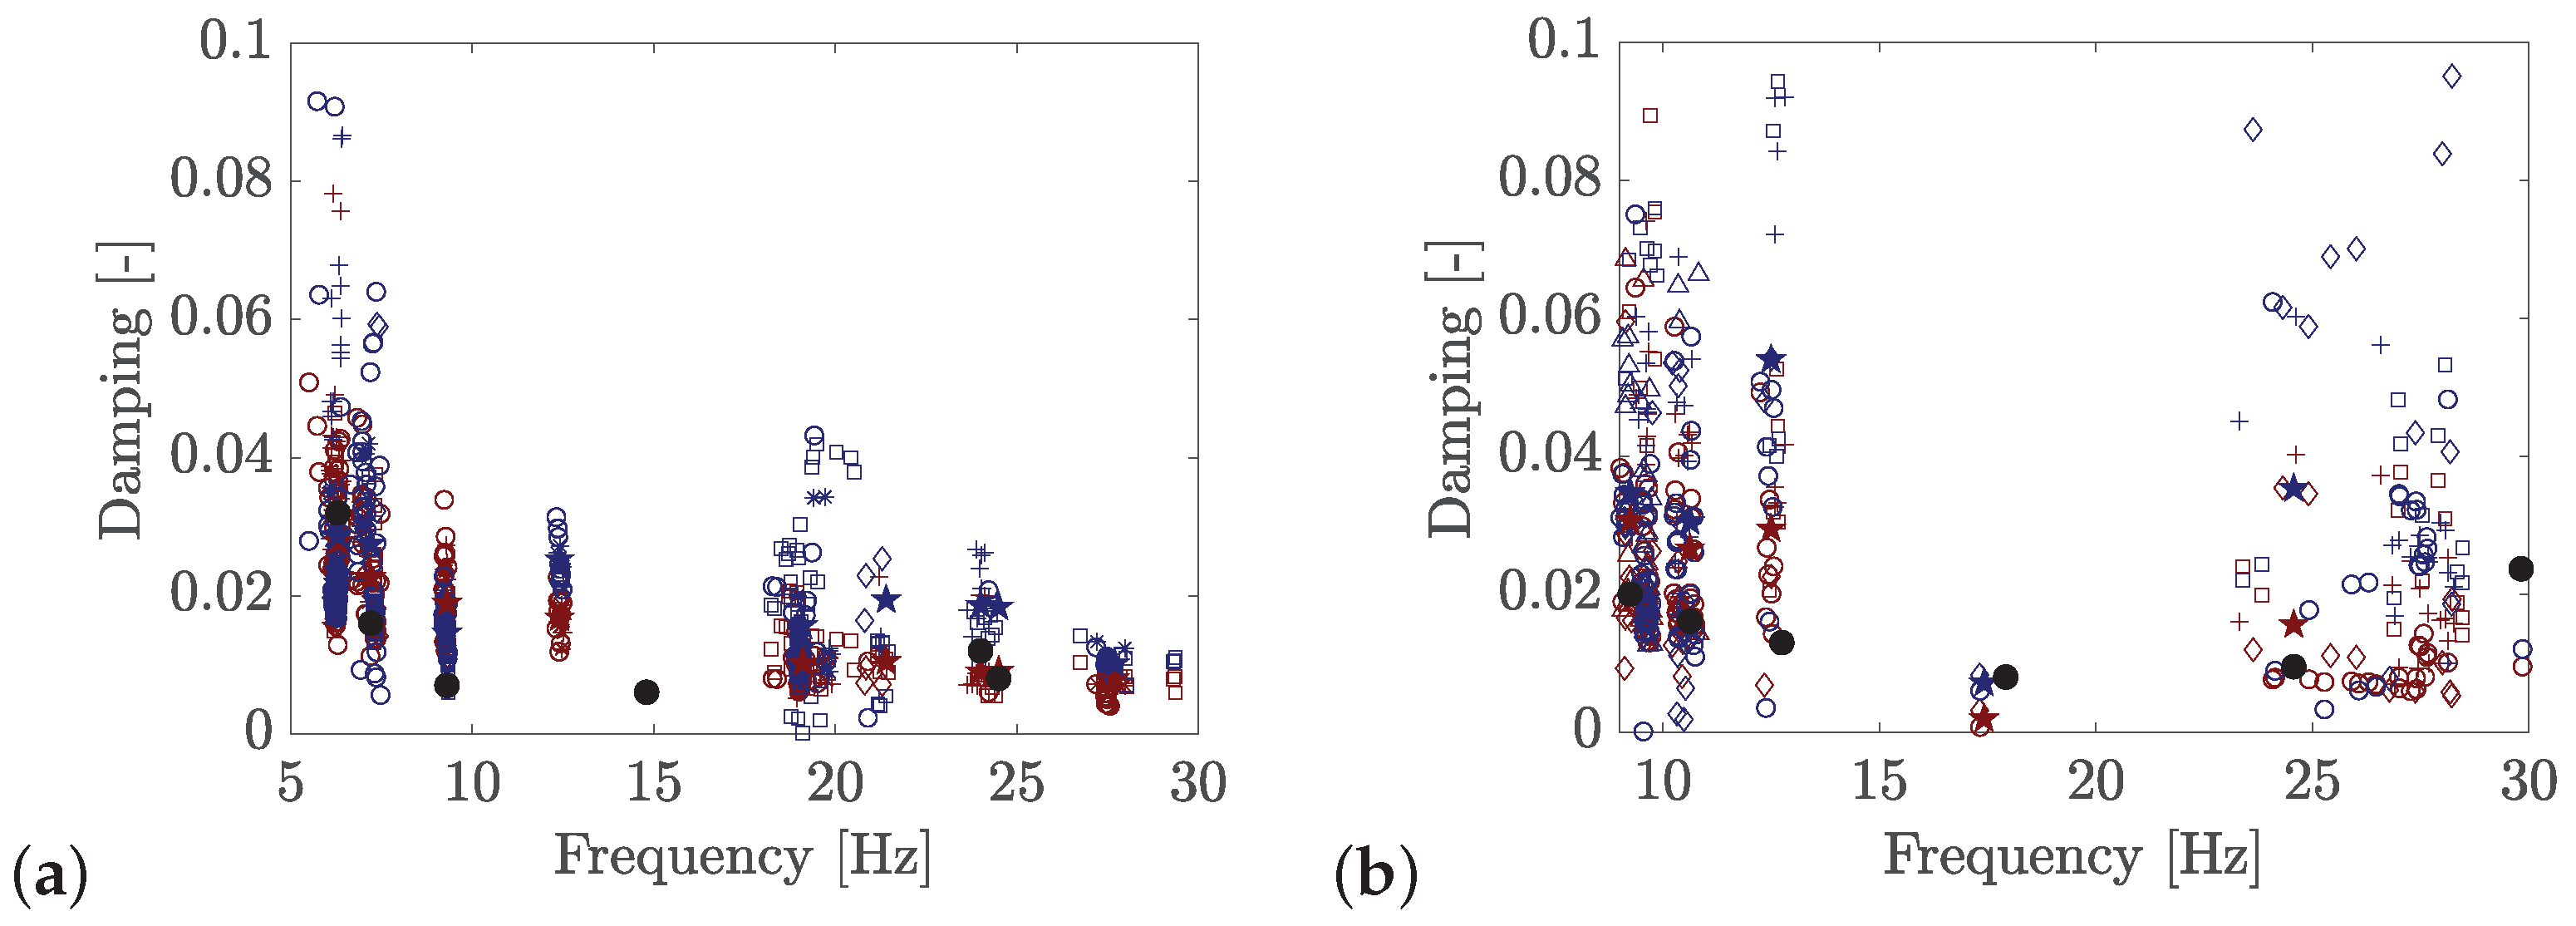
Figure 18 presents the estimations of the modal damping ratios by the half-power bandwidth method and the random decrement technique using all experimental campaign recordings. The pentagrams indicate the mean value. The results present high dispersion due to uncertainty of the damping ratio, which is affected by several variables. However, the mean values for Jabalón bridge (
Figure 18a) are similar to those obtained in [
19] using a lower number of measurements from the free vibration after the train passages. In general, the mean values of the modal damping ratios obtained for the Arroyo Bracea I bridge (
Figure 18b) are higher than those reported in [
18]. This can be explained by the fact that in this reference, only values from ambient vibration were obtained.
The analysis of the response of the bridges due to rail traffic has clarified uncertainties that were encountered during the post-processing of the operational modal analysis.
5. Conclusions
This work includes the time-frequency analysis of two bridges included in the InBridge4EU project database. The dynamic response of a bridge under the circulation of a railway convoy is complex and is affected by several factors. The most evident and certain ones are the bridge properties, the geometric configuration of train axles, and the circulation speed. Additionally, there are other factors whose determination is much more uncertain and that significantly affect the response of the bridge, such as structural damping and various interaction mechanisms, which are not trivial and are currently under investigation, the most relevant being vehicle–structure, track–structure, and soil–structure interaction effects. Some of these are only appreciable when the train is crossing the bridge because they are triggered by a certain amplitude response. This research has analyzed the identification of modal parameters from free responses after train passages and from ambient responses. The wavelet transform has been employed to distinguish between free and forced regimes. Moreover, the wavelet transform enables the characterization of the time history of the frequency response. The methodology has been useful to clarify some results obtained during the ambient modal analysis and has been especially significant for the estimation of structural modal damping, highlighting its dependence on vibration amplitude as well as on the analysis methodology. The wavelet transform is a powerful tool to be considered for studying other important effects on the structural behavior, such as the influence of the vehicle itself.

