Article

Comparative Analysis of BTM Systems Made of a Fireproof Composite Material with Nano Boron Nitride

by
Ioan Szabo
1,2,
Florin Mariasiu
1,2 and
Thomas Imre Cyrille Buidin
1,2,*
1
Automotive Engineering and Transports Department, Technical University of Cluj Napoca, 400114 Cluj-Napoca, Romania
2
EMARC Research Centre, Technical University of Cluj Napoca, Muncii Bvd. 103-105, Room C205-a, 400114 Cluj-Napoca, Romania
*
Author to whom correspondence should be addressed.
Submission received: 27 December 2024 / Revised: 28 January 2025 / Accepted: 1 February 2025 / Published: 4 February 2025
(This article belongs to the Special Issue Advances in Thermal Energy Storage in Fire Prevention and Control)

Abstract

The paper presents a numerical analysis of the possibilities of replacing the aluminum serpentines in the current construction of battery thermal management systems (BTMS) with cooling serpentines made of fireproof composite materials with high heat transfer parameters (fireproof epoxy resin + nano boron nitride). This approach was given by the need to replace aluminum (which, in case of fire, maintains and accelerates the combustion process) with fireproof materials that reduce/eliminate the fire risk due to improper battery operation. Numerical analysis methods were used through simulation to identify the most efficient design among the single-channel, multichannel, multiflow and multiple coolant inlet–outlet solutions for cooling serpentine. In addition to these geometric constructive parameters, the variation of the coolant flow rate (9, 12, 15 and 18 L/min) and coolant inlet temperature (17, 20 and 25 °C) was also considered. The obtained results showed that the single-inlet nanocomposite resin cooling serpentine four-channel configuration presents the highest cooling efficiency of the cells that form the battery module while ensuring very good thermal uniformity as well. These findings are supported by the lowest average heat absorption by the batteries, of 34.44 kJ, as well as the lowest average internal resistance difference (caused by thermal gradients), of 5.23%. Future research is needed to identify the degree of structural resistance of serpentines made of fireproof composite material to external stresses (vibrations characteristic of the operation of electric vehicles).

1. Introduction

It is now widely accepted that electric vehicles (EVs) are the solution to decarbonization and pollution reduction in the transport sector. In addition to the environmental benefits of their use (zero local emissions), energy efficiency considerations (higher than vehicles equipped with internal combustion engines that use fossil fuels), dynamic performance (achieving instant torque that provides rapid vehicle acceleration) and lower operating costs due to the price of electricity and fewer maintenance and repair operations, all of these make electric vehicles have a constant increase in the penetration rate of the automotive market [1].
However, it must be taken into account that electric vehicles base their operation on the energy sources (battery and/or fuel cell) with which they are equipped, which also have a direct influence on the selling price. Currently, battery electric vehicles (BEVs) mainly use Li-ion technologies to build the electrochemical cells that form the battery. Li-ion energy cell technology offers several immediate advantages highlighted by [2,3]:
  • High energy density: storing a large amount of energy in a small volume;
  • Relatively long life: can be charged and discharged many times (cycle life) before their capacity significantly decreases;
  • Fast charging: ready for use in a short time;
  • Maintenance-free: does not require regular maintenance in operation.
However, the disadvantages of using a Li-ion battery as an energy source must also be taken into account, such as high costs, aging and degradation, environmental impact, safety concerns and temperature sensitivity; and in this context, the dangers due to fire and fire risks must be taken into account [4]. Electric vehicles (EVs) present fire risks, mainly due to the particularities and characteristics of the energy sources (lithium-ion batteries). In the event of improper operation or manufacturing defects, there is the possibility that a battery cell will overheat and ignite (which leads to a chain reaction due to the adjacent location of other cells that form the battery). The phenomenon is known as battery thermal runaway.
There is extensive research worldwide that tries to minimize or eliminate this effect by designing, developing and building high-performance battery thermal management systems (BTMS) [5]. It should be emphasized that there is still no single solution regarding a standard topology for the construction of a thermal management system and, even more so, solutions effectively implemented in the construction of energy sources to reduce/eliminate the risk of fire. Research into the possibilities of reducing/eliminating the risk of fire in the battery (due to the phenomenon of thermal runaway or due to road accidents that can lead to the perforation of the electrochemical cell casing) has developed in several directions from reinforcing the battery case (box) to applying fireproof solutions with more or less convincing results.
The development of flame-retardant polymers with high standards has always been a challenge due to traditional time-consuming methods based on empirical intuition and trial and error screenings, and their application in BTMS systems is even more so. Research studies addressing BTMS in relation to fire resistance are relatively few, most of them considering the possibility of using phase change materials (PCM) both for efficient heat transfer and as a barrier against fire spread. Yang et al. [6] propose the use of a flame-retardant multifunctional phase change composite material based on paraffin (PA), styrene-butadiene-styrene (SBS), expanded graphite (EG), methylphenyl silicone resin (MPS) and triphenyl phosphate (TPP) in the BTMS of 26,650 ternary power battery modules. In addition to maintaining the optimal internal temperature of the battery module for 2C discharges, the developed composite material exhibits excellent suppression of thermal runaway triggered by multiple heat sources and the occurrence time of thermal runaway. Zhao et al. [7] analyze that research on phase change materials (PCM) for BTMS often focuses on only one major characteristic: either flame resistance or flexibility (because it is difficult to obtain solutions that combine both characteristics). To solve this, a flexible flame retardant PCM created from aluminum hydroxide (ATH)/magnesium hydroxide (MTH)/ammonium polyphosphate (APP) was developed and experimented. The optimal ratio of ATH/MTH/APP was determined to be 9:3:8, successfully combining the characteristics of flame retardancy and flexibility (LOI 28.3, delayed the time triggered by thermal escape by 84 s and reduced the maximum temperature by 92.3 °C). Zhang et al. [8] added two flame retardant materials (ammonium polyphosphate (APP) and red phosphorus (RP)) to a PCM composed of paraffin (PA)/expanded graphite (EG)/(ER). It was found that for an optimal ratio of APP to RP of 23/10, the LOI index has a value of 27.6, and by using it in BTMS, the internal temperature can be effectively controlled at a 3C discharge rate of the battery. The efficient control of the battery thermal management was also successfully achieved by adopting a flexible and flame-retardant PCM proposed by Liu et al. [9]. The composition was based on the use of a mixture of paraffin, expandable graphite, carbon fiber powder, ammonium polyphosphate (APP) and α,ω-Dihydroxy-poly-siloxane (RTV 107). The battery surface temperature was 7 °C lower at 2 °C charge and discharge cycles (compared to the considered basic flexible flame retardant).
One direction of research is to use fireproof solutions based on composite resins (epoxy). Epoxy resins are a class of organic polymers containing two or more epoxy groups in their molecules, and due to their excellent adhesion, insulation, heat resistance and corrosion properties, they are widely used in various industries, including the automotive industry [10]. However, the use of epoxy resins presents a high risk of ignition and combustion due in principle to the LOI (Limiting Oxygen Index) characteristic of approx. 19.8%, a combustion process characterized by the release of large amounts of heat and toxic smoke [11]. The latest research advances on reactive flame-retardant epoxy resins are comprehensively presented in laborious works that analyze the flame-retardant effects of epoxy resins in combination with different chemical compounds (with the advantages and disadvantages of their use) [11,12].
Based on their chemistry and mode of action, phosphorus-based flame retardants are one of the most researched classes due to their good compatibility with epoxy resins and low toxicity compared to other classes, such as halogenated compounds [13].
SiO2 nanoparticles and the phenethyl bridged DOPO derivative (DiDOPO) were used to prepare epoxy composite resins in order to increase their flame retardant performance and thermal stability [14]. It was observed that by increasing the SiO2 content from 2 to 15 wt%, the UL-94 index changed from N.R. to V-0 rating, and the LOI value increased from 21.8 to 30.2% (compared to pure epoxy resin), which provides future premises to develop and use these types of composite epoxy resins in fireproof applications. The development of a bio-based epoxy resin based on phosphorus-nitrogen was also carried out. The product obtained and subjected to analysis shows superior flame resistance and fire safety compared to epoxy resin (epoxy value 0.51). The LOI value of new epoxy resins increases from 25.8% to 42.3%, and the UL-94 index from N.R. to V-0 rating (flame self-extinguishes in 3 s) [15]. Based on the same premises, research was also carried out in which the flame retardant contribution of only phosphorus compounds (phosphorus content: 0.22%) was investigated [16]. The LOI value of the new epoxy compound increased from 21.0% to 40.0%, the UL-94 test rating was improved from N.R. to V-0, while the yield measured in carbon residues of the new epoxy compound (28.6%) was more than double compared to pure epoxy resins (11.6%).
A universal strategy was researched and proposed by introducing suitable rigid-flexible groups (Si–O segment) into the flame-retardant epoxy resin, which can simultaneously improve its transparency, flame retardancy and mechanical properties [17]. The optimized resin compound exhibits an increase in toughness (impact strength from 6.8 kJ/m2 to 25.2 kJ/m2), an LOI value of 32.3%, a V-0 rating in UL-94 test, a high transmittance of about 92%, and excellent smoke and heat suppression properties. The possibilities of incorporating organic materials into the structure of epoxy resins to increase their flame-retardant properties have also been investigated [18]. The flame retardant mechanism of epoxy composites with the combination of organic (CF-PO(OPh)2) and inorganic compounds (SiO2) showed an excellent thermal barrier effect, flame retardant and mechanical properties, as well as a high smoke suppression effect. The addition of synergistic compounds based on SiO2/MOF (silica, polyaniline and zeolitic imidazolate) in the epoxy resin (6%) led to an LOI value of 28% under conditions in which the mechanical properties of the new composite have a slight decrease compared to a pure epoxy resin, due to the formation of a carbon layer that prevents combustion in the gaseous and solid phases [19]. Research on a new halogen-free flame retardant (DTB) containing phosphorus, nitrogen and boron introduced into an epoxy resin indicated that the flame retardant and smoke inhibition performance of the developed thermosets were significantly improved with the incorporation of DTB [20]. The possibility of incorporating fire-retardant nanofillers into epoxy resins was studied and analyzed in [21]. The epoxy nanocomposite with only 2.5 wt% MgAl@NiCo passed the UL-94 test with a V-0 rating, while the sample containing the same amount of MgAl did not show any rating. The LOI value of the epoxy nanocomposite increased from 23.5 to 26.0% compared to that of the pure epoxy.
Among the organophosphorus flame retardants, phosphazene compounds can significantly improve the flame retardancy of epoxy resins due to the phosphorous and nitrogen flame-retardant synergy [13]. The primary factors limiting flame propagation are the growth of closed pore size and the thickening of coke walls formed during combustion, both of which are enhanced by an increased phosphorus–nitrogen content [22]. Research demonstrated that cured epoxy compositions with 75 wt% of phosphazene I and phosphazene II fall into the category of self-extinguishing materials [22]. Epoxy resins cured with arylaminocyclotriphosphazenes demonstrate fire resistance to the UL-94 standard of V-0 rating [23].
From the presentation of current research related to the use of fire-retardant epoxy resins, it can be seen that they are predominantly oriented towards establishing the exclusive properties related to fire resistance (UL-94 test, LOI) without emphasizing the thermal transfer characteristics. In the field of developing solutions that aim to reduce/eliminate fire risks for the energy sources that equip EVs, it is necessary for these characteristics to be considered. It is well known that both the operating efficiency and the service life of a battery depend on the temperature developed (reached) by the electrochemical cells (due to repetitive charging/discharging processes at various intensities) [24,25,26].
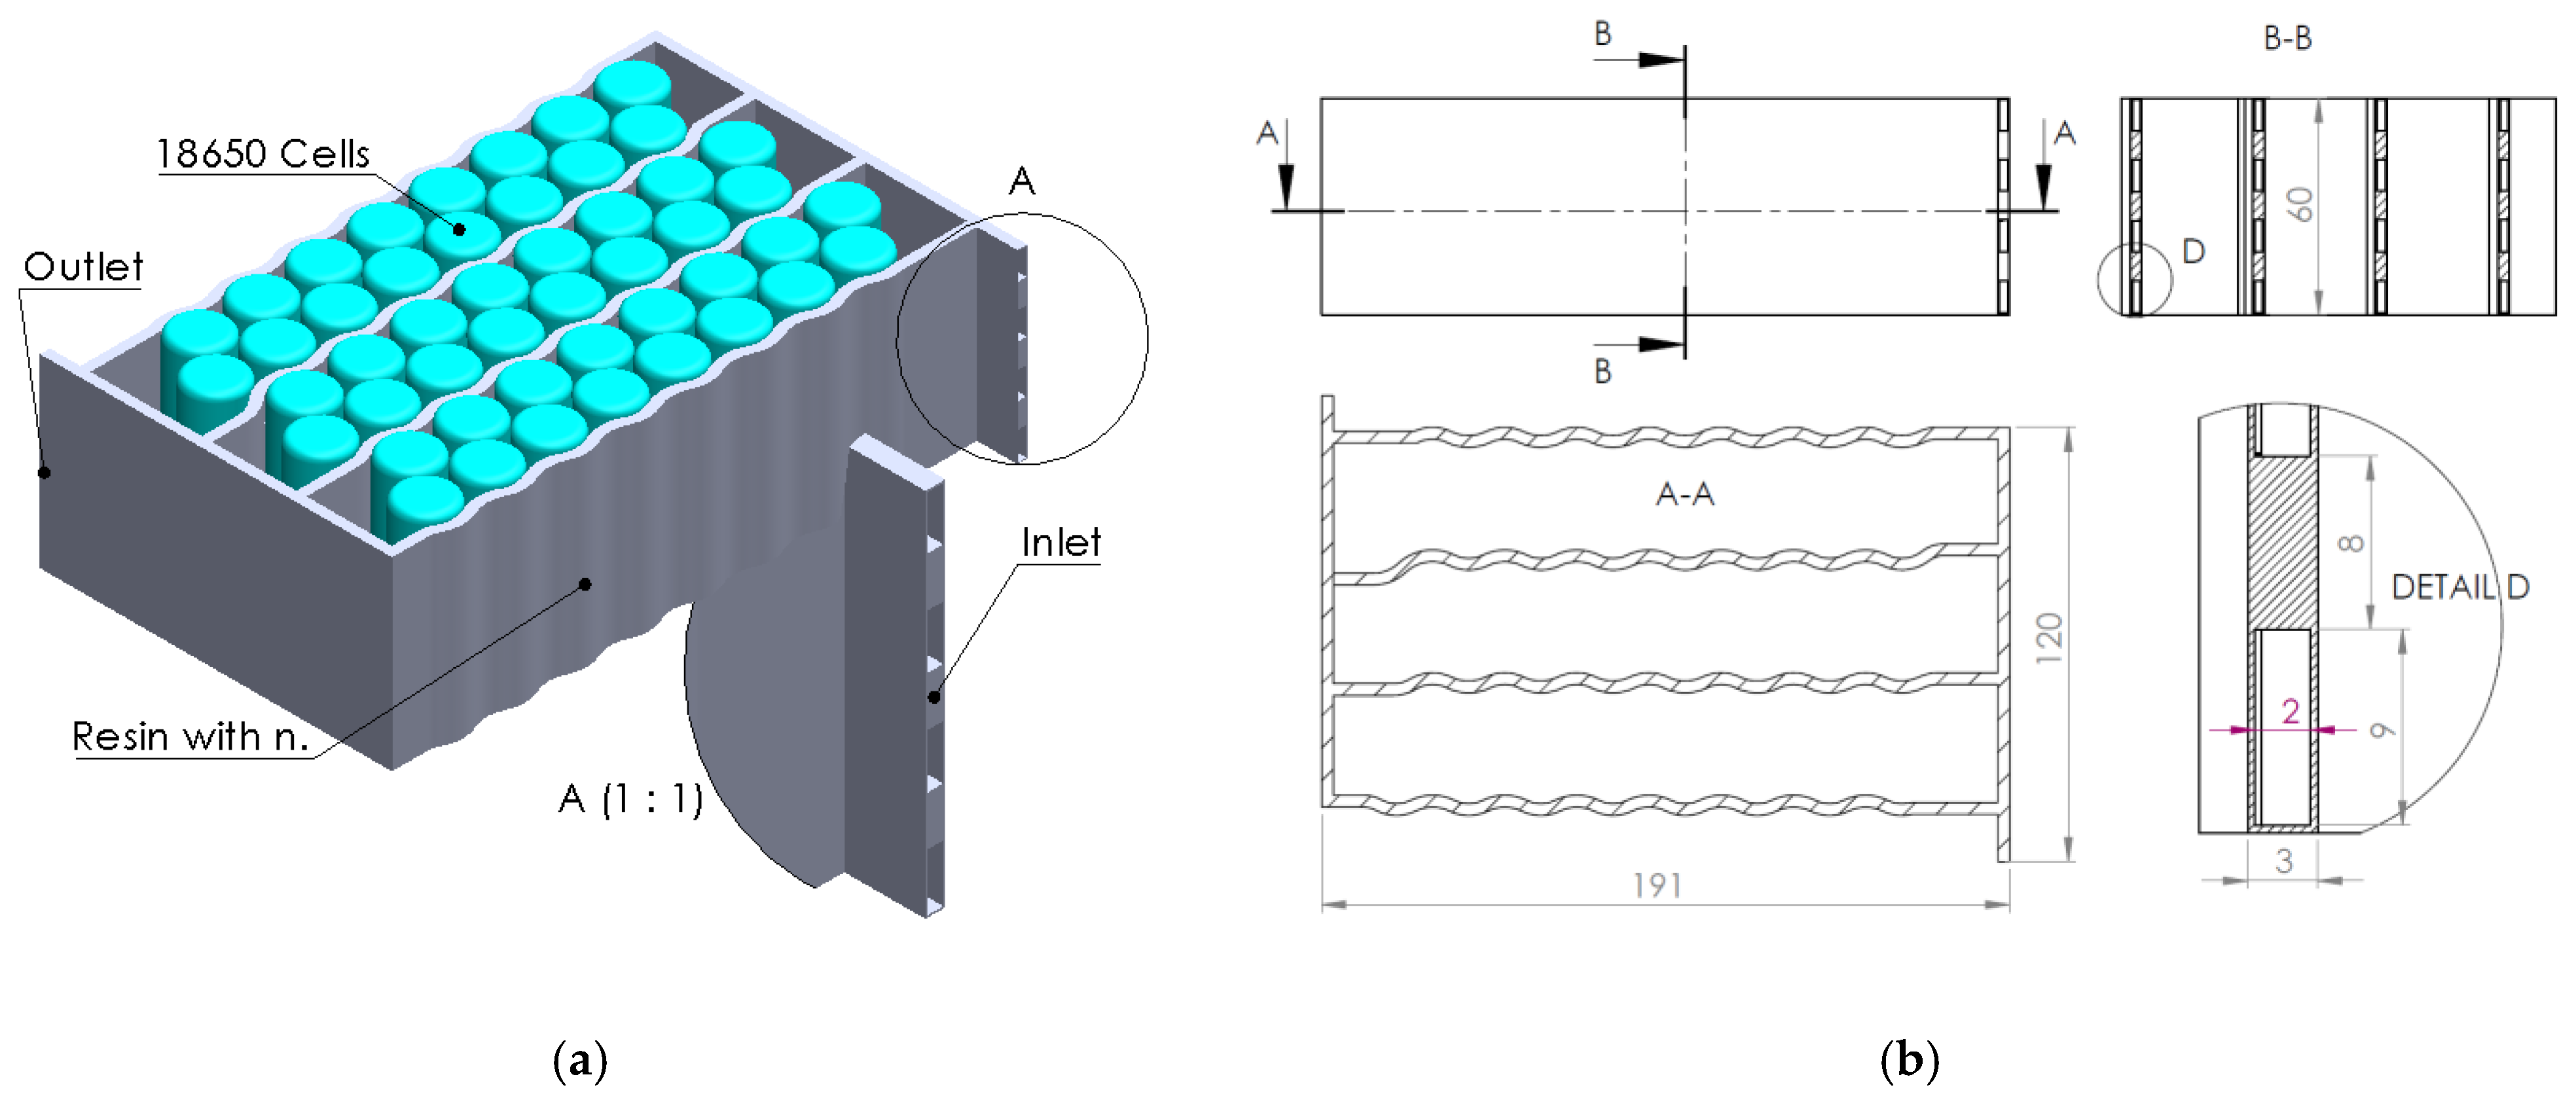
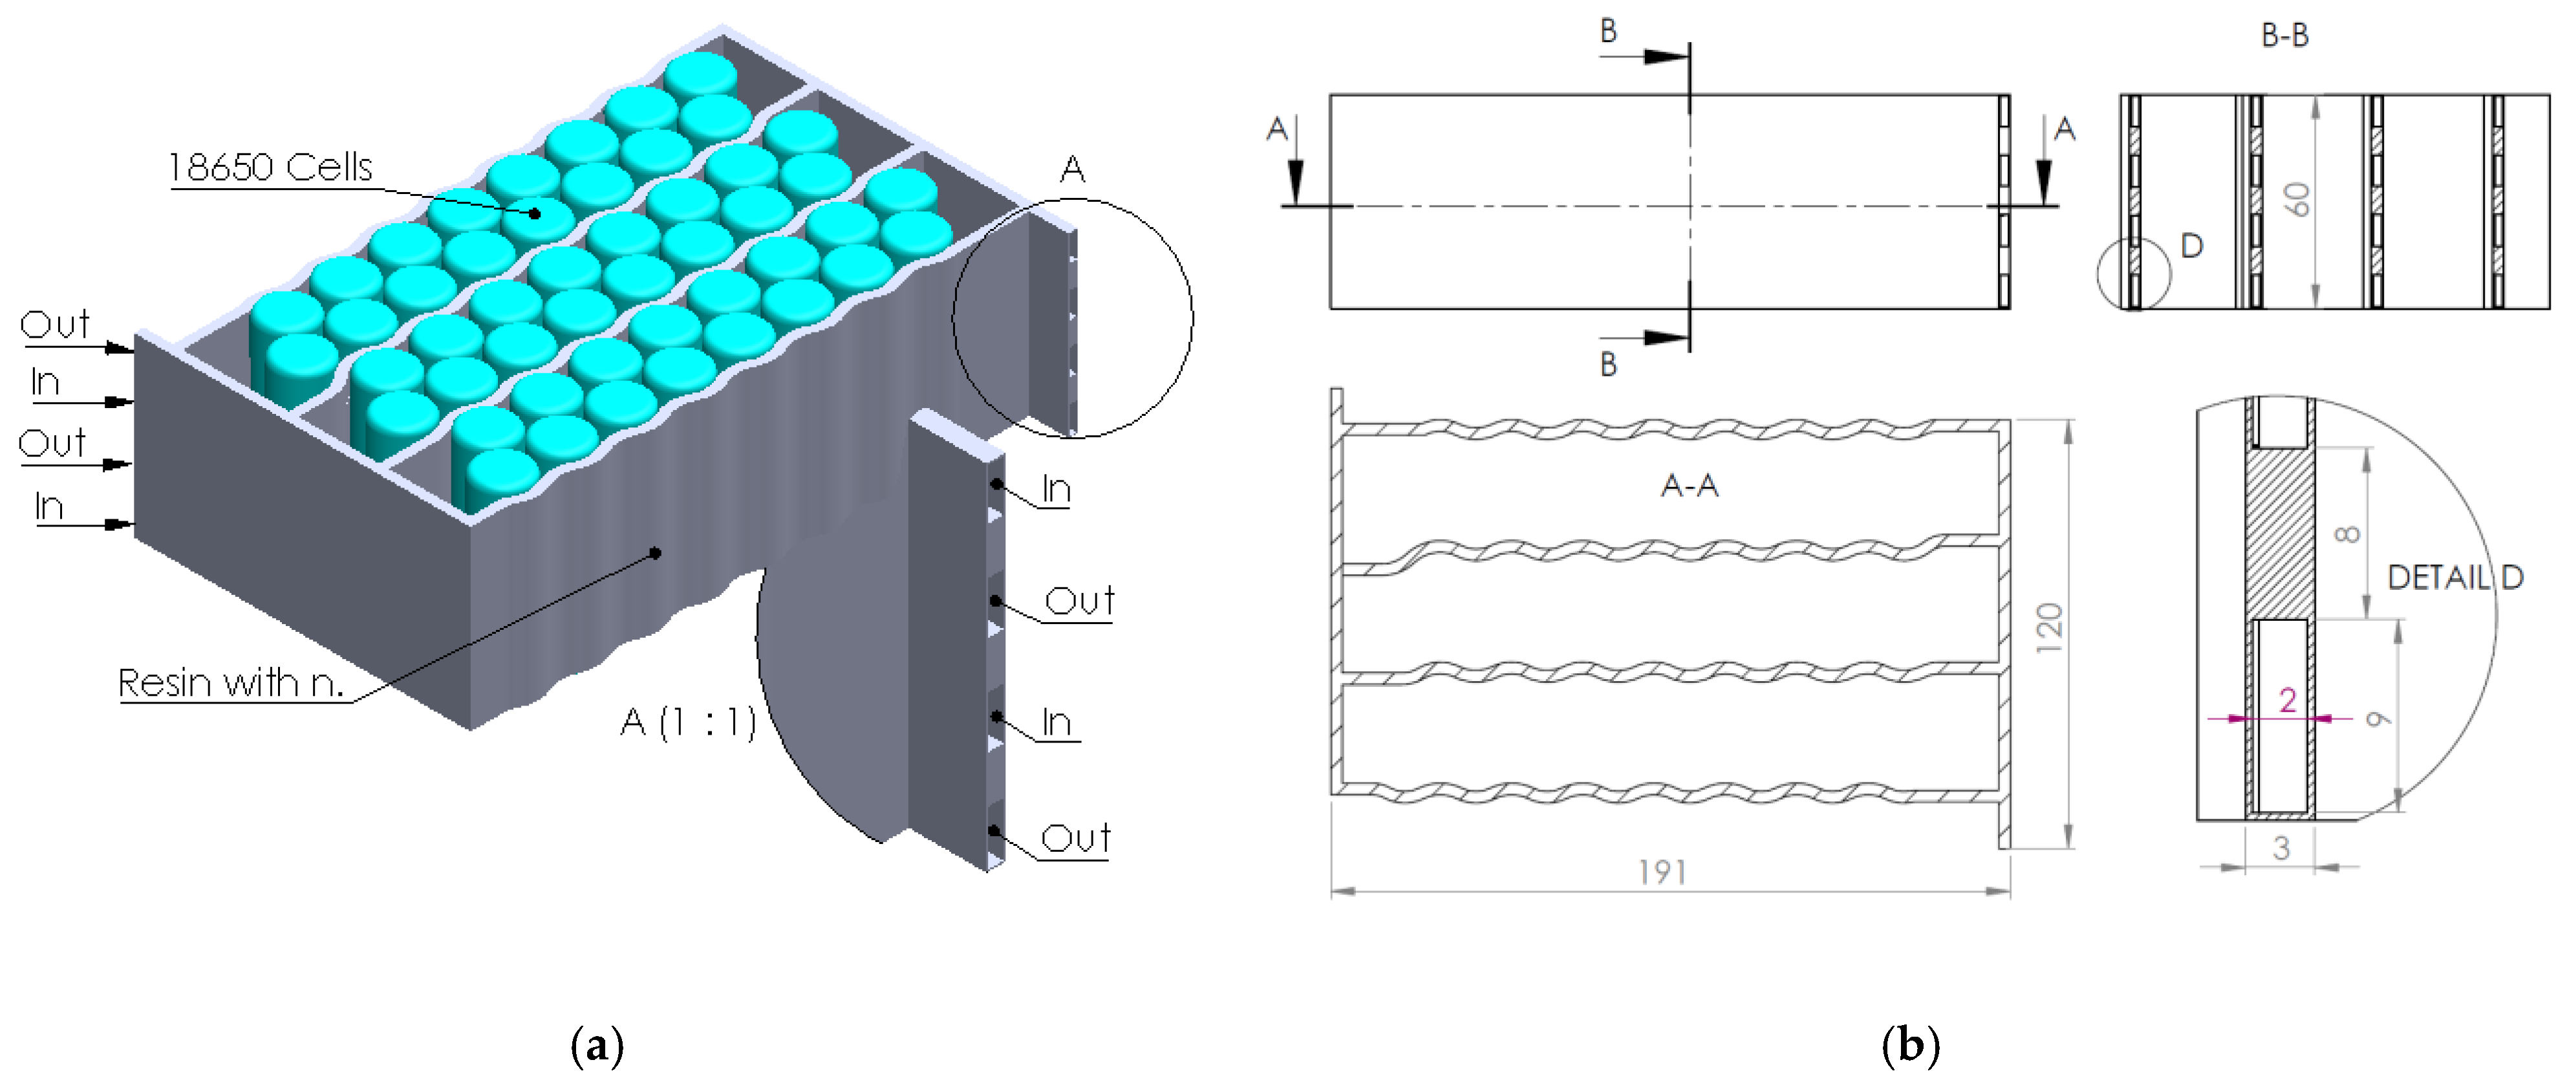
The present article’s authors’ research was directed towards the creation and application of an epoxy composite resin containing boron-based nanomaterials in a BTMS design (cooling serpentine). This ceramic filler has excellent applicability in components surrounding electronic components and, therefore, also in BTMSs, especially due to its high thermal conductivity and electrical insulation properties [27,28]. This type of nanomaterial was used due to the good results obtained and experimentally validated by the authors’ previous works [29,30].
In the context of the research presented above, the present article aims to analyze the effect and efficiency of using a composite resin as a thermal transfer element generated by electrochemical cells integrated into a liquid thermal management system (water-cooling serpentine-based, single and multichannel, and single and multiple inputs/outputs). Several serpentine designs made of composite resin were developed and analyzed (through numerical analysis methods) to establish the thermal transfer efficiency of the heat generated by the cells while providing fireproof protection. The study regarding the possibility of replacing aluminum components in the design of a BTMS with fire-retardant components is due to the exothermic and violent combustion character of aluminum under fire conditions. Section 2 presents the characteristics of the material used for the study and the way in which the BTMS constructive cases were chosen for performing the numerical analyses of the heat transfer field. Section 3 presents the results obtained through simulation, and these results are interpreted and discussed in Section 4. Section 5 makes a summative assessment of the study’s needs, objectives, and results, and it especially identifies future research directions in the field.

2. Materials and Methods

The Materials and Methods section is structured into two large sections that describe how the composite resin used in the study was made (along with its characteristics and physico-chemical properties) and how the numerical analyses were performed for each constructive case considered.

2.1. Characteristics of Composite Flame Retardant Resin

Based on the authors’ previous research [29,30], a composition based on a fireproof epoxy matrix (ER2220—manufacturer Electrolube, UK) and an addition of 3% wt. nano boron nitride was chosen to create the fireproof serpentine of the considered BTMSs. The two-part epoxy (resin + hardener) has an exploitable life span of 120 min at 20 °C after mixing the two parts, with the liquid mixture having a viscosity of 1500 mPa∙s and a cure time of 24 h at ambient temperature. In this timeframe and under these conditions, the nano boron nitride has to be homogenously mixed within the resin. The fillers of the fireproof epoxy matrix consist of zinc oxide and aluminum hydroxide (the mass proportion of the addition materials is 42%). The hexagonal nano boron nitride (manufacturer—PlasmaChem GmbH, Berlin, Germany), used as supplementary filler in the mixture, has the following main characteristics: an average particle size of 500 nm with a specific surface area of 23 ± 3 m2/g and a density of approx. 2.25 g/cm3 [30]. This resulting nanocomposite flame-retardant resin gave the best results in terms of thermal transfer characteristics (thermal conductivity of 0.74 W/mK, thermal effusivity of 839 Ws1/2/m2K), which makes it a good candidate for thermal management systems that also have a flame-retardant character [30].

2.2. BTMS System Modeling

The design and simulation of the battery models were performed utilizing computer-aided design (CAD) software, specifically SolidWorks 2024 with Flow Simulation SP Version 1.0 (Build: 6234). The simulated battery module comprised 18,650 lithium-ion cells arranged in an 8S6P configuration, representing eight series and six parallel connections (Figure 1). The simulation processes were executed on a computational system featuring an Intel(R) Xeon(R) Gold 6134 CPU operating at 3.20 GHz, 130,693 MB of RAM, and Windows 10 (Version 10.0.19045).
In the simulation of the BTMS for a battery module, a discretization mesh with a global level of 3 was employed, as illustrated in Figure 1, to ensure optimal accuracy in capturing the thermal distribution and heat fluxes across the entire geometry. The software used for this analysis, SolidWorks Flow Simulation, incorporates a default Cartesian mesh, which is adaptive and capable of automatically refining areas with high parameter gradients. This type of mesh is particularly well-suited for thermal simulations, as it enables efficient discretization of complex geometries, such as those of a battery module, ensuring an accurate representation of physical phenomena. To enhance precision in critical areas, two local meshes were applied: one for the Li-ion 18,650 cells, where additional refinement was performed to accurately model the thermal transfer at the level of the electrodes and casing, and another for the cooling serpentine coil, where the mesh density was increased to effectively capture the heat exchange between the cooling fluid and the battery cells. This hybrid approach, combining a global mesh with local refinements, allowed for a reduction in computational time while maintaining the accuracy of the results in areas of interest. The global level 3 mesh provides a balance between model complexity and the required computational resources, making it suitable for medium-complexity thermal simulations.
To validate the choice of the optimal mesh and ensure the independence of the results from the discretization size, a grid independence study was conducted. This study was performed on Case #2.1.1, and the simulation results for three mesh levels, 2, 3 and 4, were compared and summarized in Table 1. At level 2, significant differences were observed in the temperature distribution and heat fluxes, particularly in critical areas such as the interfaces between the Li-ion cells and the cooling serpentine coil. At level 3, these differences were significantly reduced, and the results became consistent, with a variation in the temperature of the analyzed cell of less than 1% compared to level 4. Although level 4 provided highly accurate results, the simulation time was approximately 10 times longer (52 min and 40 s) compared to level 3 (5 min and 51 s). Furthermore, the temperature differences between levels 3 and 4 were negligible, justifying the selection of level 3 as the final mesh. Thus, the level 3 mesh was deemed optimal for this study, ensuring an accurate representation of thermal phenomena without requiring excessive computational resources.
The analysis encompassed laminar and turbulent fluid flow dynamics, integrating heat transfer phenomena and forced convection mechanisms. To have a complex picture of the proposed constructive solutions’ thermal transfer phenomena, several cases were approached for numerical analysis (simulation), implementing different inlet coolant mass flow (9, 12, 15 and 18 L/min) and coolant temperatures (17, 20 and 25 °C):
  • Case #1—Multi-inlet nanocomposite resin cooling serpentine single-channel configuration;
  • Case #2—Nanocomposite resin cooling serpentine four-channel configuration (different in-out configuration);
  • Case #3—Multi-inlet nanocomposite resin cooling serpentine four-channel configuration (different in–out configuration);
  • Case #4—Multi-inlet nanocomposite resin cooling serpentine four-channel configuration and multiflow capability.
Details regarding the constructive and functional characteristics of each considered case are presented in Section 3 for easier interpretation of the obtained results.
The investigation focused on the comprehensive analysis of laminar and turbulent fluid flow dynamics, integrating the phenomena of heat transfer and forced convection mechanisms. The study aimed to provide a detailed understanding of these processes within the context of thermal management in cylindrical battery cells’ modules. Three-dimensional models were meticulously transferred to the Flow Simulation module, where an array of general project settings was configured. These settings encompassed the definition of computational domains and subdomains, specification of material and fluid properties, application of boundary conditions and heat sources, and the generation of computational meshes. Such settings were tailored to ensure an accurate representation of the physical system and optimize the fidelity of the simulations.
The computational domain was precisely delineated to capture the essential characteristics of the physical system under investigation. In particular, the fluid subdomain was carefully designed to include the serpentine channels, which are instrumental in facilitating coolant flow. This approach ensured a realistic simulation of the thermal and fluid dynamics of the system. Material properties specific to the 18,650 cells were rigorously incorporated into the simulation. Key parameters, including thermal conductivity (3.35 W/m·K), density (2725 kg/m3), and specific heat capacity (960 J/kg·K), were inputted based on validated data sourced from peer-reviewed literature [31]. The accurate definition of these properties was critical to capturing the thermal behavior of the cell under operating conditions. Boundary conditions were established with precision to reflect the operational scenarios under examination. These included the specification of coolant inlet and outlet parameters, such as mass flow rate and temperature, tailored to the requirements of each simulation case. A uniform heat generation rate of 10 W per cell was assumed, representing a typical operational condition, resulting in a cumulative heat generation rate of 480 W for the entire system. To facilitate the evaluation of thermal performance, twelve cells within the system were assigned as goal points for temperature measurement. Additionally, the serpentine channel temperatures were monitored to provide insights into the thermal behavior of the coolant.
The computational mesh design was optimized through the implementation of one global mesh and two locally refined meshes. This strategy enhanced the resolution and clarity of the simulation results, ensuring a robust analysis of heat transfer and fluid flow phenomena. The simulations were executed over a total time period of 1800 s for each case. The outcomes of the comparative analysis were systematically presented in tabular format and augmented with visualizations, including thermal maps and cut plots. The cut plots, taken from the midsection of the cell, illustrated the temperature distribution across various regions of the system, effectively identifying areas of heat accumulation and dissipation.

3. Results

The results obtained through simulation (computer numerical analysis) are presented below and analyzed to identify the most efficient constructive and functional solution for BTMS systems that use constructive elements made of composite resin with flame-retardant nanomaterials.

3.1. Case #1—Multi-Inlet Nanocomposite Resin Cooling Serpentine Single-Channel Configuration

In this case, a multi-inlet nanocomposite resin cooling serpentine with a single-channel configuration is presented in Figure 2. The cooling liquid enters through the main inlet and branches into four distinct serpentines, ensuring uniform temperature distribution as it flows between the cells. To explore the system’s performance under varying conditions, four sub-cases were analyzed, with flow rates of 9, 12, 15, and 18 L/min and three initial coolant temperatures of 17, 20, and 25 °C. The cooling liquid is collected into a single outlet for discharge.
Following the discretization process, the following input data were obtained: 776,863 fluid cells, 1,779,959 solid cells, a calculation time of 551 s, and 24 iterations. The case with the highest flow rate of 18 L/min resulted in the lowest average cell temperatures, while the 9 L/min flow rate led to the highest temperatures, as summarized in Table 2, Table 3 and Table 4 and shown in Figure 3, Figure 4 and Figure 5. Among the cells, Cell #4 was identified as the most thermally disadvantaged, exhibiting the most significant temperature variations across all flow rates and initial temperature conditions.

3.2. Case #2—Nanocomposite Resin Cooling Serpentine Four-Channel Configuration (Different In-Out Configuration)

In this case, the Nanocomposite Resin Cooling Serpentine Four-Channel Configuration was analyzed, as shown in Figure 6. This configuration features a continuous flow of cooling liquid from the main inlet through the battery series without branching, distinguishing it from the previous design. Four distinct sub-cases were investigated, corresponding to flow rates of 9, 12, 15, and 18 L/min, respectively, and three initial coolant temperatures of 17 °C, 20 °C, and 25 °C. Following a discretization process aligned with the model, a series of input data were obtained. The number of fluid cells was 782,047, while the number of solid cells was 1,898,447. The flow type was characterized as both laminar and turbulent, with a calculation time of 596 s and 24 iterations required for convergence. The case with the highest flow rate (18 L/min) exhibited the lowest average temperatures across the analyzed cells. In contrast, the case with the lowest flow rate (9 L/min) resulted in the highest temperatures, as detailed in Table 5, Table 6 and Table 7 and Figure 7, Figure 8 and Figure 9. Among the analyzed cells, Cells #4, #9, and #10 were identified as the most thermally disadvantaged in this configuration, demonstrating the highest susceptibility to temperature variations across all flow rates and temperature sub-cases.

3.3. Case #3—Multi-Inlet Nanocomposite Resin Cooling Serpentine Four-Channel Configuration (Different in–out Configuration)

Figure 10 illustrates the CAD model used in the simulation of the Multi-Inlet Nanocomposite Resin Cooling Serpentine Four-Channel Configuration. The configuration consists of four channels that facilitate the circulation of the cooling liquid. The study evaluates multiple models and scenarios, with four specific sub-cases analyzed for flow rates of 9, 12, 15, and 18 L/min, alongside three initial coolant temperatures of 17° C, 20 °C, and 25 °C. Following a model-conforming discretization process, the input data obtained were as follows: 464,973 fluid cells, 1,205,549 solid cells, a calculation time of 343 s, and 24 iterations to achieve convergence. The results showed that the highest flow rate (18 L/min) produced the lowest average temperatures across all analyzed cells, while the lowest flow rate (9 L/min) resulted in the highest temperatures, as summarized in Table 8, Table 9 and Table 10 and shown in Figure 11, Figure 12 and Figure 13. Moreover, Cells #4, #9, and #10 were consistently identified as the most thermally affected, regardless of the flow rate or initial temperature conditions examined.

3.4. Case #4—Multi-Inlet Nanocomposite Resin Cooling Serpentine Four-Channel Configuration and Multiflow Capability

Figure 14 depicts the CAD model employed for the simulation of the Multi-Inlet Nanocomposite Resin Cooling Serpentine Four-Channel Configuration with Multiflow Capability. A defining characteristic of this configuration is the alternating placement of inlets and outlets: two inlets are positioned at one end, with two outlets at the opposite end. The study evaluates multiple scenarios, with four sub-cases analyzed for flow rates of 9, 12, 15, and 18 L/min alongside three initial coolant temperatures of 17 °C, 20 °C and 25 °C. The three battery series are surrounded by the four main serpentines and corresponding channels. The discretization process, tailored to the simulation model, yielded the following input data: 412,291 fluid cells, 1,009,329 solid cells, a calculation time of 304 s, and 24 iterations to achieve convergence. The resulting temperature distribution is illustrated in Figure 15, Figure 16 and Figure 17, with detailed data presented in Table 11, Table 12 and Table 13. The results indicate that the highest flow rate (18 L/min) produced the lowest average cell temperatures, whereas the lowest flow rate (9 L/min) led to the highest temperatures. Furthermore, Cells #4, #9, #10, and #11 were identified as the most thermally impacted across all examined flow rates and coolant temperature conditions, highlighting areas of potential thermal vulnerability.
The results of all the considered cases are centralized in a complex heatmap presented in Figure 18. The reason behind this representation is the fact that besides the removal of as much heat as possible, another objective of BTMSs is to minimize temperature gradients inside the battery pack. Cell-to-cell temperature differences influence the heterogeneity of electric current, the energy output, and the battery degradation rate by inducing localized fast aging [32]. An important aspect in this case is the variation of internal resistance, which decreases exponentially with temperature, following the Arrhenius law [33]. Since the hotter cells of the battery pack have a lower resistance, more current flows through them, generating even more heat. This creates a positive feedback mechanism, which could eventually lead, in extreme cases, to local temperatures high enough for the start of thermal runaway [33]. Therefore, the difference in the cells’ internal resistance induced by thermal gradients cannot be neglected in the evaluation of a BTMS’s performance and efficiency, adding, therefore, an additional feature and dimension to the obtained results’ analysis. The internal resistance variation compared to its initial state was evaluated using a validated model from the literature [33]. With these considered, Figure 18 showcases a heatmap where the blue specter illustrates the cases in which less heat was overall absorbed by the cells, which translates into lower average temperatures (and implicitly a better heat transfer performance of the system), while the size of the marker illustrates as an additional dimension to the heatmap the largest internal resistance difference calculated between two cells. Inside the marker, the percentage value of this difference is also labeled for a more complete representation. In consequence, the best cases will be the ones that are as far as possible in the blue specter while having a marker as small as possible.
Considering the inlet temperature, the best results are, as expected, at 17 °C. At this temperature, the minimum absorbed heat of 27.9 kJ is obtained for Case #2, at 18 L/min, while the maximum absorbed heat is 43.8 kJ, which results from Case #4, at 9 L/min. At this fixed temperature of 17 °C, the difference between the best (at 18 L/min) and worst (at 9 L/min) result is 7.8% for Case #1, 3.9% for Case #2, 1.3% for Case #3 and 6.6% for Case #4. When analyzing the influence of temperature at the fixed flow rate of 18 L/min, these differences (between 17 °C and 25 °C) rise to 41.9%, 47.7%, 32.8% and 29.2%, respectively. This demonstrates that lowering the coolant’s temperature from 25 °C to 17 °C has a much greater impact on the system’s cooling performance than doubling the flow rate to 18 L/min. The energy consumption implications of these two solutions should be further investigated.

4. Discussion

The temperature results from the SolidWorks simulations of the battery pack cooling systems are presented in Figure 3, Figure 4, Figure 5, Figure 7, Figure 8, Figure 9, Figure 11, Figure 12, Figure 13, Figure 15, Figure 16 and Figure 17 and Table 1, Table 2, Table 3, Table 4, Table 5, Table 6, Table 7, Table 8, Table 9, Table 10, Table 11 and 
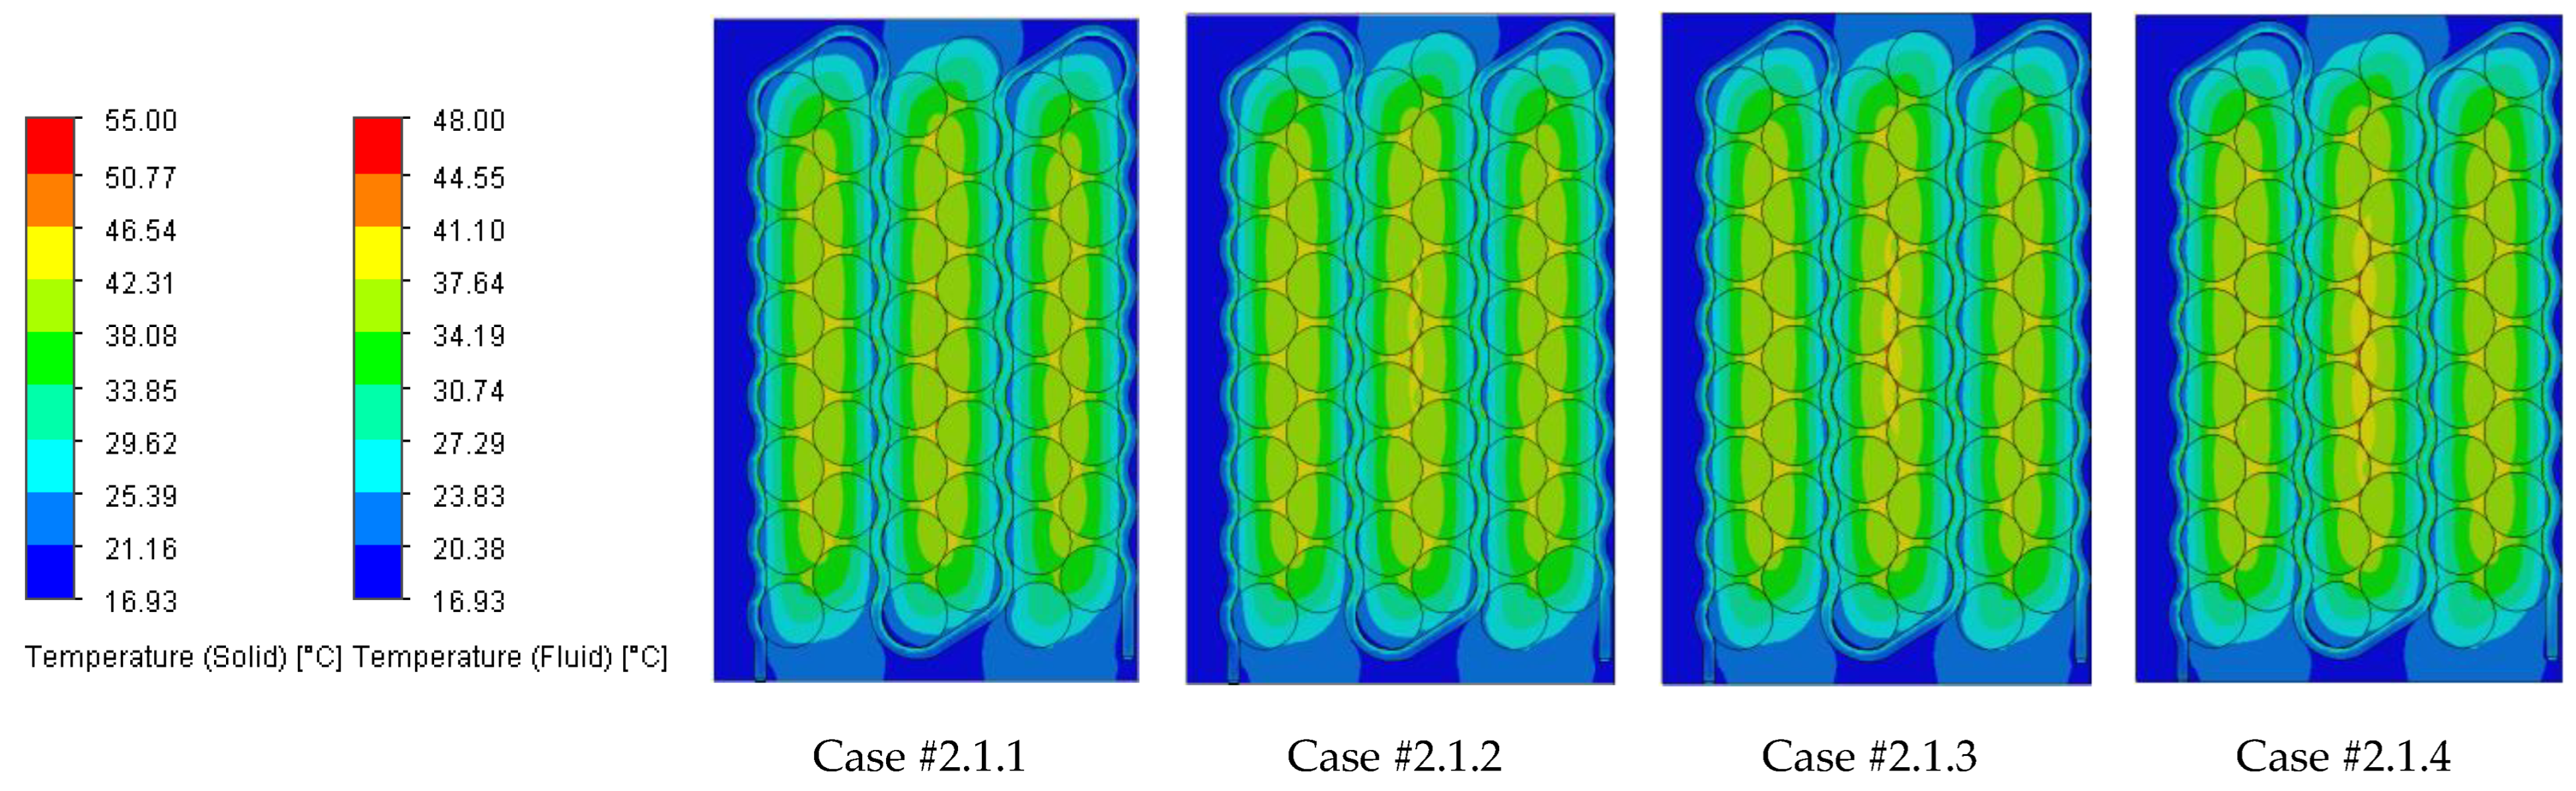
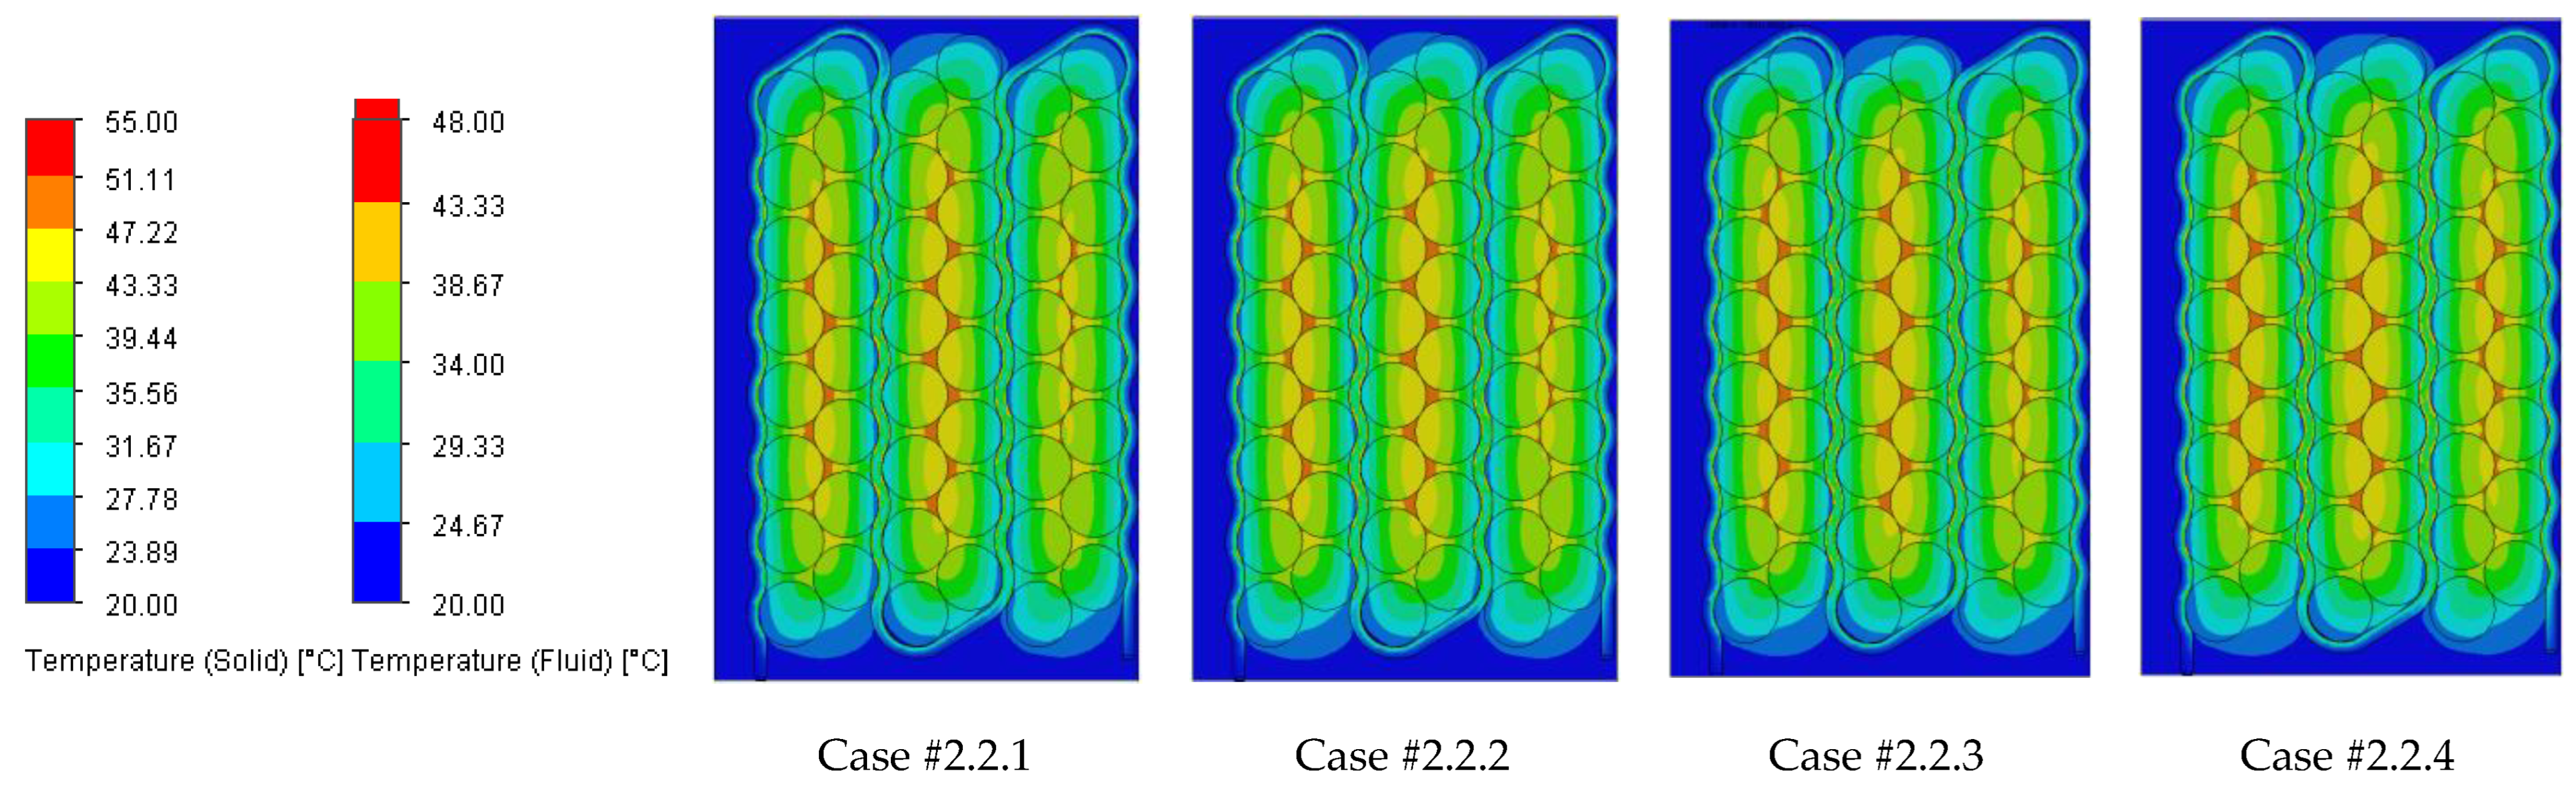
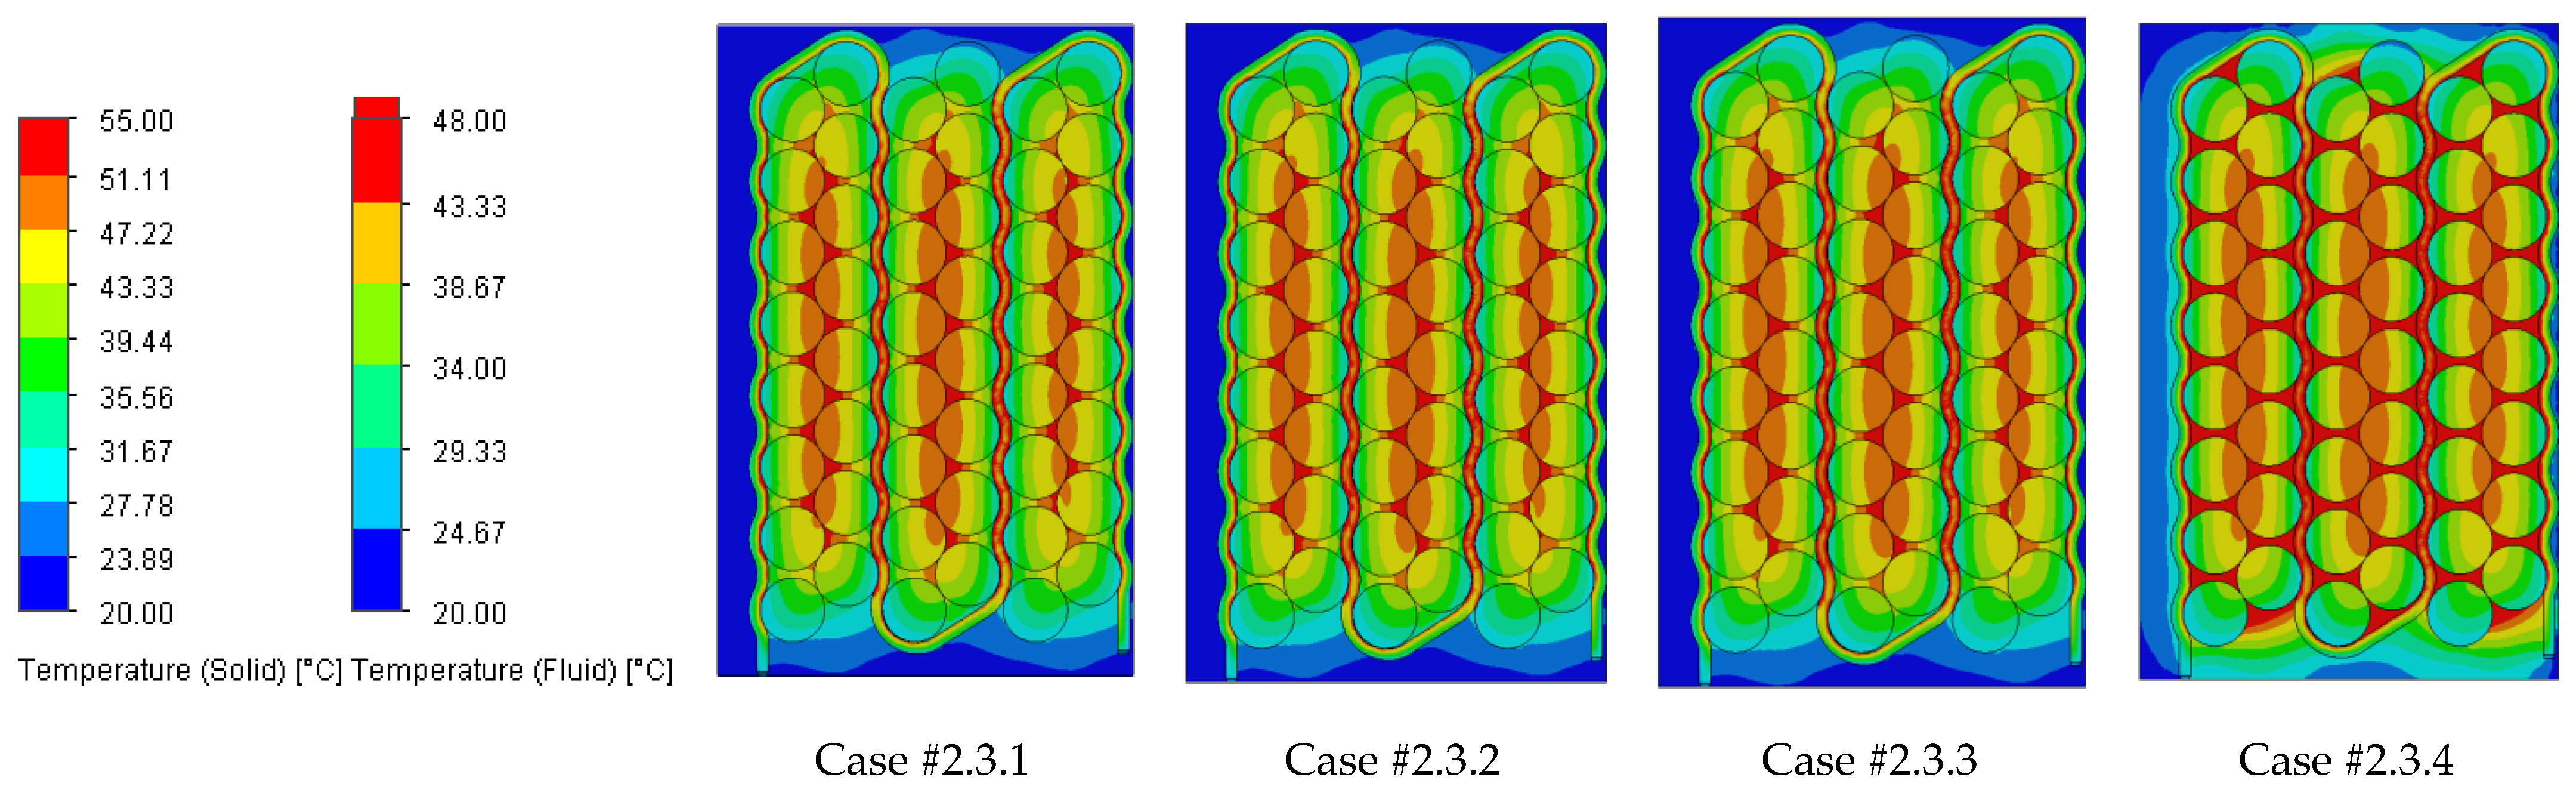
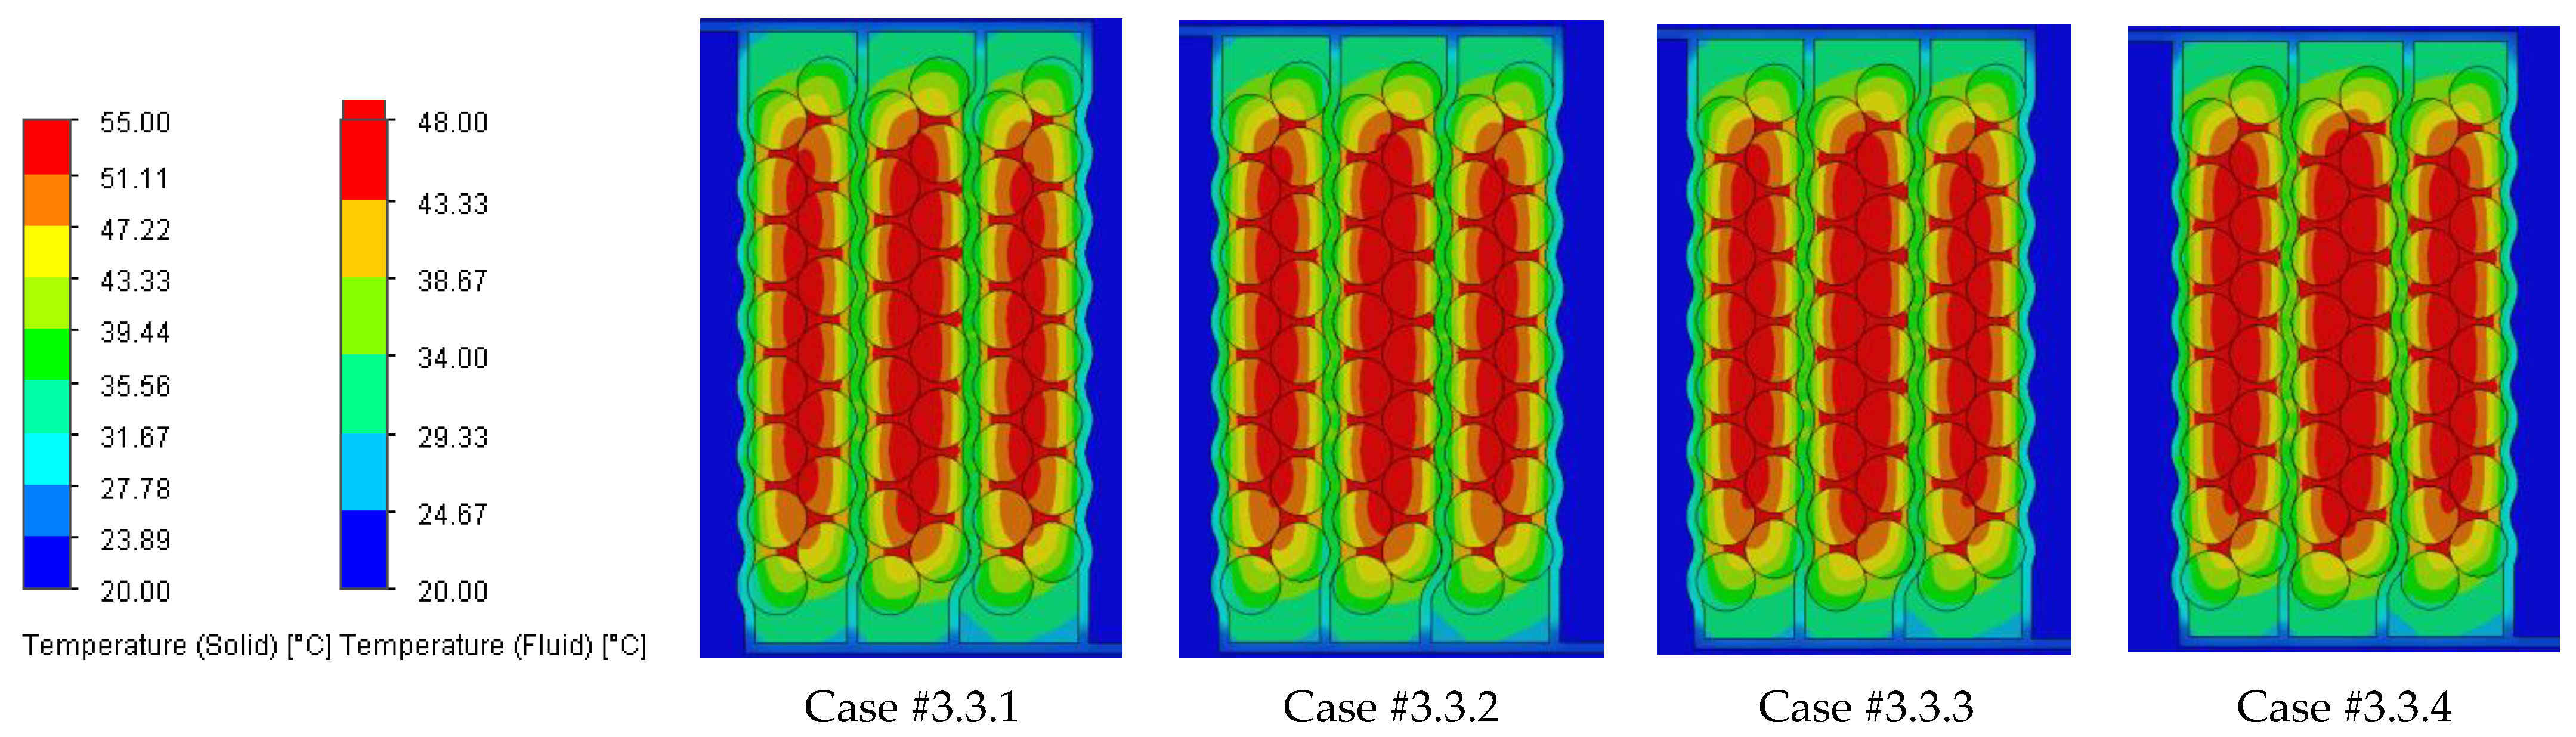
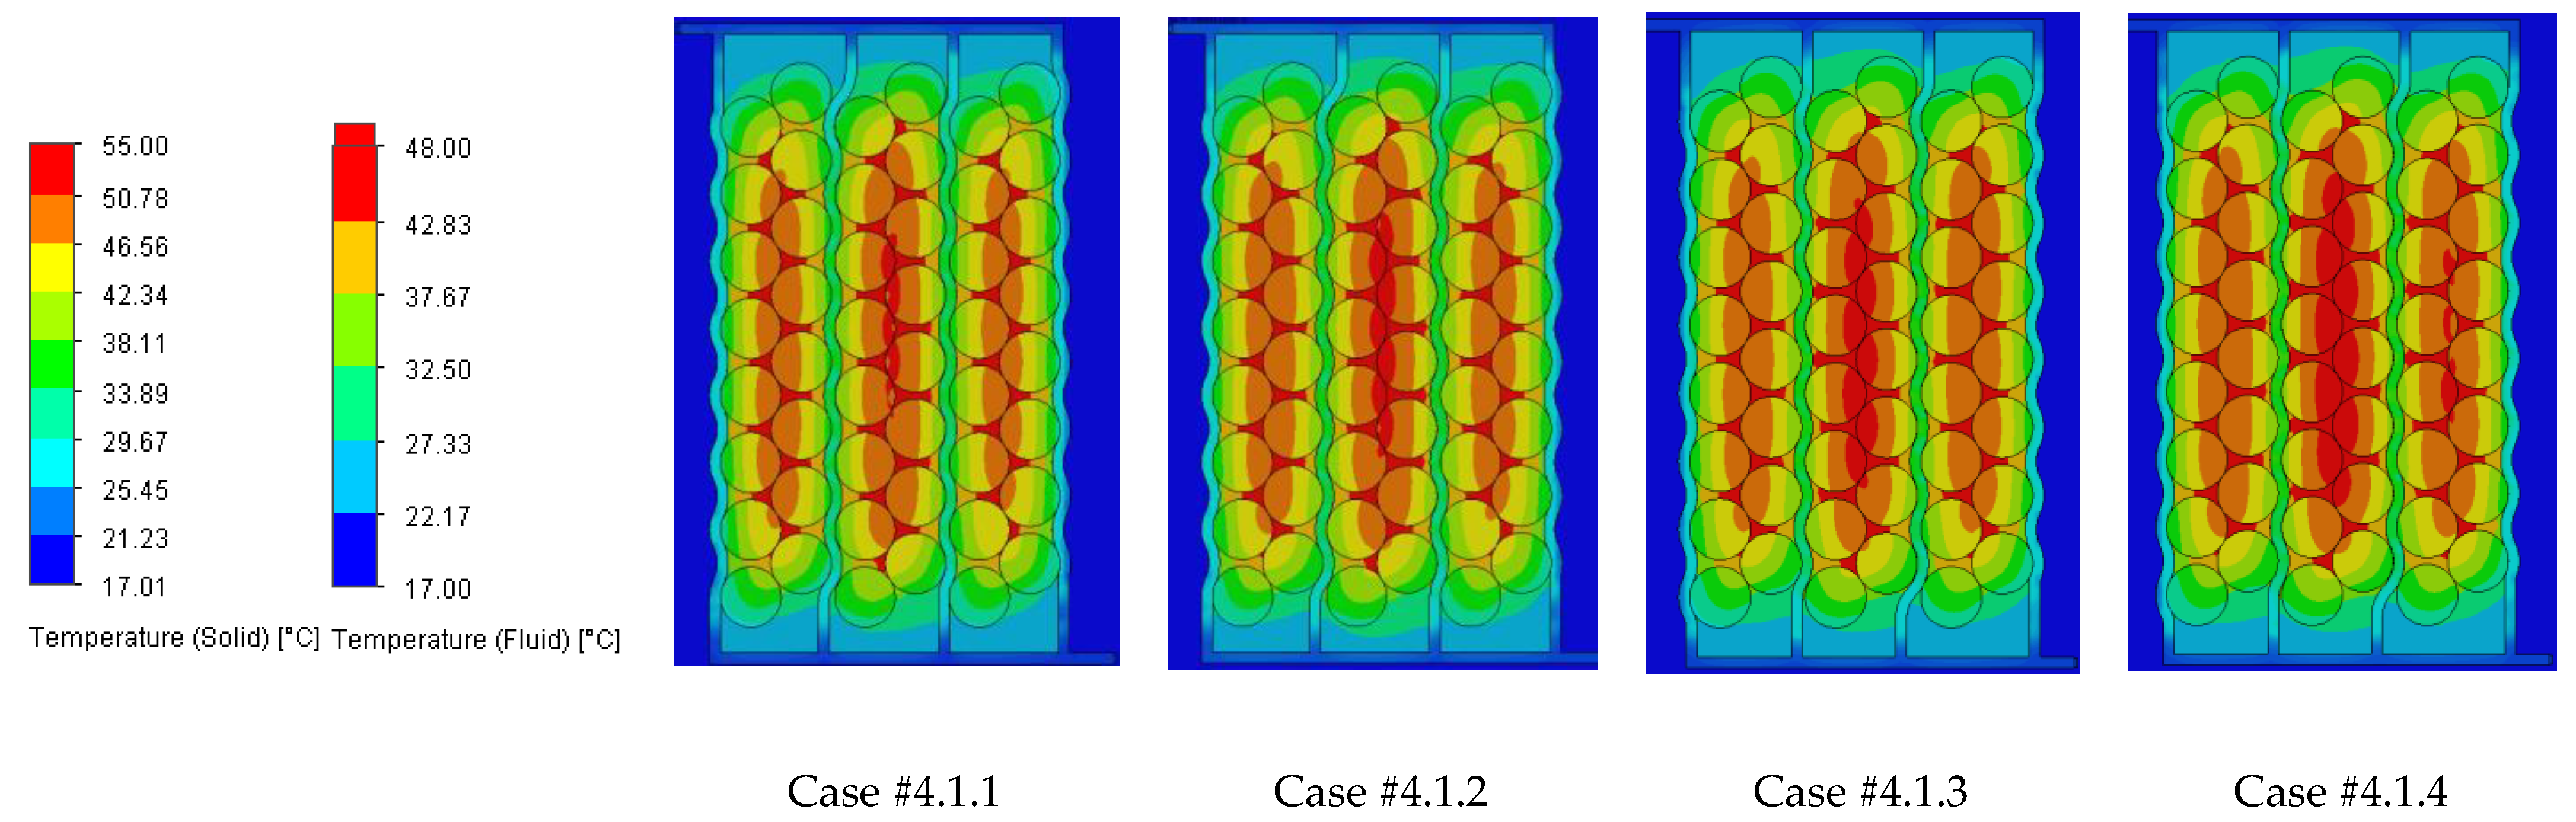
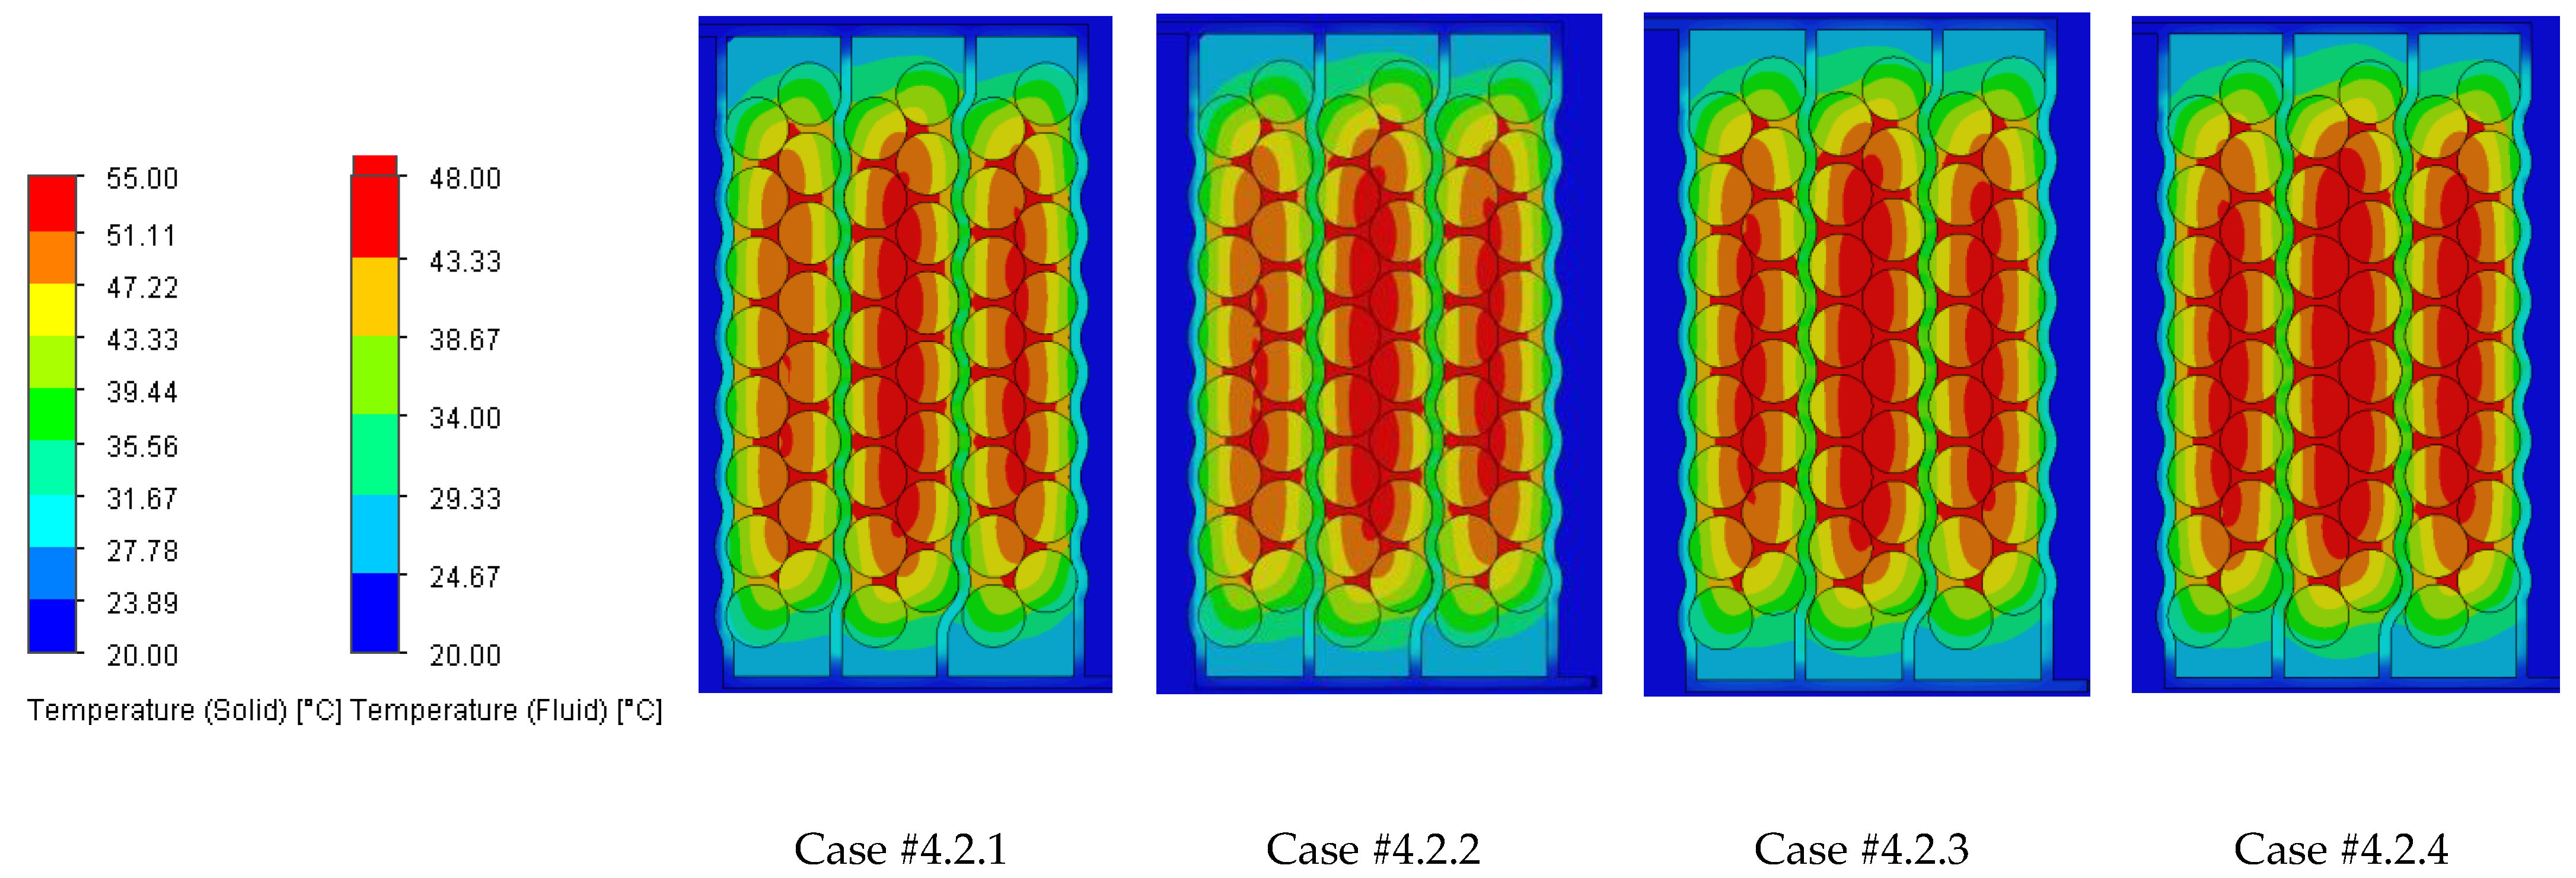
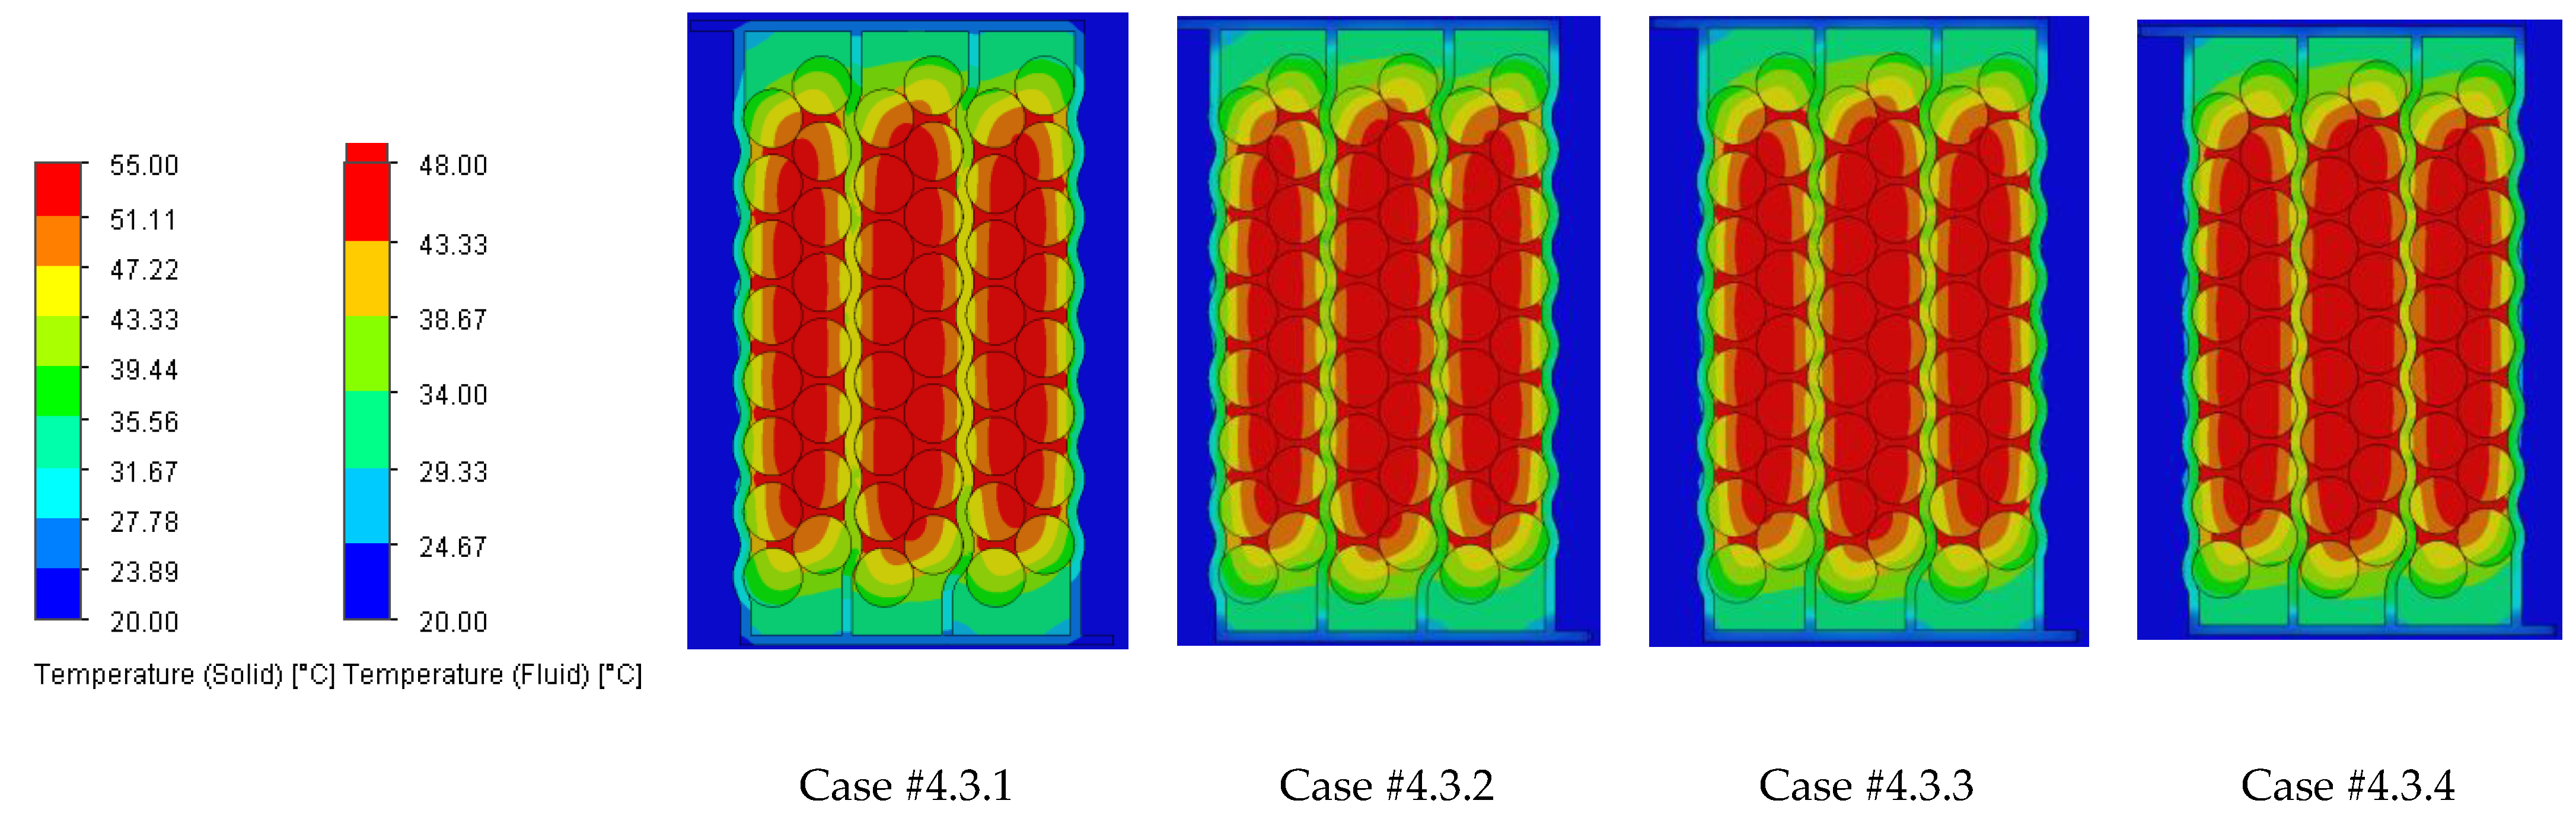
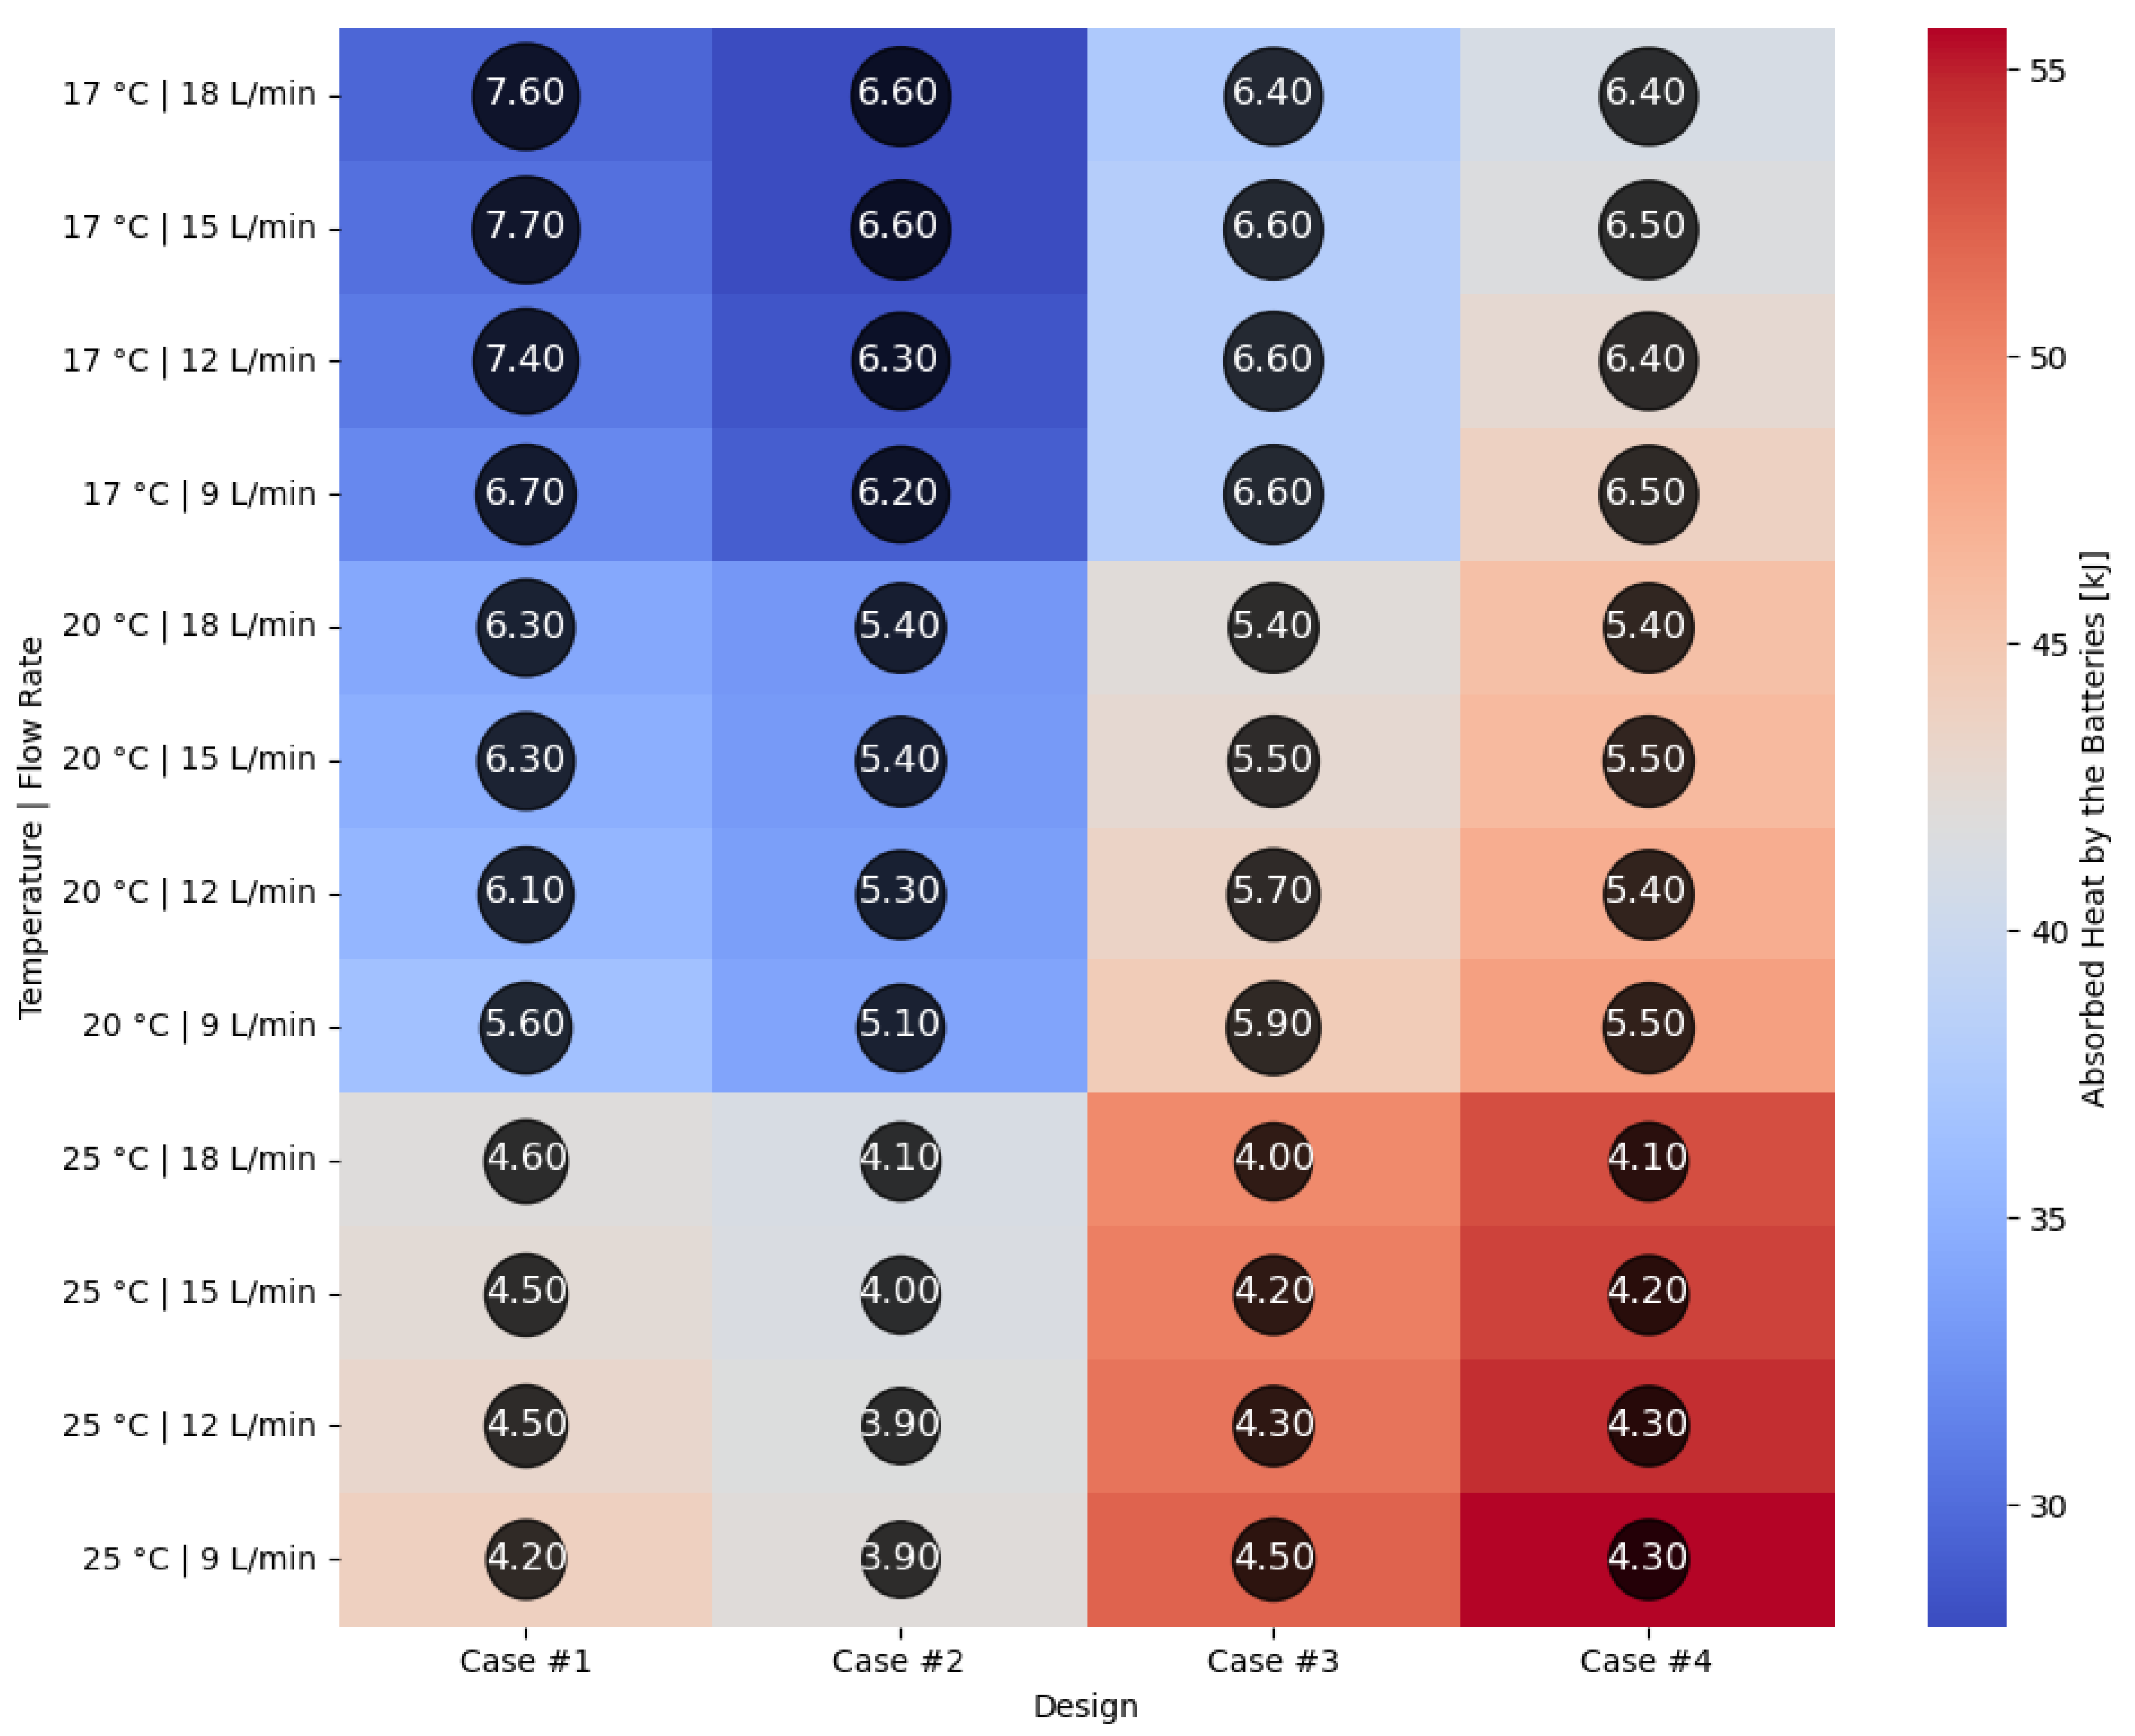
Table 12 considering different flow rates (18, 15, 12 and 9 L/min) of the cooling fluid (water) at different inlet temperatures of 17, 20 and 25 °C. The analysis is completed with the heatmap from Figure 18 illustrating the heat absorbed by the cells and the additional markers that highlight the temperature gradient created in the system, represented by the difference in the cells’ internal resistance during operation.
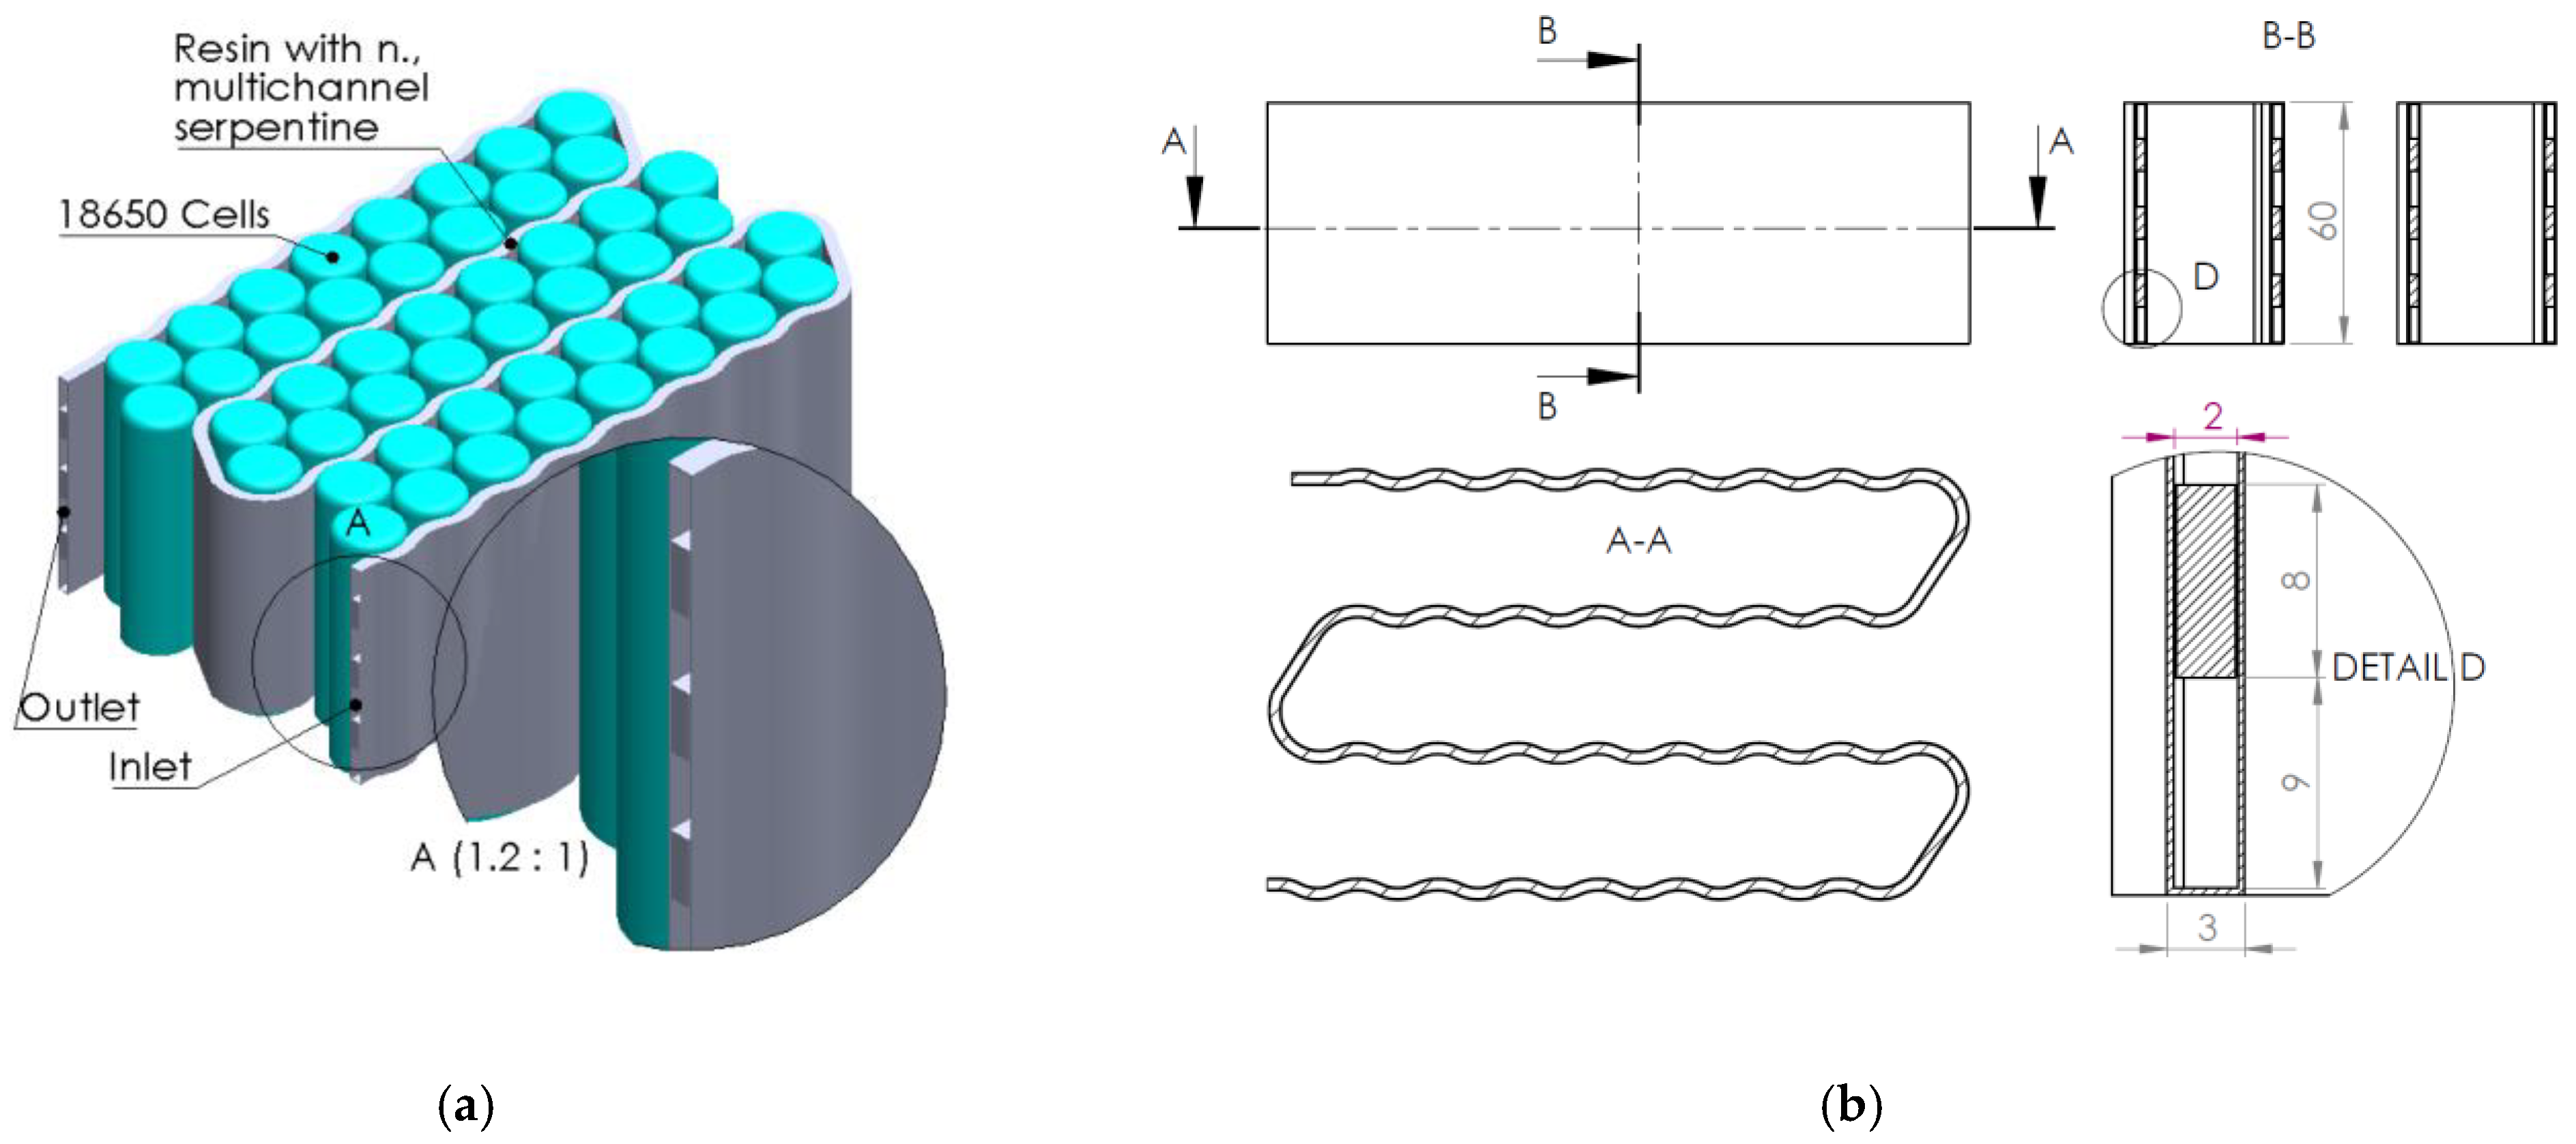
Case #2 features a multichannel serpentine structure, where the serpentine channels are designed to facilitate the circulation of cooling fluid through a network of parallel and curved pathways. This design allows for greater surface contact between the cooling medium and the battery cells, potentially improving heat transfer. The average temperature of all cells for every testing condition combination (flow rate and coolant inlet temperature) is 36.7 °C, slightly lower than that of Case #1 (37.4 °C) and significantly lower than that of Case #3 (41.3 °C) and Case #4 (43.2 °C). This superior heat dissipation can also be observed in Figure 18 by the colors of the second column from the heatmap, which tend more towards the blue specter compared to the other columns. This is supported by calculating the average value of the heat absorbed by the batteries for every testing combination, which is 36.25 kJ for Case #1, 34.44 kJ for Case #2, 43.98 kJ for Case #3 and 47.82 kJ for Case #4, respectively. This means a difference of 38.8% between the best (Case #2) and the worst (Case #4) design, highlighting the importance of the cooling channels’ structure and configuration for these applications. Despite the overall better cooling performance, the curved paths may introduce additional pressure losses at the end of the rows, added to the ones created by the small flow section due to the presence of four channels, which can affect the system’s power consumption.
It is also noticed that even though not in all cases, in most of them (9 out of 12 rows), Case #2 offers the smallest temperature gradient and internal resistance difference between the cells. The average difference for every testing combination is 5.96% for Case #1, 5.23% for Case #2, 5.48% for Case #3 and 5.38% for Case #4, respectively. For this criterion, the differences between cases are much smaller, but one should notice that removing a greater quantity of heat does not automatically mean also good thermal uniformity (see changes in order between Case #2 and #4), which highlights the importance of a good balance between these requirements and of a complete thermal analysis when evaluating BTMSs. Despite the single-inlet configuration and, therefore, longer continuous channel, this ensures the same flow rate in all conditions, while flow rate uniformity is difficult to achieve in the various branches of the multi-inlet configurations.
Thus, it can be concluded that to maximize the thermal management of the battery cells, designs incorporating single-inlet configurations (in the present study with four channels) are recommended. These designs can help achieve more efficient cooling by evenly distributing the coolant throughout the battery volume.
The use of nanomaterials as fillers in flame-retardant epoxy resins further improves its thermal conductivity, making it superior to air-based BTMS designs. Its performance is reliable and efficient, making it ideal for advanced battery cooling applications that must additionally involve high flame-retardant protection and a reduction/elimination of fire risks. This highlights the nanocomposite resin model’s suitability for high-performance battery thermal management systems, particularly in electric vehicle applications where weight, thermal efficiency, and uniform cooling are critical.

5. Conclusions

With the increase in the number of electric vehicles in traffic, it is necessary to take measures (constructive and functional) to minimize and/or eliminate potential dangers and accidents related to their operation. The main energy source of electric vehicles is batteries based on Li-ion technologies; there are premises that due to the functional characteristics and improper operation (high temperatures of electrochemical cells) or possible manufacturing defects (unbalanced electrochemical cells, imperfect electrical contacts, under sizing of electrical circuits a.s.o.) there are risks of self-ignition and fire. A method of reducing and/or eliminating these risks is to use components of BTMSs with flame-retardant properties, and this article proposes the use of cooling serpentines made of a flame-retardant nanocomposite resin (replacing the current aluminum serpentines, which in case of fire can be a factor in accelerating combustion).
By means of computer numerical analysis methods (modeling and simulation), the use of flame-retardant nanocomposite resin cooling serpentines under different constructive and functional forms of the inlet and outlet of the cooling liquid (water) was analyzed. The major conclusion is that based on the results obtained, the design consisting of nanocomposite resin cooling serpentine four-channel configuration offers the lowest heat absorbed by the battery cells, of 27.9 kJ, at a water inlet temperature of 17 °C and an 18 L/min flow rate. This design’s average heat absorption value for all analyzed combinations is 34.44 kJ, which is 38.88% lower than in the case of the design consisting of multi-inlet and multiflow capability channels. Regarding the smallest temperature gradient between the cells, the best design is the same and offers an average internal resistance difference of 5.23%, with immediate beneficial effects on battery performance. The conducted analysis also highlighted that lowering the coolant’s temperature from 25 °C to 17 °C has a much greater impact on the system’s cooling performance than doubling the flow rate to 18 L/min.
Future research is needed in the direction of the study approached by the authors, both in terms of the use of real operating data and especially in terms of improving the mechanical resistance properties (to vibrations) of flame-retardant resins that have applicability potential in BTMSs of electric vehicles, due to the nature of their specific operating conditions.

Author Contributions

Conceptualization, I.S., F.M. and T.I.C.B.; methodology, F.M.; validation, I.S., F.M. and T.I.C.B.; formal analysis, I.S. and T.I.C.B.; investigation, I.S., F.M. and T.I.C.B.; data curation, I.S. and T.I.C.B.; writing—original draft preparation, I.S., F.M. and T.I.C.B.; writing—review and editing, I.S., F.M. and T.I.C.B.; supervision, F.M. All authors have read and agreed to the published version of the manuscript.

Funding

This research received no external funding.

Institutional Review Board Statement

Not applicable.

Informed Consent Statement

Not applicable.

Data Availability Statement

Data is contained within the article.

Acknowledgments

The authors would like to thank the Technical University of Cluj Napoca for the financial support provided for the publication of this article.

Conflicts of Interest

The authors declare no conflicts of interest.

References

  1. Afandizadeh, S.; Sharifi, D.; Kalantari, N.; Mirzahossein, H. Using machine learning methods to predict electric vehicles penetration in the automotive market. Sci. Rep. 2023, 13, 8345. [Google Scholar] [CrossRef] [PubMed]
  2. Leuthner, S. Lithium-ion battery overview. In Lithium-Ion Batteries: Basics and Applications; Korthauer, R., Ed.; Springer: Berlin, Germany, 2018; pp. 13–19. [Google Scholar]
  3. Yeklangi, A.G.; Ghafari, A.; Sima, F.A.; Akbari, S. Advancing lithium-ion battery manufacturing: Novel technologies and emerging trends. J. Appl. Electrochem. 2024, 54, 2653–2682. [Google Scholar] [CrossRef]
  4. Kiasari, M.M.; Aly, H.H. Enhancing Fire Protection in Electric Vehicle Batteries Based on Thermal Energy Storage Systems Using Machine Learning and Feature Engineering. Fire 2024, 7, 296. [Google Scholar] [CrossRef]
  5. Kharabati, S.; Saedodin, S. A systematic review of thermal management techniques for electric vehicle batteries. J. Energy Storage 2024, 75, 109586. [Google Scholar] [CrossRef]
  6. Yang, W.; Li, C.; Li, X.; Wang, H.; Deng, J.; Fu, T.; Luo, Y.; Wang, Y.; Xue, K.; Zhang, G.; et al. High flame retardant composite phase change materials with triphenyl phosphate for thermal safety system of power battery module. eTransportation 2024, 20, 100325. [Google Scholar] [CrossRef]
  7. Zhao, Y.; Zhang, X.; Hua, W.; Cai, S.; Zhang, C.; Wu, M.; Yang, B.; Ji, J. Experimental study on flexible flame retardant phase change materials for reducing thermal runaway propagation of batteries. J. Energy Storage 2024, 89, 111721. [Google Scholar] [CrossRef]
  8. Zhang, J.; Li, X.; Zhang, G.; Wu, H.; Rao, Z.; Guo, J.; Zhou, D. Experimental investigation of the flame retardant and form-stable composite phase change materials for a power battery thermal management system. J. Power Sources 2020, 480, 229116. [Google Scholar] [CrossRef]
  9. Liu, Q.; Deng, Q.; Zhao, R.; Cheng, W.-L.; Wang, Y.-D. A novel flexible flame-retardant phase change materials with battery thermal management test. J. Energy Storage 2023, 70, 108077. [Google Scholar] [CrossRef]
  10. Mousavi, S.R.; Estaji, S.; Javidi, M.R.; Paydayesh, A.; Khonakdar, H.A.; Arjmand, M.; Rostami, E. Toughening of epoxy resin systems using core–shell rubber particles: A literature review. J. Mater. Sci. 2021, 56, 18345–18367. [Google Scholar] [CrossRef]
  11. Zhi, M.; Yang, X.; Fan, R.; Yue, S.; Zheng, L.; Liu, Q.; He, Y. A comprehensive review of reactive flame-retardant epoxy resin: Fundamentals, recent developments, and perspectives. Polym. Degrad. Stab. 2022, 201, 109976. [Google Scholar] [CrossRef]
  12. Song, K.; Yang, R.; Pan, Y.-T.; Zhang, J.; Song, P.; He, J.; Wang, D.-Y. Metal–Organic Frameworks–Based Flame-Retardant System for Epoxy Resin: A Review and Prospect. Chem. Eng. J. 2023, 468, 143653. [Google Scholar] [CrossRef]
  13. Zhang, C.; Pan, M.; Qu, L.; Sun, G. Effect of phosphorus-containing flame retardants on flame retardancy and thermal stability of tetrafunctional epoxy resin. Polym. Adv. Technol. 2015, 26, 1531–1536. [Google Scholar] [CrossRef]
  14. Wang, K.; Liu, H.; Wang, C.; Huang, W.; Tian, Q.; Fu, Q.; Yan, W. Flame Retardant Performance of Epoxy Resin Composites with SiO2 Nanoparticles and Phenethyl-Bridged DOPO Derivative. ACS Omega 2021, 6, 666–674. [Google Scholar] [CrossRef]
  15. Chi, Z.; Guo, Z.; Xu, Z.; Zhang, M.; Li, M.; Shang, L.; Ao, Y. A DOPO-based phosphorus-nitrogen flame retardant bio-based epoxy resin from diphenolic acid: Synthesis, flame-retardant behavior and mechanism. Polym. Degrad. Stab. 2020, 176, 109151. [Google Scholar] [CrossRef]
  16. Liu, D.; Ji, P.; Zhang, T.; Lv, J.; Cui, Y. A bi-DOPO type of flame retardancy epoxy prepolymer: Synthesis, properties and flame-retardant mechanism. Polym. Degrad. Stab. 2021, 190, 109629. [Google Scholar] [CrossRef]
  17. Chen, B.; Luo, W.; Chen, M. A universal strategy toward flame retardant epoxy resin with ultra-tough and transparent properties. Polym. Degrad. Stab. 2022, 205, 110132. [Google Scholar] [CrossRef]
  18. Huang, J.; Guo, W.; Wang, X.; Niu, H.; Song, L.; Hu, Y. Combination of cardanol-derived flame retardant with SiO2 @MOF particles for simultaneously enhancing the toughness, anti-flammability and smoke suppression of epoxy thermosets. Compos. Commun. 2024, 27, 100904. [Google Scholar] [CrossRef]
  19. Chen, C.; Song, W.; Jiang, M.; Zhang, R.; Li, S.; Cai, Y.; Yao, J. SiO2/MOFs-based synergistic flame retardants provide enhanced fire safety for epoxy resins. Mater. Today Commun. 2023, 35, 105805. [Google Scholar] [CrossRef]
  20. Yang, S.; Zhang, Q.; Hu, Y. Synthesis of a novel flame retardant containing phosphorus, nitrogen and boron and its application in flame-retardant epoxy resin. Polym. Degrad. Stab. 2016, 133, 358–366. [Google Scholar] [CrossRef]
  21. Zhang, Z.; Qin, J.; Zhang, W.; Pan, Y.-T.; Wang, D.-Y.; Yang, R. Synthesis of a novel dual layered double hydroxide hybrid nanomaterial and its application in epoxy nanocomposites. Chem. Eng. J. 2020, 381, 122777. [Google Scholar] [CrossRef]
  22. Terekhov, I.V.; Chistyakov, E.; Filatov, S.N.; Deev, I.S.; Kurshev, E.V.; Lonskii, S.L. Factors Influencing the Fire-Resistance of Epoxy Compositions Modified with Epoxy-Containing Phosphazenes. Inorg. Mater. Appl. Res. 2019, 10, 1429–1435. [Google Scholar] [CrossRef]
  23. Rybyan, A.A.; Bilichenko, J.V.; Kireev, V.V.; Kolenchenko, A.A.; Chistyakov, E.M. Curing of DER-331 Epoxy Resin with Arylaminocyclotriphosphazenes Based on o-, m-, and p-methylanilines. Polymers 2022, 14, 5334. [Google Scholar] [CrossRef]
  24. Ma, S.; Jiang, M.; Tao, P.; Song, C.; Wu, J.; Wang, J.; Deng, T.; Shang, W. Temperature effect and thermal impact in lithium-ion batteries: A review. Prog. Nat. Sci. 2018, 28, 653–666. [Google Scholar] [CrossRef]
  25. Gharehghani, A.; Gholami, J.; Shamsizadeh, P.; Mehranfar, S. Effect analysis on performance improvement of battery thermal management in cold weather. J. Energy Storage 2022, 45, 103728. [Google Scholar] [CrossRef]
  26. Nourdanesh, N.; Ranjbar, F. Investigation on heat transfer performance of a novel active method heat sink to maximize the efficiency of thermal energy storage systems. J. Energy Storage 2022, 45, 103779. [Google Scholar] [CrossRef]
  27. Tay, R.Y.; Li, H.; Wang, H.; Lin, J.; Ng, Z.K.; Shivakumar, R.; Bolker, A.; Shakerzadeh, M.; Tsang, S.H.; Teo, E.H.T. Advanced nano boron nitride architectures: Synthesis, properties and emerging applications. Nano Today 2023, 53, 102011. [Google Scholar] [CrossRef]
  28. Wadhwa, G.K.; Late, D.J.; Charhate, S.; Sankhyan, B. 1D and 2D Boron Nitride Nano Structures: A Critical Analysis forEmerging Applications in the Field of Nanocomposites. ACS Omega 2024, 9, 26737–26761. [Google Scholar] [CrossRef] [PubMed]
  29. Buidin, T.I.C.; Mariasiu, F. Effects of using fireproof thermal management systems on the lifespan of battery cells. Case Stud. Therm. Eng. 2024, 57, 104347. [Google Scholar] [CrossRef]
  30. Mariasiu, F.; Szabo, I.; Buidin, T.I.C. Numerical Simulation of a Thermal Management System Using Composite Flame-Retardant Resin and Its Effect on Battery Life Span. Sustainability 2024, 16, 3702. [Google Scholar] [CrossRef]
  31. DiVA Portal. Available online: https://www.diva-portal.org/smash/get/diva2:1520751/FULLTEXT01.pdf (accessed on 25 September 2024).
  32. Liu, X.; Ai, W.; Marlow, M.N.; Patel, Y.; Wu, B. The effect of cell-to-cell variations and thermal gradients on the performance and degradation of lithium-ion battery packs. Appl. Energy 2019, 248, 489–499. [Google Scholar] [CrossRef]
  33. Troxler, Y.; Wu, B.; Marinescu, M.; Yufit, V.; Patel, Y.; Marquis, A.J.; Brandon, N.P.; Offer, G.J. The effect of thermal gradients on the performance of lithium-ion batteries. J. Power Sources 2014, 247, 1018–1025. [Google Scholar] [CrossRef]
Figure 1. Generic physical model: (a) Cooling serpentine design and the cell location of BTMS system; (b) mesh grid detail.
Fire 08 00063 g001
Figure 2. Model design for Case #1—Multi-inlet nanocomposite resin cooling serpentine single-channel configuration: (a) Physical model; (b) details of serpentine design.
Fire 08 00063 g002
Figure 3. Temperature distribution field (median horizontal section).
Fire 08 00063 g003
Figure 4. Temperature distribution field (median horizontal section).
Fire 08 00063 g004
Figure 5. Temperature distribution field (median horizontal section).
Fire 08 00063 g005
Figure 6. Model design for Case #2—Nanocomposite resin cooling serpentine four-channel configuration (different in–out configuration): (a) Physical model; (b) details of serpentine design.
Fire 08 00063 g006
Figure 7. Temperature distribution field (median horizontal section).
Fire 08 00063 g007
Figure 8. Temperature distribution field (median horizontal section).
Fire 08 00063 g008
Figure 9. Temperature distribution field (median horizontal section).
Fire 08 00063 g009
Figure 10. Model design for Case #3—Multi-inlet nanocomposite resin cooling serpentine four-channels configuration (different in–out configuration): (a) Physical model; (b) details of serpentine design.
Fire 08 00063 g010
Figure 11. Temperature distribution field (median horizontal section).
Fire 08 00063 g011
Figure 12. Temperature distribution field (median horizontal section).
Fire 08 00063 g012
Figure 13. Temperature distribution field (median horizontal section).
Fire 08 00063 g013
Figure 14. Model design for Case #4—Multi-inlet nanocomposite resin cooling serpentine four-channels configuration and multiflow capability: (a) Physical model; (b) details of serpentine design.
Fire 08 00063 g014
Figure 15. Temperature distribution field (median horizontal section).
Fire 08 00063 g015
Figure 16. Temperature distribution field (median horizontal section) for Case #4.
Fire 08 00063 g016
Figure 17. Temperature distribution field (median horizontal section).
Fire 08 00063 g017
Figure 18. Heatmap of absorbed heat with internal resistance differences as markers.
Fire 08 00063 g018
Table 1. Thermal and computational metrics across mesh refinement levels.
Mesh Refinement Level234
Coolant Inlet Mass Flow [L/min]181818
Coolant temperature [°C]171717
Value  Avg. ValueValue  Avg. ValueValue  Avg. Value
Coolant Min. Temperature [°C]15.8916.0216.9116.671717
Coolant Average Temperature [°C]23.7823.7422.7922.7822.5422.53
Coolant Max. Temperature [°C]49.3248.7944.3544.0944.644.2
Serpentine Avg. Temperature [°C]18.1318.1218.1418.1318.1818.18
Cell #1 Temperature [°C]35.1235.0432.6232.5632.832.67
Cell #1 Temp. % Change--7.12%7.08%0.55%0.34%
Total Mesh Cells554,0542,058,58430,563,023
CPU calculation time [s]1803513160
Table 2. Temperature results for Case #1 (coolant temperature 17 °C).
Case #1.1Case #1.1.1Case #1.1.2Case #1.1.3Case #1.1.4
Coolant Inlet Mass Flow [L/min]1815129
Coolant temperature [°C]17171717
Value  Avg. ValueValue  Avg. ValueValue  Avg. ValueValue  Avg. Value
Coolant Min. Temperature [°C]17.0017.0017.0017.0017.0017.0017.0017.00
Coolant Average Temperature [°C] 21.8421.8221.9221.9022.0222.0022.1622.14
Coolant Max. Temperature [°C]44.0343.8244.5944.3745.0444.8245.6145.38
Serpentine Avg. Temperature [°C]19.7019.6919.8819.8720.1220.1120.4620.45
Cell #132.8432.7633.0933.0233.4633.3834.0533.97
Cell #234.0433.9834.3834.3134.8434.7535.6835.59
Cell #334.9434.7935.4335.2635.8435.6736.2636.13
Cell #436.0335.9536.4236.3236.7836.6737.1937.09
Cell #533.8133.7134.0833.9834.4334.3434.8134.72
Cell #633.5733.5133.8133.7534.1434.0734.6134.53
Cell #733.3633.2933.5333.4833.8633.8034.3434.26
Cell #834.0133.9334.2234.1434.5934.4935.0634.97
Cell #935.5835.4135.7835.6336.0435.9336.4636.33
Cell #1035.3135.1935.5435.4135.8535.7336.3436.18
Cell #1134.9834.9135.2935.2135.6335.5536.0835.98
Cell #1234.1334.0734.3634.2934.6434.5735.0734.99
Table 3. Temperature results for Case #1 (coolant temperature 20 °C).
Case #1.2Case #1.2.1Case #1.2.2Case #1.2.3Case #1.2.4
Coolant Inlet Mass Flow [L/min]1815129
Coolant temperature [°C]20202020
Value  Avg. ValueValue  Avg. ValueValue  Avg. ValueValue  Avg. Value
Coolant Min. Temperature [°C]20.0520.0520.0520.0520.0520.0520.0520.05
Coolant Average Temperature [°C] 23.4423.4223.5123.4923.6023.5723.7223.70
Coolant Max. Temperature [°C]46.6946.4647.2146.9847.6947.4548.2447.98
Serpentine Avg. Temperature [°C]22.3422.3322.5022.4922.7122.7023.0123.00
Cell #135.0935.0235.3435.2735.6835.6136.2436.15
Cell #236.3236.2536.6336.5637.0836.9937.8637.76
Cell #337.1637.0437.6037.4938.0337.8938.4738.33
Cell #438.4038.2538.7538.5939.1438.9539.4939.33
Cell #536.0535.9736.2936.2136.6536.5537.0236.92
Cell #635.8135.7636.0435.9836.3536.2836.7936.70
Cell #735.6535.5835.8235.7636.0836.0136.5736.49
Cell #836.3136.2236.5236.4236.8236.7037.3237.20
Cell #937.8137.7238.0437.9338.3138.1938.7038.58
Cell #1037.6637.4837.8937.7038.1737.9838.6338.42
Cell #1137.2937.1837.5537.4637.9037.7938.3038.19
Cell #1236.3536.2836.5636.4836.8236.7437.2237.13
Table 4. Temperature results for Case #1 (coolant temperature 25 °C).
Case #1.3Case #1.3.1Case #1.3.2Case #1.3.3Case #1.3.4
Coolant Inlet Mass Flow [L/min]1815129
Coolant temperature [°C]25252525
Value  Avg. ValueValue  Avg. ValueValue  Avg. ValueValue  Avg. Value
Coolant Min. Temperature [°C]20.1120.1120.1120.1120.1120.1120.1120.11
Coolant Average Temperature [°C] 26.0526.0326.1026.0726.1726.1426.2726.24
Coolant Max. Temperature [°C]51.0550.8251.3851.1452.0051.7452.5052.23
Serpentine Avg. Temperature [°C]26.6426.6326.7626.7526.9426.9227.1827.16
Cell #138.7738.6839.0038.9039.3139.2139.7839.67
Cell #240.0239.9440.3140.2340.7340.6341.2941.18
Cell #340.8540.7541.1141.0441.6141.5342.0441.95
Cell #442.0041.9142.2942.1842.742.5743.0642.93
Cell #539.6839.6039.9239.8340.2140.1140.5640.47
Cell #639.4639.3939.6639.5839.9239.8440.3040.22
Cell #739.3839.3139.5439.4739.7739.6940.2140.12
Cell #840.0139.9540.2040.1340.4740.3940.9240.84
Cell #941.5541.4641.7641.6642.0141.9142.3842.27
Cell #1041.3141.2341.541.4241.7941.6942.2142.09
Cell #1140.9840.8641.2141.0941.5341.4041.9341.78
Cell #1240.0039.9240.1840.0940.4240.3340.7840.68
Table 5. Temperature results for Case #2 (coolant temperature 17 °C).
Case #2.1Case #2.1.1Case #2.1.2Case #2.1.3Case #2.1.4
Coolant Inlet Mass Flow [L/min]1815129
Coolant temperature [°C]17171717
Value  Avg. ValueValue  Avg. ValueValue  Avg. ValueValue  Avg. Value
Coolant Min. Temperature [°C]16.9116.6716.9316.8117.0016.8917.0016.94
Coolant Average Temperature [°C] 22.7922.7822.8422.8222.9122.8923.0122.99
Coolant Max. Temperature [°C]44.3544.0944.4944.2244.7044.4245.0244.72
Serpentine Avg. Temperature [°C]18.1418.1318.2518.2418.4018.4018.6518.65
Cell #132.6232.5632.7132.6432.8232.7532.9932.92
Cell #233.7833.7233.9433.8834.1634.0934.4834.41
Cell #333.6133.5633.7333.6633.8733.8134.1134.04
Cell #434.0533.9334.1634.0434.3334.2034.5834.45
Cell #532.2832.2232.3832.3332.5232.4732.7432.69
Cell #633.1333.0633.2633.1933.4433.3733.7333.66
Cell #733.6833.6033.7733.6933.8933.8234.1034.02
Cell #833.8033.7233.9233.8434.0934.0134.3634.27
Cell #934.8934.7834.9834.8635.1134.9935.3035.19
Cell #1034.2634.1434.3634.2434.5334.4034.7734.63
Cell #1133.3133.2333.4333.3633.6133.5433.8933.81
Cell #1233.4133.3533.5433.4733.7333.6634.0233.94
Table 6. Temperature results for Case #2 (coolant temperature 20 °C).
Case #2.2Case #2.2.1Case #2.2.2Case #2.2.3Case #2.2.4
Coolant Inlet Mass Flow [L/min]1815129
Coolant temperature [°C]20202020
Value  Avg. ValueValue  Avg. ValueValue  Avg. ValueValue  Avg. Value
Coolant Min. Temperature [°C]19.9119.7719.9119.719.9119.8419.919.89
Coolant Average Temperature [°C] 24.3724.3424.4124.3824.4724.4424.5624.53
Coolant Max. Temperature [°C]47.2846.9747.4247.1047.6247.2947.9147.57
Serpentine Avg. Temperature [°C]21.0421.0421.1421.1321.2821.2721.5021.50
Cell #135.0034.9435.0835.0135.1935.1235.3535.28
Cell #236.2236.1536.3736.3036.5836.5136.8836.81
Cell #336.0535.9836.1336.0736.2736.2036.4936.41
Cell #436.5236.3836.6236.4736.7736.6237.0136.84
Cell #534.6434.5834.7334.6734.8634.8035.0635.00
Cell #635.5535.4835.6735.5935.8435.7636.1136.03
Cell #736.1736.0936.2536.1736.3836.2936.5836.49
Cell #836.2836.2136.4036.3236.5736.4836.8236.73
Cell #937.3237.1937.4137.2737.5237.3837.7237.56
Cell #1036.7036.5636.8036.6536.9436.8037.1737.02
Cell #1135.7935.6935.9035.8036.0735.9736.3336.22
Cell #1235.8835.8036.0035.9236.1836.0936.4536.36
Table 7. Temperature results for Case #2 (coolant temperature 25 °C).
Case #2.3Case #2.3.1Case #2.3.2Case #2.3.3Case #2.3.4
Coolant Inlet Mass Flow [L/min]1815129
Coolant temperature [°C]25252525
Value  Avg. ValueValue  Avg. ValueValue  Avg. ValueValue  Avg. Value
Coolant Min. Temperature [°C]19.8919.9319.8919.9319.8919.9319.8819.93
Coolant Average Temperature [°C] 26.9326.926.9726.9427.0226.9827.0927.05
Coolant Max. Temperature [°C]52.0651.7252.1851.8452.3552.0152.6252.27
Serpentine Avg. Temperature [°C]25.7525.7525.8425.8325.9525.9426.1326.12
Cell #138.8738.8138.9438.8839.0438.9739.1839.11
Cell #240.1940.1240.3340.2640.5240.4540.8040.72
Cell #340.0539.9640.1340.0540.2640.1640.4540.34
Cell #440.5240.3740.6140.4640.7440.5840.9540.78
Cell #538.4538.3938.5238.4738.6438.5838.8038.74
Cell #639.5139.4239.6239.5239.7739.6740.0139.90
Cell #740.2440.1440.3240.2240.4440.3340.6140.5
Cell #840.3640.2640.4640.3640.6140.5140.8440.73
Cell #941.2841.1341.3641.2041.4541.2941.6041.44
Cell #1040.6540.5440.7540.6240.8740.7441.0840.95
Cell #1139.8239.7339.9339.8340.0839.9840.3140.20
Cell #1239.9939.8440.1039.9540.2640.1040.5140.33
Table 8. Temperature results for Case #3 (coolant temperature 17 °C).
Case #3.1Case #3.1.1Case #3.1.2Case #3.1.3Case #3.1.4
Coolant Inlet Mass Flow [L/min]1815129
Coolant temperature [°C]17171717
Value  Avg. ValueValue  Avg. ValueValue  Avg. ValueValue  Avg. Value
Coolant Min. Temperature [°C]17.0017.0017.0017.0017.0017.0017.0017.00
Coolant Average Temperature [°C] 21.8721.8421.9221.9021.9221.9021.9221.90
Coolant Max. Temperature [°C]48.6948.3349.1348.7449.1348.7449.1348.74
Serpentine Avg. Temperature [°C]23.423.3523.5823.5323.5823.5323.5823.53
Cell #136.3536.2636.5336.4436.5336.4436.5336.44
Cell #237.8037.6538.0437.8738.0437.8738.0437.87
Cell #337.9537.8038.1838.0238.1838.0238.1838.02
Cell #439.2139.0239.4639.2639.4639.2639.4639.26
Cell #536.7536.6536.9536.8436.9536.8436.9536.84
Cell #637.0936.9737.2737.1537.2737.1537.2737.15
Cell #738.1237.9838.3938.2438.3938.2438.3938.24
Cell #838.7938.6339.1538.9839.1538.9839.1538.98
Cell #940.1839.9540.5540.3140.5540.3140.5540.31
Cell #1040.2540.0440.6340.4040.6340.4040.6340.40
Cell #1138.6938.5239.0138.8339.0138.8339.0138.83
Cell #1237.7537.6138.0037.8638.0037.8638.0037.86
Table 9. Temperature results for Case #3 (coolant temperature 20 °C).
Case #3.2Case #3.2.1Case #3.2.2Case #3.2.3Case #3.2.4
Coolant Inlet Mass Flow [L/min]1815129
Coolant temperature [°C]20202020
Value  Avg. ValueValue  Avg. ValueValue  Avg. ValueValue  Avg. Value
Coolant Min. Temperature [°C]20.0520.0420.0520.0520.0520.0520.0520.05
Coolant Average Temperature [°C] 22.9222.8922.9722.9423.0523.0223.1523.12
Coolant Max. Temperature [°C]51.3050.9151.7251.3352.3251.9053.1952.7
Serpentine Avg. Temperature [°C]25.7825.7325.9525.9026.2126.1526.5726.50
Cell #138.6038.5038.7738.6639.0538.9339.3639.24
Cell #240.1439.9740.3640.1840.6640.4741.0540.84
Cell #340.2840.1040.5040.3140.7840.5841.2241.00
Cell #441.5641.3341.8141.5742.1441.8942.6742.39
Cell #539.0338.9239.2239.0939.4739.3439.8339.68
Cell #639.3439.1939.5239.3639.7739.6140.1339.95
Cell #740.3840.2340.6440.4841.0740.8941.5941.38
Cell #841.0840.8941.4841.2841.9641.7442.6242.37
Cell #942.4742.2542.8642.6443.3843.1344.1243.82
Cell #1042.5842.3342.9642.7043.4743.2044.2243.91
Cell #1141.0040.8141.2941.1041.7641.5542.5642.30
Cell #1240.0239.8340.2540.0540.6840.4741.2941.05
Table 10. Temperature results for Case #3 (coolant temperature 25 °C).
Case #3.3Case #3.3.1Case #3.3.2Case #3.3.3Case #3.3.4
Coolant Inlet Mass Flow [L/min]1815129
Coolant temperature [°C]25252525
Value  Avg. ValueValue  Avg. ValueValue  Avg. ValueValue  Avg. Value
Coolant Min. Temperature [°C]20.1920.1920.1920.1920.1920.1920.1920.19
Coolant Average Temperature [°C] 24.6524.6124.6924.6624.7424.7024.8224.78
Coolant Max. Temperature [°C]55.4955.0456.0455.5656.6356.1057.4456.88
Serpentine Avg. Temperature [°C]29.6229.5729.8129.7530.0129.9430.3330.25
Cell #142.2742.1442.4342.2942.6342.4942.9642.80
Cell #243.8943.7144.1243.9244.3844.1744.7844.55
Cell #344.1243.8744.3544.0944.6344.3445.0144.73
Cell #445.3245.0945.5945.3545.8945.6446.3646.09
Cell #542.7742.5942.9742.7743.1942.9943.5343.31
Cell #642.9642.7843.1242.9543.3443.1543.6743.47
Cell #744.0943.8844.444.1644.7144.4645.2544.97
Cell #844.7344.5245.2445.0145.6645.4246.3146.04
Cell #946.2345.9746.7346.4447.2246.9047.9247.57
Cell #1046.3046.0346.7646.4847.2446.9347.9547.60
Cell #1144.6744.4545.0344.8045.4445.1946.1145.84
Cell #1243.6143.4143.8743.6544.1743.9544.7744.53
Table 11. Temperature results for Case #4 (coolant temperature 17 °C).
Case #4.1Case #4.1.1Case #4.1.2Case #4.1.3Case #4.1.4
Coolant Inlet Mass Flow [L/min]1815129
Coolant temperature [°C]17171717
Value  Avg. ValueValue  Avg. ValueValue  Avg. ValueValue  Avg. Value
Coolant Min. Temperature [°C]17.0016.8016.2616.5217.0016.8617.0016.89
Coolant Average Temperature [°C] 22.2122.1822.2622.2322.3922.3422.5122.46
Coolant Max. Temperature [°C]51.2250.7451.6051.1152.3351.7753.1552.56
Serpentine Avg. Temperature [°C]24.3024.2324.4824.4124.8624.7825.2625.17
Cell #137.7637.6337.9737.8238.438.2538.8238.64
Cell #239.8839.7140.1539.9740.7140.5041.2240.99
Cell #340.3240.0840.6040.3541.1040.8241.6141.31
Cell #441.3141.0341.6141.3242.1541.8342.7142.37
Cell #538.6638.4938.9138.7339.3639.1639.8239.60
Cell #638.9038.7139.2039.0139.6639.4440.1239.88
Cell #739.3139.1239.5339.3440.1939.9840.7240.49
Cell #840.0939.9040.4040.1941.0140.7741.6441.38
Cell #942.2741.9942.5742.2843.1942.8543.9043.53
Cell #1041.6341.3141.9441.642.5542.1843.2442.85
Cell #1140.9640.7341.2641.0241.8841.6142.5342.23
Cell #1239.5039.2939.7339.5140.3540.1040.9240.65
Table 12. Temperature results for Case #4 (coolant temperature 20 °C).
Case #4.2Case #4.2.1Case #4.2.2Case #4.2.3Case #4.2.4
Coolant Inlet Mass Flow [L/min]1815129
Coolant temperature [°C]20202020
Value  Avg. ValueValue  Avg. ValueValue  Avg. ValueValue  Avg. Value
Coolant Min. Temperature [°C]20.0519.5820.0519.9219.0919.9019.8019.83
Coolant Average Temperature [°C] 23.2323.1923.2823.2423.3823.3423.4923.44
Coolant Max. Temperature [°C]53.7353.2154.1653.5954.8754.2555.6455.01
Serpentine Avg. Temperature [°C]26.6126.5426.826.7227.1527.0627.5327.43
Cell #139.9239.7740.1139.9540.5440.3640.9340.74
Cell #242.1341.9242.3842.1742.9342.6943.4343.17
Cell #342.6142.3142.8942.5843.3843.0343.8743.51
Cell #443.5843.2743.8743.5544.4044.0544.9544.58
Cell #540.9040.7141.1340.9441.5741.3642.0241.78
Cell #641.1140.8841.3741.1341.8441.5842.2741.99
Cell #741.4941.2941.6941.4942.3542.1142.8642.60
Cell #842.3242.1042.6142.3843.2342.9843.8243.53
Cell #944.5444.2144.8944.5345.4645.0846.1545.74
Cell #1043.8843.5444.2243.8644.8044.4145.4845.06
Cell #1143.2042.9643.5243.2644.1143.8244.7544.43
Cell #1241.7041.4641.9341.6742.4942.2243.0642.76
Table 13. Temperature results for Case #4 (coolant temperature 25 °C).
Case #4.3Case #4.3.1Case #4.3.2Case #4.3.3Case #4.3.4
Coolant Inlet Mass Flow [L/min]1815129
Coolant temperature [°C]25252525
Value  Avg. ValueValue  Avg. ValueValue  Avg. ValueValue  Avg. Value
Coolant Min. Temperature [°C]20.2320.2320.2320.2320.2320.2320.2320.23
Coolant Average Temperature [°C] 24.8924.8424.9424.8925.0124.9625.1125.04
Coolant Max. Temperature [°C]57.7757.1858.2857.6658.9658.3159.7459.01
Serpentine Avg. Temperature [°C]30.3830.3030.5630.4730.8530.7531.2131.10
Cell #143.4543.2843.6343.4443.9743.7644.3944.16
Cell #245.7945.5346.0345.7746.5246.2247.0446.72
Cell #346.2045.9146.4946.1946.9546.6247.4347.07
Cell #447.2346.8947.5747.2248.0747.7048.5948.19
Cell #544.5344.3244.7644.5345.1544.9145.5845.31
Cell #644.6644.4244.9344.6645.3245.0445.7345.42
Cell #745.0244.7845.2545.0045.6745.4046.3846.07
Cell #845.9445.6946.2645.9946.8046.5147.4347.10
Cell #948.2047.8248.648.2149.1948.7549.8349.35
Cell #1047.5447.1547.9447.5448.5048.0749.1348.67
Cell #1146.8246.5547.1946.8947.7247.3948.3647.99
Cell #1245.2745.0045.5245.2345.9145.6046.5846.23
Disclaimer/Publisher’s Note: The statements, opinions and data contained in all publications are solely those of the individual author(s) and contributor(s) and not of MDPI and/or the editor(s). MDPI and/or the editor(s) disclaim responsibility for any injury to people or property resulting from any ideas, methods, instructions or products referred to in the content.

