
Estimation of Short-Term Vegetation Recovery in Post-Fire Siberian Dwarf Pine (Pinus pumila) Shrublands Based on Sentinel-2 Data


Abstract
1. Introduction
- To quantify the vegetation recovery process of Siberian dwarf pine shrublands through short-term observations;
- To explore the disparities in vegetation recovery under different fire severity levels and topography conditions;
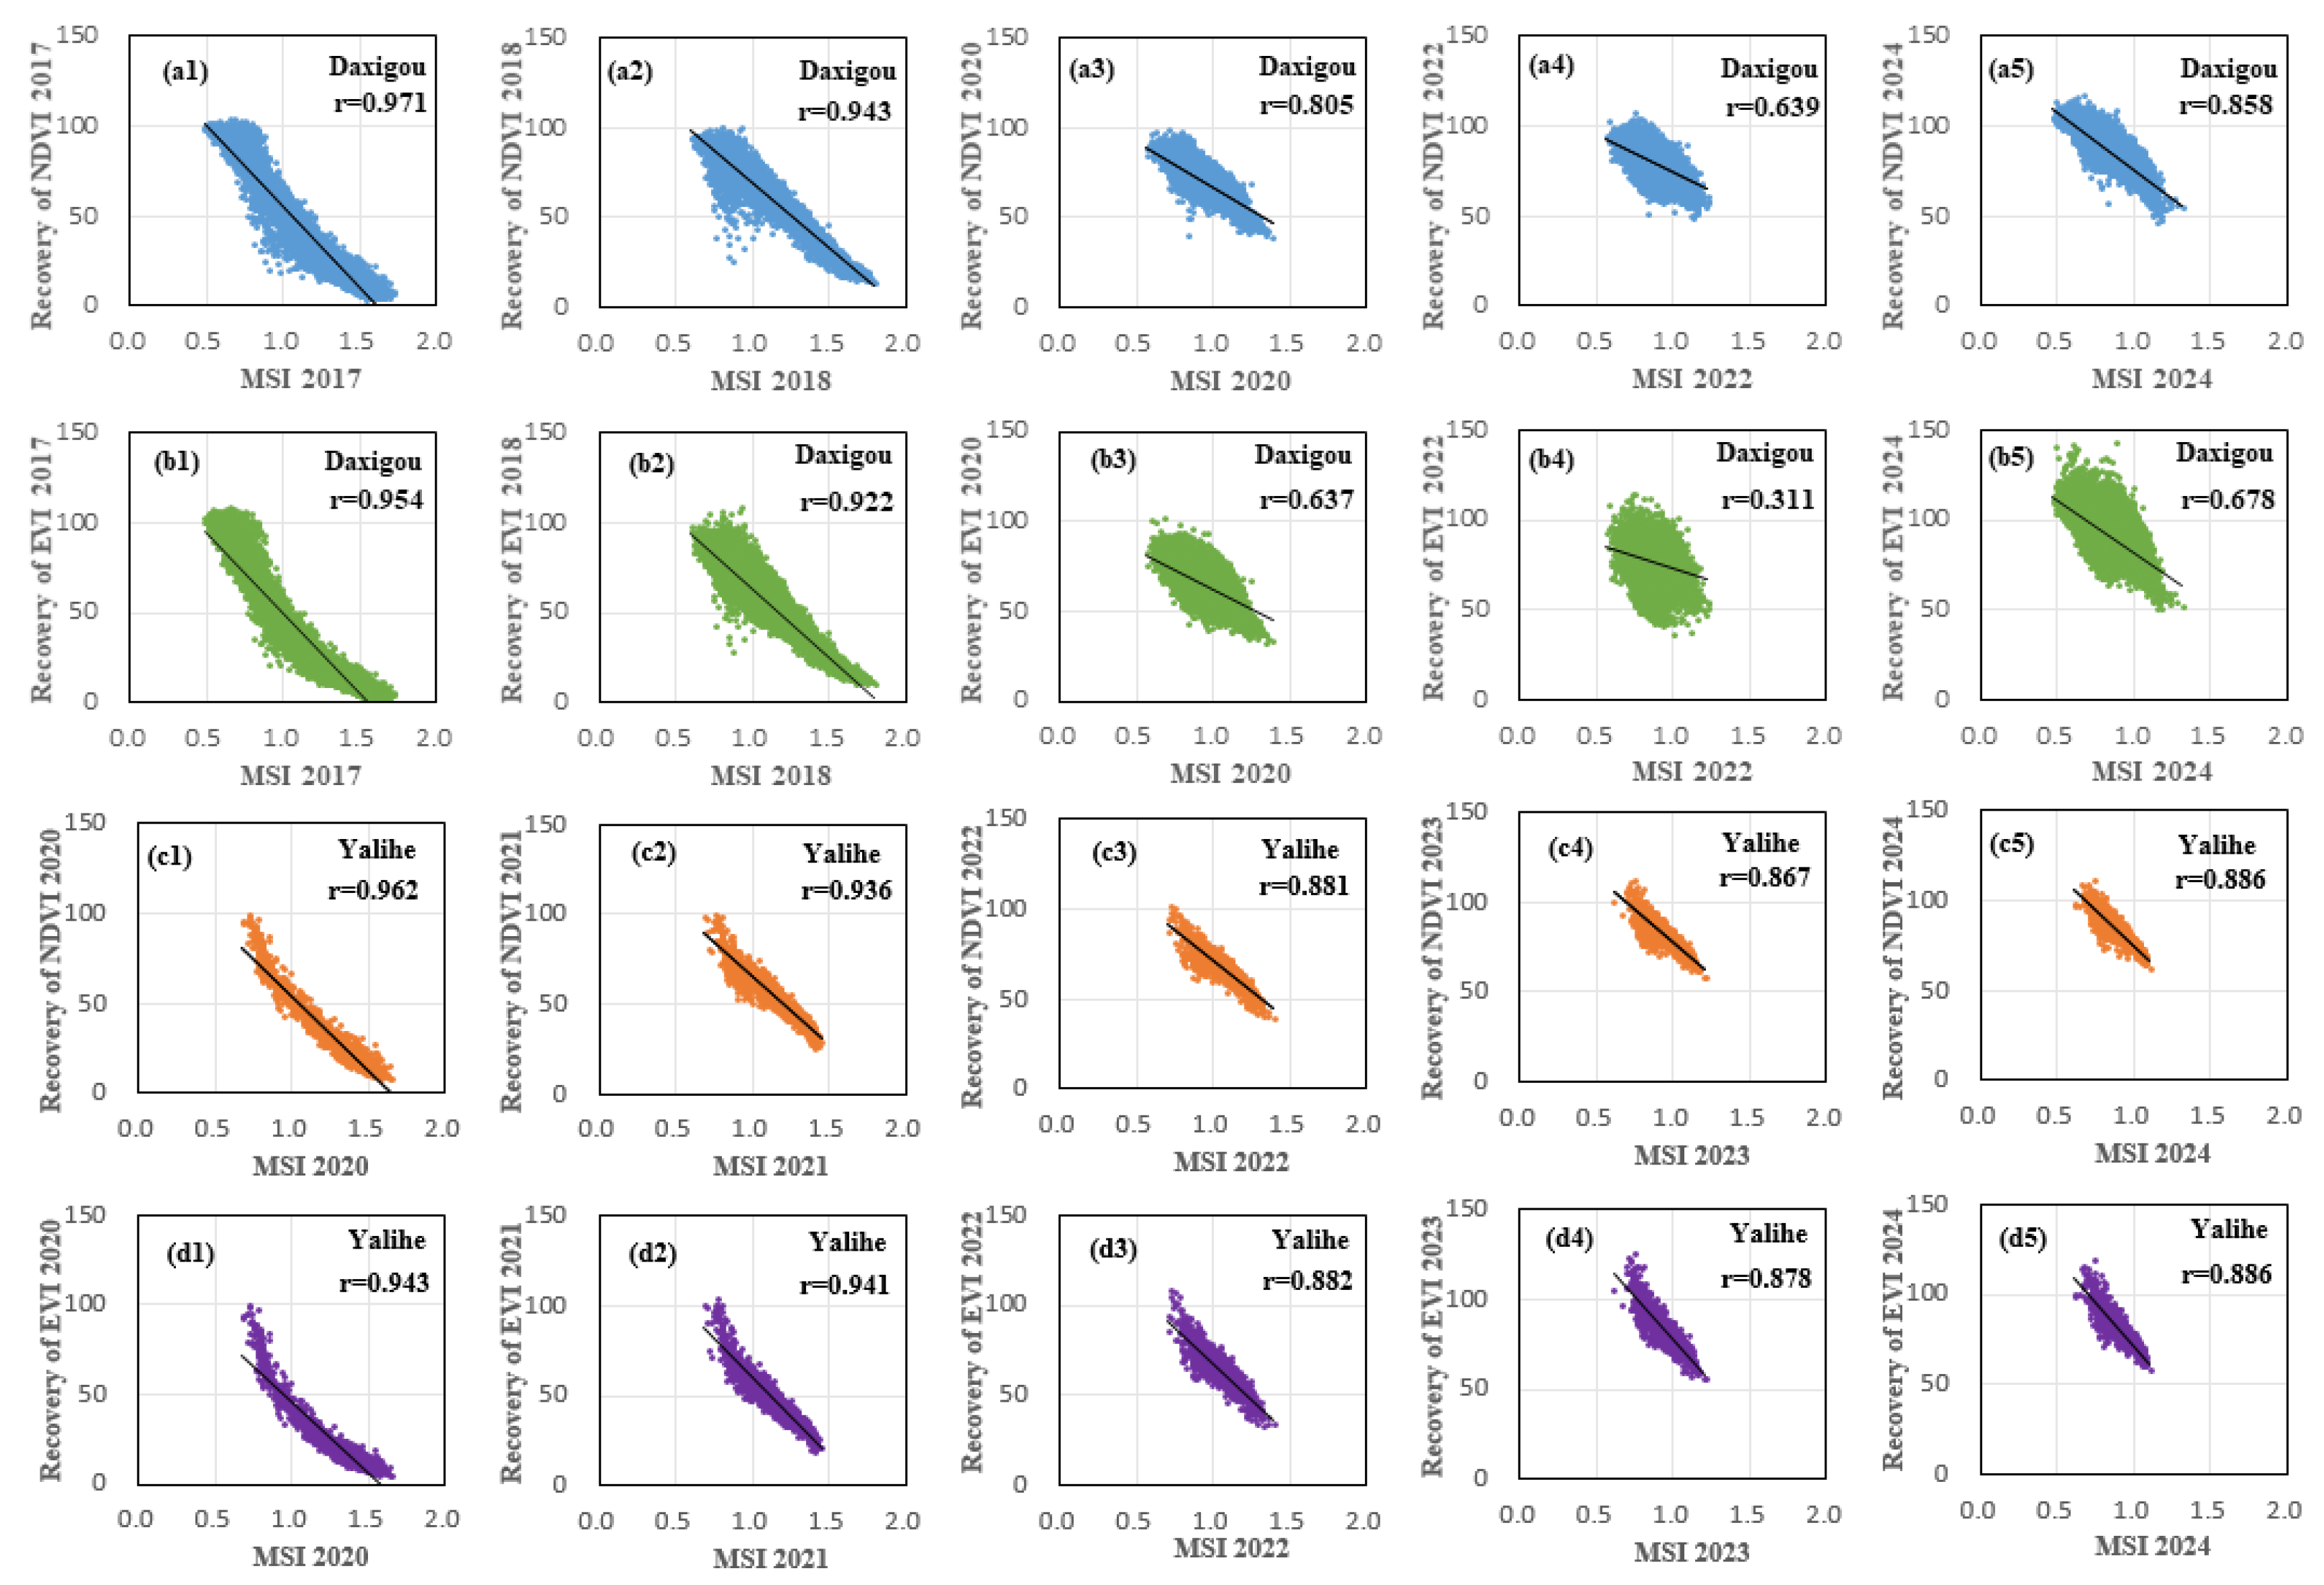
- To explore the effect of moisture content on post-fire recovery using correlation analysis.
2. Materials and Methods
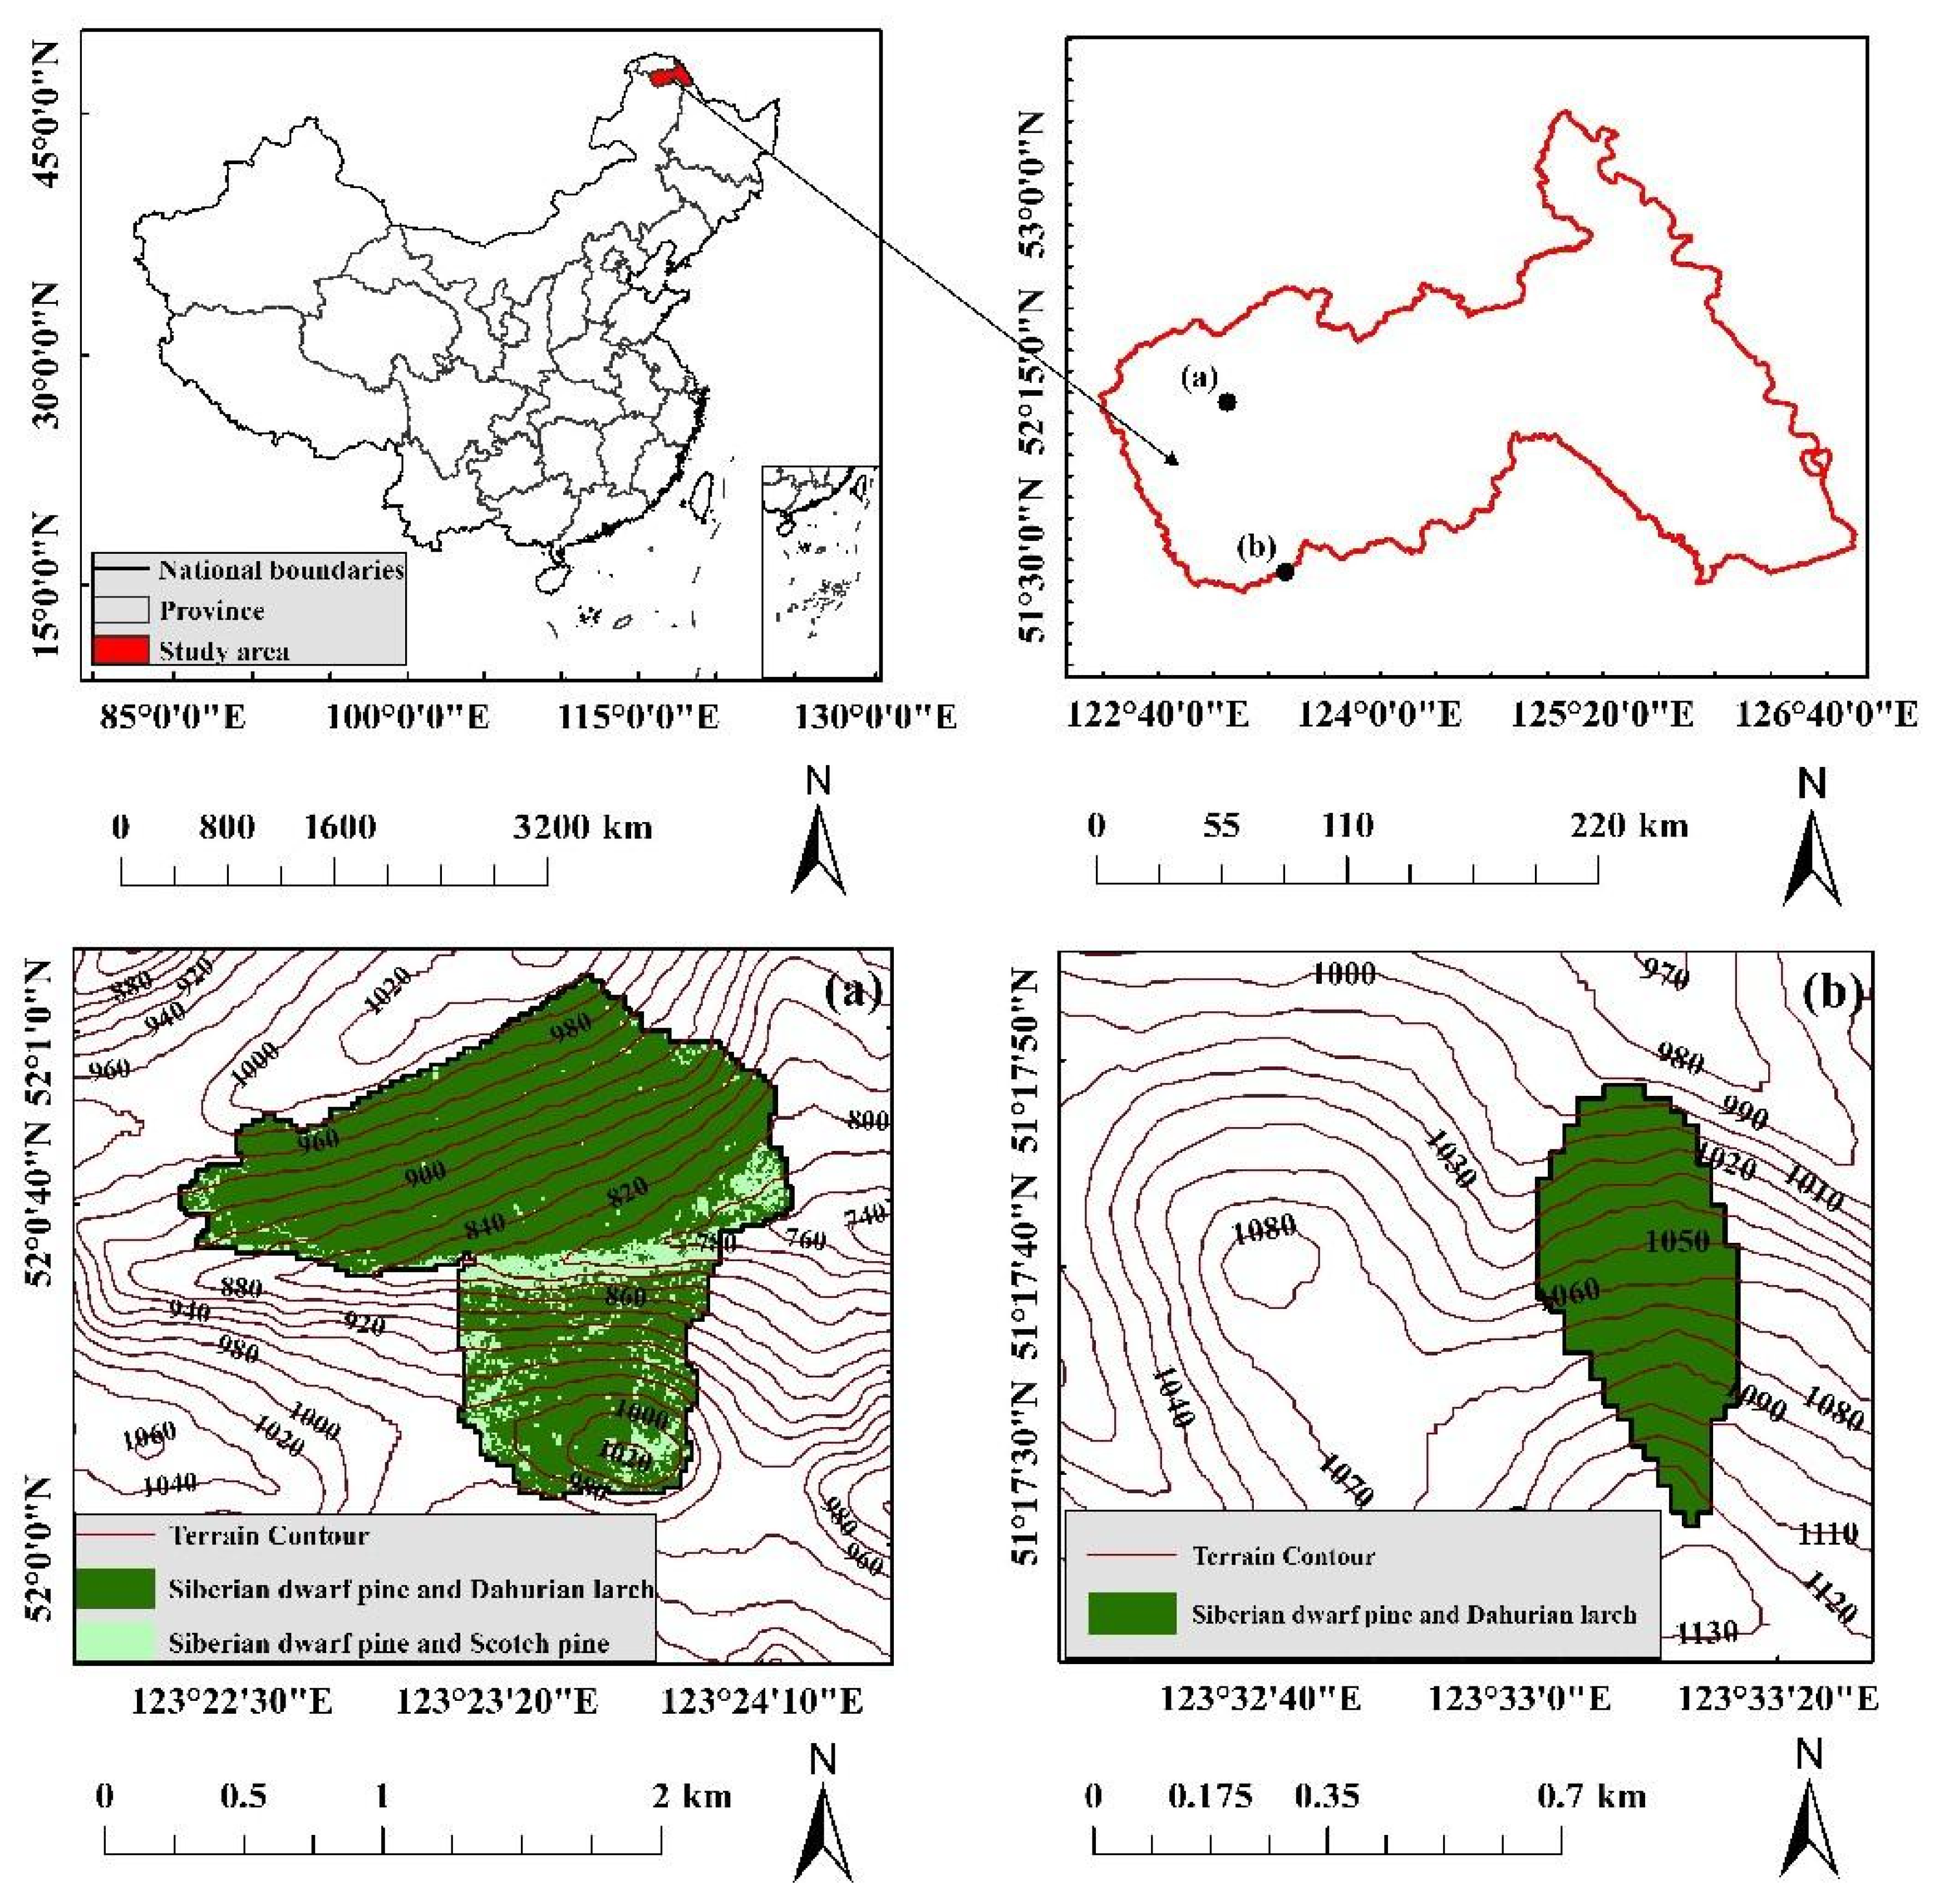
2.1. Study Site
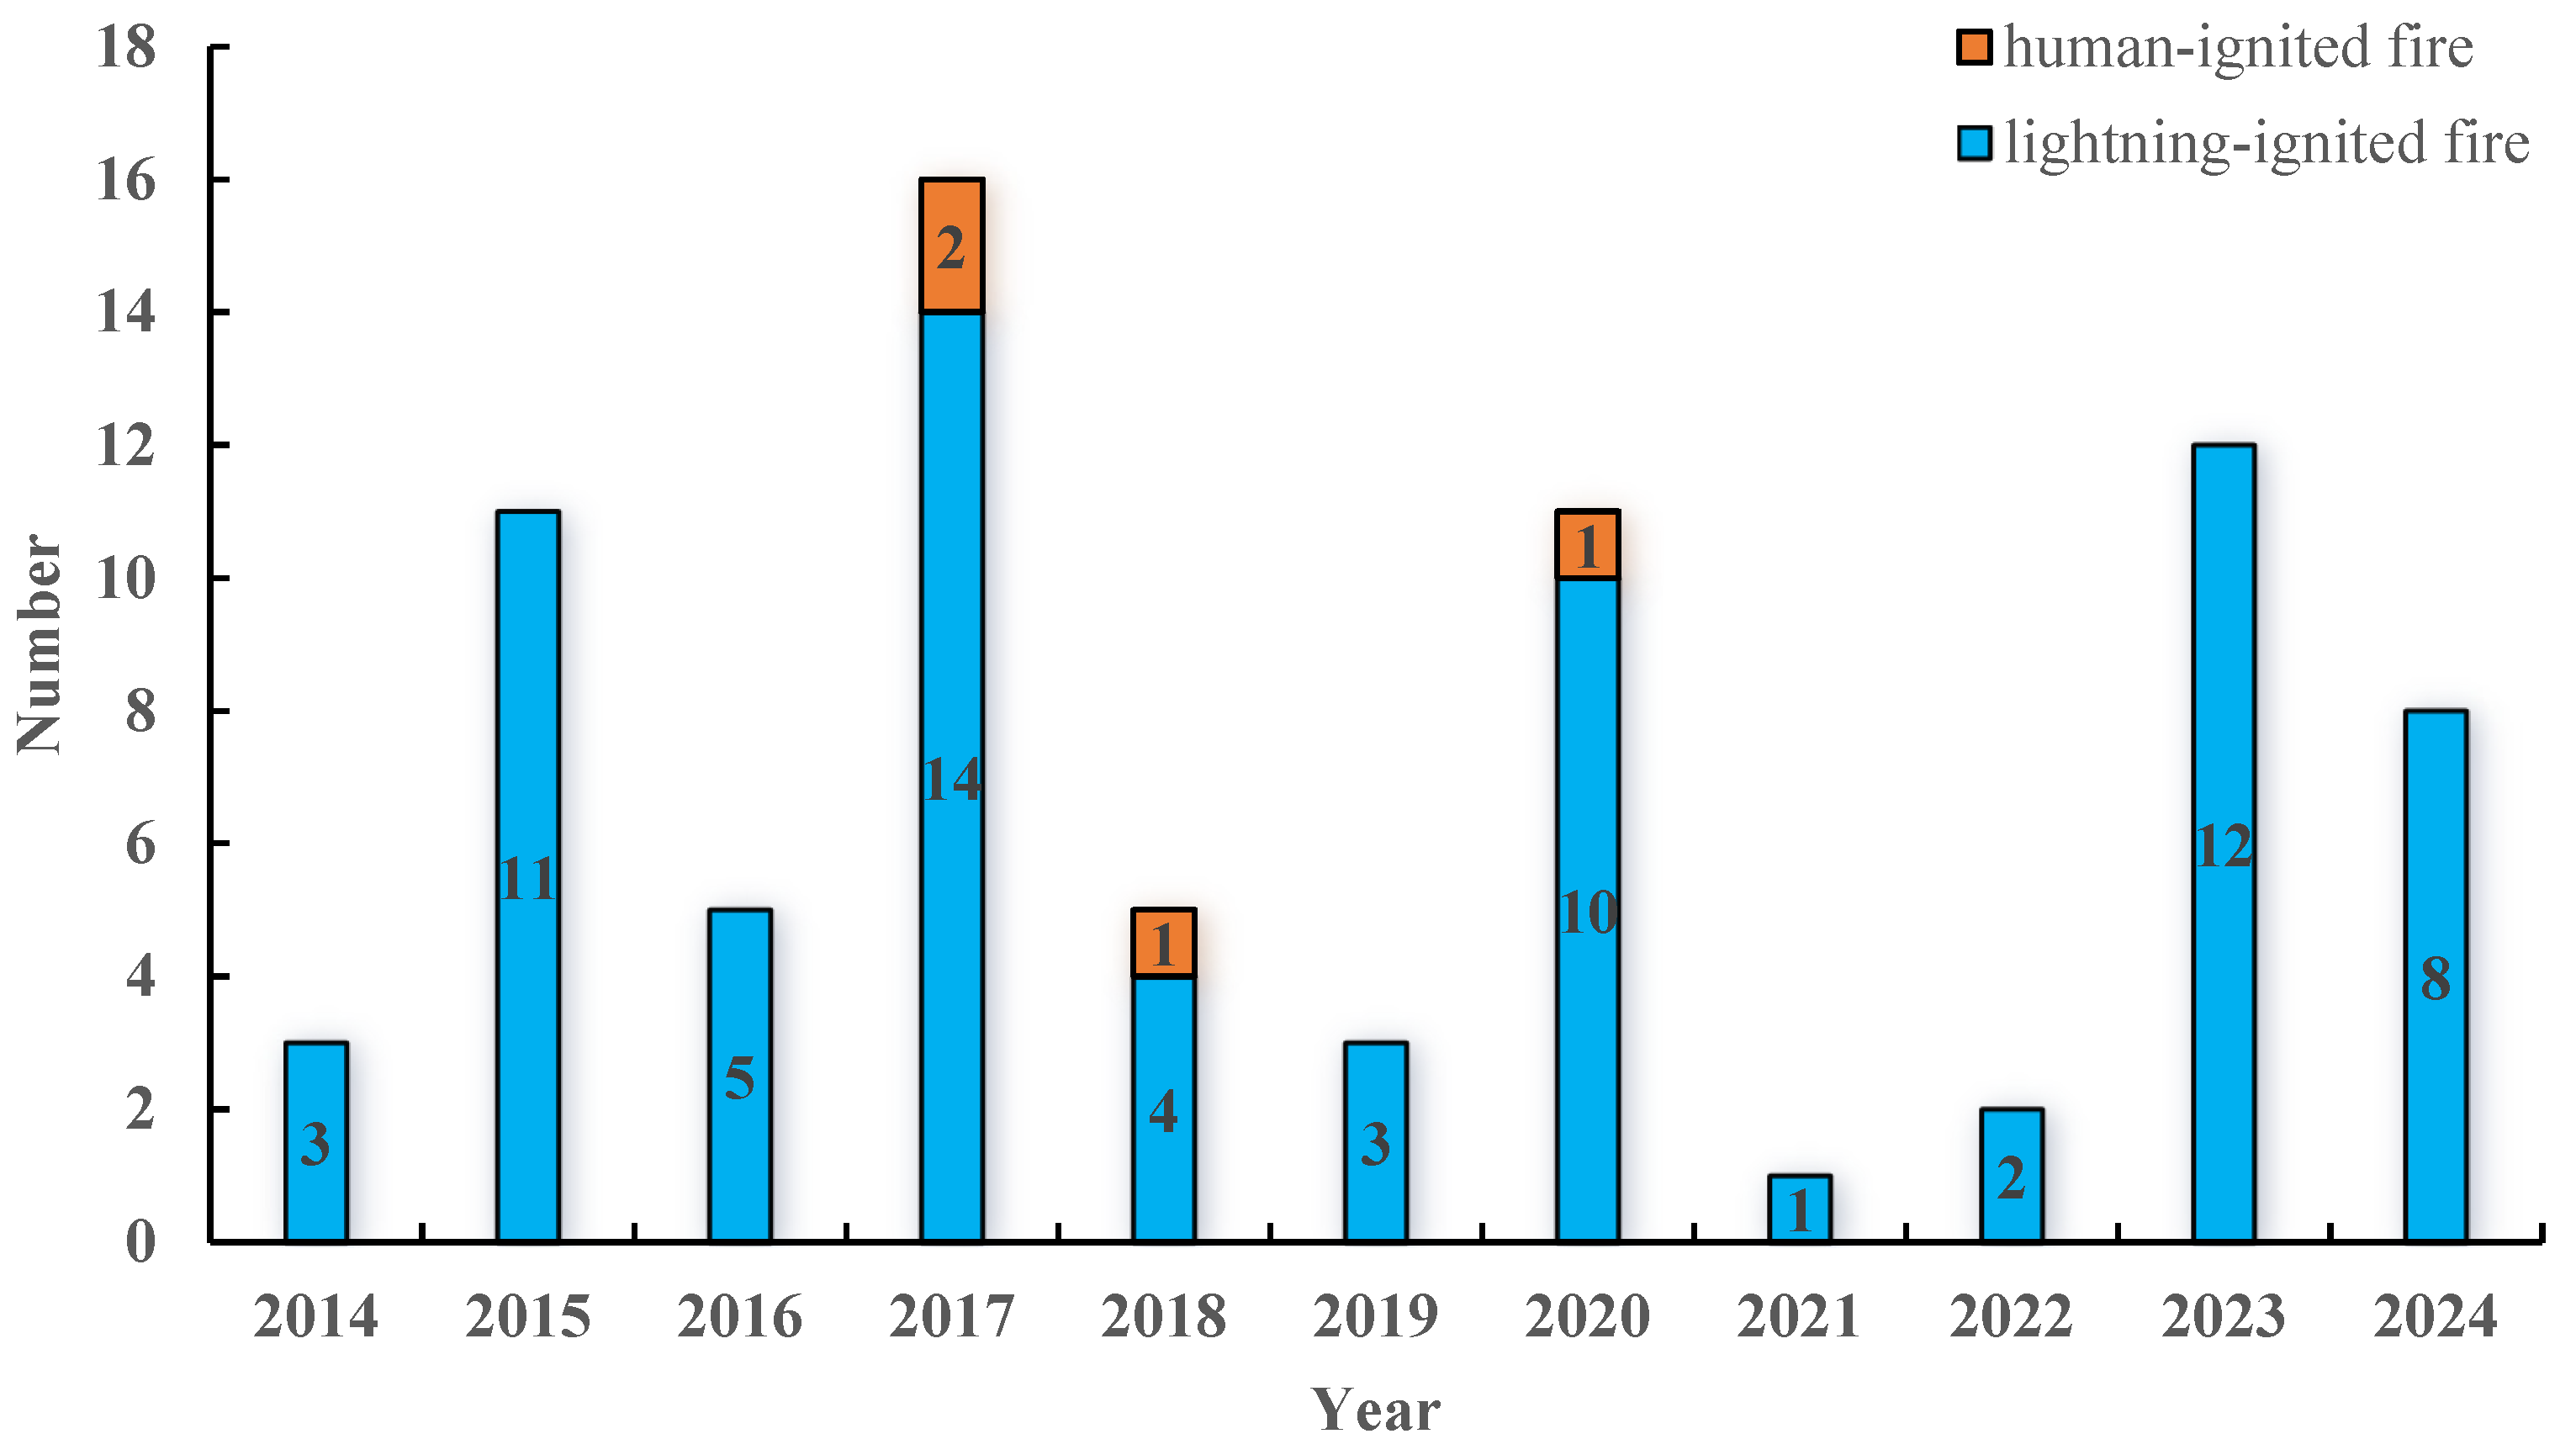
2.2. Fire History
2.3. Data
2.4. Methods
2.4.1. Vegetation Index
2.4.2. The Impact of Topography on Vegetation Recovery
2.4.3. Correlation Analysis
3. Results
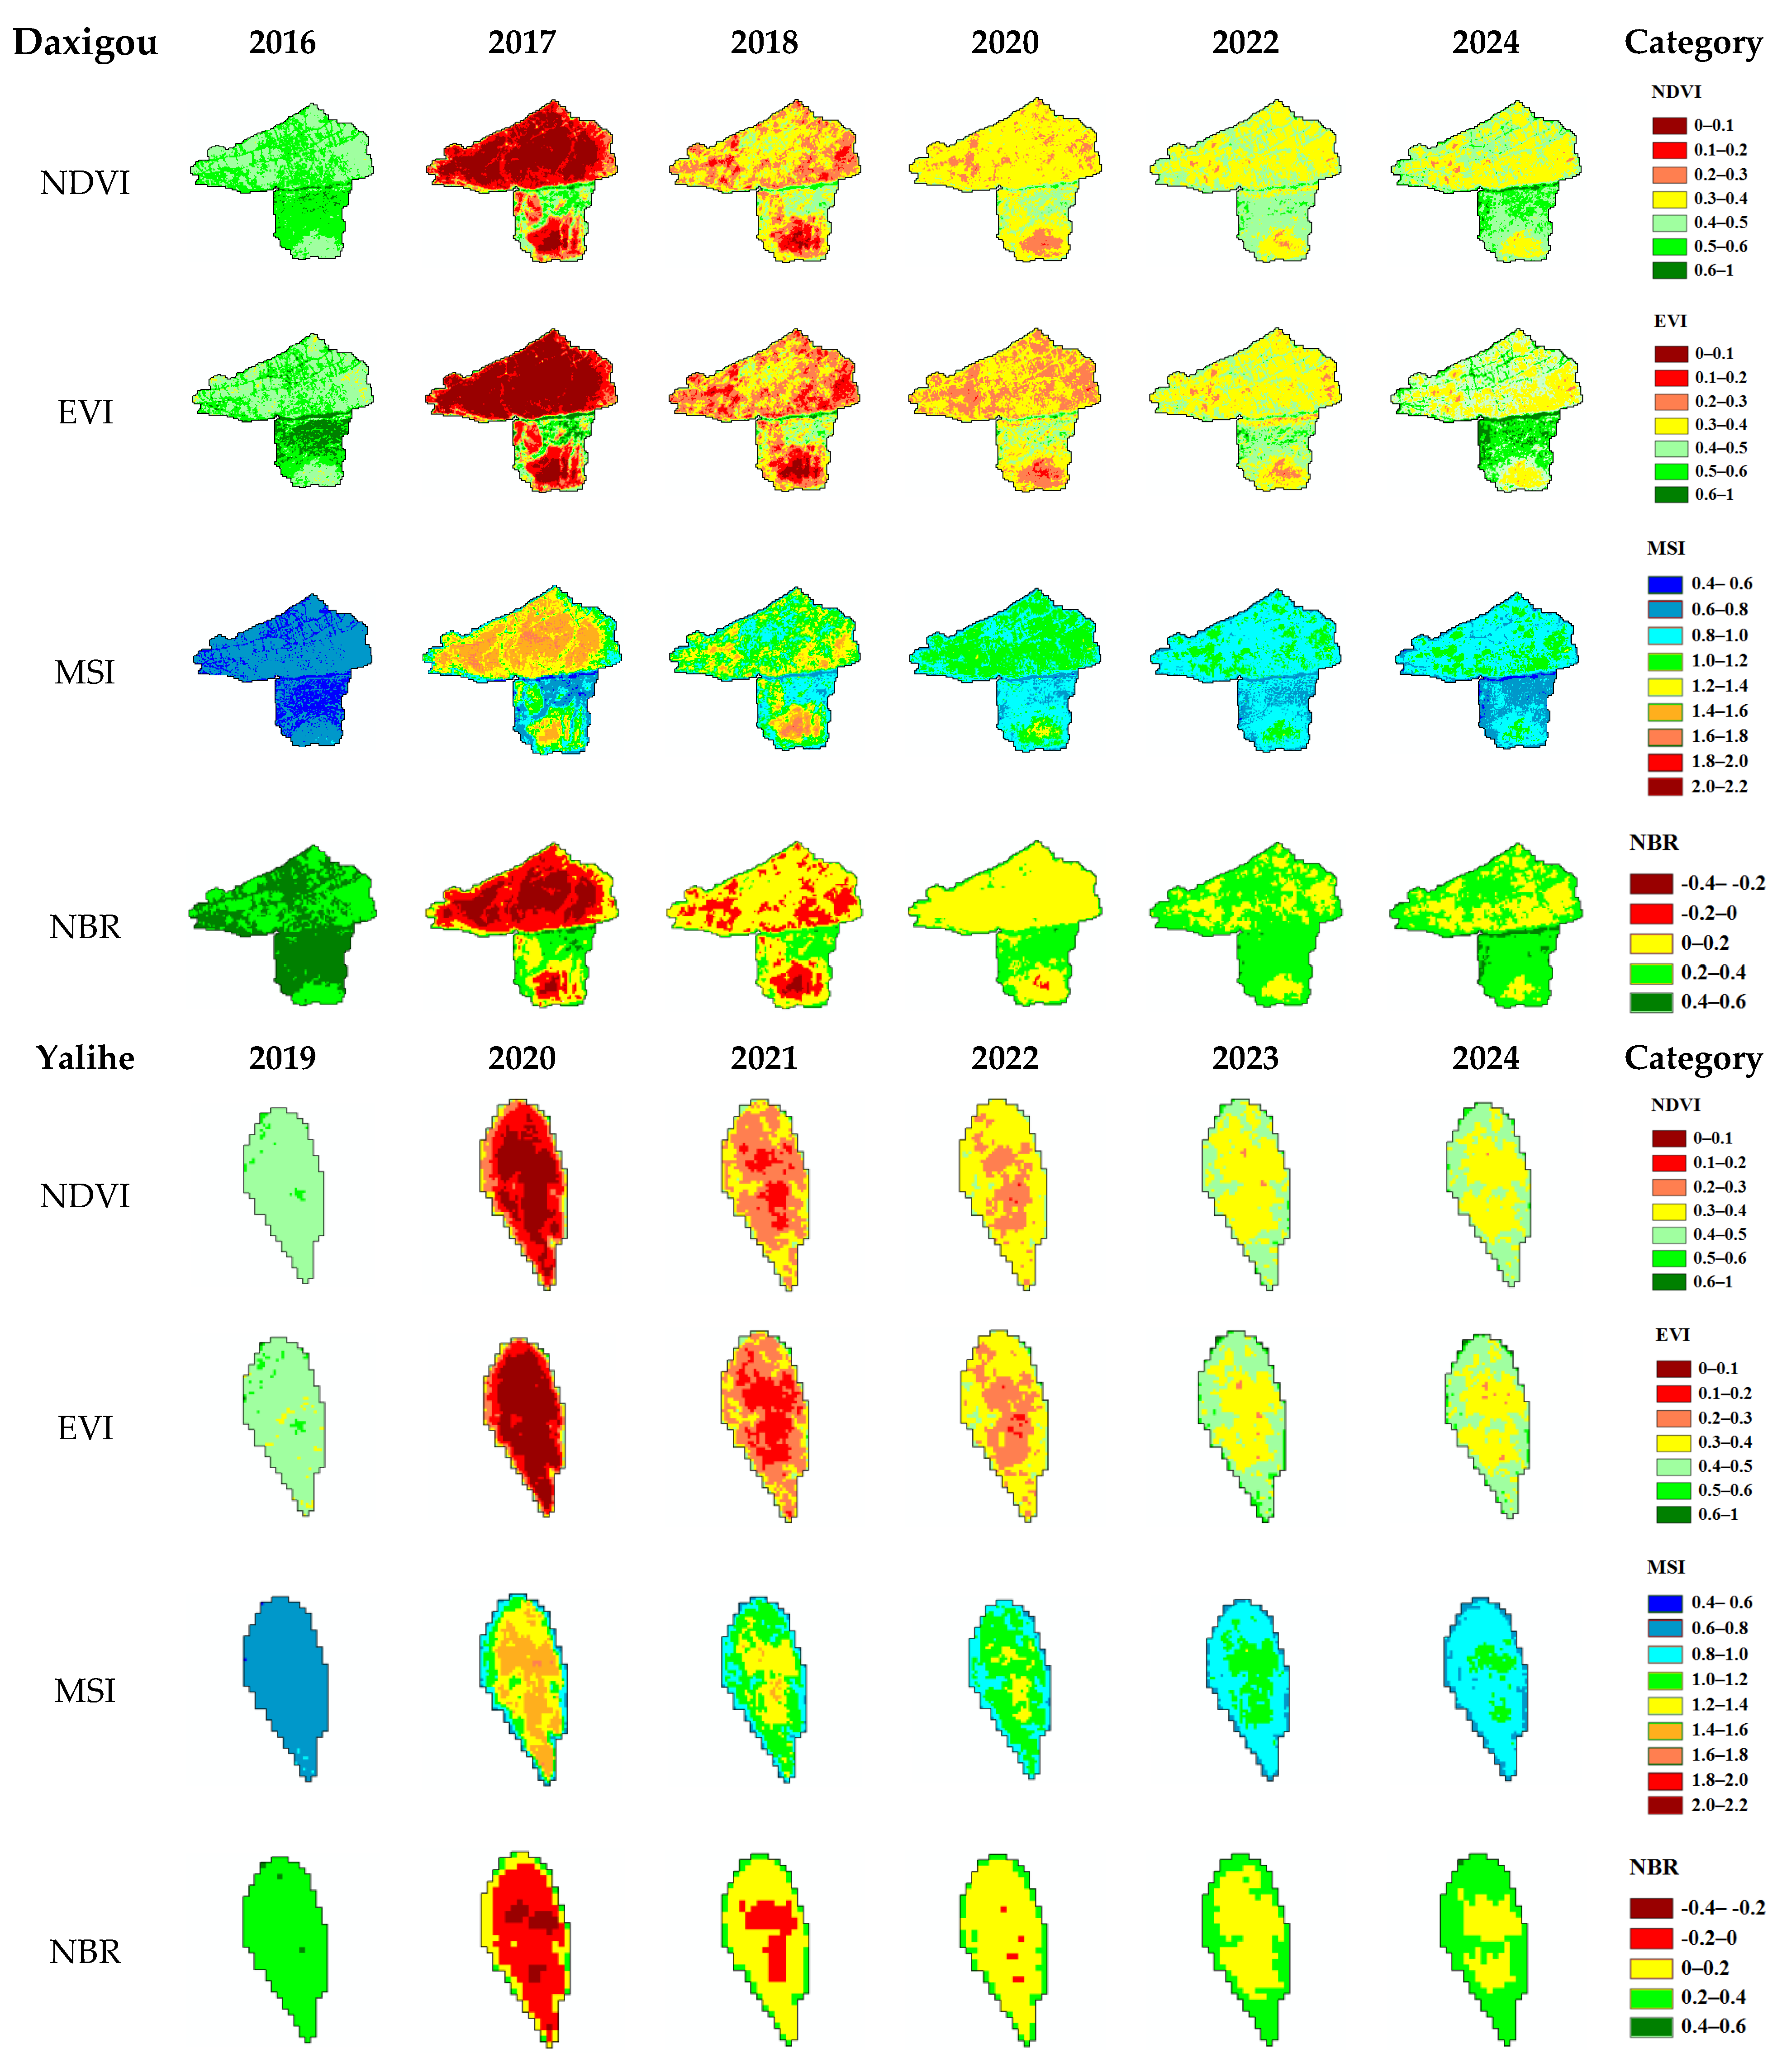
3.1. Forest Vegetation Recovery for the Study Area
3.2. Vegetation Recovery in Different Topographic Factors
3.2.1. Distribution of Fire Severity in the Study Areas
3.2.2. Vegetation Recovery in the Individual Slope Aspects
3.2.3. Vegetation Recovery in Different Slopes
3.2.4. Vegetation Recovery in Different Altitudes
3.3. Correlation Analysis
4. Discussion
5. Conclusions
Author Contributions
Funding
Institutional Review Board Statement
Informed Consent Statement
Data Availability Statement
Conflicts of Interest
Appendix A

| Daxigou-NDVI | ||||||
|---|---|---|---|---|---|---|
| Category | 2016 | 2017 | 2018 | 2020 | 2022 | 2024 |
| 0–0.1 | 0.0 | 38.5 | 0.8 | 0.0 | 0.0 | 0.0 |
| 0.1–0.2 | 0.0 | 27.0 | 8.0 | 0.1 | 0.0 | 0.0 |
| 0.2–0.3 | 0.0 | 11.5 | 32.5 | 13.4 | 1.3 | 1.0 |
| 0.3–0.4 | 0.0 | 7.2 | 42.9 | 71.3 | 49.9 | 39.9 |
| 0.4–0.5 | 41.8 | 9.4 | 14.2 | 14.3 | 46.3 | 43.8 |
| 0.5–0.6 | 56.0 | 6.1 | 1.7 | 1.0 | 2.6 | 13.8 |
| 0.6–1 | 2.1 | 0.4 | 0.0 | 0.0 | 0.0 | 1.5 |
| Daxigou-EVI | ||||||
| Category | 2016 | 2017 | 2018 | 2020 | 2022 | 2024 |
| 0–0.1 | 0.0 | 52.2 | 2.5 | 0.0 | 0.0 | 0.0 |
| 0.1–0.2 | 0.0 | 19.2 | 15.9 | 0.9 | 0.0 | 0.0 |
| 0.2–0.3 | 0.0 | 8.4 | 38.5 | 37.4 | 5.0 | 0.8 |
| 0.3–0.4 | 1.9 | 5.7 | 30.8 | 49.9 | 57.2 | 30.0 |
| 0.4–0.5 | 44.9 | 6.7 | 9.9 | 10.3 | 33.6 | 38.5 |
| 0.5–0.6 | 38.7 | 5.3 | 1.9 | 1.4 | 3.9 | 24.3 |
| 0.6–1 | 14.5 | 2.6 | 0.5 | 0.1 | 0.2 | 6.4 |
| Daxigou-MSI | ||||||
| Category | 2016 | 2017 | 2018 | 2020 | 2022 | 2024 |
| 0.4–0.6 | 27.8 | 1.3 | 0.0 | 0.0 | 0.1 | 1.7 |
| 0.6–0.8 | 72.1 | 13.4 | 4.0 | 7.5 | 13.9 | 24.4 |
| 0.8–1 | 0.1 | 11.5 | 24.8 | 40.0 | 66.5 | 53.5 |
| 1–1.2 | 0.0 | 16.5 | 40.6 | 51.2 | 19.5 | 20.3 |
| 1.2–1.4 | 0.0 | 24.9 | 23.3 | 1.3 | 0.0 | 0.0 |
| 1.4–1.6 | 0.0 | 28.3 | 5.8 | 0.0 | 0.0 | 0.0 |
| 1.6–1.8 | 0.0 | 4.0 | 1.6 | 0.0 | 0.0 | 0.0 |
| 1.8–2 | 0.0 | 0.0 | 0.0 | 0.0 | 0.0 | 0.0 |
| 2–2.2 | 0.0 | 0.0 | 0.0 | 0.0 | 0.0 | 0.0 |
| Daxigou-NBR | ||||||
| Category | 2016 | 2017 | 2018 | 2020 | 2022 | 2024 |
| −0.4-−0.2 | 0.0 | 24.1 | 1.3 | 0.0 | 0.0 | 0.0 |
| −0.2–0 | 0.0 | 35.2 | 24.5 | 0.5 | 0.0 | 0.0 |
| 0–0.2 | 0.0 | 21.5 | 59.3 | 71.9 | 25.8 | 31.2 |
| 0.2–0.4 | 41.1 | 17.6 | 14.9 | 27.5 | 73.9 | 64.6 |
| 0.4–0.6 | 58.9 | 1.6 | 0.1 | 0.1 | 0.3 | 4.2 |
| Yalihe-NDVI | ||||||
| Category | 2019 | 2020 | 2021 | 2022 | 2023 | 2024 |
| 0–0.1 | 0.0 | 39.6 | 0.0 | 0.0 | 0.0 | 0.0 |
| 0.1–0.2 | 0.0 | 34.7 | 13.0 | 0.2 | 0.0 | 0.0 |
| 0.2–0.3 | 0.0 | 15.4 | 53.7 | 27.5 | 0.5 | 0.1 |
| 0.3–0.4 | 0.0 | 7.3 | 29.6 | 67.2 | 60.1 | 52.2 |
| 0.4–0.5 | 97.1 | 2.9 | 3.6 | 5.0 | 37.9 | 46.2 |
| 0.5–0.6 | 2.9 | 0.1 | 0.2 | 0.0 | 1.5 | 1.5 |
| 0.6–1 | 0.0 | 0.0 | 0.0 | 0.0 | 0.0 | 0.0 |
| Yalihe-EVI | ||||||
| Category | 2019 | 2020 | 2021 | 2022 | 2023 | 2024 |
| 0–0.1 | 0.0 | 60.3 | 0.0 | 0.0 | 0.0 | 0.0 |
| 0.1–0.2 | 0.0 | 21.0 | 30.2 | 1.5 | 0.0 | 0.0 |
| 0.2–0.3 | 0.0 | 10.7 | 46.1 | 36.3 | 0.8 | 0.9 |
| 0.3–0.4 | 3.5 | 5.8 | 19.1 | 55.4 | 44.8 | 47.4 |
| 0.4–0.5 | 92.4 | 2.0 | 4.1 | 6.6 | 48.2 | 47.2 |
| 0.5–0.6 | 3.9 | 0.2 | 0.4 | 0.3 | 5.7 | 3.9 |
| 0.6–1 | 0.2 | 0.0 | 0.0 | 0.0 | 0.5 | 0.5 |
| Yalihe-MSI | ||||||
| Category | 2019 | 2020 | 2021 | 2022 | 2023 | 2024 |
| 0.4–0.6 | 0.2 | 0.0 | 0.0 | 0.0 | 0.0 | 0.0 |
| 0.6–0.8 | 99.3 | 4.0 | 2.9 | 2.0 | 9.2 | 15.5 |
| 0.8–1 | 0.5 | 13.4 | 22.4 | 32.5 | 59.9 | 71.8 |
| 1–1.2 | 0.0 | 15.0 | 44.1 | 55.2 | 30.9 | 12.7 |
| 1.2–1.4 | 0.0 | 31.4 | 29.1 | 10.3 | 0.1 | 0.0 |
| 1.4–1.6 | 0.0 | 35.6 | 1.5 | 0.0 | 0.0 | 0.0 |
| 1.6–1.8 | 0.0 | 0.5 | 0.0 | 0.0 | 0.0 | 0.0 |
| 1.8–2 | 0.0 | 0.0 | 0.0 | 0.0 | 0.0 | 0.0 |
| 2–2.2 | 0.0 | 0.0 | 0.0 | 0.0 | 0.0 | 0.0 |
| Yalihe-NBR | ||||||
| Category | 2019 | 2020 | 2021 | 2022 | 2023 | 2024 |
| −0.4−0.2 | 0.0 | 10.2 | 0.0 | 0.0 | 0.0 | 0.0 |
| −0.2–0 | 0.0 | 59.9 | 20.4 | 1.9 | 0.0 | 0.0 |
| 0–0.2 | 99.1 | 24.4 | 65.1 | 79.9 | 54.9 | 31.5 |
| 0.2–0.4 | 0.9 | 5.6 | 14.5 | 18.2 | 45.1 | 68.2 |
| 0.4–0.6 | 0.0 | 0.0 | 0.0 | 0.0 | 0.0 | 0.3 |
References
- Asner, G.P.; Alencar, A. Drought impacts on the Amazon forest: The remote sensing perspective. New Phytol. 2010, 187, 569–578. [Google Scholar] [CrossRef]
- Loydi, A.; Funk, F.A.; García, A. Vegetation recovery after fire in mountain grasslands of Argentina. J. Mt. Sci.-Engl. 2020, 17, 373–383. [Google Scholar] [CrossRef]
- Bowman, D.M.; Balch, J.K.; Artaxo, P.; Bond, W.J.; Carlson, J.M.; Cochrane, M.A.; D’Antonio, C.M.; DeFries, R.S.; Doyle, J.C.; Harrison, S.P. Fire in the earth system. Science 2009, 324, 481–484. [Google Scholar] [CrossRef]
- Lasslop, G.; Coppola, A.I.; Voulgarakis, A.; Yue, C.; Veraverbeke, S. Influence of Fire on the Carbon Cycle and Climate. Curr. Clim. Chang. Rep. 2019, 5, 112–123. [Google Scholar] [CrossRef]
- Bullock, E.L.; Woodcock, C.E.; Souza, C., Jr.; Olofsson, P. Satellite-based estimates reveal widespread forest degradation in the Amazon. Glob. Chang. Biol. 2020, 26, 2956–2969. [Google Scholar] [CrossRef] [PubMed]
- Lasslop, G.; Hantson, S.; Harrison, S.P.; Bachelet, D.; Burton, C.; Forkel, M.; Forrest, M.; Li, F.; Melton, J.R.; Yue, C. Global ecosystems and fire: Multi-model assessment of fire-induced tree-cover and carbon storage reduction. Glob. Chang. Biol. 2020, 26, 5027–5041. [Google Scholar] [CrossRef] [PubMed]
- Chuvieco, E.; Aguado, I.; Salas, J.; García, M.; Yebra, M.; Oliva, P. Satellite Remote Sensing Contributions to Wildland Fire Science and Management. Curr. For. Rep. 2020, 6, 81–96. [Google Scholar] [CrossRef]
- Srivastava, S.; Kumar, A.S. Implications of intense biomass burning over Uttarakhand in April–May 2016. Nat. Hazards 2020, 101, 367–383. [Google Scholar] [CrossRef]
- Picotte, J.J.; Cansler, C.A.; Kolden, C.A.; Lutz, J.A.; Robertson, K.M. Determination of burn severity models ranging from regional to national scales for the conterminous United States. Remote Sens Environ. 2021, 263, 112569. [Google Scholar] [CrossRef]
- IPCC. Climate Change 2021: The Physical Science Basis. Contribution of Working Group I to the Sixth Assessment Report of the Intergovernmental Panel on Climate Change; Masson-Delmotte, V.P., Zhai, A., Pirani, S.L., Connors, C., Péan, S., Berger, N., Caud, Y., Chen, M., Goldfarb, M.I., Gomis, M., et al., Eds.; Cambridge University Press: Cambridge, UK, 2021. [Google Scholar]
- Oseghae, I.; Bhaganagar, K.; Mestas-Nuñez, A.M. The Dolan Fire of Central Coastal California: Burn Severity Estimates from Remote Sensing and Associations with Environmental Factors. Remote Sens. 2024, 16, 1693. [Google Scholar] [CrossRef]
- Marjani, M.; Mahdianpari, M.; Mohammadimanesh, F. CNN-BiLSTM: A Novel Deep Learning Model for Near-Real-Time Daily Wildfire Spread Prediction. Remote Sens. 2024, 16, 1467. [Google Scholar] [CrossRef]
- Chen, X.; Chen, W.; Xu, M. Remote-Sensing Monitoring of Postfire Vegetation Dynamics in the Greater Hinggan Mountain Range Based on Long Time-Series Data: Analysis of the Effects of Six Topographic and Climatic Factors. Remote Sens. 2022, 14, 2958. [Google Scholar] [CrossRef]
- Giorgis, M.A.; Zeballos, S.R.; Carbone, L.; Zimmermann, H.; von Wehrden, H.; Aguilar, R.; Ferreras, A.E.; Tecco, P.A.; Kowaljow, E.; Barri, F. A review of fire effects across South American ecosystems: The role of climate and time since fire. Fire Ecol. 2021, 17, 1–20. [Google Scholar]
- Zhao, G.; Xu, E.; Yi, X.; Guo, Y.; Zhang, K. Comparison of forest restorations with different burning severities using various restoration methods at Tuqiang forestry bureau of greater hinggan mountains. Remote Sens. 2023, 15, 2683. [Google Scholar] [CrossRef]
- Ma, W.; Feng, Z.; Cheng, Z.; Chen, S.; Wang, F. Identifying Forest Fire Driving Factors and Related Impacts in China Using Random Forest Algorithm. Forests. 2020, 11, 507. [Google Scholar] [CrossRef]
- Zhang, J.H.; Yao, F.M.; Liu, C.; Yang, L.M.; Boken, V.K. Detection, emission estimation and risk prediction of forest fires in China using satellite sensors and simulation models in the past three decades—An overview. Int. J. Environ. Res. Public Health. 2011, 8, 3156–3178. [Google Scholar] [CrossRef] [PubMed]
- Wu, Z.; He, H.S.; Keane, R.E.; Zhu, Z.; Wang, Y.; Shan, Y. Current and future patterns of forest fire occurrence in China. Int. J. Wildland Fire 2020, 29, 104–119. [Google Scholar] [CrossRef]
- Yan, X.; Qiu, D.; Yu, H.; Cong, R.; Nan, F.; Gong, X.; Miao, Q. Study on Growth Characteristics and Morphological Changes during Cone and Seed Development of Pinus pumila. J. Temp. For. Res. 2022, 5, 53–59. [Google Scholar]
- Li, W.; Shu, L.; Wang, M.; Li, W.; Si, L.; Zhao, F.; Li, X.; Zhou, N. Occurrence Pattern and Changing Trend of Lightning Induced Fires and Human-caused Fires in Daxing’anling Forest Region of Heilongjiang Province. Sci. Silvae Sin. 2024, 60, 136–146. [Google Scholar]
- Loveland, T.R.; Merchant, J.W.; Ohlen, D.O.; Brown, J.F. Development of a land-cover characteristics database for the conterminous U.S. Photogramm. Eng. Remote Sens. 1991, 57, 1453–1463. [Google Scholar]
- Li, L.; Shen, R.; Li, X.; Guo, J. Comparison of Forest Disturbance Indices based on MODIS Time-Series Data. Remote Sens. Technol. Appl. 2016, 31, 1083–1090. [Google Scholar]
- Li, R.R.; Kaufman, Y.J.; Wei, M.H.; Salmon, J.M.; Gao, B.C. A technique for detecting burn scars using MODIS data. IEEE Trans. Geosci. Remote Sens. 2004, 42, 1300–1308. [Google Scholar]
- Wu, L.; Shen, R.; Li, X.; Yang, H. Evaluating Different Remote Sensing Indexes for Forest Burn Scars Extraction. Remote Sens. Technol. Appl. 2014, 29, 567–574. [Google Scholar]
- Röder, A.; Joachim, H.; Beatriz, D.; Antonio, A.J.; Ramon, V. Using long time series of Landsat data to monitor fire events and post-fire dynamics and identify driving factors. A case study in the Ayora region (eastern Spain). Remote Sens. Environ. 2008, 112, 259–273. [Google Scholar] [CrossRef]
- Yang, C.; Shen, R.; Yu, D.; Liu, R.; Chen, J. Forest disturbance monitoring based on the time-series trajectory of remote sensing index. J. Remote Sens. 2013, 17, 1246–1263. [Google Scholar]
- Bannari, A.; Morin, D.; Bonn, F.; Huete, A.R. A review of vegetation indices. Remote Sens. 1995, 13, 95–120. [Google Scholar] [CrossRef]
- Meng, R.; Denninson, P.E.; Huang, C.; Moritz, M.A.; D’Antonio, C. Effects of fire severity and post-fire climate on short term vegetation recovery of mixed-conifer and red fir forests in the Sierra Nevada Mountains of California. Remote Sens. Environ. 2015, 171, 311–325. [Google Scholar] [CrossRef]
- Szpakowski, D.M.; Jensen, J.L.R. A Review of the Applications of Remote Sensing in Fire Ecology. Remote Sens. 2019, 11, 2638. [Google Scholar] [CrossRef]
- Salih, A.A.M.; Ganawa, E.T.; Elmahl, A.A. Spectral mixture analysis (SMA) and change vector analysis (CVA) methods for monitoring and mapping land degradation/desertification in arid and semiarid areas (Sudan), using Landsat imagery. Egypt. J. Remote Sens. Space Sci. 2017, 20, 21–29. [Google Scholar] [CrossRef]
- Corona, P.; Lamonaca, A.; Chirici, G. Remote sensing support for post fire forest management. Iforest—Biogeosci. For. 2008, 1, 6–12. [Google Scholar] [CrossRef]
- Corona, P.; Saracino, A.; Leone, V. Plot size and shape for the early assessment of post-fire regeneration in Aleppo pine stands. New For. 1998, 16, 213–220. [Google Scholar] [CrossRef]
- Sellers, P.J.; Berry, J.A.; Collatz, G.J.; Field, C.B.; Hall, F.G. Canopy reflectance, photosynthesis, and transpiration. III. A reanalysis using improved leaf models and a new canopy integration scheme. Remote Sens. Environ. 1992, 42, 187–216. [Google Scholar] [CrossRef]
- Jin, S.; Sader, S.A. MODIS time-series imagery for forest disturbance detection and quantification of patch size effects. Remote Sens. Environ. 2005, 99, 462–470. [Google Scholar] [CrossRef]
- Huete, A.R. A soil-adjusted vegetation index (SAVI). Remote Sens. Environ. 1988, 25, 295–309. [Google Scholar] [CrossRef]
- Turner, D.P.; Cohen, W.B.; Kennedy, R.E.; Fassnacht, K.S.; Briggs, J.M. Relationships between Leaf Area Index and Landsat TM Spectral Vegetation Indices across Three Temperate Zone Sites. Remote Sens. Environ. 1999, 70, 52–68. [Google Scholar] [CrossRef]
- Du, J.; Shu, J.; Yin, J. Analysis on spatio-temporal trends and drivers in vegetation growth during recent decades in Xinjiang, China. Int. J. Appl. Earth Obs. Geoinf. 2015, 38, 216–228. [Google Scholar] [CrossRef]
- Rock, B.N.; Vogelmann, J.E.; Williams, D.L.; Vogehnann, A.F.; Hoshizaki, T. Remote detection of forest damage. Bioscience 1986, 36, 439–445. [Google Scholar] [CrossRef]
- Lopez Garcia, M.J.; Caselles, V. Mapping burns and natural reforestation using Thematic Mapper data. Geocarto Int. 1991, 6, 31–37. [Google Scholar] [CrossRef]
- Diaz-Delgado, R.; Lloret, F.; Pons, X. Influence of fire severity on plant regeneration by means of remote sensing. Int. J. Remote Sens. 2003, 24, 1751–1763. [Google Scholar] [CrossRef]
- French, N.H.F.; Kasischke, E.S.; Hall, R.J.; Murphy, K.A.; Verbyla, D.L.; Hoy, E.E.; Allen, J.L. Using Landsat Data to Assess Fire and Burn Severity in the North American Boreal Forest Region: An Overview and Summary of Results. Int. J. Wildland Fire 2008, 17, 443–462. [Google Scholar] [CrossRef]
- Du, Q.; Wang, Y.; Wan, Z.; Zhao, C.; Liu, X.; Liang, S. The spatial distribution characteristics of soil carbon in typical frozen soil areas based on RF model. For. Eng. 2024, 10, 1–11. [Google Scholar]
- Wang, C.; Gower, S.T.; Wang, Y.; Zhao, H.; Yan, P.; Lamberty, B.P. The influence of fire on carbon distribution and net primary production of boreal larix gmelinii forests in north-eastern China. Glob. Chang. Biol. 2001, 7, 719–730. [Google Scholar] [CrossRef]
- Fang, L.; Yang, J. Atmospheric effects on the performance and threshold extrapolation of multi-temporal landsat derived dNBR for burn severity assessment. Int. J. Appl. Earth Obs. Geoinf. 2014, 33, 10–20. [Google Scholar] [CrossRef]
- Lin, S.; Zhang, H.; Liu, S.; Gao, G.; Li, L.; Huang, H. Characterizing Post-Fire Forest Structure Recovery in the Great Xing’an Mountain Using GEDI and Time Series Landsat Data. Remote Sens. 2023, 15, 3107. [Google Scholar] [CrossRef]
- Ministry of Emergency Management of the People’s Republic of China. Available online: https://www.mem.gov.cn/gk/tjsj/ (accessed on 23 January 2025).
- European Space Agency. European Union Copernicus Open Access Hub. Available online: https://dataspace.copernicus.eu/ (accessed on 19 October 2024).
- Chen, X.; Vogelmann, J.E.; Rollins, M.; Ohlen, D.; Key, C.H.; Yang, L. Detecting post-fire burn severity and vegetation recovery using multitemporal remote sensing spectral indices and field-collected composite burn index data in a ponderosa pine forest. Int. J. Remote Sens. 2011, 32, 7905–7927. [Google Scholar] [CrossRef]
- Brown, M.E.; Lary, D.J.; Vrieling, A.; Stathakis, D.; Mussa, H. Neural networks as a tool for constructing continuous NDVI time series from AVHRR and MODIS. Int. J. Remote Sens. 2008, 29, 7141–7158. [Google Scholar] [CrossRef]
- Lasaponara, R. On the use of principal component analysis (PCA) for evaluating interannual vegetation anomalies from Spot/Vegetation NDVI temporal series. Ecol. Model. 2006, 194, 429–434. [Google Scholar] [CrossRef]
- Wang, X.H.; Piao, S.L.; Ciais, P.; Li, J.S.; Friedlingstein, P.; Koven, C.; Chen, A.P. Spring temperature change and its implication in the change of vegetation growth in North America from 1982 to 2006. Proc. Natl. Acad. Sci. USA 2011, 108, 1240–1245. [Google Scholar] [CrossRef]
- Roodsarabi1, Z.; Sam-Khaniani, A.; Kiani, A. Investigation of post fire vegetation regrowth under different burn severities based on satellite observations. Int. J. Environ. Sci. Technol. 2023, 20, 321–340. [Google Scholar] [CrossRef]
- Wagtendonk, J.W.V.; Root, R.R.; Key, C.H. Comparison of AVIRIS and Landsat ETM+ detection capabilities for burn severity. Remote Sens Environ. 2004, 92, 397–408. [Google Scholar] [CrossRef]
- Miller, J.D.; Yool, S.R. Mapping forest post-fire canopy consumption in several overstory types using multi-temporal Landsat TM and ETM data. Remote Sens Environ. 2002, 82, 481–496. [Google Scholar] [CrossRef]
- Keeley, J.E. Fire intensity, fire severity and burn severity: A brief review and suggested usage. Int. J. Wildland Fire 2009, 18, 116–126. [Google Scholar] [CrossRef]
- Konkathi, P.; Shetty, A. Inter comparison of post-fire burn severity indices of Landsat-8 and Sentinel-2 imagery using Google Earth Engine. Earth Sci. Inform. 2021, 14, 645–653. [Google Scholar] [CrossRef]
- Fernández-García, V.; Quintano, C.; Taboada, A.; Marcos, E.; Calvo, L.; Fernández-Manso, A. Remote sensing applied to the study of fire regime attributes and their influence on post-fire greenness recovery in pine ecosystems. Remote Sens. 2018, 10, 733. [Google Scholar] [CrossRef]
- Hao, B.; Xu, X.; Wu, F.; Tan, L. Long-term effects of fire severity and climatic factors on post-forest-fire vegetation recovery. Forests 2022, 13, 883. [Google Scholar] [CrossRef]
- Field, A. Discovering Statistics Using IBM SPSS Statistics; SAGE Publications: Southend Oaks, CA, USA, 2013. [Google Scholar]
- Caccamo, G.; Bradstock, R.; Collins, L. Using MODIS data to analyse post-fire vegetation recovery in Australian eucalypt forests. J. Spat. Sci. 2014, 60, 341–352. [Google Scholar] [CrossRef]
- Chen, X.; Liu, Y.Y.; Evans, J.P.; Parinussa, R.M.; van Dijk, A.I.J.M.; Yebra, M. Estimating fire severity and carbon emaissions over Australian tropical savannahs based on passive microwave satellite observations. Int. J. Remote Sens. 2018, 39, 6479–6498. [Google Scholar] [CrossRef]
- Fang, L.; Yang, J.; White, M.; Liu, Z. Predicting Potential Fire Severity Using Vegetation, Topography and Surface Moisture Availability in a Eurasian Boreal Forest Landscape. Forests. 2018, 9, 130. [Google Scholar] [CrossRef]
- Reilly, M.J.; Zuspan, A.; Yang, Z. Characterizing post-fire delayed tree mortality with remote sensing: Sizing up the elephant in the room. Fire Ecol. 2023, 19, 64. [Google Scholar] [CrossRef]
- Wilson, A.M.; Latimer, A.M.; Silander, J.A. Climatic controls on ecosystem resilience: Postfire regeneration in the Cape Floristic Region of South Africa. Proc. Natl. Acad. Sci. USA 2015, 112, 9058–9063. [Google Scholar] [CrossRef] [PubMed]
- Yan, M.; Li, Z.Y.; Chen, E.X.; Tian, X.; Gu, C.Y.; Li, C.M.; Fan, W.W. Change of vegetation coverage in Genhe forest reserve, Daxing’an Mountains, Inner Mongolia. J. Ecol. 2016, 35, 508–515. [Google Scholar]
- Huete, A.; Didan, K.; Miura, T.; Rodriguez, E.P.; Gao, X.; Ferreira, L.G. Overview of the radiometric and biophysical performance of the MODIS vegetation indices. Remote Sens Environ. 2002, 83, 195–213. [Google Scholar] [CrossRef]
- Matsushita, B.; Yang, W.; Chen, J.; Onda, Y.; Qiu, G. Sensitivity of the enhanced vegetation index (EVI) and normalized difference vegetation index (NDVI) to topographic effects: A case study in high-density cypress forest. Sensors 2007, 7, 2636–2651. [Google Scholar] [CrossRef]
- Gao, X.; Huete, A.R.; Ni, W.; Miura, T. Optical–biophysical relationships of vegetation spectra without background contamination. Remote Sens Environ. 2000, 74, 609–620. [Google Scholar] [CrossRef]
- Chen, X.; Vierling, L.; Deering, D.; Conley, A. Monitoring boreal forest leaf area index across a Siberian burn chronosequence: A MODIS validation study. Int. J. Remote Sens. 2005, 26, 5433–5451. [Google Scholar] [CrossRef]
- Casady, G.M.; van Leeuwen, W.J.; Marsh, S.E. Evaluating post-wildfire vegetation regeneration as a response to multiple environmental determinants. Environ. Model. Assess. 2010, 15, 295–307. [Google Scholar] [CrossRef]
- Mildrexler, D.J.; Zhao, M.; Running, S.W. Testing a MODIS global disturbance index across North America. Remote Sens Environ. 2009, 113, 2103–2117. [Google Scholar] [CrossRef]
- Acosta, F.C.; Rengifo, S.P.; Garcia, M.L.; Matricardi, E.; Castillo, G.V.B. Road Network Planning in Tropical Forests Using GIS. Croat. J. For. Eng. 2022, 43, 305–320. [Google Scholar] [CrossRef]

| Location | Coordinates | Time | Burning Area (hm2) | Main Vegetation Types |
|---|---|---|---|---|
| Daxigou | 52°0′51″ N–123°23′25″ E | 23–24 June 2017 | 212.4 | Siberian dwarf pine 80%, Dahurian larch 15%, and Scotch pine 5% |
| Yalihe | 51°17′48″ N–123°33′07″ E | 15 July 2020 | 12.96 | Siberian dwarf pine 80% and Dahurian larch 20% |
| Index | Abbreviation | Formula |
|---|---|---|
| Normalized Difference Vegetation Index | NDVI | |
| Enhanced Vegetation Index | EVI | |
| Moisture Stress Index | MSI | |
| Normalized Burn Ratio | NBR | |
| Differenced Normalized Burn Ratio | dNBR |
| Fire Severity | Aspect | 2017 | 2018 | 2020 | 2022 | 2024 | Period1 | Period2 | Period3 | Period4 |
|---|---|---|---|---|---|---|---|---|---|---|
| Recovery of NDVI in Daxigou (%) | Change (%) | |||||||||
| High Severity | N | 6 | 12 | 32 | 42 | 47 | 6 | 20 | 10 | 5 |
| NE | 4 | 11 | 27 | 35 | 38 | 7 | 16 | 8 | 3 | |
| E | 5 | 16 | 35 | 46 | 50 | 11 | 19 | 11 | 4 | |
| SE | 5 | 34 | 34 | 40 | 41 | 29 | 0 | 6 | 1 | |
| S | 5 | 40 | 40 | 47 | 49 | 35 | 0 | 7 | 2 | |
| SW | 3 | 10 | 15 | 20 | 21 | 7 | 5 | 5 | 1 | |
| W | 2 | 5 | 12 | 16 | 17 | 3 | 7 | 4 | 1 | |
| NW | 3 | 6 | 17 | 21 | 23 | 3 | 11 | 4 | 2 | |
| Moderate Severity | N | 28 | 36 | 49 | 56 | 63 | 8 | 13 | 7 | 7 |
| NE | 27 | 32 | 47 | 56 | 63 | 5 | 15 | 9 | 7 | |
| E | 25 | 36 | 41 | 49 | 51 | 11 | 5 | 8 | 2 | |
| SE | 22 | 54 | 61 | 71 | 73 | 32 | 7 | 10 | 2 | |
| S | 21 | 53 | 59 | 69 | 71 | 32 | 6 | 10 | 2 | |
| SW | 24 | 45 | 54 | 64 | 68 | 21 | 9 | 10 | 4 | |
| W | 20 | 39 | 51 | 63 | 68 | 19 | 12 | 12 | 5 | |
| NW | 28 | 38 | 64 | 73 | 80 | 10 | 26 | 9 | 7 | |
| Low Severity | N | 46 | 42 | 44 | 48 | 55 | −4 | 2 | 4 | 7 |
| NE | 38 | 35 | 35 | 39 | 44 | −3 | 0 | 4 | 5 | |
| E | 34 | 34 | 35 | 39 | 43 | 0 | 1 | 4 | 4 | |
| SE | 26 | 26 | 28 | 31 | 34 | 0 | 2 | 3 | 3 | |
| S | 33 | 33 | 35 | 39 | 42 | 0 | 2 | 4 | 3 | |
| SW | 37 | 35 | 37 | 42 | 46 | −2 | 2 | 5 | 4 | |
| W | 45 | 38 | 38 | 43 | 48 | −7 | 0 | 5 | 5 | |
| NW | 44 | 34 | 38 | 45 | 49 | −10 | 4 | 7 | 4 | |
| Recovery of EVI in Daxigou (%) | Change (%) | |||||||||
| High Severity | N | 4 | 9 | 27 | 39 | 47 | 5 | 18 | 12 | 8 |
| NE | 3 | 8 | 23 | 32 | 39 | 5 | 15 | 9 | 7 | |
| E | 4 | 12 | 31 | 44 | 51 | 8 | 19 | 13 | 7 | |
| SE | 3 | 31 | 32 | 40 | 44 | 28 | 1 | 8 | 4 | |
| S | 4 | 37 | 37 | 46 | 53 | 33 | 0 | 9 | 7 | |
| SW | 2 | 9 | 14 | 19 | 23 | 7 | 5 | 5 | 4 | |
| W | 1 | 4 | 11 | 15 | 18 | 3 | 7 | 4 | 3 | |
| NW | 2 | 5 | 15 | 21 | 24 | 3 | 10 | 6 | 3 | |
| Moderate Severity | N | 22 | 30 | 45 | 52 | 65 | 8 | 15 | 7 | 13 |
| NE | 21 | 26 | 42 | 52 | 65 | 5 | 16 | 10 | 13 | |
| E | 20 | 32 | 38 | 48 | 53 | 12 | 6 | 10 | 5 | |
| SE | 17 | 48 | 57 | 70 | 78 | 31 | 9 | 13 | 8 | |
| S | 16 | 48 | 55 | 68 | 77 | 32 | 7 | 13 | 9 | |
| SW | 19 | 40 | 50 | 63 | 72 | 21 | 10 | 13 | 9 | |
| W | 16 | 34 | 47 | 61 | 72 | 18 | 13 | 14 | 11 | |
| NW | 21 | 31 | 59 | 68 | 83 | 10 | 28 | 9 | 15 | |
| Low Severity | N | 43 | 38 | 39 | 44 | 57 | −5 | 1 | 5 | 13 |
| NE | 35 | 32 | 31 | 36 | 45 | −3 | −1 | 5 | 9 | |
| E | 31 | 31 | 32 | 36 | 45 | 0 | 1 | 4 | 9 | |
| SE | 24 | 24 | 26 | 30 | 36 | 0 | 2 | 4 | 6 | |
| S | 30 | 31 | 32 | 37 | 44 | 1 | 1 | 5 | 7 | |
| SW | 34 | 31 | 33 | 39 | 48 | −3 | 2 | 6 | 9 | |
| W | 43 | 34 | 34 | 40 | 50 | −9 | 0 | 6 | 10 | |
| NW | 42 | 31 | 35 | 42 | 52 | −11 | 4 | 7 | 10 | |
| Fire Severity | Aspect | 2020 | 2021 | 2022 | 2023 | 2024 | Period1 | Period2 | Period3 | Period4 |
| Recovery of NDVI in Yalihe (%) | Change (%) | |||||||||
| High Severity | N | 7 | 20 | 30 | 35 | 36 | 13 | 10 | 5 | 1 |
| Moderate Severity | N | 20 | 47 | 58 | 71 | 72 | 27 | 11 | 13 | 1 |
| NE | 20 | 46 | 57 | 68 | 68 | 26 | 11 | 11 | 0 | |
| E | 23 | 46 | 53 | 64 | 63 | 23 | 7 | 11 | −1 | |
| W | 6 | 14 | 18 | 20 | 20 | 8 | 4 | 2 | 0 | |
| NW | 16 | 47 | 62 | 76 | 77 | 31 | 15 | 14 | 1 | |
| Low Severity | N | 28 | 27 | 34 | 40 | 41 | −1 | 7 | 6 | 1 |
| NE | 22 | 26 | 28 | 34 | 34 | 4 | 2 | 6 | 0 | |
| E | 54 | 57 | 60 | 67 | 67 | 3 | 3 | 7 | 0 | |
| W | 34 | 40 | 44 | 51 | 51 | 6 | 4 | 7 | 0 | |
| NW | 45 | 47 | 51 | 59 | 59 | 2 | 4 | 8 | 0 | |
| Recovery of EVI in Yalihe (%) | Change (%) | |||||||||
| High Severity | N | 4 | 16 | 28 | 35 | 34 | 12 | 12 | 7 | −1 |
| Moderate Severity | N | 14 | 40 | 54 | 71 | 70 | 26 | 14 | 17 | −1 |
| NE | 14 | 39 | 54 | 69 | 66 | 25 | 15 | 15 | −3 | |
| E | 17 | 41 | 50 | 65 | 62 | 24 | 9 | 15 | −3 | |
| W | 4 | 11 | 17 | 20 | 19 | 7 | 6 | 3 | −1 | |
| NW | 11 | 39 | 57 | 76 | 75 | 28 | 18 | 19 | −1 | |
| Low Severity | N | 24 | 26 | 33 | 42 | 41 | 2 | 7 | 9 | −1 |
| NE | 19 | 25 | 28 | 35 | 35 | 6 | 3 | 7 | 0 | |
| E | 50 | 55 | 62 | 72 | 67 | 5 | 7 | 10 | −5 | |
| W | 28 | 37 | 42 | 53 | 50 | 9 | 5 | 11 | −3 | |
| NW | 40 | 46 | 50 | 62 | 59 | 6 | 4 | 12 | −3 | |
| Fire Severity | Aspect | 2017 | 2018 | 2020 | 2022 | 2024 | Period1 | Period2 | Period3 | Period4 |
|---|---|---|---|---|---|---|---|---|---|---|
| Recovery of NDVI in Daxigou (%) | Change (%) | |||||||||
| High Severity | 2–6° | 3 | 10 | 18 | 24 | 25 | 7 | 8 | 6 | 1 |
| 6–15° | 5 | 38 | 38 | 45 | 46 | 33 | 0 | 7 | 1 | |
| 15–25° | 5 | 37 | 36 | 43 | 44 | 32 | −1 | 7 | 1 | |
| ≥25° | 4 | 30 | 31 | 36 | 37 | 26 | 1 | 5 | 1 | |
| Moderate Severity | ≤2° | 22 | 25 | 42 | 54 | 59 | 3 | 17 | 12 | 5 |
| 2–6° | 25 | 39 | 47 | 57 | 59 | 14 | 8 | 10 | 2 | |
| 6–15° | 23 | 50 | 59 | 69 | 71 | 27 | 9 | 10 | 2 | |
| 15–25° | 23 | 50 | 58 | 67 | 71 | 27 | 8 | 9 | 4 | |
| ≥25° | 25 | 44 | 53 | 61 | 66 | 19 | 9 | 8 | 5 | |
| Low Severity | ≤2° | 50 | 47 | 46 | 51 | 61 | −3 | −1 | 5 | 10 |
| 2–6° | 32 | 31 | 31 | 35 | 39 | −1 | 0 | 4 | 4 | |
| 6–15° | 36 | 34 | 36 | 41 | 46 | −2 | 2 | 5 | 5 | |
| 15–25° | 39 | 36 | 37 | 41 | 46 | −3 | 1 | 4 | 5 | |
| ≥25° | 52 | 48 | 49 | 54 | 61 | −4 | 1 | 5 | 7 | |
| Recovery of EVI in Daxigou (%) | Change (%) | |||||||||
| High Severity | 2–6° | 2 | 8 | 17 | 23 | 27 | 6 | 9 | 6 | 4 |
| 6–15° | 3 | 35 | 36 | 44 | 49 | 32 | 1 | 8 | 5 | |
| 15–25° | 3 | 34 | 34 | 42 | 48 | 31 | 0 | 8 | 6 | |
| ≥25° | 3 | 28 | 29 | 35 | 41 | 25 | 1 | 6 | 6 | |
| Moderate Severity | ≤2° | 17 | 20 | 37 | 50 | 61 | 3 | 17 | 13 | 11 |
| 2–6° | 20 | 34 | 43 | 55 | 61 | 14 | 9 | 12 | 6 | |
| 6–15° | 18 | 44 | 55 | 67 | 76 | 26 | 11 | 12 | 9 | |
| 15–25° | 18 | 45 | 54 | 65 | 77 | 27 | 9 | 11 | 12 | |
| ≥25° | 19 | 39 | 50 | 59 | 71 | 20 | 11 | 9 | 12 | |
| Low Severity | ≤2° | 46 | 42 | 41 | 45 | 61 | −4 | −1 | 4 | 16 |
| 2–6° | 29 | 28 | 27 | 32 | 40 | −1 | −1 | 5 | 8 | |
| 6–15° | 33 | 31 | 33 | 38 | 48 | −2 | 2 | 5 | 10 | |
| 15–25° | 36 | 33 | 34 | 38 | 48 | −3 | 1 | 4 | 10 | |
| ≥25° | 48 | 43 | 44 | 49 | 63 | −5 | 1 | 5 | 14 | |
| Fire Severity | Aspect | 2020 | 2021 | 2022 | 2023 | 2024 | Period1 | Period2 | Period3 | Period4 |
| Recovery of NDVI in Yalihe (%) | Change (%) | |||||||||
| High Severity | 6–15° | 6 | 18 | 27 | 31 | 32 | 12 | 9 | 4 | 1 |
| Moderate Severity | ≤2° | 26 | 53 | 66 | 79 | 79 | 27 | 13 | 13 | 0 |
| 2–6° | 18 | 32 | 49 | 61 | 63 | 14 | 17 | 12 | 2 | |
| 6–15° | 20 | 46 | 57 | 70 | 71 | 26 | 11 | 13 | 1 | |
| 15–25° | 20 | 48 | 59 | 69 | 69 | 28 | 11 | 10 | 0 | |
| Low Severity | 2–6° | 35 | 38 | 41 | 47 | 46 | 3 | 3 | 6 | −1 |
| 6–15° | 22 | 25 | 27 | 32 | 33 | 3 | 2 | 5 | 1 | |
| 15–25° | 30 | 34 | 37 | 43 | 44 | 4 | 3 | 6 | 1 | |
| ≥25° | 15 | 15 | 16 | 17 | 17 | 0 | 1 | 1 | 0 | |
| Recovery of EVI in Yalihe (%) | Change (%) | |||||||||
| High Severity | 6–15° | 4 | 14 | 25 | 31 | 30 | 10 | 11 | 6 | −1 |
| Moderate Severity | ≤2° | 19 | 45 | 61 | 78 | 75 | 26 | 16 | 17 | −3 |
| 2–6° | 13 | 32 | 45 | 61 | 61 | 19 | 13 | 16 | 0 | |
| 6–15° | 14 | 39 | 53 | 70 | 69 | 25 | 14 | 17 | −1 | |
| 15–25° | 14 | 42 | 55 | 69 | 67 | 28 | 13 | 14 | −2 | |
| Low Severity | 2–6° | 31 | 37 | 40 | 50 | 47 | 6 | 3 | 10 | −3 |
| 6–15° | 19 | 24 | 26 | 34 | 34 | 5 | 2 | 8 | 0 | |
| 15–25° | 26 | 33 | 36 | 45 | 45 | 7 | 3 | 9 | 0 | |
| ≥25° | 15 | 15 | 17 | 18 | 17 | 0 | 2 | 1 | −1 | |
| Fire Severity | Aspect | 2017 | 2018 | 2020 | 2022 | 2024 | Period1 | Period2 | Period3 | Period4 |
|---|---|---|---|---|---|---|---|---|---|---|
| Recovery of NDVI in Daxigou (%) | Change (%) | |||||||||
| High Severity | 750–800 m | 3 | 19 | 23 | 27 | 25 | 16 | 4 | 4 | −2 |
| 800–850 m | 4 | 27 | 29 | 33 | 33 | 23 | 2 | 4 | 0 | |
| 850–900 m | 5 | 37 | 37 | 44 | 45 | 32 | 0 | 7 | 1 | |
| 900–950 m | 5 | 38 | 37 | 43 | 45 | 33 | −1 | 6 | 2 | |
| 950–1000 m | 3 | 20 | 19 | 22 | 22 | 17 | −1 | 3 | 0 | |
| 1000–1050 m | 5 | 13 | 31 | 41 | 44 | 8 | 18 | 10 | 3 | |
| Moderate Severity | 750–800 m | 27 | 42 | 54 | 64 | 62 | 15 | 12 | 10 | −2 |
| 800–850 m | 23 | 51 | 59 | 68 | 69 | 28 | 8 | 9 | 1 | |
| 850–900 m | 22 | 53 | 57 | 67 | 69 | 31 | 4 | 10 | 2 | |
| 900–950 m | 22 | 48 | 54 | 63 | 67 | 26 | 6 | 9 | 4 | |
| 950–1000 m | 23 | 44 | 54 | 63 | 68 | 21 | 10 | 9 | 5 | |
| 1000–1050 m | 17 | 29 | 45 | 56 | 61 | 12 | 16 | 11 | 5 | |
| Low Severity | 750–800 m | 28 | 28 | 28 | 30 | 35 | 0 | 0 | 2 | 5 |
| 800–850 m | 37 | 35 | 36 | 39 | 45 | −2 | 1 | 3 | 6 | |
| 850–900 m | 35 | 33 | 34 | 38 | 42 | −2 | 1 | 4 | 4 | |
| 900–950 m | 40 | 37 | 39 | 45 | 49 | −3 | 2 | 6 | 4 | |
| 950–1000 m | 32 | 30 | 32 | 36 | 40 | −2 | 2 | 4 | 4 | |
| 1000–1050 m | 17 | 17 | 19 | 21 | 22 | 0 | 2 | 2 | 1 | |
| Recovery of EVI in Daxigou (%) | Change (%) | |||||||||
| High Severity | 750–800 m | 2 | 17 | 22 | 27 | 26 | 15 | 5 | 5 | −1 |
| 800–850 m | 2 | 24 | 27 | 33 | 35 | 22 | 3 | 6 | 2 | |
| 850–900 m | 3 | 34 | 35 | 43 | 49 | 31 | 1 | 8 | 6 | |
| 900–950 m | 3 | 35 | 34 | 42 | 49 | 32 | −1 | 8 | 7 | |
| 950–1000 m | 2 | 19 | 17 | 21 | 24 | 17 | −2 | 4 | 3 | |
| 1000–1050 m | 3 | 10 | 28 | 39 | 46 | 7 | 18 | 11 | 7 | |
| Moderate Severity | 750–800 m | 21 | 36 | 51 | 63 | 64 | 15 | 15 | 12 | 1 |
| 800–850 m | 17 | 45 | 55 | 67 | 74 | 28 | 10 | 12 | 7 | |
| 850–900 m | 16 | 47 | 53 | 65 | 75 | 31 | 6 | 12 | 10 | |
| 900–950 m | 17 | 42 | 50 | 62 | 73 | 25 | 8 | 12 | 11 | |
| 950–1000 m | 18 | 39 | 50 | 61 | 72 | 21 | 11 | 11 | 11 | |
| 1000–1050 m | 13 | 25 | 41 | 53 | 65 | 12 | 16 | 12 | 12 | |
| Low Severity | 750–800 m | 26 | 25 | 26 | 28 | 36 | −1 | 1 | 2 | 8 |
| 800–850 m | 34 | 32 | 32 | 34 | 47 | −2 | 0 | 2 | 13 | |
| 850–900 m | 32 | 30 | 31 | 35 | 44 | −2 | 1 | 4 | 9 | |
| 900–950 m | 37 | 33 | 36 | 42 | 51 | −4 | 3 | 6 | 9 | |
| 950–1000 m | 30 | 28 | 29 | 34 | 41 | −2 | 1 | 5 | 7 | |
| 1000–1050 m | 17 | 17 | 18 | 20 | 23 | 0 | 1 | 2 | 3 | |
| Fire Severity | Aspect | 2020 | 2021 | 2022 | 2023 | 2024 | Period1 | Period2 | Period3 | Period4 |
| Recovery of NDVI in Yalihe (%) | Change (%) | |||||||||
| High Severity | 1000–1050 m | 6 | 18 | 27 | 31 | 32 | 12 | 9 | 4 | 1 |
| Moderate Severity | 950–1000 m | 8 | 10 | 11 | 13 | 13 | 2 | 1 | 2 | 0 |
| 1000–1050 m | 20 | 47 | 60 | 71 | 72 | 27 | 13 | 11 | 1 | |
| 1050–1100 m | 20 | 47 | 58 | 71 | 72 | 27 | 11 | 13 | 1 | |
| 1100–1150 m | 17 | 40 | 44 | 56 | 56 | 23 | 4 | 12 | 0 | |
| Low Severity | 950–1000 m | 26 | 28 | 29 | 33 | 34 | 2 | 1 | 4 | 1 |
| 1000–1050 m | 26 | 29 | 32 | 37 | 38 | 3 | 3 | 5 | 1 | |
| 1050–1100 m | 31 | 35 | 38 | 44 | 45 | 4 | 3 | 6 | 1 | |
| 1100–1150 m | 18 | 22 | 22 | 28 | 28 | 4 | 0 | 6 | 0 | |
| Recovery of EVI in Yalihe (%) | Change (%) | |||||||||
| High Severity | 1000–1050 m | 4 | 14 | 25 | 31 | 30 | 10 | 11 | 6 | −1 |
| Moderate Severity | 950–1000 m | 6 | 9 | 11 | 14 | 13 | 3 | 2 | 3 | −1 |
| 1000–1050 m | 14 | 40 | 56 | 70 | 69 | 26 | 16 | 14 | −1 | |
| 1050–1100 m | 14 | 40 | 54 | 71 | 70 | 26 | 14 | 17 | −1 | |
| 1100–1150 m | 12 | 35 | 41 | 58 | 55 | 23 | 6 | 17 | −3 | |
| Low Severity | 950–1000 m | 23 | 28 | 28 | 35 | 35 | 5 | 0 | 7 | 0 |
| 1000–1050 m | 22 | 27 | 31 | 38 | 38 | 5 | 4 | 7 | 0 | |
| 1050–1100 m | 27 | 33 | 37 | 47 | 45 | 6 | 4 | 10 | −2 | |
| 1100–1150 m | 16 | 21 | 22 | 30 | 29 | 5 | 1 | 8 | −1 | |
Disclaimer/Publisher’s Note: The statements, opinions and data contained in all publications are solely those of the individual author(s) and contributor(s) and not of MDPI and/or the editor(s). MDPI and/or the editor(s) disclaim responsibility for any injury to people or property resulting from any ideas, methods, instructions or products referred to in the content. |
© 2025 by the authors. Licensee MDPI, Basel, Switzerland. This article is an open access article distributed under the terms and conditions of the Creative Commons Attribution (CC BY) license (https://creativecommons.org/licenses/by/4.0/).
Share and Cite
Wang, S.; Zheng, X.; Du, Y.; Zhang, G.; Wang, Q.; Han, D.; Zhang, J. Estimation of Short-Term Vegetation Recovery in Post-Fire Siberian Dwarf Pine (Pinus pumila) Shrublands Based on Sentinel-2 Data. Fire 2025, 8, 47. https://doi.org/10.3390/fire8020047
Wang S, Zheng X, Du Y, Zhang G, Wang Q, Han D, Zhang J. Estimation of Short-Term Vegetation Recovery in Post-Fire Siberian Dwarf Pine (Pinus pumila) Shrublands Based on Sentinel-2 Data. Fire. 2025; 8(2):47. https://doi.org/10.3390/fire8020047
Chicago/Turabian StyleWang, Shuo, Xin Zheng, Yang Du, Guoqiang Zhang, Qianxue Wang, Daxiao Han, and Jili Zhang. 2025. "Estimation of Short-Term Vegetation Recovery in Post-Fire Siberian Dwarf Pine (Pinus pumila) Shrublands Based on Sentinel-2 Data" Fire 8, no. 2: 47. https://doi.org/10.3390/fire8020047
APA StyleWang, S., Zheng, X., Du, Y., Zhang, G., Wang, Q., Han, D., & Zhang, J. (2025). Estimation of Short-Term Vegetation Recovery in Post-Fire Siberian Dwarf Pine (Pinus pumila) Shrublands Based on Sentinel-2 Data. Fire, 8(2), 47. https://doi.org/10.3390/fire8020047