You are currently viewing a new version of our website. To view the old version click .
Fire
  • Article
  • Open Access

16 November 2025

Spatiotemporal Dynamics of Active Fire in China (2003–2024): Regional Patterns and Land Cover Associations

and
1
College of Information Engineering, Nanyang Institute of Technology, Nanyang 473004, China
2
National Meteorological Information Center, China Meteorological Administration (CMA), Beijing 100081, China
*
Author to whom correspondence should be addressed.
Fire2025, 8(11), 445;https://doi.org/10.3390/fire8110445 
(registering DOI)
This article belongs to the Section Fire Science Models, Remote Sensing, and Data

Abstract

Fire in China, driven by both natural and anthropogenic factors, significantly influences ecological stability. This study provides a comprehensive spatiotemporal analysis of active fires across China from 2003 to 2024 using MODIS Collection 6.1 active fire and land cover products. Our results reveal a significant national decline in fire counts since 2016, accompanied by with a marked geographical shift in hotspots from East China to Northeast China. It clarifies that croplands and savannas are the main fire-prone land covers, yet they have also experienced the most substantial decline in fire counts. East China (46.8%) and Central China (27.1%) were the largest contributors to the reduction in cropland fire counts. Temporal displacement toward nighttime straw burning was observed in East China. The decline in average fire radiative power (FRP) of daytime agricultural fires indicates that straw burning bans effectively reduced both the frequency and intensity of fires. Persistent savanna and forest fires are highly clustered in Southern China, while new emerging grassland fires are concentrated in Western China. Persistent cropland fires overlap with emerging zones in Northeast and Central China. Our study can assist in optimizing targeted fire policies and supporting better fire risk management.

1. Introduction

Fire is a fundamental ecological disturbance agent and a significant source of atmospheric emissions, impacting global carbon cycles, air quality, ecosystem structure, biodiversity, and human livelihoods [,,]. A wildland fire is an unplanned fire burning in a natural landscape, such as a forest, grassland, or savanna. Wildfires can be natural (e.g., lightning) or human-caused (e.g., discarded cigarette, power line fault, arson). A cropland fire is a fire in an agricultural field, most often set deliberately by people as part of farming practices, even if it sometimes becomes uncontrolled. While natural fire regimes play essential roles in many ecosystems, human activities have dramatically altered fire frequency, intensity, and seasonality worldwide [,]. Understanding the spatial and temporal patterns of fire activity, particularly over large scales and extended periods, is therefore critical for effective land management, climate change mitigation, disaster risk reduction, and environmental policy formulation.
China, encompassing vast territory with diverse climates, topography, and land use practices, experiences substantial fire activity annually. These fires range from agricultural burns and forest wildfires to grassland fires, each with distinct drivers and consequences []. The country’s rapid socioeconomic development and land use changes over recent decades have likely exerted complex influences on fire occurrence patterns [,]. This inherent regional heterogeneity suggests potential significant variations in fire activities across the nation.
China’s active fire landscape is dominated by agricultural burning, specifically the open-field incineration of crop straw, with forest fires representing the second major source []. The practice, open-field crop residue (straw) combustion, peaks during spring planting and autumn harvest seasons, particularly in major farming regions like the Northeast Plain, North China and Yangtze River delta [,]. Previous studies have suggested that the observed agricultural fire is more influenced by precipitation and human practices in northeastern China [,]. However, frequent severe air pollution events linked to straw burning posed substantial health threats to the public [], prompting the State Council of China to issue the “Air Pollution Prevention Action Plan” in 2013. Following this, stringent regional bans on open-field straw burning were rapidly promulgated nationwide. By 2018, at least 82 relevant policies had been issued across 28 provinces []. Crucially, the implementation intensity and effectiveness of these bans varied significantly across regions. East China issued as many as 29 policies, starkly contrasting with South China, which issued only four.
It is reported that over 90% of known wildfires in China are human-caused []. However, the actual occurrence of these human-caused wildfires is impacted by climate, forest management and human activities like land-cover change and fire prevention policies. There are two significant wildfire hotspots in China concentrated in the northeastern [,] and southwestern forest [], where complex climates and topography contribute to a pronounced fire season from January to April [,]. However, inconsistencies in data sources, analytical methodologies, and even spatiotemporal scales have led researchers to identify divergent drivers behind wildfire occurrences. For instance, Zong et al. (2021) reported that human activities were the primary trigger for wildfires, particularly in southern China, a region characterized by high population density []. In contrast, Fang et al. (2021) found that wildfires in Southeast China are primarily driven by low precipitation and high diurnal temperature ranges, while fires in Southwest China are mainly promoted by warm conditions []. Recent research has highlighted the role of internal variability, such as the El Niño-Southern Oscillation and sea ice, in climate variations and associated wildfire in eastern Asian [,,]. Separately, Xiong et al. (2020) proposed that forest fire-related policies serve as the key factor triggering forest fires in southwestern China [].
Many existing analyses either examine national fire trends that predate the full implementation of stringent national fire management policies [], lack integration with detailed land cover dynamics [], or are restricted to regional-scale assessments of land cover and fire interactions []. Although previous research has focused on decreasing national wildfire trends in mainland China [] and an accelerated decline in cropland fires under strengthened policies [], a comprehensive, long-term analysis of fire patterns across all of China’s major regions, explicitly linking fire occurrence to underlying surface types (e.g., forests, croplands, grasslands, savannas) over the last two decades, remains relatively unexplored. This study aims to bridge the existing knowledge gap by conducting a thorough spatiotemporal analysis of fire activity across mainland China from 2003 to 2024 by using the active fire observations from satellite remote sensing. By integrating regional geography with land cover analysis over a 22-year period, this research provides a nuanced understanding of China’s complex fire landscape. The findings are expected to offer valuable insights for developing regionally tailored fire management strategies, assessing ecological impacts, and informing climate adaptation policies.

2. Study Area, Data and Methods

2.1. Study Area

China spans approximately 9.6 million km2 across eastern Asia, featuring complex topography with elevated western plateaus descending eastward to coastal plains. Its climate ranges from arid continental in the northwest to humid subtropical in the southeast, supporting diverse ecosystems including forests, grasslands, croplands, and deserts. Furthermore, China’s territory is traditionally divided into seven distinct geographical regions (Northeast, North, East, Central, South, Southwest, and Northwest), each characterized by unique climatic conditions, dominant vegetation types, population densities, and economic activities [].
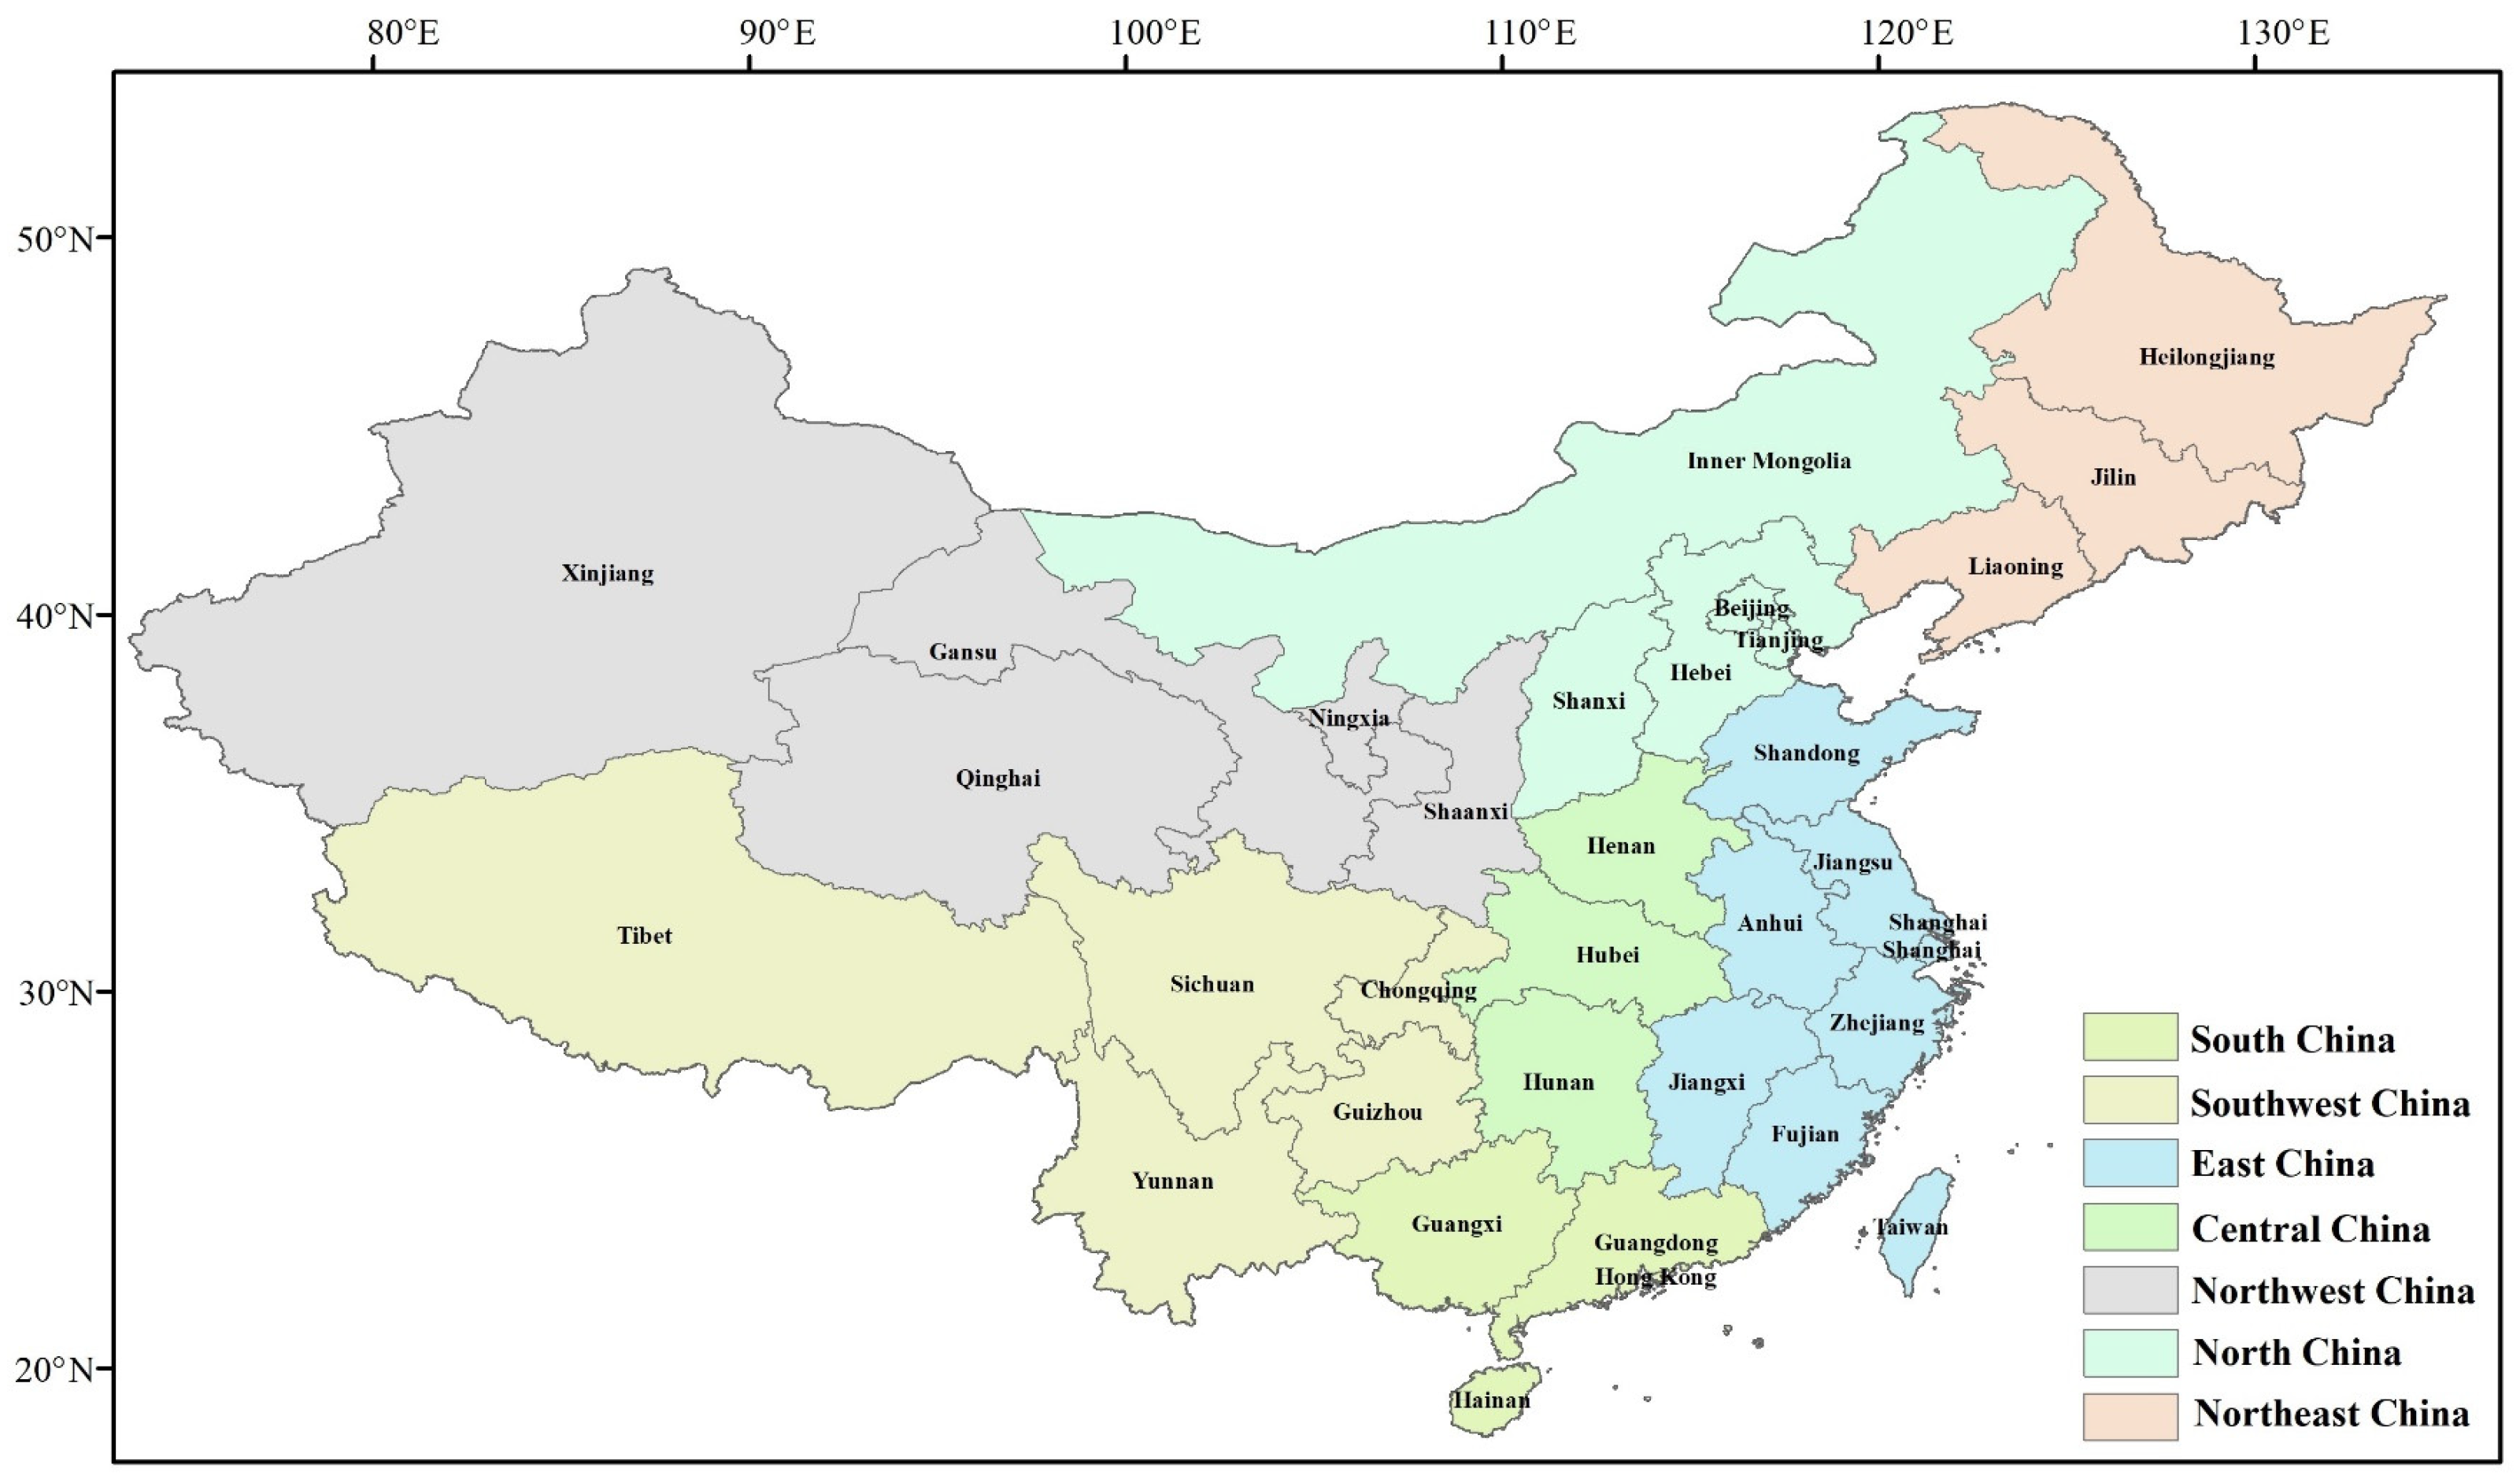
In this study, provincial boundary-based classification scheme is selected for regional analysis. While provincial boundaries are administrative, they closely align with China’s major climatic and agro-ecological zones and are highly relevant for policy analysis, as environmental and agricultural policies are implemented at the provincial level. Here, mainland China is divided into seven regions based on integrated physical and socioeconomic characteristics as shown in Figure 1, including Northeast China (Heilongjiang, Jilin, Liaoning), North China (Beijing, Tianjin, Hebei, Shanxi, Inner Mongolia), Northwest China (Shaanxi, Gansu, Qinghai, Ningxia, Xinjiang), Central China (Henan, Hubei, Hunan), East China (Shandong, Jiangsu, Anhui, Shanghai, Zhejiang, Jiangxi, Fujian, Taiwan), Southwest China (Chongqing, Guizhou, Sichuan, Yunnan, Tibet), and South China (Guangdong, Hong Kong, Macao, Hainan, Guangxi).
Figure 1. Map of China’s seven geographical regions.

2.2. Data

2.2.1. MODIS Active Fire Datasets

The Moderate Resolution Imaging Spectroradiometer (MODIS) Terra and Aqua satellites were launched in 1999 and 2002, respectively, with Terra starting operations on 24 February 2000, and Aqua on 24 June 2002. Since only Terra data were available in 2001 and 2002, this study thus begins its research period in 2003. The MODIS has demonstrated exceptional capability for characterizing spatiotemporal fire patterns through active fire detection [,].
The MODIS Collection 6.1 active fire product (MCD14ML) for China during 2003–2024 was acquired from NASA’s Fire Information for Resource Management System (FIRMS), providing a combined active fire inventory from both Terra and Aqua satellites at 1-km nadir resolution []. Observations are obtained by Terra (equator overpass: 10:30/22:30 GMT) and Aqua (01:30/13:30 GMT) satellites, whose combined near-polar orbits enable quad-daily equatorial coverage. Variations in overpass time offer a distinct perspective on diurnal fire events. In this study, we combined fire observations from both satellites to derive total fire counts. Although this approach provides the most complete daily coverage, it is inherently subject to diurnal sampling bias that Aqua (with an afternoon overpass) may detect more flaming fires than Terra (which overpasses in the mid-morning). This is a well-recognized limitation of the dataset.
The latest MODIS fire product (C6.1) has shown significant improvements, with a low commission error of approximately 3% and an omission error of around 5% in China []. The MODIS 1-km fire product used in this study likely misses smaller and shorter-duration fires, compared with the Visible Infrared Imaging Radiometer Suite (VIIRS) 375 m active fire product []. This is particularly relevant for agricultural burning at night, which may be conducted on a smaller scale to evade detection. Consequently, the absolute fire counts reported in this study should be interpreted as a conservative estimate of total fire activity, with a bias towards larger and more intense fires. However, the consistency of the MODIS Collection 6.1 algorithm throughout our study period ensures that the temporal trends and spatial patterns we analyze are robust and comparable over time.
The MODIS C6.1 active fire dataset in CSV format records Latitude/Longitude (center of 1 km fire pixel, but actual fire location may differ as multiple fires can be within the pixel), Acq_Date (Date of MODIS acquisition), satellites (Aqua or Terra), DayNight (day or night), fire detection confidence levels (0–100%), fire radiative power (FRP) and inferred hot spot type []. The geolocation coordinates (latitude/longitude) of all fire pixels were used to assign each fire to its corresponding region (China and its seven subregions) for statistical analysis. We applied rigorous quality controls, retaining only detections with ≥70% confidence levels. The “inferred hot spot type” parameter includes four categories: “0” indicates presumed vegetation fire, “1” indicates active volcano, “2” indicates other static land source, and “3” indicates offshore. In this study, we selected fire type “0” (presumed vegetation fires), which forms the basis for the spatiotemporal analysis of fire patterns across China.

2.2.2. MODIS Land Cover Products

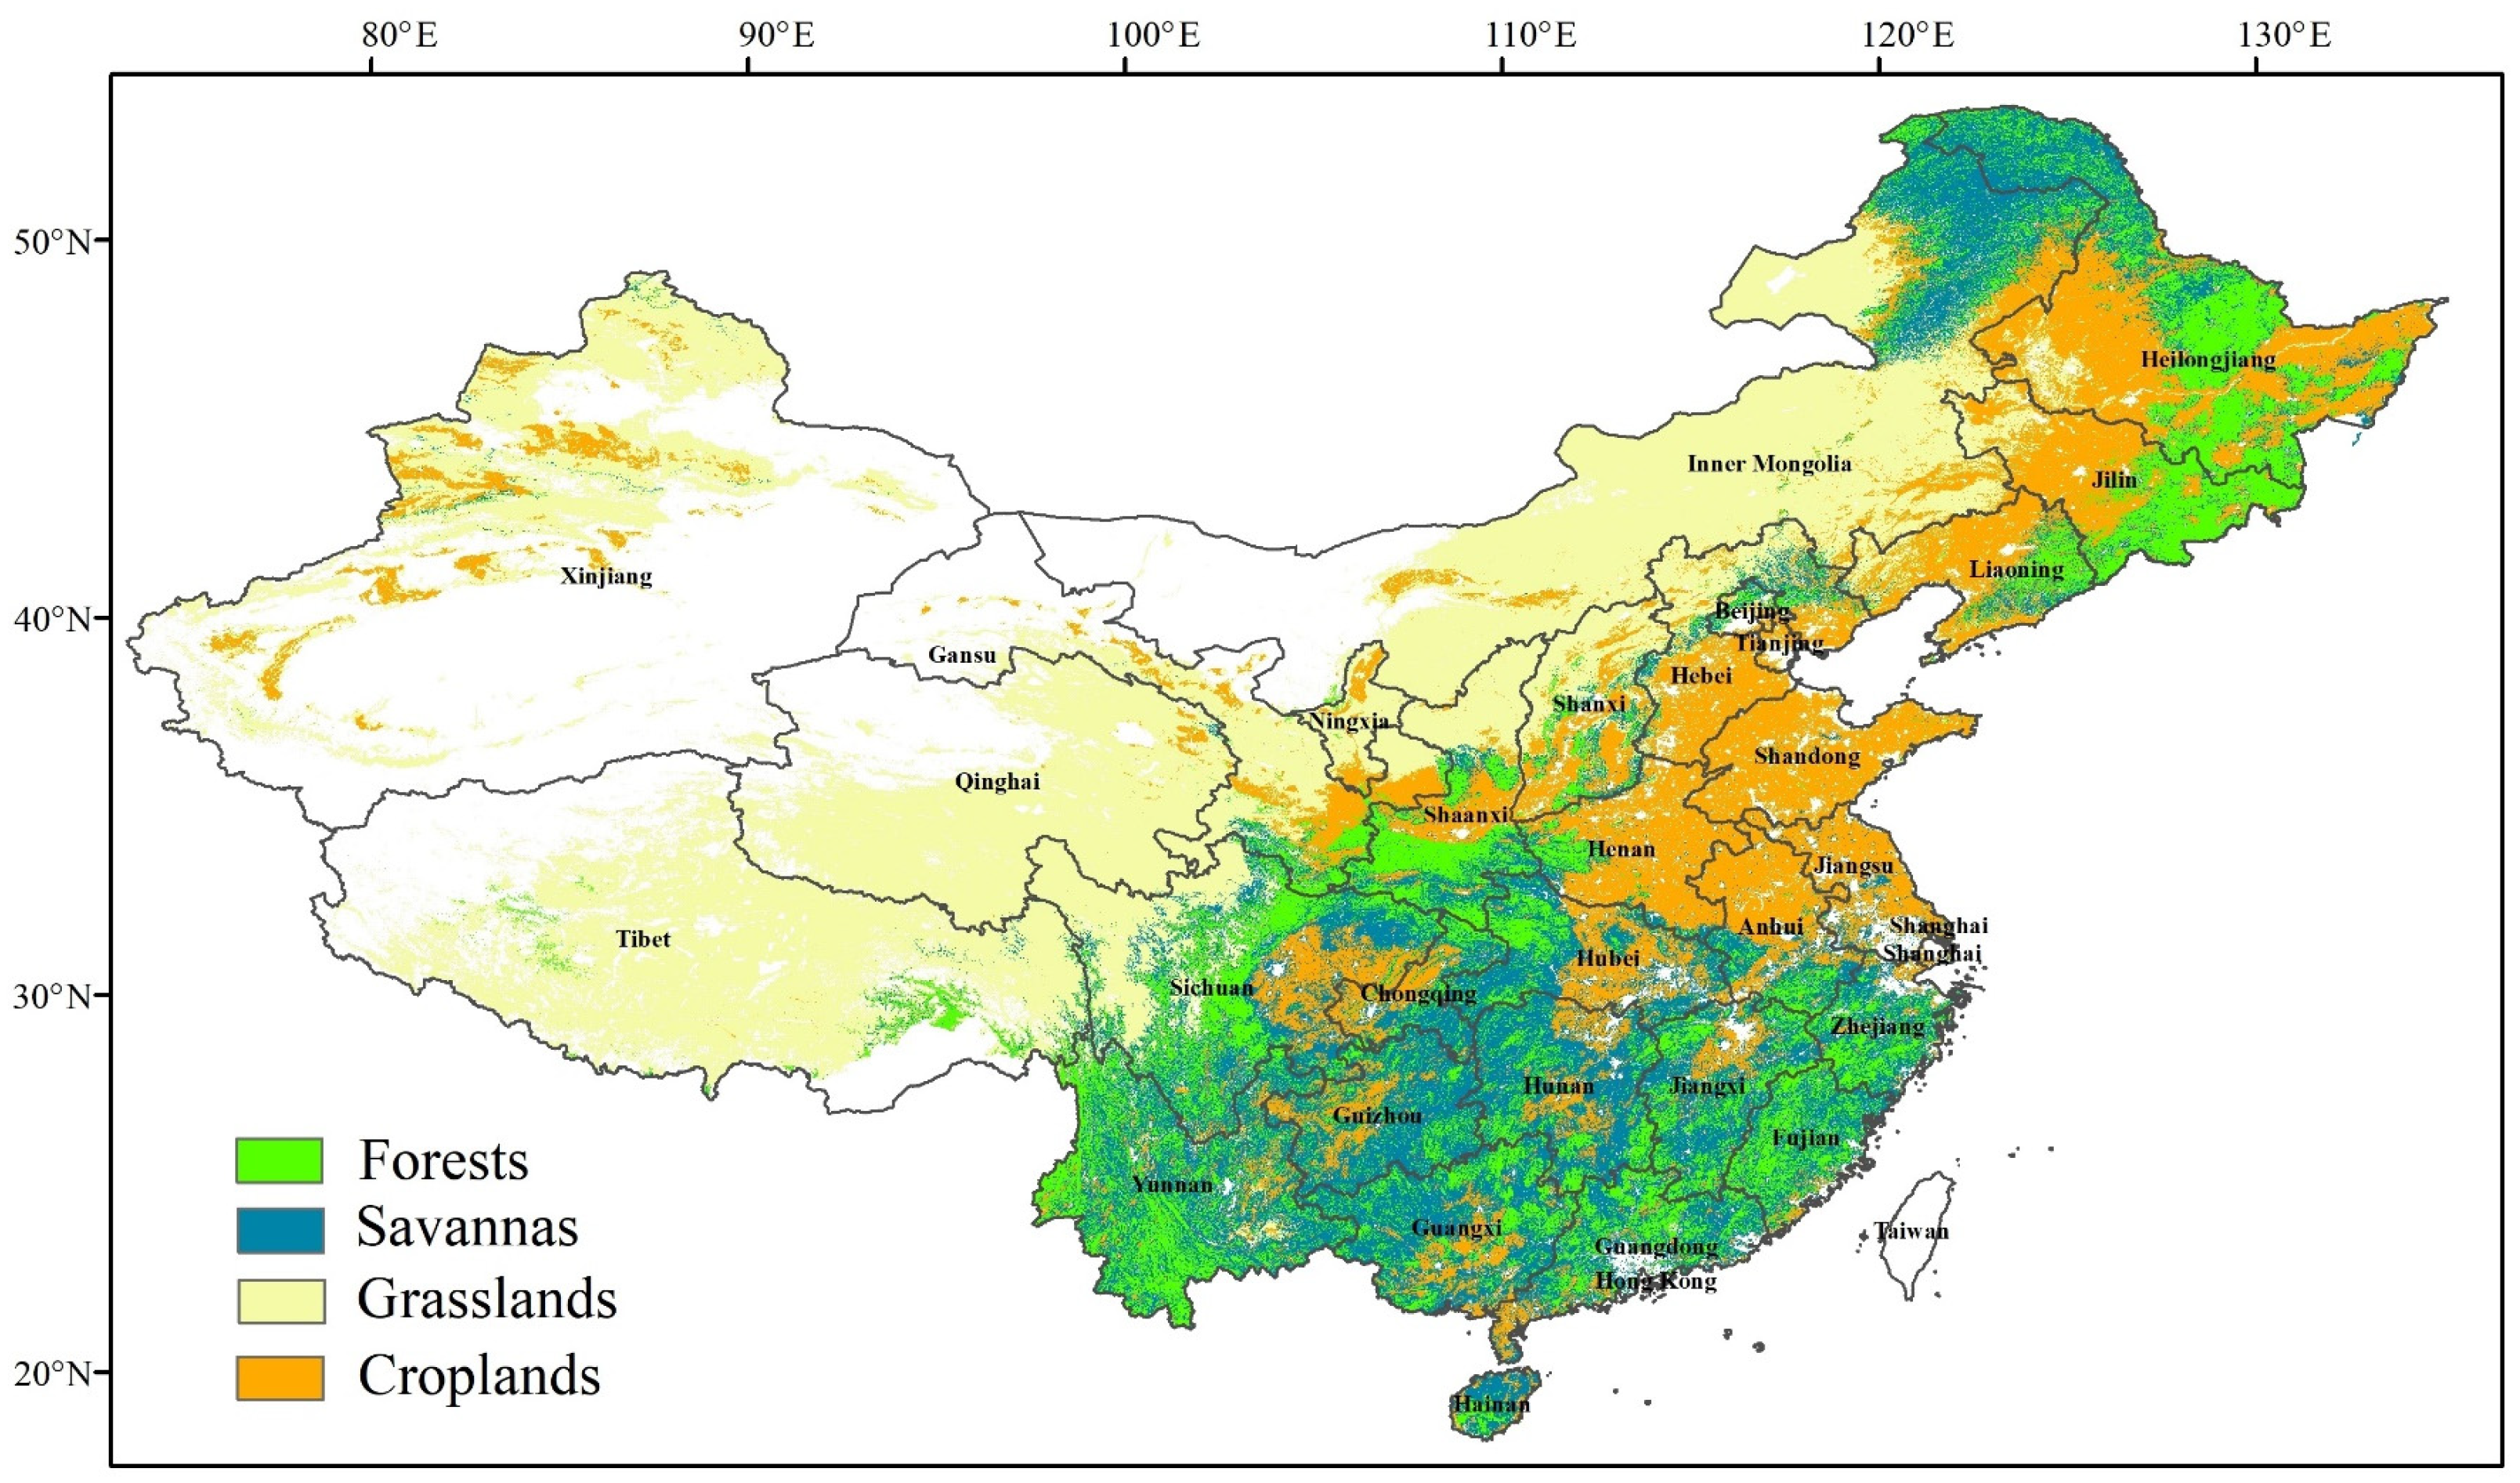
This study utilizes the MODIS Collection 6.1 land cover product (MCD12Q1) during 2003–2023, which delivers annual global land cover classifications at 500-m spatial resolution []. This dataset demonstrates significant improvements in classification algorithms and reduced spurious interannual variability []. While MCD12Q1 offers broad applicability at global scales, we acknowledge its documented limitations in complex agricultural landscapes, particularly in regions characterized by small-scale, heterogeneous farming patterns prevalent in China [,,]. We employed the International Geosphere-Biosphere Programme (IGBP) system scheme. The original 17 IGBP classes were consolidated into 5 major land cover types as shown in Table 1 to reduce uncertainties associated with fine-grained classifications: forests (IGBP 1–7), savannas (8, 9), grasslands (10), croplands (12, 14), and others (11, 13, 15, 16, 17). Figure 2 illustrates the spatial distribution of these reclassified land cover types across China in 2023.
Table 1. MCD12Q1 IGBP scheme legend and reclassified categories.
Figure 2. The MODIS land cover types across China in 2023.
To attribute each fire to a specific land cover type, the geographic coordinates of each MODIS active fire pixel were spatiotemporally matched with the MCD12Q1 land cover data. It is important to note that the provided latitude and longitude represent the center of the 1 km pixel within which one or more fires were detected. This inherent spatial uncertainty means the actual fire location may be anywhere within that pixel, and multiple small fires could be represented as a single detection. The land cover type at the pixel’s central coordinate was extracted and assigned to the fire detection. Fires were subsequently categorized according to reclassified categories defined in Table 1 for analysis.

2.2.3. Meteorological Data

ERA5, the fifth-generation reanalysis conducted by the European Centre for Medium-Range Weather Forecasts (ECMWF), represents substantial enhancements compared to the earlier ERA-Interim product []. This dataset provides a coherent and integrated repository of global climate parameters. To examine the long-term trends of meteorological variables, this study employs monthly ERA5 datasets including 2 m temperature, total precipitation, and 10 m wind speed spanning from 2003 to 2024 with a spatial resolution of 0.25° × 0.25°.

2.3. Methods

2.3.1. Mann-Kendall Test

The Mann-Kendall (MK) test is a non-parametric statistical method widely used for detecting monotonic trends in time series data []. The MK test assesses whether there is a statistically significant increasing or decreasing trend in the variable of interest over time. The procedure for the MK test is implemented as follows:
For a time series with n data points (x1, x2, …, xn), the S statistic is computed using the formula:
S = i = 1 n 1 j = i + 1 n s g n ( x j x i ) ,
where the sign function sgn(z) is defined as:
s g n z = 1       i f   z > 0 0       i f   z = 0 1     i f   z < 0 ,
The variance of S is calculated considering possible ties in the data:
V a r ( S ) = n n 1 2 n + 5 p = 1 g t p ( t p 1 ) ( 2 t p + 5 ) 18 ,
where g is the number of tied groups and t p is the number of observations in the p-th tied group. The standardized test statistic Z is computed as:
Z = S 1 V a r ( S )       i f   S > 0 0               i f   S = 0 S + 1 V a r ( S )     i f   S < 0 ,
The null hypothesis of no trend is rejected if |Z| > Z1-α/2, where Z1-α/2 is the critical value from the standard normal distribution for a significance level α. A positive Z value indicates an increasing trend, while a negative Z value indicates a decreasing trend. In this study, the MK test was applied to fire count time series for each region and for both daytime and nighttime observations separately, with a significance level of α = 0.05.

2.3.2. Trend Analysis Using the Theil-Sen Estimator

Theil-Sen estimator, a robust non-parametric method for trend analysis [,], was employed to quantify the magnitude and direction of trends in fire count data. The principle of the Theil-Sen estimator is to compute the slopes between all possible pairs of data points in the time series and then determine the median of these slopes. It is particularly resistant to outliers and does not require assumptions about the distribution of residuals. Given a dataset consisting of n paired observations ( x i , y i ), where x i represents the year and y i represents the fire counts, the slope S i j between any two points ( x i , y i ) and ( x j , y j ) is calculated as:
S i j = ( y j y i ) ( x j x i ) ,
The overall trend slope ( β ) is then given by the median of all S i j values:
β = m e d i a n S i j 1 i j n ,   x i x j
The trend analysis was performed separately for daytime and nighttime fire counts in each geographical region.

2.3.3. Spatiotemporal Analysis Framework to Characterize Fire Dynamics

The methodology involves creating a standardized 0.2°-degree resolution spatial grid over the study area and analyzing fire occurrence patterns within each grid cell from 2003 to 2023, with this resolution chosen as a compromise between capturing fine-scale spatial patterns and ensuring computational efficiency for the nationwide analysis over 21 years.
Three distinct fire dynamic types are classified based on specific temporal criteria: (1) Persistent fire areas: regions with fire presence for ≥5 consecutive years covering ≥ 80% of the study period and continuing beyond 2016; (2) Emerging fire areas: regions with consecutive fires in the most recent three years (2021–2023) but no pre-2016 fire history; (3) Disappearing fire areas: regions with historical fire persistence (≥5 consecutive years) but no fires in the recent three-year period.
The process identifies the main land cover type for each grid cell by calculating which land cover class has the highest frequency of fire occurrences within that cell. This is achieved by first assigning all fire points to a standardized grid and then performing a frequency count for each land cover type per grid cell. The land cover with the most fire incidents is designated as the cell’s predominant type. Crucially, this analysis is performed separately for daytime and nighttime data.

3. Results

3.1. Spatiotemporal Distribution of Active Fire Across Regions

The MODIS fire datasets analysis revealed 502,567 active fire occurrences across China during the 2003–2024 period. Regional distribution showed Northeast China accounting for the highest proportion (24%), followed by East China (18%), South China (17%), Southwest China (15%), North China (11%), Central China (11%), and Northwest China (4%).
Figure 3a presents the annual fire counts for seven regions in China from 2003 to 2024. A fire rebound occurred in 2014–2015, shortly after the ban’s enactment, and this phenomenon has also been documented in previous studies [,]. It was not until 2016 that the effects of subsequent fire management-related policies became prominent, as evidenced by the nationwide decline in fire occurrences. Therefore, it reveals two distinct temporal phases. First, a high-fire period spanned 2003–2015, with a peak in 2014. Second, a turning point occurred in 2016, fire counts decreased significantly (T-test, p-value < 0.05) during 2016–2024. Based on these results, two distinct phases were defined: Phase I (2003–2015) and Phase II (2016–2024).
Figure 3. (a) Stacked distribution of annual fire counts across seven regions in China (2003–2024); (b) Comparison of mean annual fire count in nationwide and seven regions between two periods (2003–2015 vs. 2016–2024). Arrows indicate the percentage change in average fire counts between Period I (2003–2015) and Period II (2016–2024), with red and green representing an increase and decrease, respectively.
Notable differences in regional fire contributions emerged between the two phases. In Phase I, East China (20.38%), South China (19.51%), and Northeast China (19.22%) were the primary fire-prone regions, collectively accounting for nearly 60% of national fires. In contrast, Phase II showed a dramatic shift that Northeast China became the dominant contributor (37.39%), followed by North China (15.19%) and Southwest China (14.79%). It was shown that East China and South China, once top fire contributors, experienced a sharp decline in their contribution ratios. Northeast China, by contrast, experienced a surge in fire counts. Fire hotspots have shifted from East China to Northeast China, and this transition is closely linked to the implementation of China’s straw burning ban. As illustrated in Figure 2, East China (Shandong, Jiangsu, and Anhui provinces) is major crop-growing region, and it saw a rapid decline in fires with the strengthening of straw burning ban policy. However, Northeast China (Heilongjiang, Jilin, and Liaoning provinces), another critical grain-producing area in China, even witnessed a rebound in fire counts in 2017. Figure 3b compares average fire counts between the two phases. Nationally, average fires decreased by 37% in Phase II, with Central China (69% decrease), East China (68% decrease), South China (65% decrease) and Southwest China (42% decrease) being the primary drivers of this reduction. Conversely, average fires in three regions increased in Phase II: Northeast China (+24%), North China (+4%), and Northwest China (+1%).
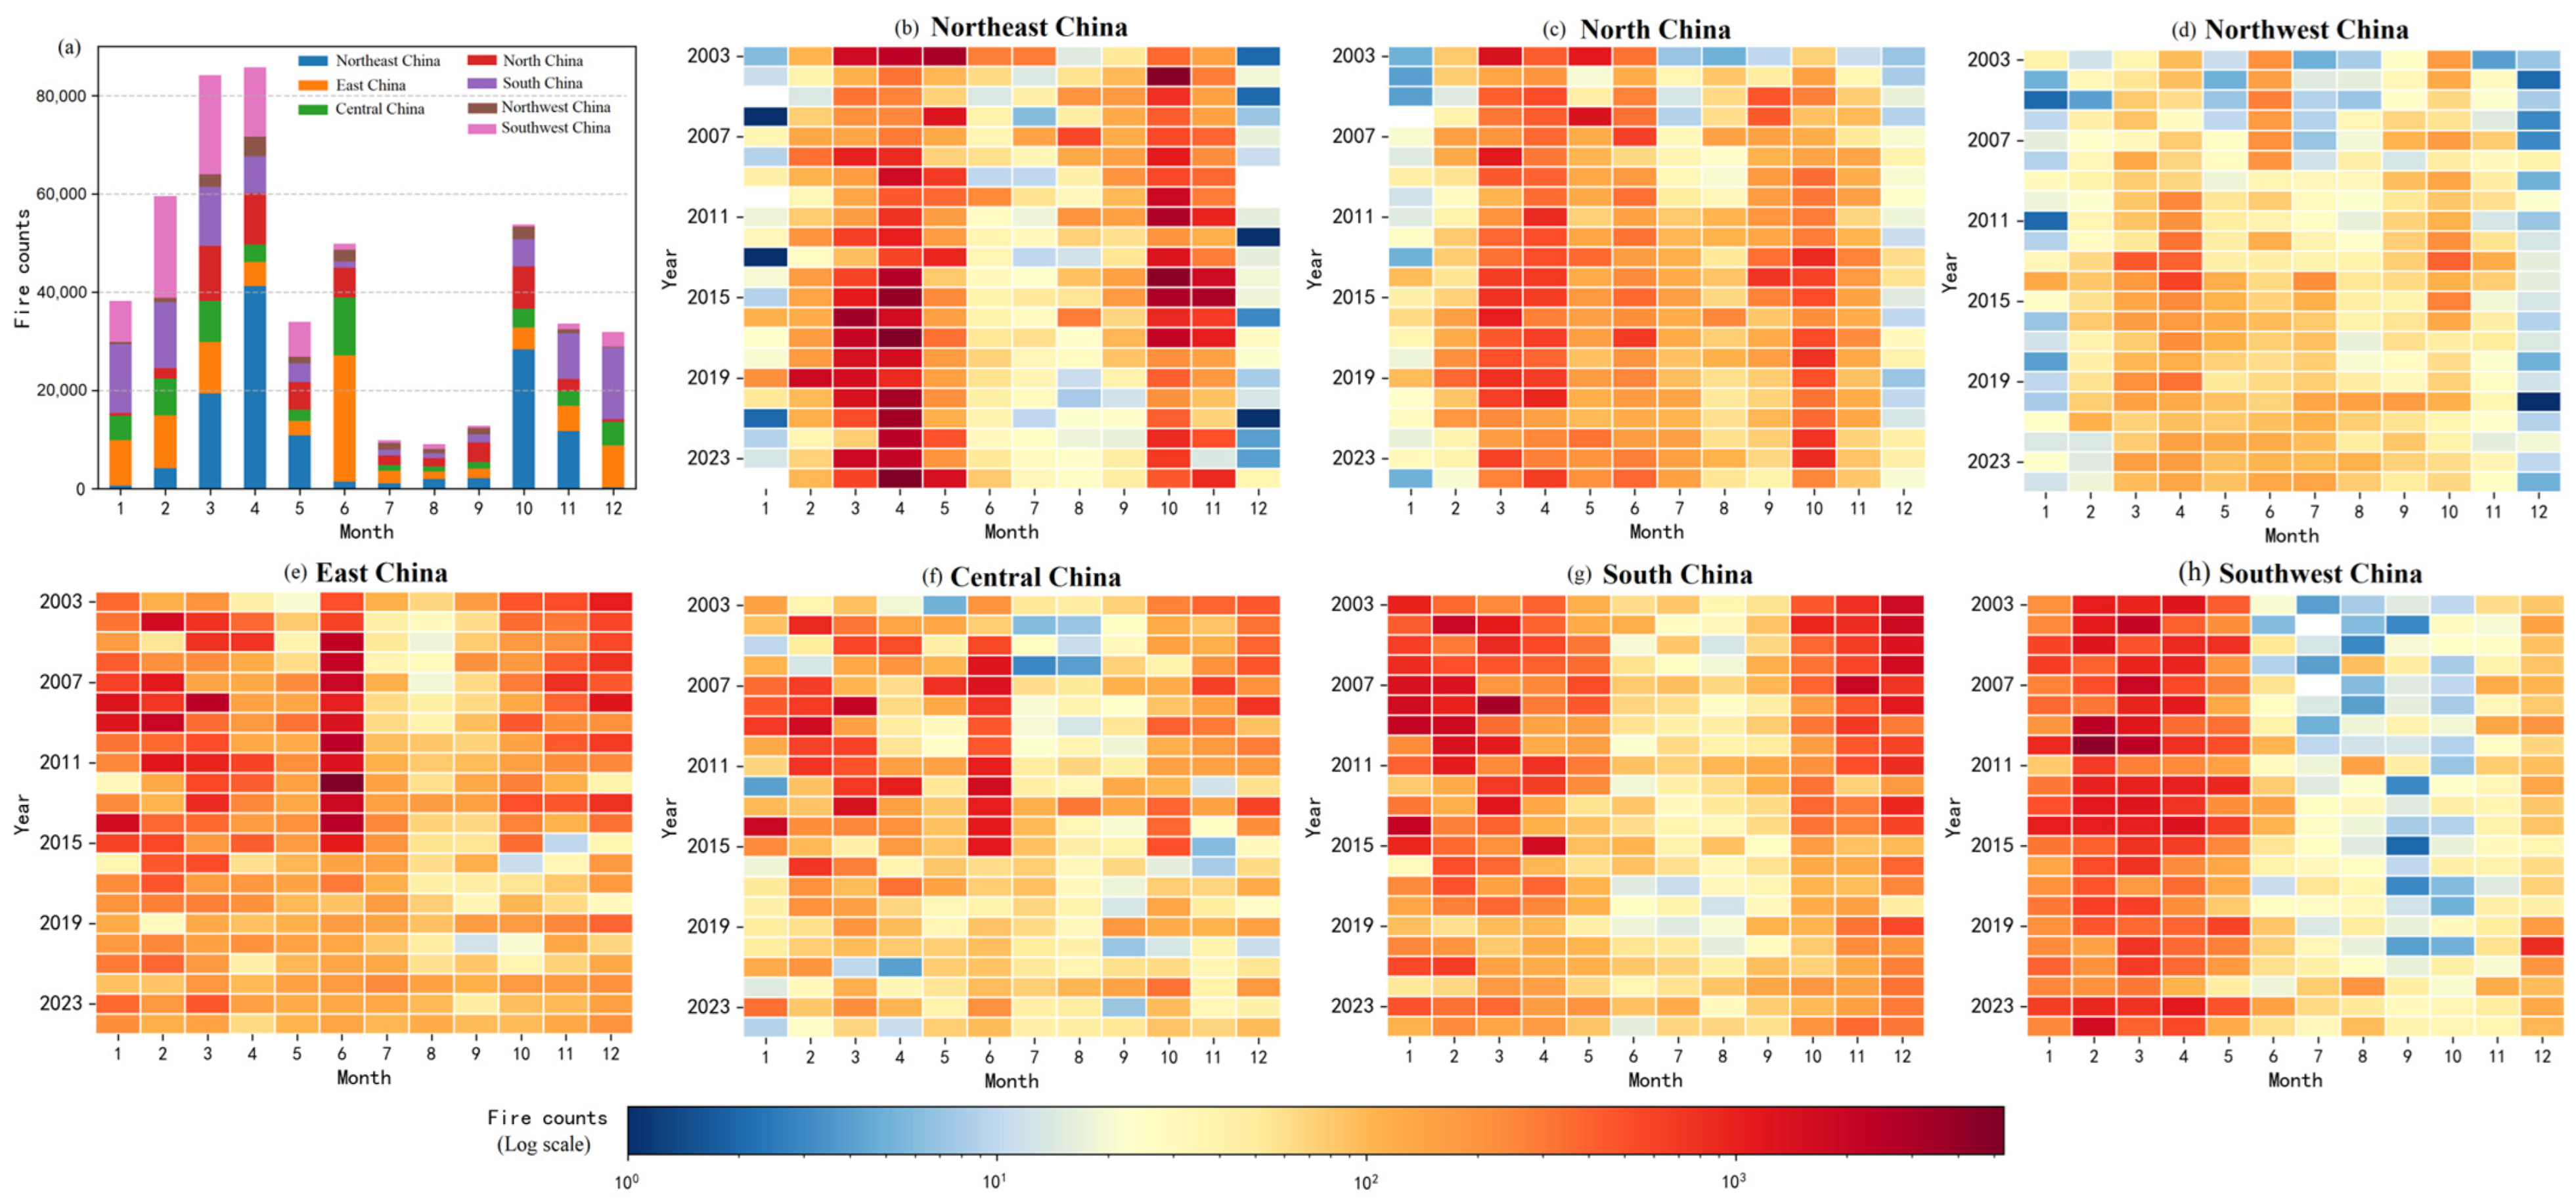
Figure 4a illustrates the monthly fire counts across China from 2003 to 2024. Nationally, fire counts peak in March–April and October–November, coinciding with spring agricultural activities (e.g., straw burning for field preparation) and autumn harvests. Northeast China contributes most significantly to national fire counts, with proportions of 23% in March, 48% in April, 53% in October and 35% in November. In contrast, July–August has a sharp decline in fires.
Figure 4. (a) Stacked distribution of monthly national fire counts by regions (2003–2024); Interannual monthly fire counts in (b) Northeast China; (c) North China; (d) Northwest China; (e) East China; (f) Central China; (g) South China; (h) Southwest China.
Regionally, the high frequency of fire occurrences observed in Northeast China during March–April and October–November is closely associated with spring straw burning activities in large-scale grain-producing areas. However, after 2016, the peak fire counts in March–April increased rather than decreased, whereas effective management led to a reduction in fire events during October–November. This shift suggests that the implementation of the straw burning ban has altered the temporal concentration of fires, relocating the peak fire period. North China also exhibited rising fire counts during its peak periods in March–April and October after 2016. Similarly, Northwest China, though at a relatively low fire level, experienced elevated fire activity from March to July after 2016. By contrast, several regions demonstrated effective reduction in fire frequency after 2016. Both East China and Central China witnessed substantial reduction in June fire peaks without evidence of temporal shifting. In South China, fire peaks during January–March and October–December were suppressed, as were the January–April fire peaks in Southwest China.
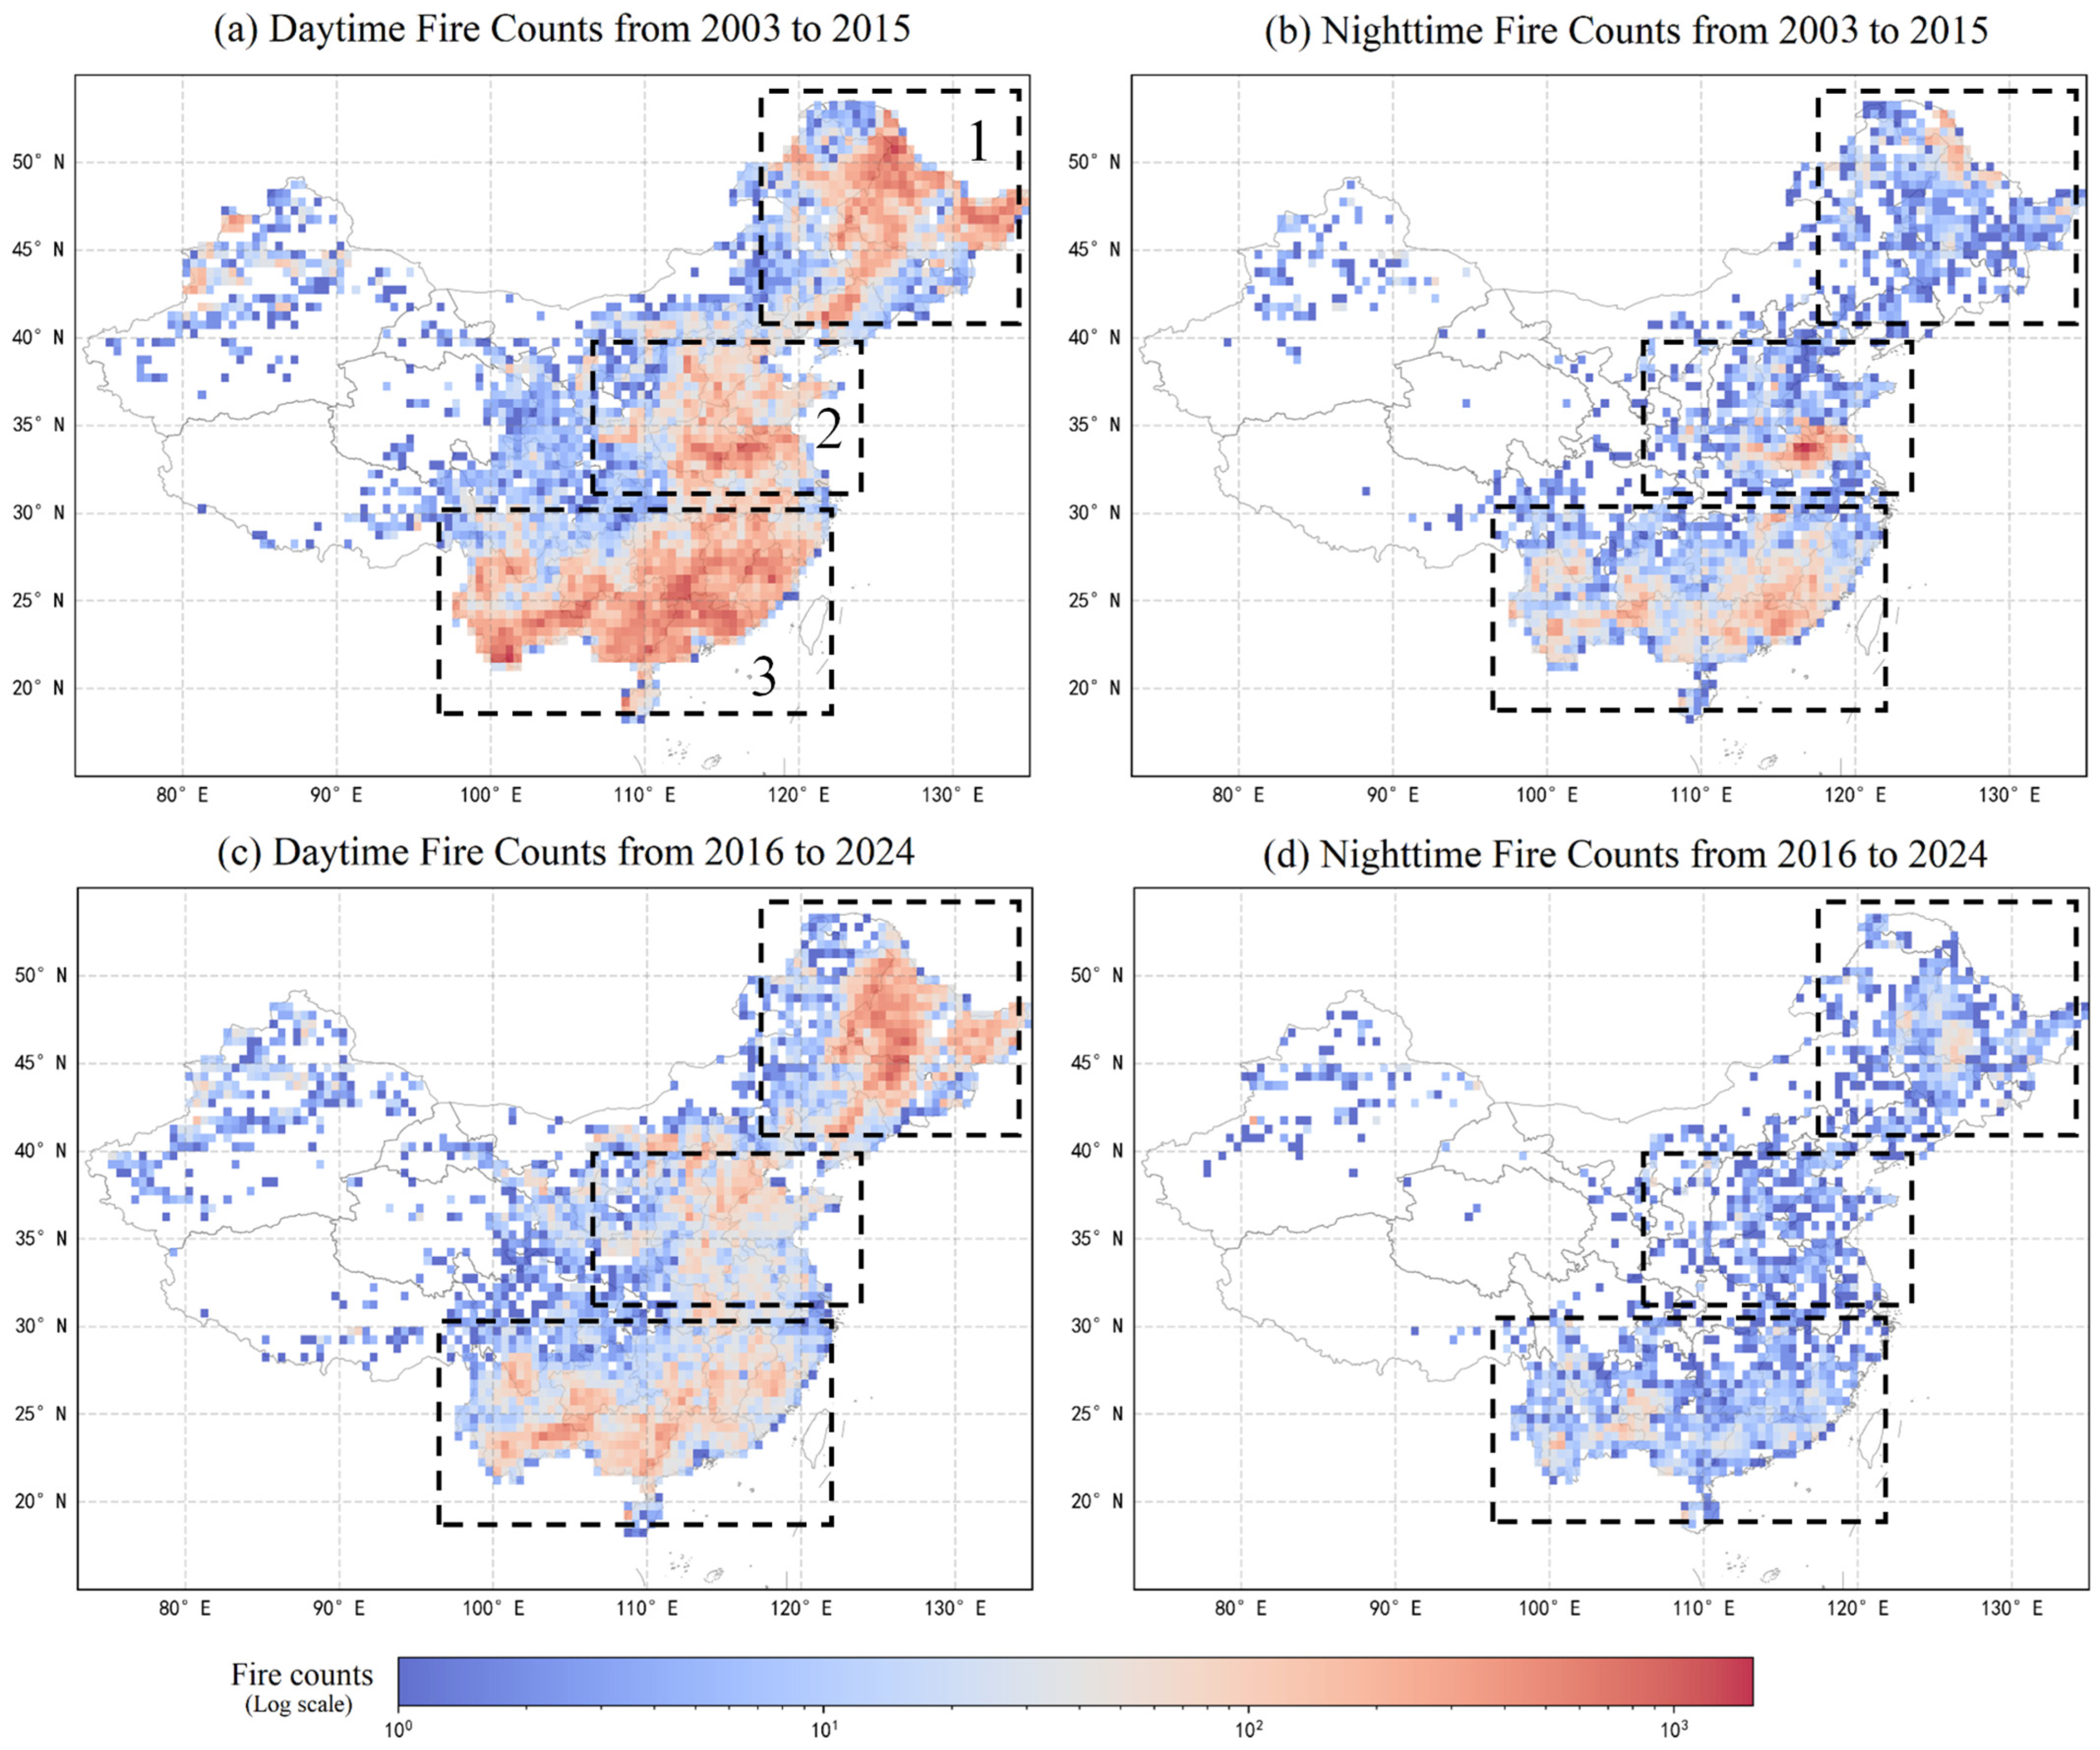
Figure 5 illustrates the spatial-temporal patterns of daytime and nighttime fire counts across China during two periods. Spatially, fire counts are predominantly concentrated in agricultural-intensive regions of Northeast China (rectangle 1), East China (rectangle 2), Central China (rectangle 2) and Southern China covered by natural vegetation (rectangle 3), while Northwest and Southwest China shows consistently low fire activity due to sparse human settlement and less flammable natural vegetation. Temporally, from 2003–2015 to 2016–2024, a notable reduction in fire counts is observed, particularly for daytime fires. Nighttime fire activity in region of rectangle 2 has been effectively suppressed. Day-night comparisons within each period reveal that pre-2016 daytime fires had broader and more intense high-count regions than nighttime fires, reflecting dominant daytime anthropogenic fire-setting. Post-2016, the contraction of daytime high-count regions is more pronounced than that of nighttime, highlighting policy effectiveness in curbing overt fire activities. Although fire counts decrease, residual fire activity persists in parts of Northeast (rectangle 1) and Southern China (rectangle 3).
Figure 5. Map of (a,c) daytime and (b,d) nighttime fire counts in China (2003–2015 vs. 2016–2024) at 0.5° × 0.5° grid resolution. The numbered rectangles (1–3) indicate the study regions: (1) Northeast China, (2) East China and Central China, (3) Southern China.
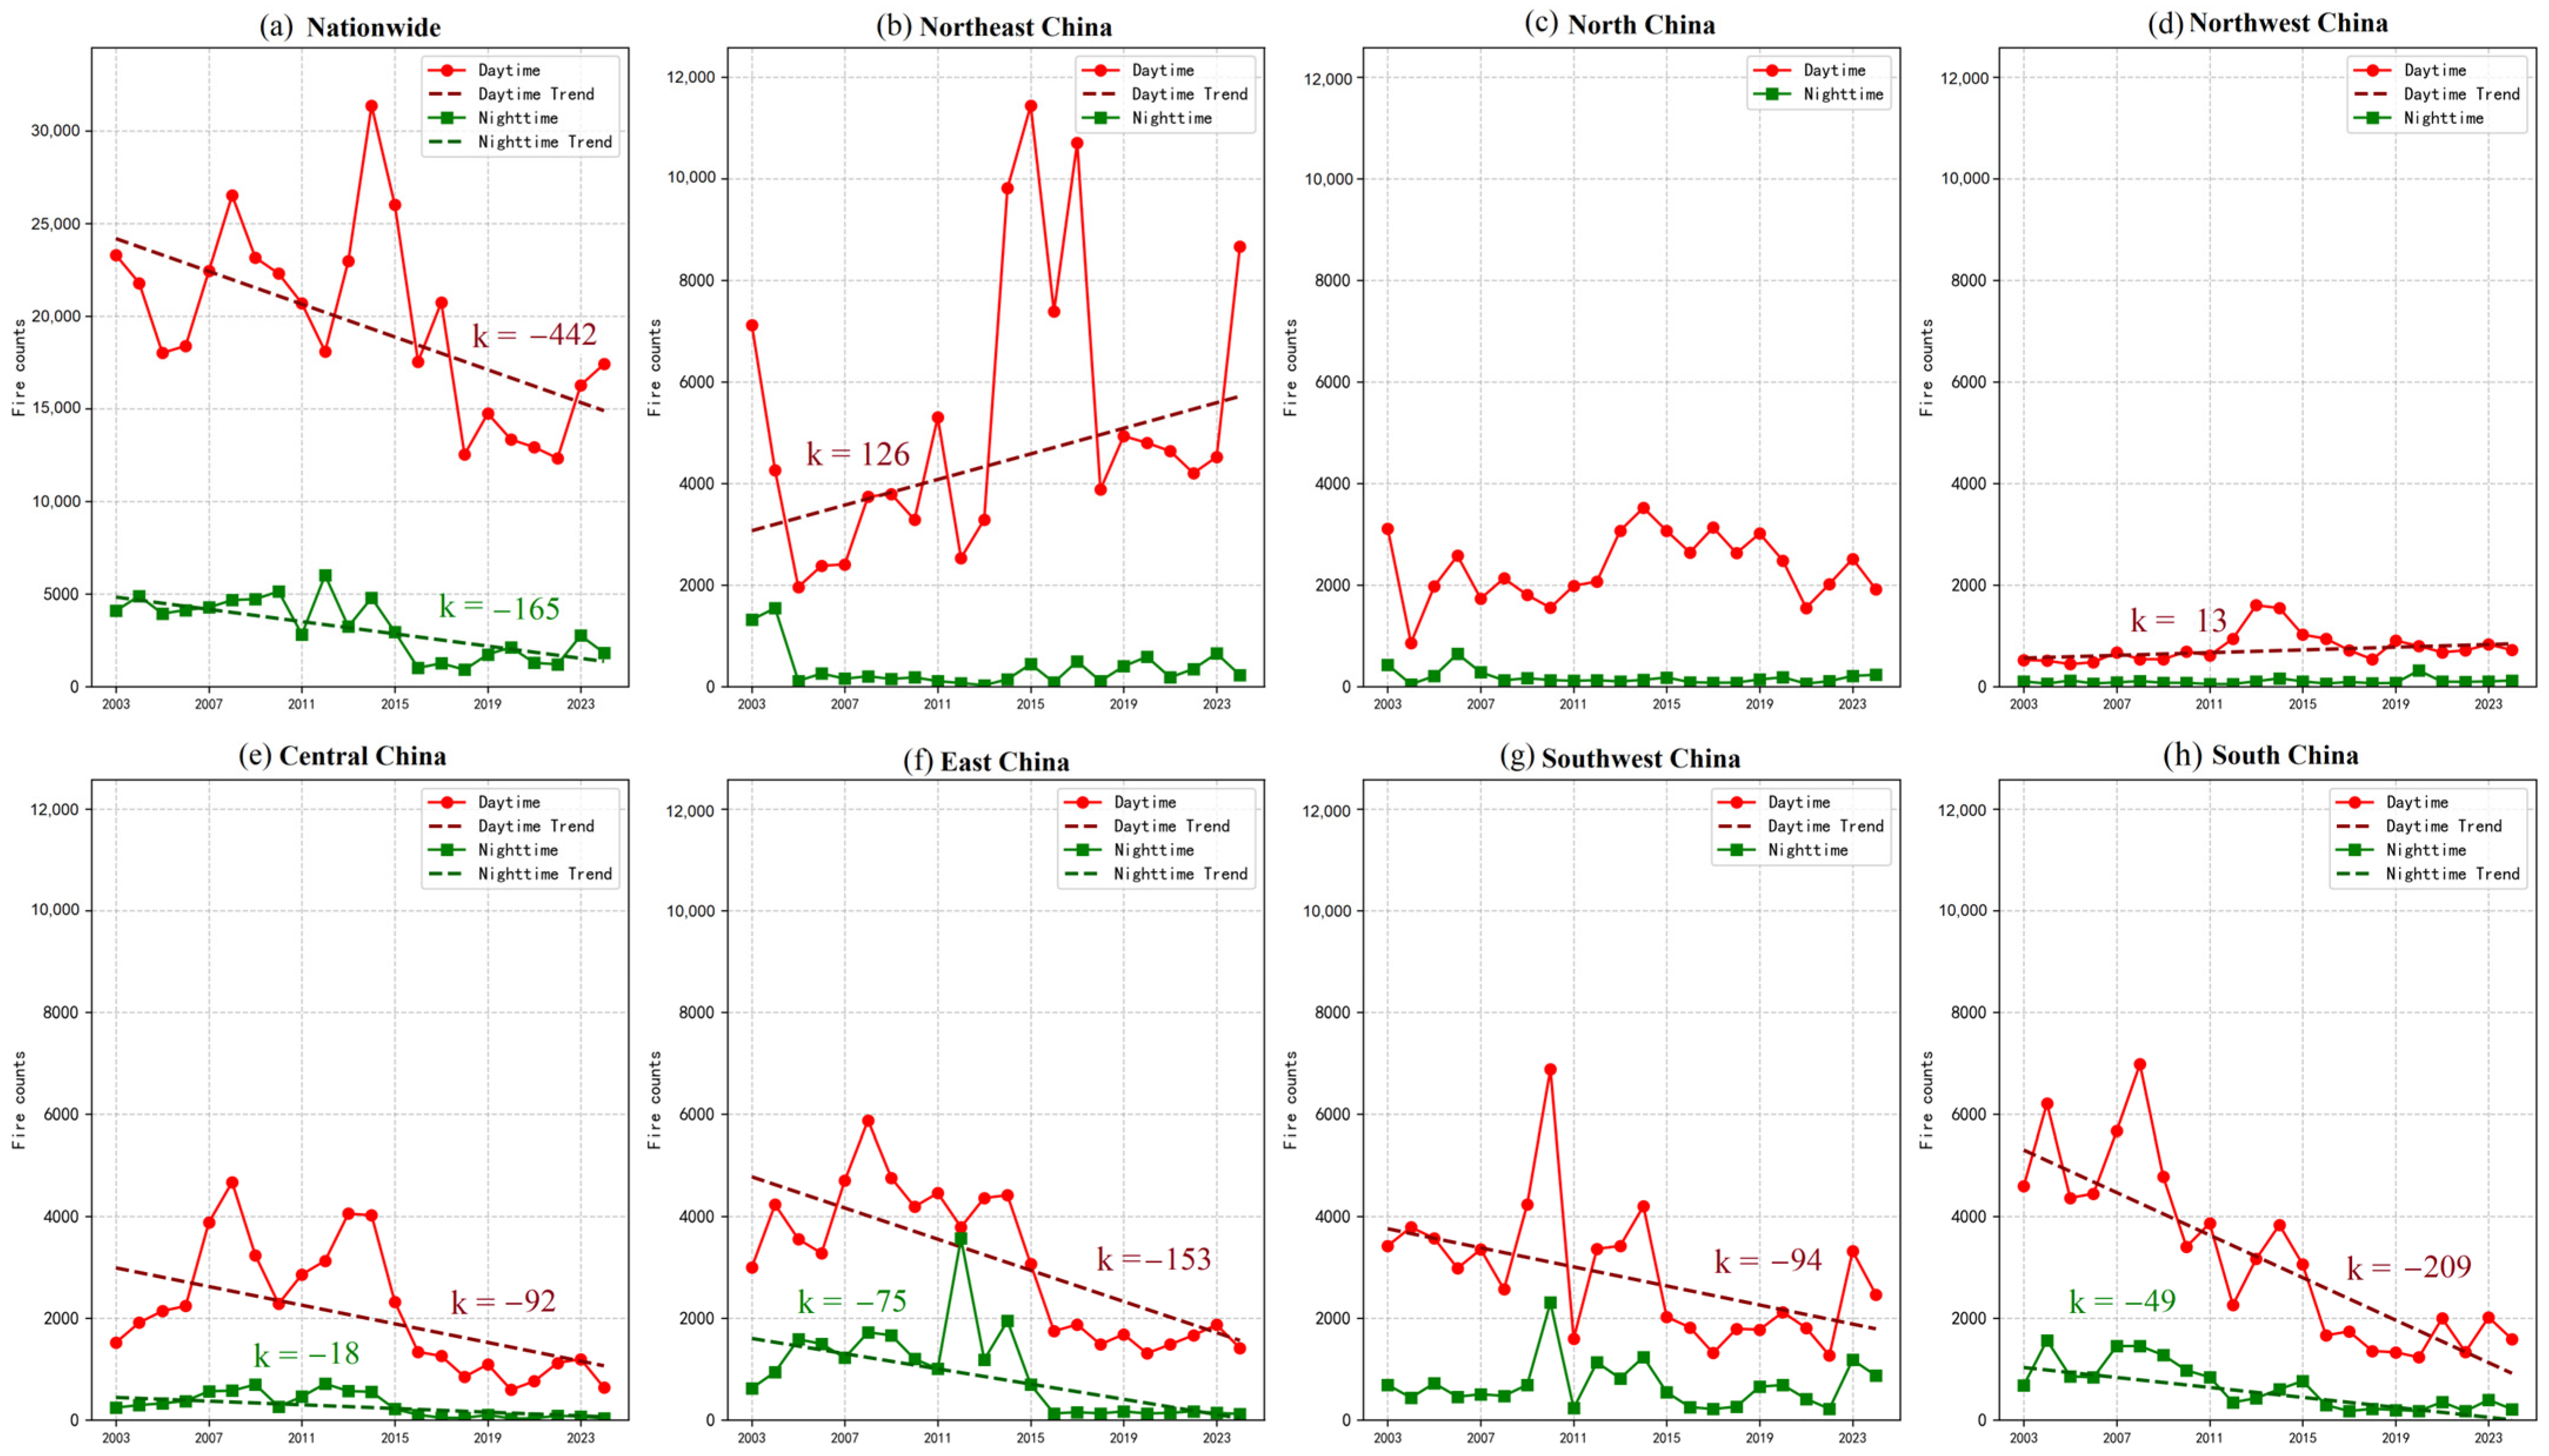
Figure 6 illustrates the long-term trends in daytime and nighttime fire counts from 2003 to 2024. Overall, the decreasing trend of fire counts is more significant nationwide and in most regions (such as Central China, East China, Southwest China, and South China). However, Northeast China (k = 126) and Northwest China (k = 13) exhibit significantly increasing trends in daytime fires. North China show no significant trends in either daytime or nighttime fires. Given concerns that under-detection or omission of fires in the MODIS C6.1 dataset could reduce monthly fire counts and affect analyses of fire variation and trends, we perturbed the annual national fire count time series by ±5%, ±10%, and ±15% to simulate potential systematic omission errors. This sensitivity test shown in Figure S1 indicates that the main trend remains stable under 5–15% omission.
Figure 6. Annual variations in fire counts in daytime and nighttime by region from 2003 to 2024. Only Mann-Kendall test significant linear trend lines (dashed lines) are displayed, where slope (k) quantifies trend direction and magnitude.
Our preliminary analysis in the Supplementary Materials explores policy-climate-fire relationships across different regions. This study employs multivariate regression models with climate control variables (including temperature, precipitation, and wind speed) to isolate policy effects from meteorological influences. To better capture the relationships between fires and climate factors, fire counts and climate variables were analyzed separately for both annual (Figure S2) and peak fire seasons (Figure S7) across each geographical region. Based on the regression analysis results with climate control variables, the policy intervention demonstrates significant regional heterogeneity in its effectiveness, with statistically significant fire reduction effects observed in Central China, East China, South China, and Southwest China, while North China, Northeast China, and Northwest China show no significant policy impacts. Climate variables exhibit varying influences across regions. Temperature shows positive correlations with fire counts in most regions, precipitation consistently demonstrates negative effects across all regions, and wind speed displays mixed effects with negative impacts in most areas but positive effects in South and Southwest China. The models show good explanatory power (Tables S1 and S2) for Central China, East China, South China, and South west, while performing poorly for Northwest China, suggesting that factors beyond the included climate variables may be driving fire patterns in northwestern regions.
Both Central China and East China, characterized by cropland as the underlying surface for fire points, exhibit significant declining trends in fire activity. Figures S3 and S8 demonstrate that mean temperature anomalies during annual and peak fire seasons show a significant increasing trend in East China. According to WMO standards, temperature anomalies exceeding ±0.5 °C are typically classified as warm/cold conditions []. The reduction in fire points across Central and East China occurred during periods of normal or warm temperature conditions (post-2016), against a background of non-significant trends in precipitation and wind speed. This pattern suggests that policy interventions, rather than climatic factors, likely drove the fire reduction. Central China (Henan, Hubei, Hunan provinces) and East China (Shandong, Jiangsu, Anhui provinces) are major grain-producing regions where winter wheat is a primary crop. The peak in fire activity observed in June coincides with the winter wheat harvest []. However, with the consistent enforcement of straw burning bans since 2013, June fire occurrences in these provinces have seen a steep and sustained decline, demonstrating the bans’ effectiveness in curbing post-harvest burning. This finding is consistent with Wang et al., who noted that economically developed regions have greater capacity to enforce burning bans (e.g., by subsidizing straw recycling) []. These regions are also experiencing a marked reduction in farmland, especially in the eastern coastal region, due to rapid economic development and continual spread of urban infrastructure [].
Southwest and South China also show reduced fire activity alongside rising temperatures, as depicted in Figures S4 and S9. Despite being dominated by fire-prone natural vegetation, this fire reduction trend can likely be attributed to the effectiveness of integrated fire management. This conclusion aligns with the findings of Guo et al. (2023), who reported that while meteorological factors provide a significant background correlation with wildfires across southern China, their year-to-year variability appears to exert a limited direct influence on the decisive annual fire trends. Given the absence of a conclusive climatic driver, Guo et al. attributed the clear recent decline in fires primarily to strengthened forest preservation measures and enhanced integrated fire control capabilities in China []. The high frequency of fire occurrences in subtropical China can be attributed to three primary factors related to abundant forest fuel, a seasonal drought that dries these fuels, and dense human populations that provide ample ignition sources [,,]. Critically, over 95% of fires here are human-caused []. In this context, Xiong et al. (2020) emphasized that effective forest fire policy is the primary mechanism for mitigating human-induced ignition risks in Southwest China []. This principle was operationalized through a concrete regulatory framework, evolving from the national “Forest Fire Prevention Regulations” (enacted in 2009) to provincial-level statutes in Sichuan (2014) and Yunnan (2015) [,]. The establishment of this layered governance system enabled the systematic reduction of human ignition risks, which is corroborated by our observation that fire occurrences in Southwest China have been consistently declining since 2016.
Conversely, for Northeast China, Figures S5 and S10 reveals significantly increasing temperature anomalies that appear associated with rising fire activity. This connection is substantiated by Liu et al. (2023), who established that decreasing Bering Sea ice coverage contributes to increased fire occurrence in Northeast China by creating warmer and drier conditions []. More importantly, the increasing fire trend in Northeast China is also attributable to its role as a significant grain-producing area, where large volumes of straw are generated and alternative disposal methods remain limited []. From 2003 to 2022, the average proportion of cropland in Northeast China showed a consistent increasing tendency []. Accordingly, it is reasonable to link this region’s increasing fire occurrences to the expanding volume of crop residues, which has correlated with the rise in local crop yields, especially those from the expansion of corn cultivation []. In addition, agricultural fire management policies in Northeast China changed dramatically in recent years []. Northeast China exhibited a noticeable lag in responding to burning ban policies. Although local governments had introduced relevant regulations before 2018, enforcement remained weak at both provincial and municipal levels []. During 2018–2020, several cities in Jilin and Liaoning provinces established designated zones for complete prohibition or restricted burning of straw. At the same time, this region pioneered China’s first trials of organized planned burning during the 2019–2020 burning seasons. From 2021 to 2024, all three provinces in Northeast China updated their policies to implement comprehensive straw burning bans. However, the policy’s effectiveness appears to be constrained. The noticeable rebound of open burning in 2024 suggests that without addressing the fundamental challenges, such as the high cost of straw recycling for large-scale farms or adverse weather conditions delaying harvest, even stringent prohibitions may struggle to achieve sustainable compliance. It highlights the challenges of sustainable agricultural waste management in Northeast China.

3.2. Spatiotemporal Distribution of Active Fires Across Land Cover Types

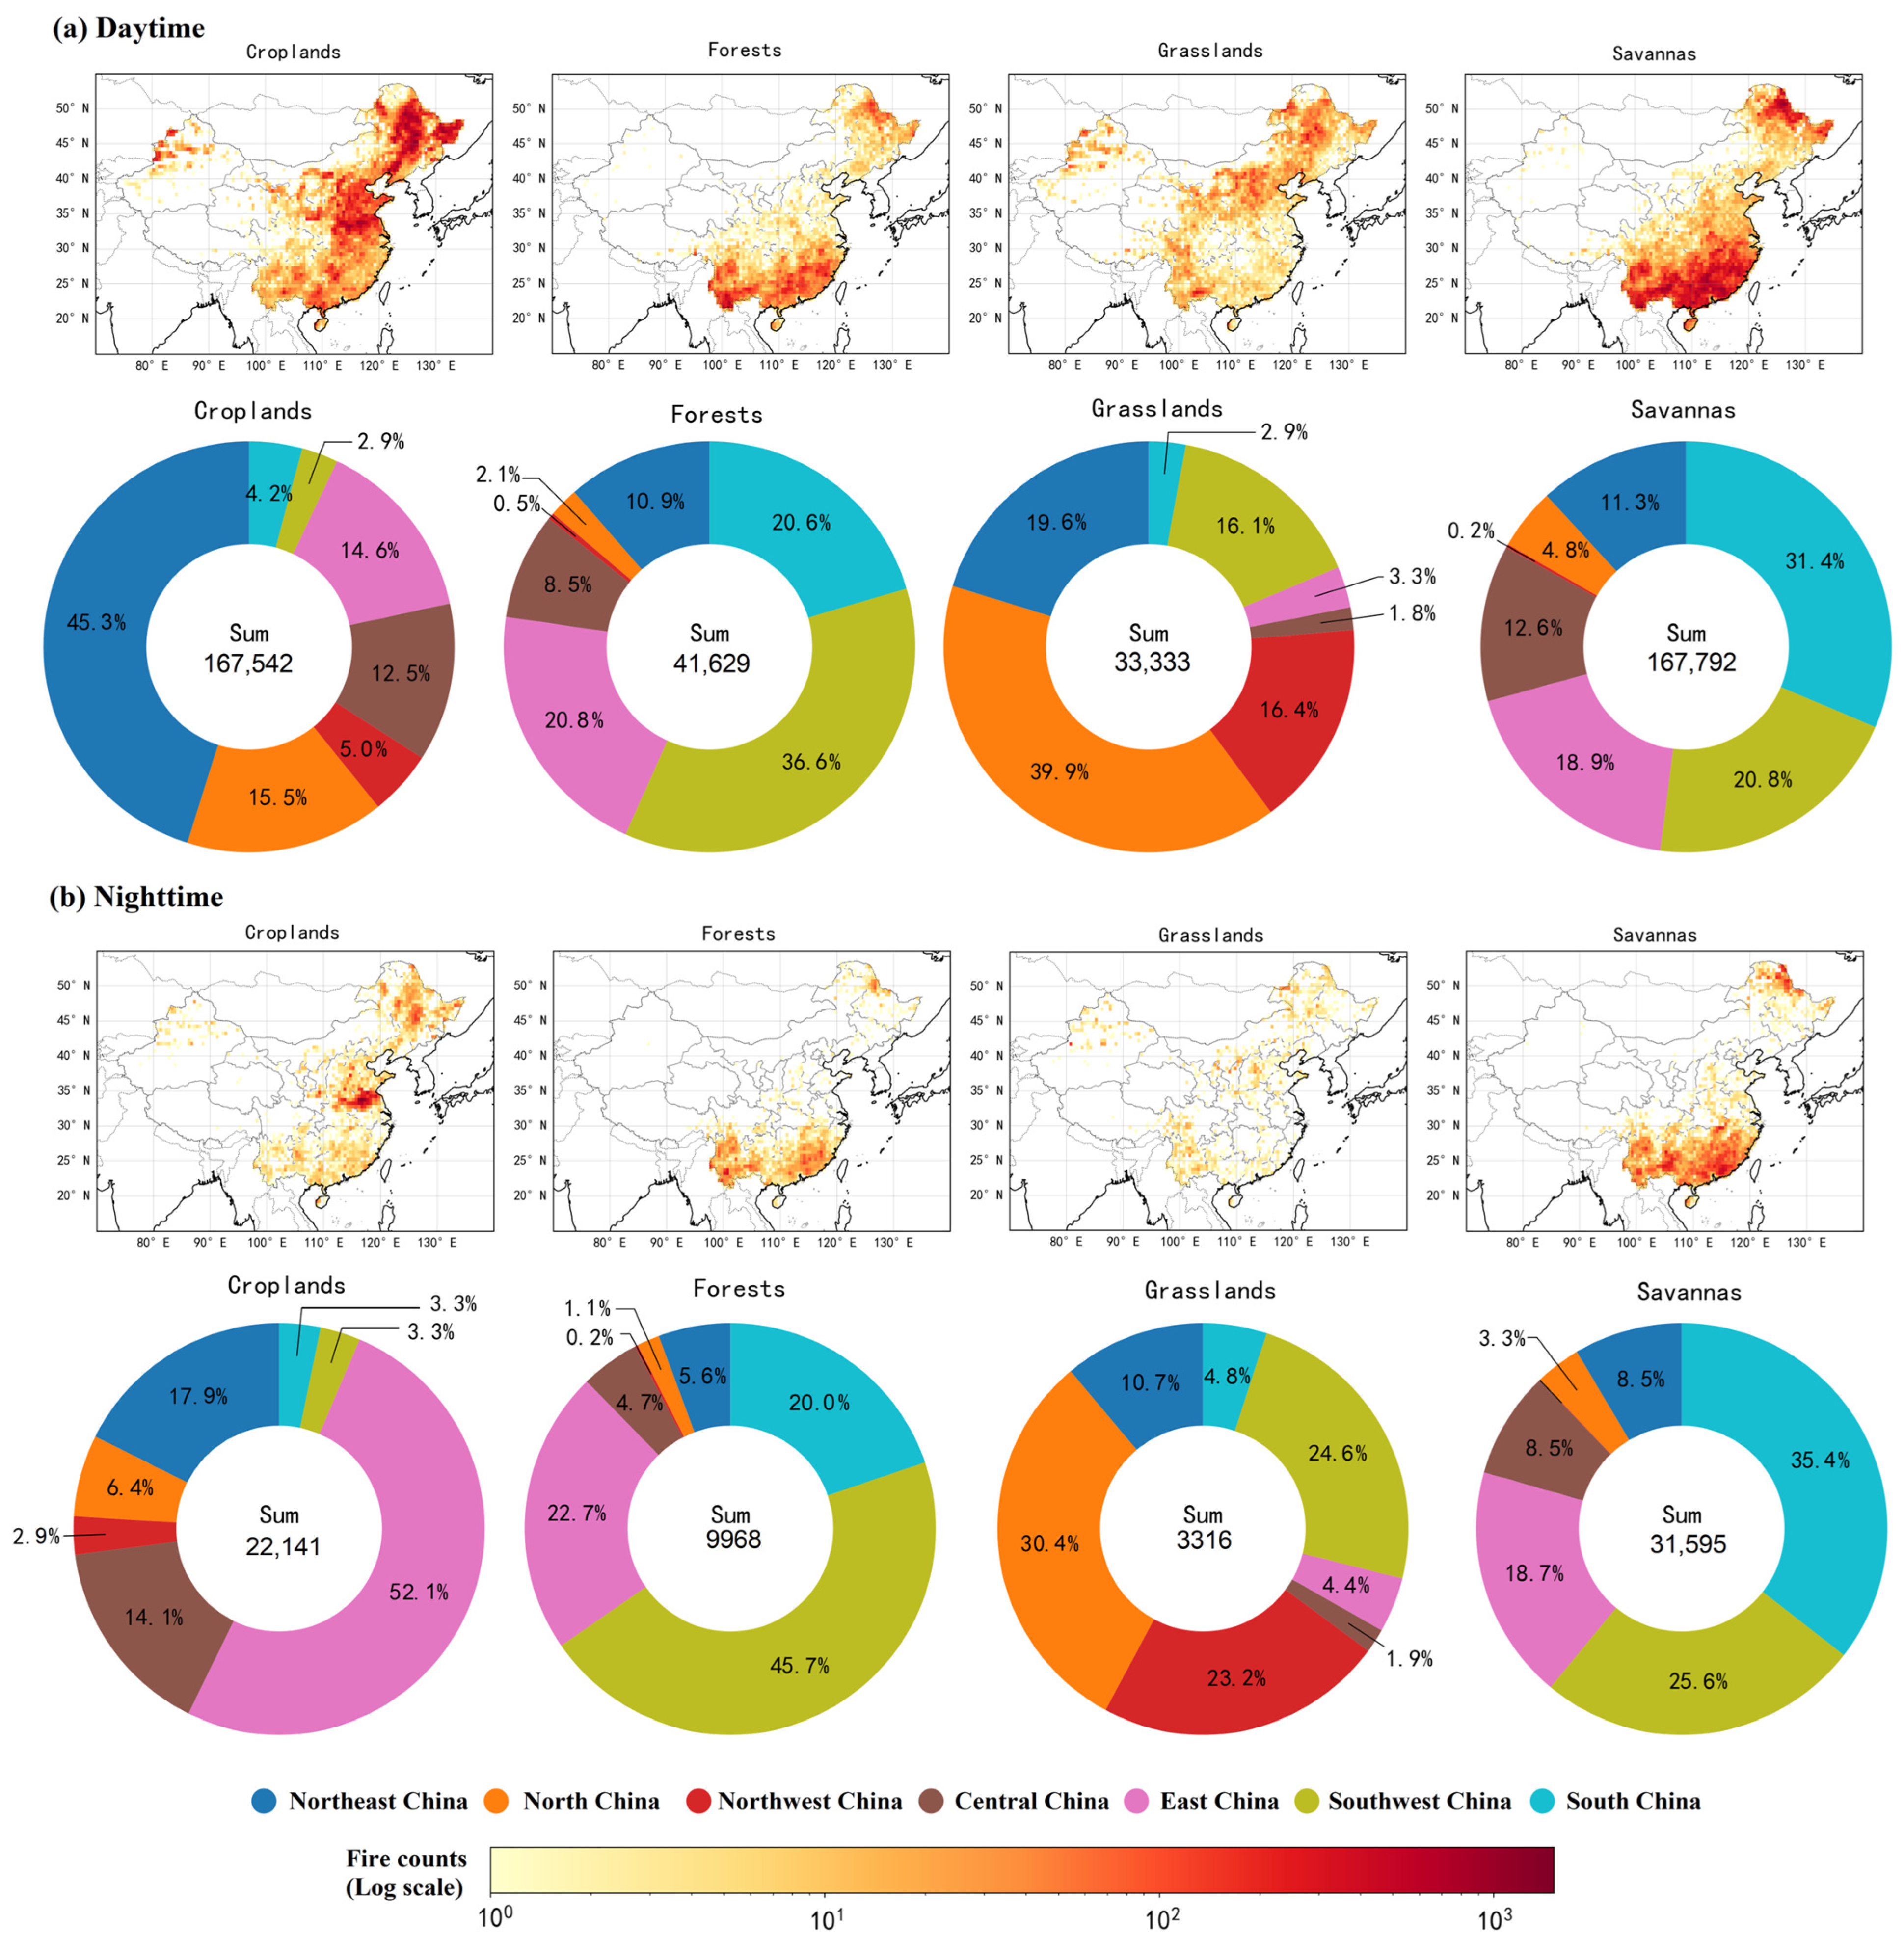
Figure 7 summarizes the temporal distribution of fire counts in China across land cover types, distinguishing daytime and nighttime patterns at annual and monthly scales. A clear and stable distribution across land cover types emerged over the 21-year period. Croplands and savannas collectively account for the majority of fire counts. The most striking feature is the overwhelming predominance of daytime fires (415,392) from 2003 to 2023, which outnumber nighttime occurrences (67,947) by a factor of six. This strong diurnal pattern firmly establishes human activity, particularly agricultural practices, as the primary driver of ignition sources rather than natural causes.
Figure 7. Temporal dynamics of (a,c) daytime and (b,d) nighttime fire counts by land cover type in China (2003–2023).
Croplands were identified as the dominant source, accounting for approximately 40.33% of daytime fires and 32.59% of nighttime fires, strongly pointing to sustained crop residue burning as a widespread and persistent practice. Daytime cropland fires peaked in spring (March–April) and autumn (September–November), consistent with pre-planting and post-harvest straw-management cycles. Nighttime cropland fires showed a peak in June, reflecting covert burning to evade daytime surveillance, though their overall magnitude remained smaller than daytime counts.
Savannas were also a high-frequency zone, representing 40.39% of daytime fires and the highest proportion of nighttime fires (46.5%), indicating a heightened risk of fires persisting and spreading after dark. Savannas have a clear concentration in fire occurrences from January to April. This highlights that the dry season in the non-monsoon period (approximately October to April) accumulated Savannas become dry and highly flammable, while from July to September, fire counts for savannas drop drastically.
Although forests accounted for a smaller share of daytime fires (10.02%) and nighttime fires (14.67%), their higher relative prevalence at night suggests a greater potential for fires to develop into sustained, damaging wildfires that are more difficult to control. Grasslands (8.02% daytime, 4.59% nighttime) and other land covers (1.23% daytime, 1.66% nighttime) play a secondary role in fire activity.
Based on the daytime and nighttime fire counts across different land cover types and regions in China in Figure 8, it shows that daytime fire counts are significantly higher than nighttime counts across all land cover types (Croplands, Forests, Grasslands, Savannas), with more distinct regional differentiation in daytime fire distribution, while nighttime fires tend to concentrate in specific regions and land cover types.
Figure 8. Spatiotemporal fire distribution of (a) daytime and (b) nighttime by land cover types and regions in China (2003–2023).
Croplands show a dramatic regional shift between day and night. During the day, Northeast China dominates with 45.3% of total cropland fires, followed by North China (15.5%), East China (14.6%), and Central China (12.5%). At night, however, East China becomes the absolute core, accounting for 52.1% of nighttime cropland fires, while Northeast China decreases to 17.9%.
Forests have the highest regional concentration, with Southwest China leading during both day (36.6%) and night (45.7%). East China (20.8% daytime, 22.7% nighttime) and South China (20.6% daytime, 20.0% nighttime) serve as secondary regions, while fire counts in North and Northwest China remain extremely low.
Grasslands are dominated by North China during the day (39.9%), with Northeast China (19.6%) and Southwest China (16.1%) as secondary regions. At night, North China still leads (30.4%), but Northwest China (23.2%) and Southwest China (24.6%) see notable increases, while Northeast China drops to 10.7%.
Savannas are consistently led by South China during the day (31.4%) and night (35.4%). Southwest China (20.8% daytime, 25.6% nighttime) and East China (18.9% daytime, 18.7% nighttime) are stable secondary regions, while Northwest China (0.3% daytime, 0.05% nighttime) have negligible fire counts.
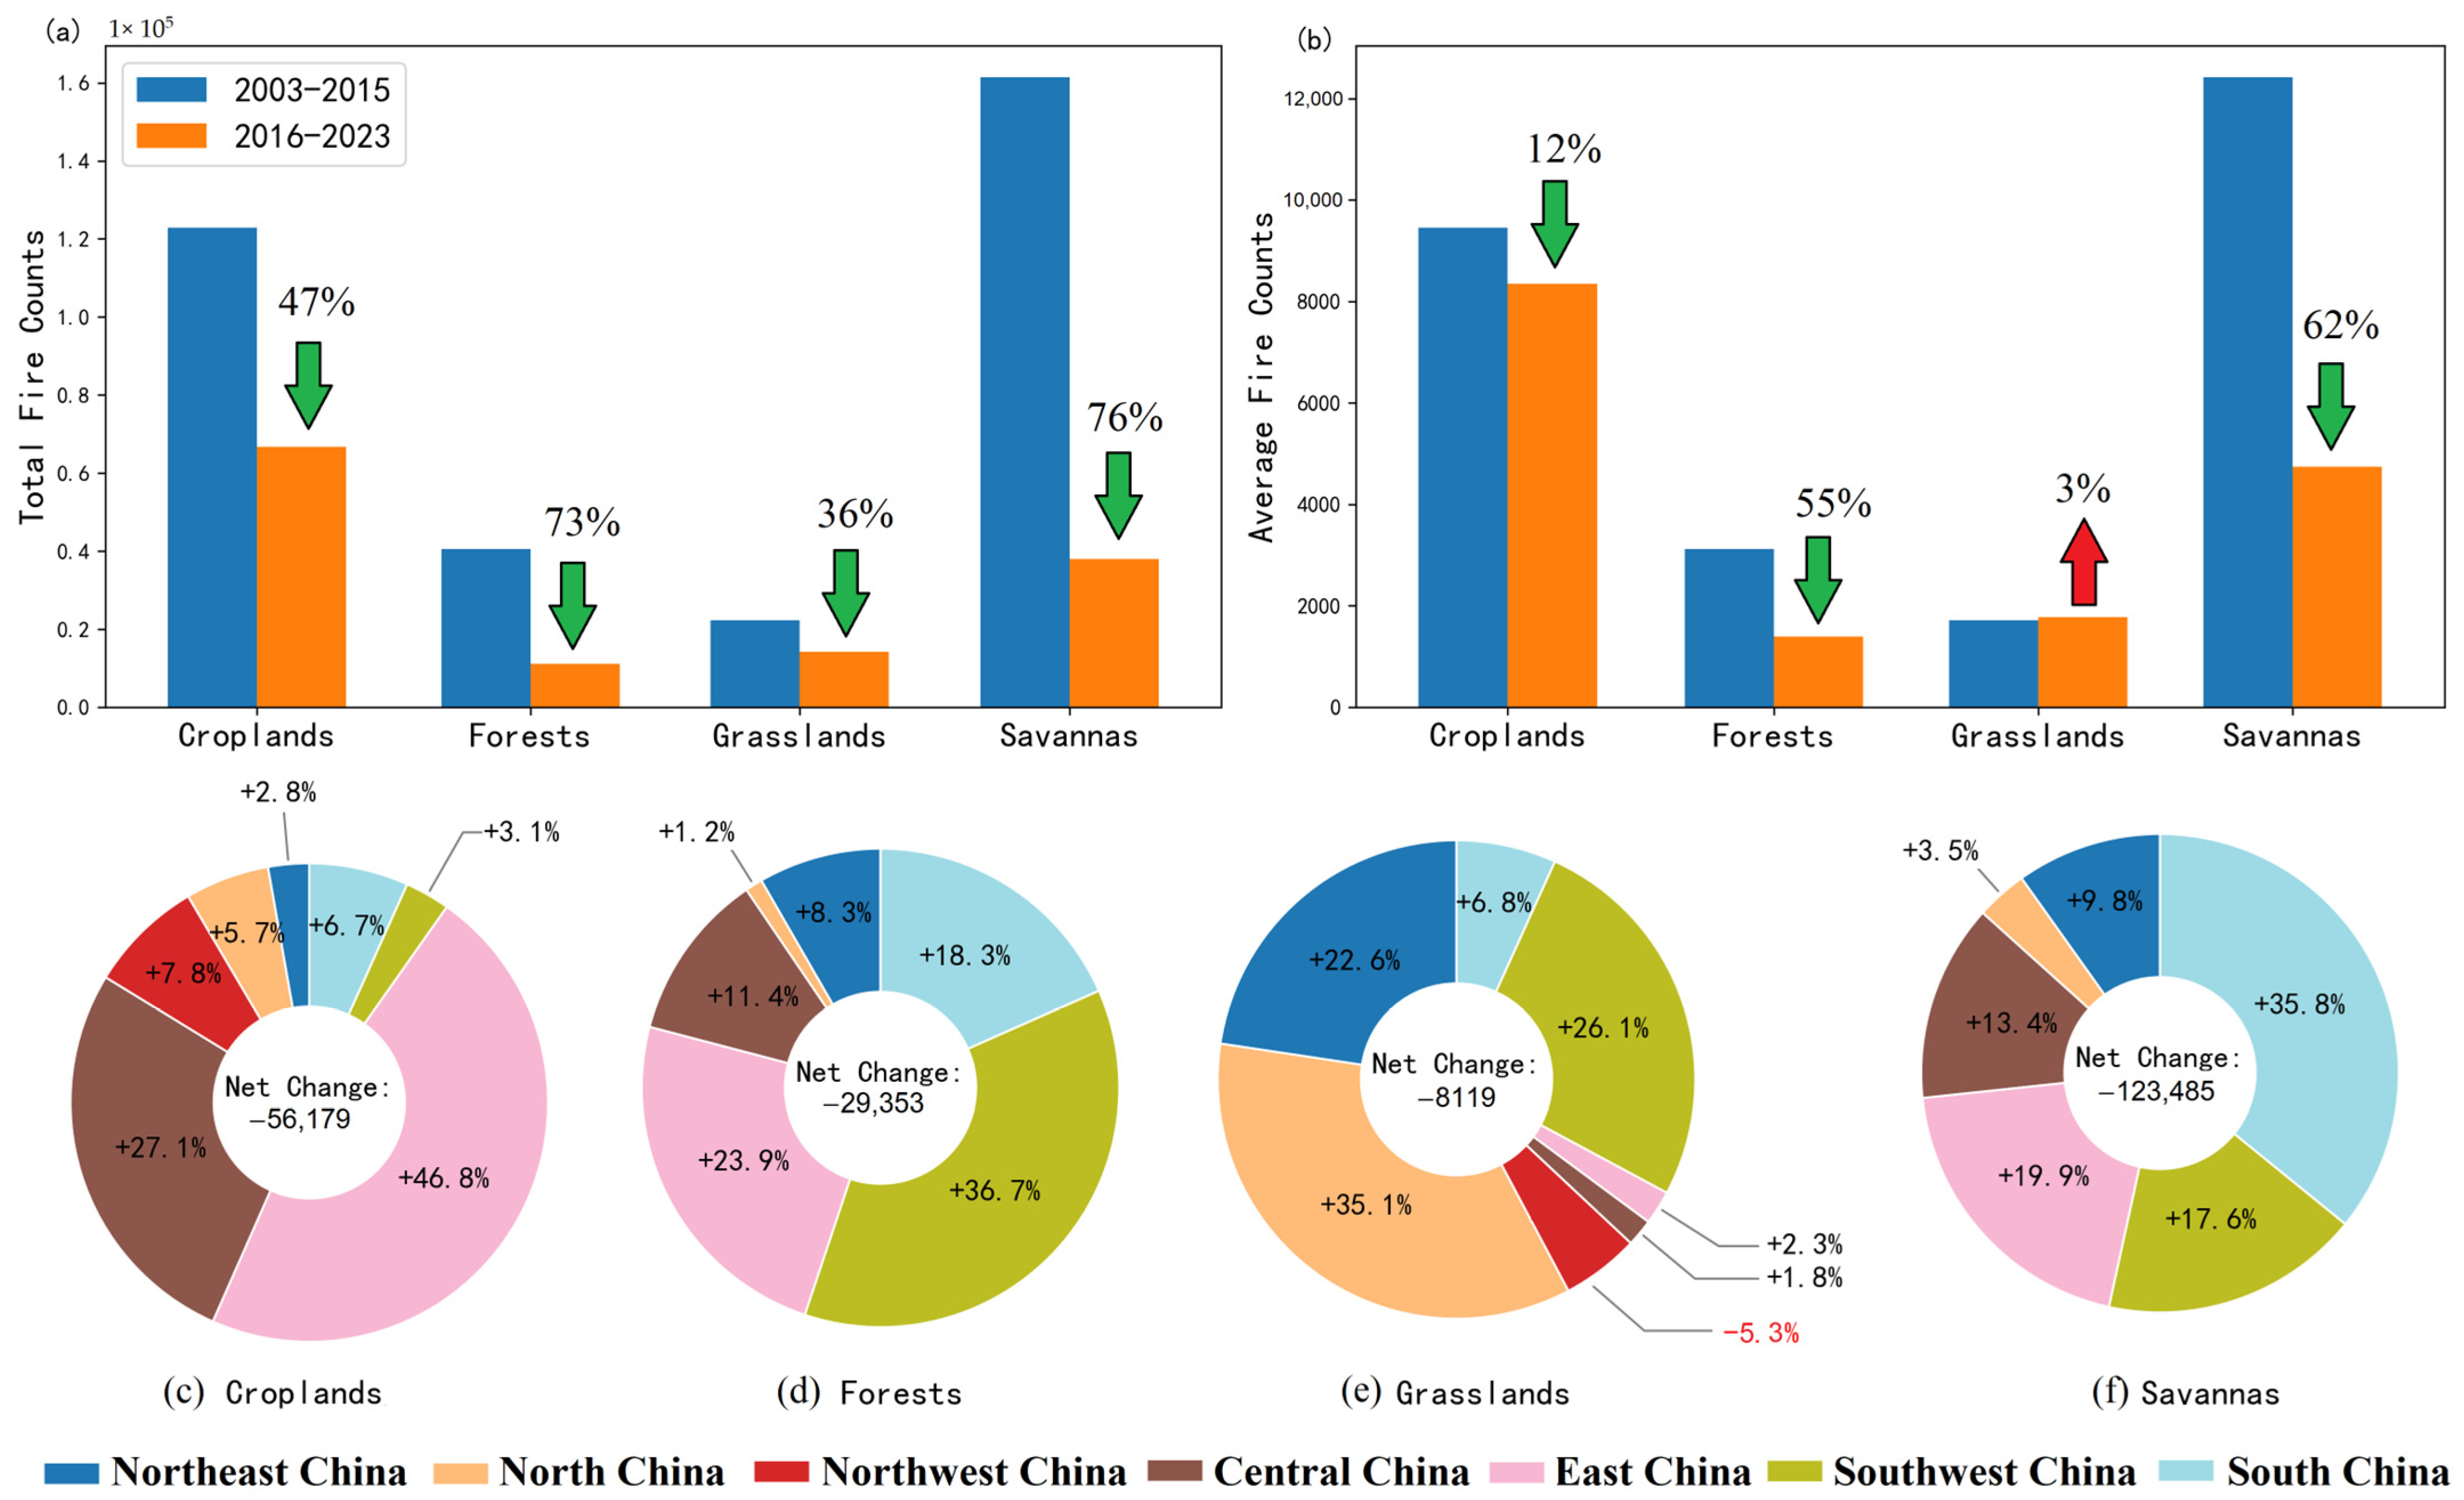
Figure 9a shows that from 2003–2015 to 2016–2023, total fire counts decreased across all land cover types in China. Croplands, forests, grasslands, and savannas all saw reductions, with the most significant declines in forests (73% drop) and savannas (76% drop). Croplands, forests, and savannas still showed decreases in annual fire counts (with 12%, 55%, and 62% drops, respectively) in Figure 9b. Despite a decline in total fire counts of grasslands during 2016–2023, its average fire counts increased by 3%. The different trends occur because the “total” is over the entire period, while the “average” is per year, and the length of the two periods is different (13 vs. 8 years).
Figure 9. Changes in (a) total fire counts and (b) mean annual fire count for each land cover type within the periods 2003–2015 and 2016–2023. Arrows indicate the percentage change in fire count between Period I (2003–2015) and Period II (2016–2023), with red and green representing an increase and decrease, respectively. Net changes in total fire counts and regional contribution rates between two periods across (c) croplands, (d) forests, (e) grasslands and (f) savannas. Contributions accounting for less than 1% are not labeled.
Figure 9c–f depict the net changes in fire counts between two periods across different land cover types and contributions from different regions. Croplands experience substantial fire count reductions across all regions, with the highest contribution proportion from East China (46.8%). Central China also has a relatively high contribution proportion (27.1%). This suggests that the straw burning bans in East China and Central China have had a significant impact on reducing cropland fires. Although all regions show a decrease, the contribution proportions vary, indicating that fire reduction efforts in croplands are regionally diverse but generally effective.
Forests show a widespread decline in fire counts. Southwest China has the highest contribution proportion (36.7%). The contribution proportions vary by region, with East China (23.9%) and South China (18.3%) also making contributions to the overall reduction in forest fires.
Savannas show substantial reductions in fire counts. South China has the highest contribution proportion (35.8%), indicating that this region has had a major impact on reducing savanna fires. The contribution proportions vary, with East China (19.9%) and Southwest China (17.6%) also making notable contributions to the overall reduction in savanna fires.
The primary regional contributions to grassland fire reduction came from North China (35.1%), Southwest China (26.1%), and Northeast China (22.6%). In contrast, Northwest China recorded a negative contribution of −5.3%, indicating a net increase in grassland fire activity in the region. This increase is likely driven by a combination of environmental and anthropogenic factors. Environmentally, Northwest China has experienced a trend towards hotter and drier conditions [], as shown in Figures S5 and S10, which increases grassland susceptibility to ignition []. Concurrently, land-use change has played a critical role, with a net loss of grassland primarily to cropland conversion []. This expansion of agricultural frontiers into grassland areas elevates fire risk, as approximately 80% of grassland fires occur within 10 km of cultivated land []. Ultimately, these factors converge through human activity. Evidence from Qinghai Province demonstrates that grassland fires are overwhelmingly anthropogenic, with ignitions stemming from sources such as faults in high-voltage power lines, heating activities associated with grazing, and the use of firecrackers []. Thus, the interplay of a drier climate, agricultural expansion, and prevalent human ignition sources collectively explains the rising trend of grassland fires in Northwest China.
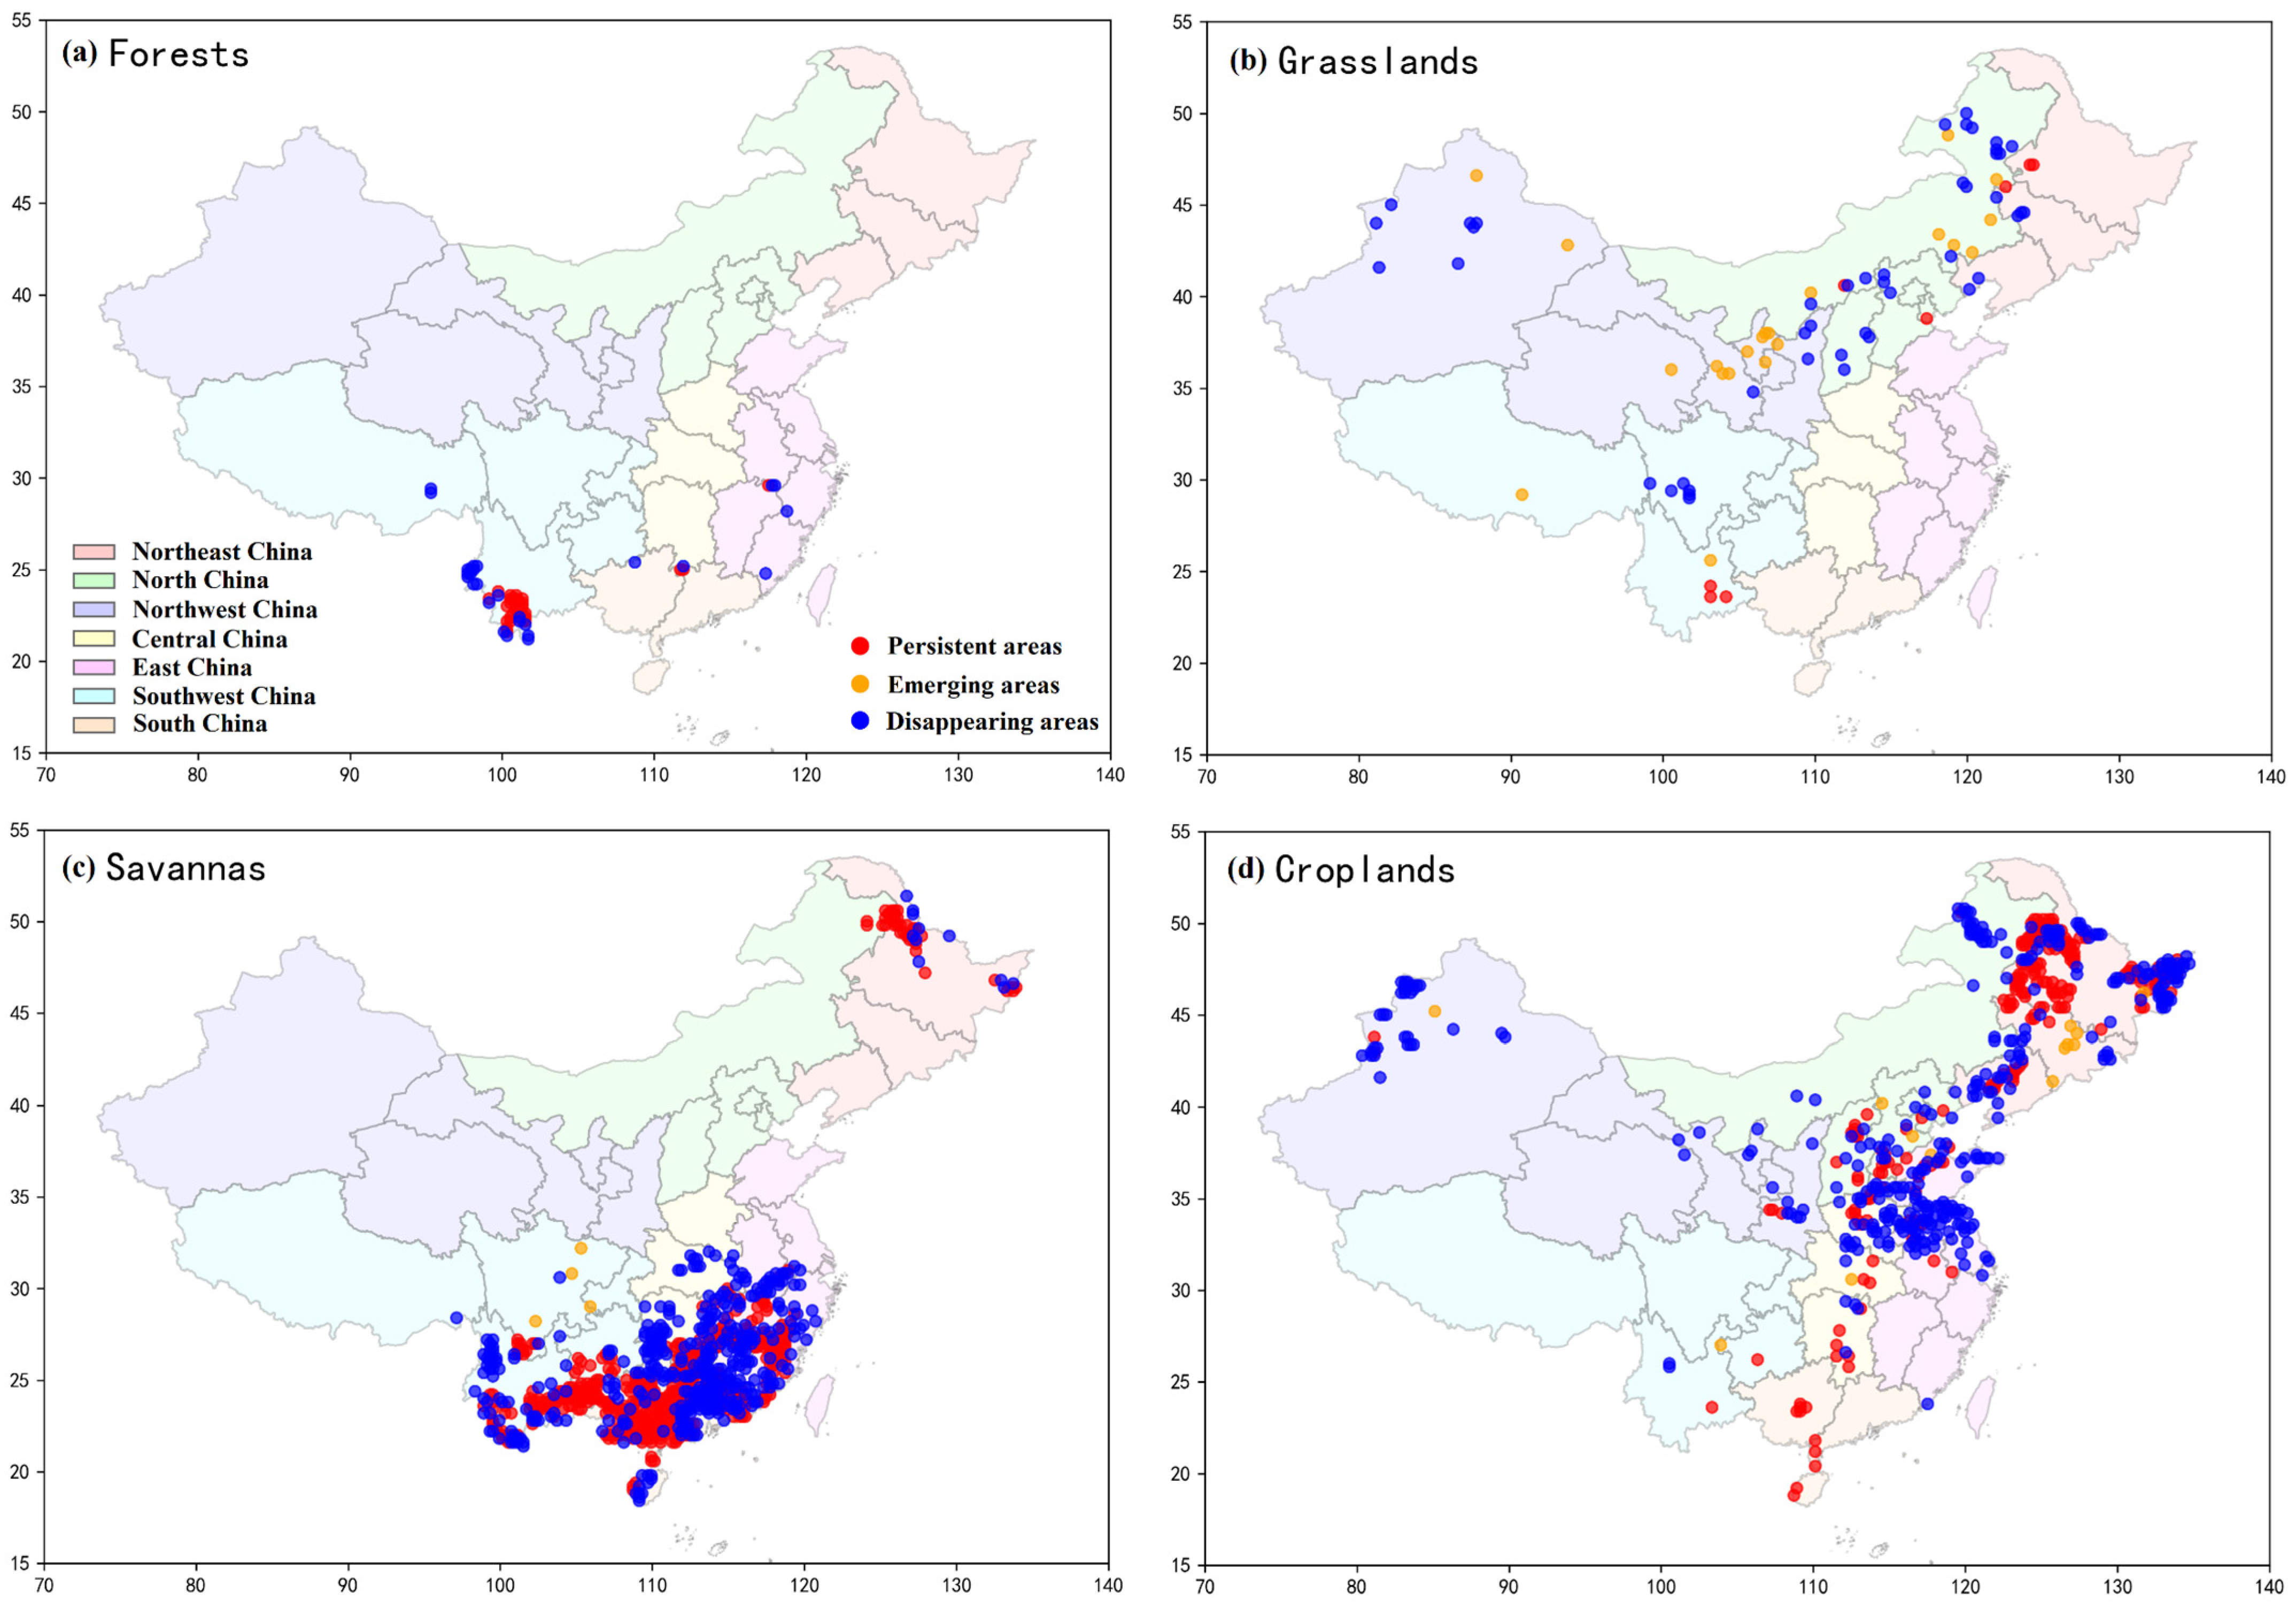
Figure 10 illustrates the fire dynamics of four land cover types. According to the Section 2.3.3, it is categorized into persistent fire areas, emerging fire areas, and disappearing fire areas. Persistent forest fires areas are highly concentrated in Southwest, reflecting long-term fire risks. Disappearing forest fires spots are scattered in Southern China. Disappearing grassland fire areas are centered in Western China, yet this region has shown emerging spots in recent three years (2021–2023). This finding is consistent with the observation that grassland fire counts in Northwest China increased during 2016–2023. Persistent savanna fires areas are intensely concentrated in Southern and Northeast China, with overlapping disappearing areas, indicating a reduction trend but remaining high-risk zones. The overlap between disappearing cropland fire areas and persistent areas in Northeast and Central China indicates that although farmland fires are under control, fire risks in major agricultural production areas persist. Disappearing cropland fire spots are mainly distributed in East China, which is consistent with the observation that East China made the largest contribution to the national reduction in cropland fire counts during 2016–2023.
Figure 10. Classification of daytime fire dynamics by land cover types in China.

3.3. Spatiotemporal Dynamics of Fire Radiative Power in China

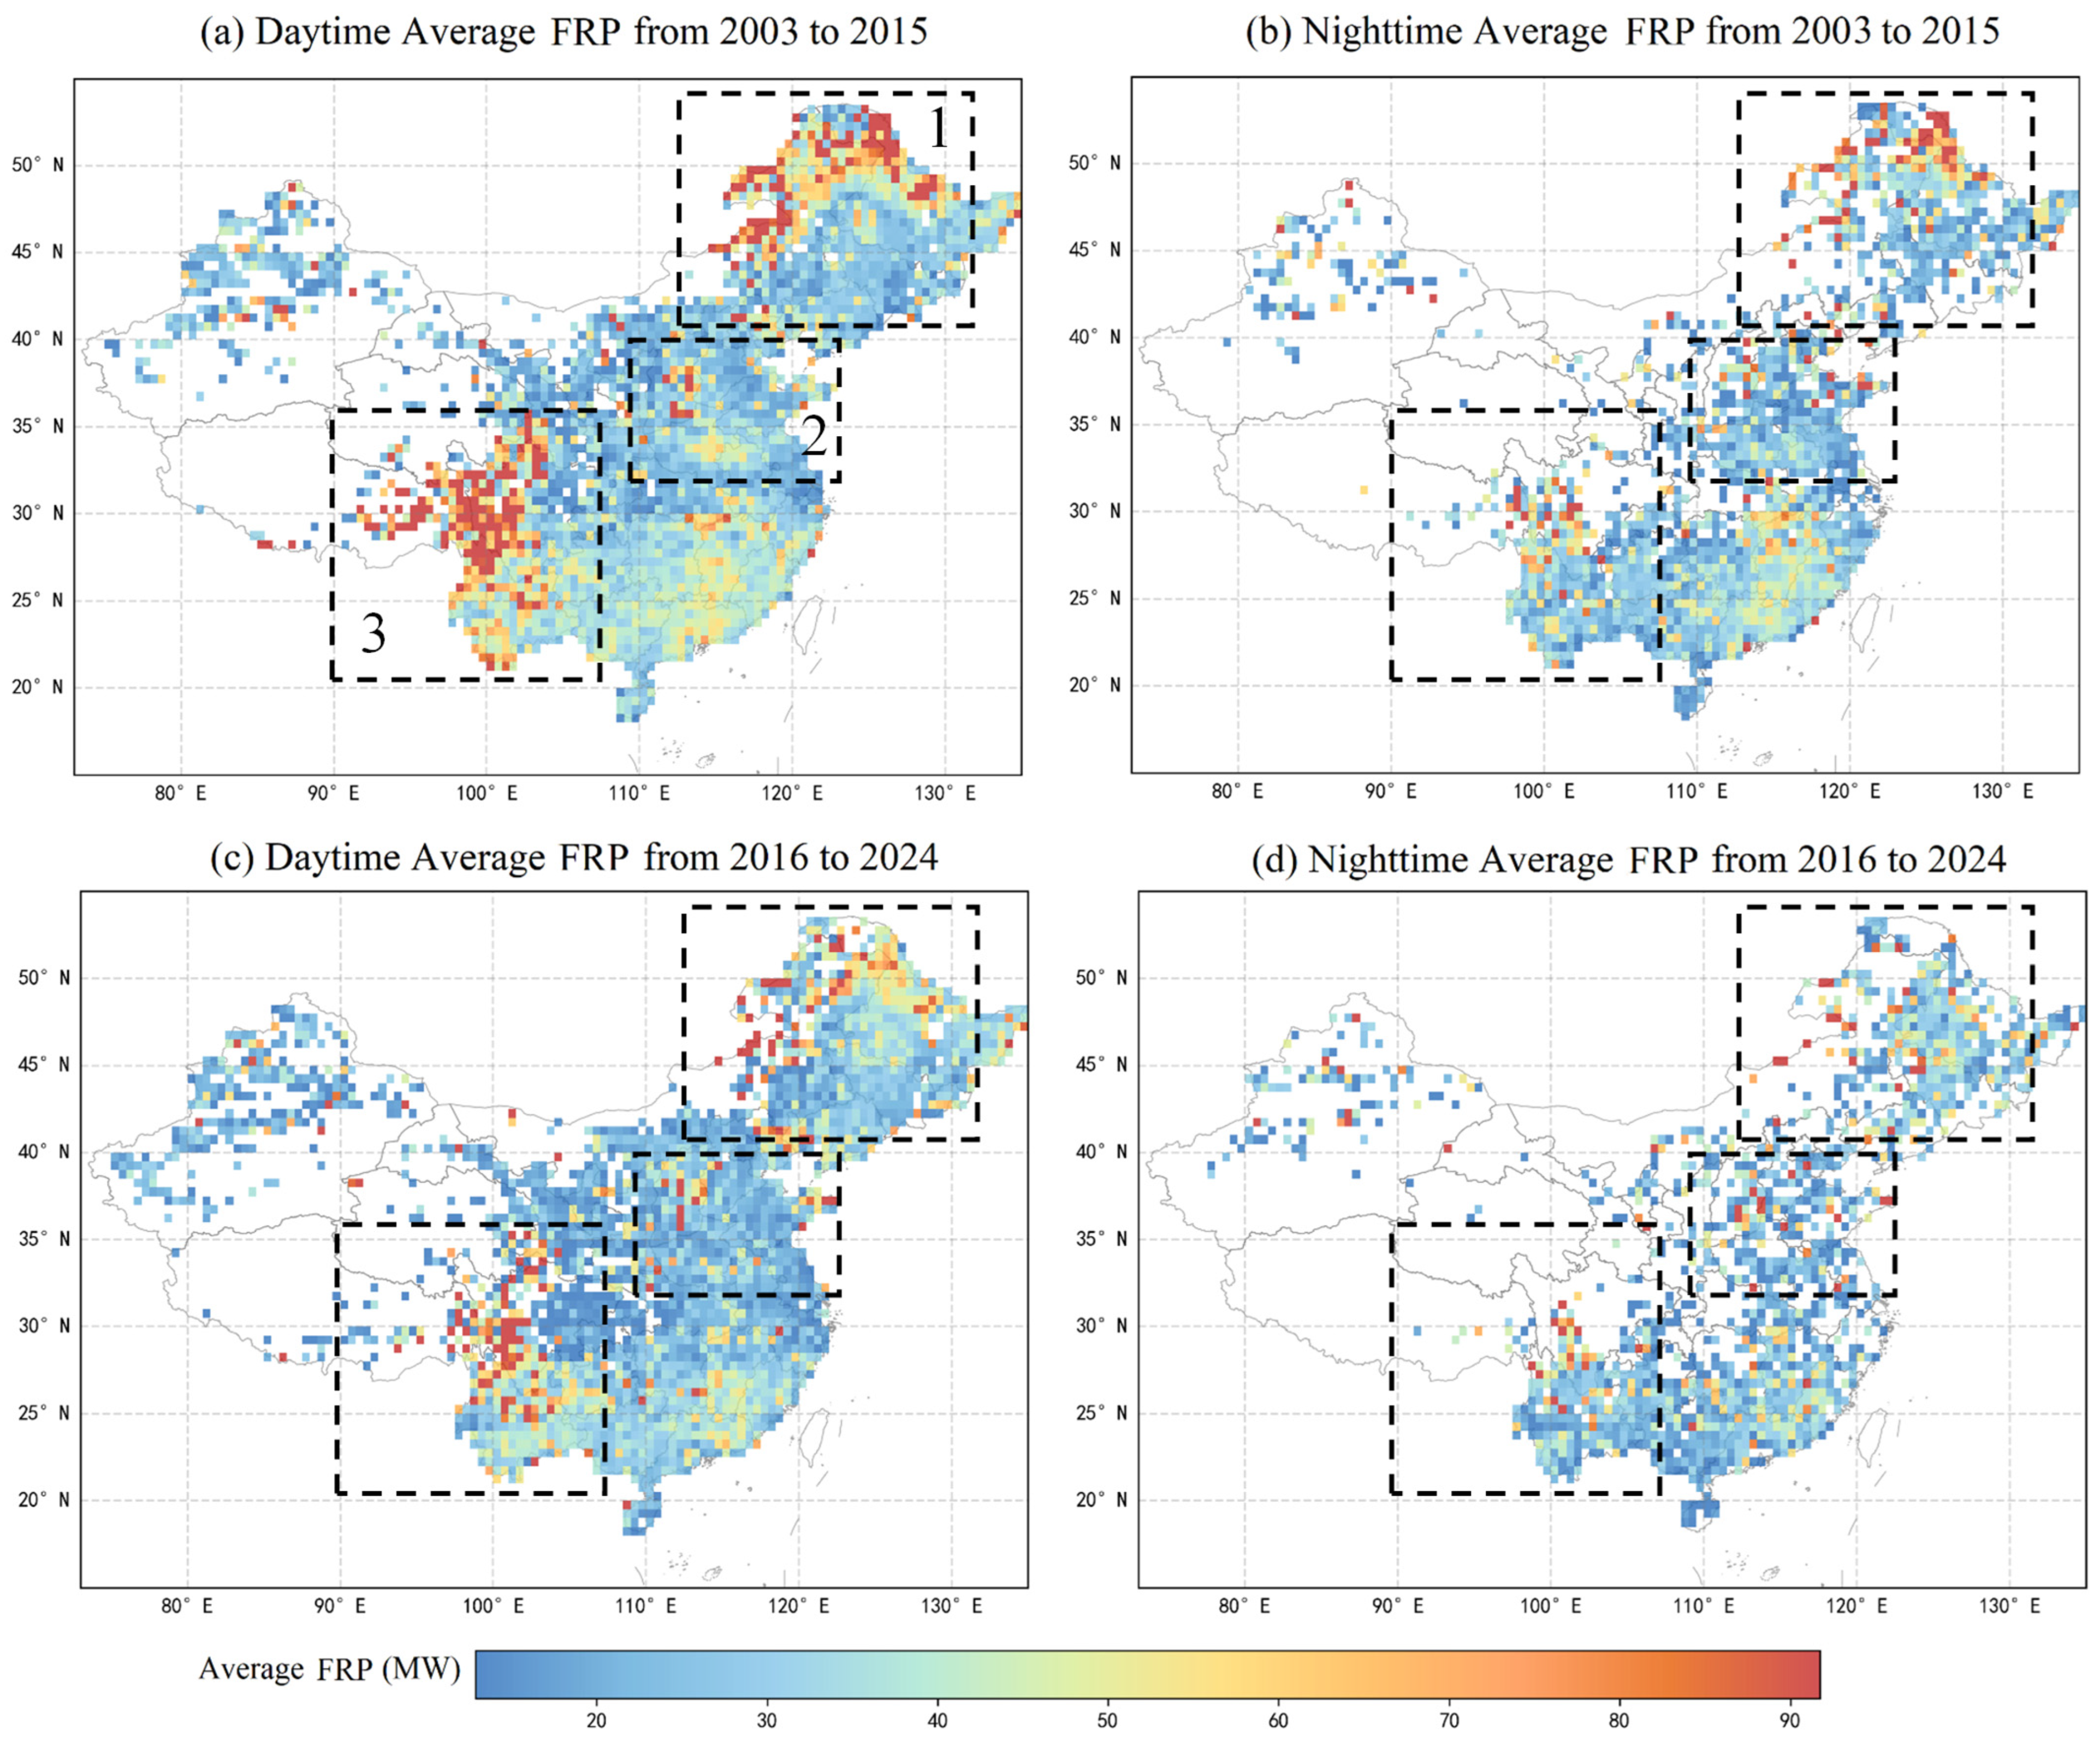
Figure 11 illustrates the spatial and temporal variations in average fire radiative power (FRP, unit: MW) at 0.5° × 0.5° resolution across China.
Figure 11. Map of (a,c) daytime and (b,d) nighttime average fire radiative power (FRP) in China (2003–2015 vs. 2016–2024) at 0.5° × 0.5° grid resolution. The numbered rectangles (1–3) indicate the study regions: (1) Northeast China, (2) North China, (3) Southwest China.
In general, from 2003–2015 to 2016–2024, high-FRP zones contracted sharply across all regions, while low-FRP zones expanded, indicating a nationwide decline in fire intensity. Across both periods, daytime FRP was significantly higher than nighttime FRP. During 2003–2015, daytime high-FRP zones were concentrated in three main regions, Northeast China (rectangle 1), North China (rectangle 2) and Southwest China (rectangle 3). Low-FRP zones dominated Northwest China (Xinjiang, Qinghai). Nighttime high-FRP zones were drastically reduced compared to daytime, with only sporadic spots remaining. During 2016–2024, a striking contraction of daytime high-FRP zones was observed in three main regions mentioned above. Considering the differences in land cover types across regions, this suggests that Southwest China (rectangle 3) implemented improved fire management (e.g., stricter forest fire prevention), while Northeast China (rectangle 1) and North China (rectangle 2) achieved effective suppression of high-energy daytime fires, likely due to straw burning bans.
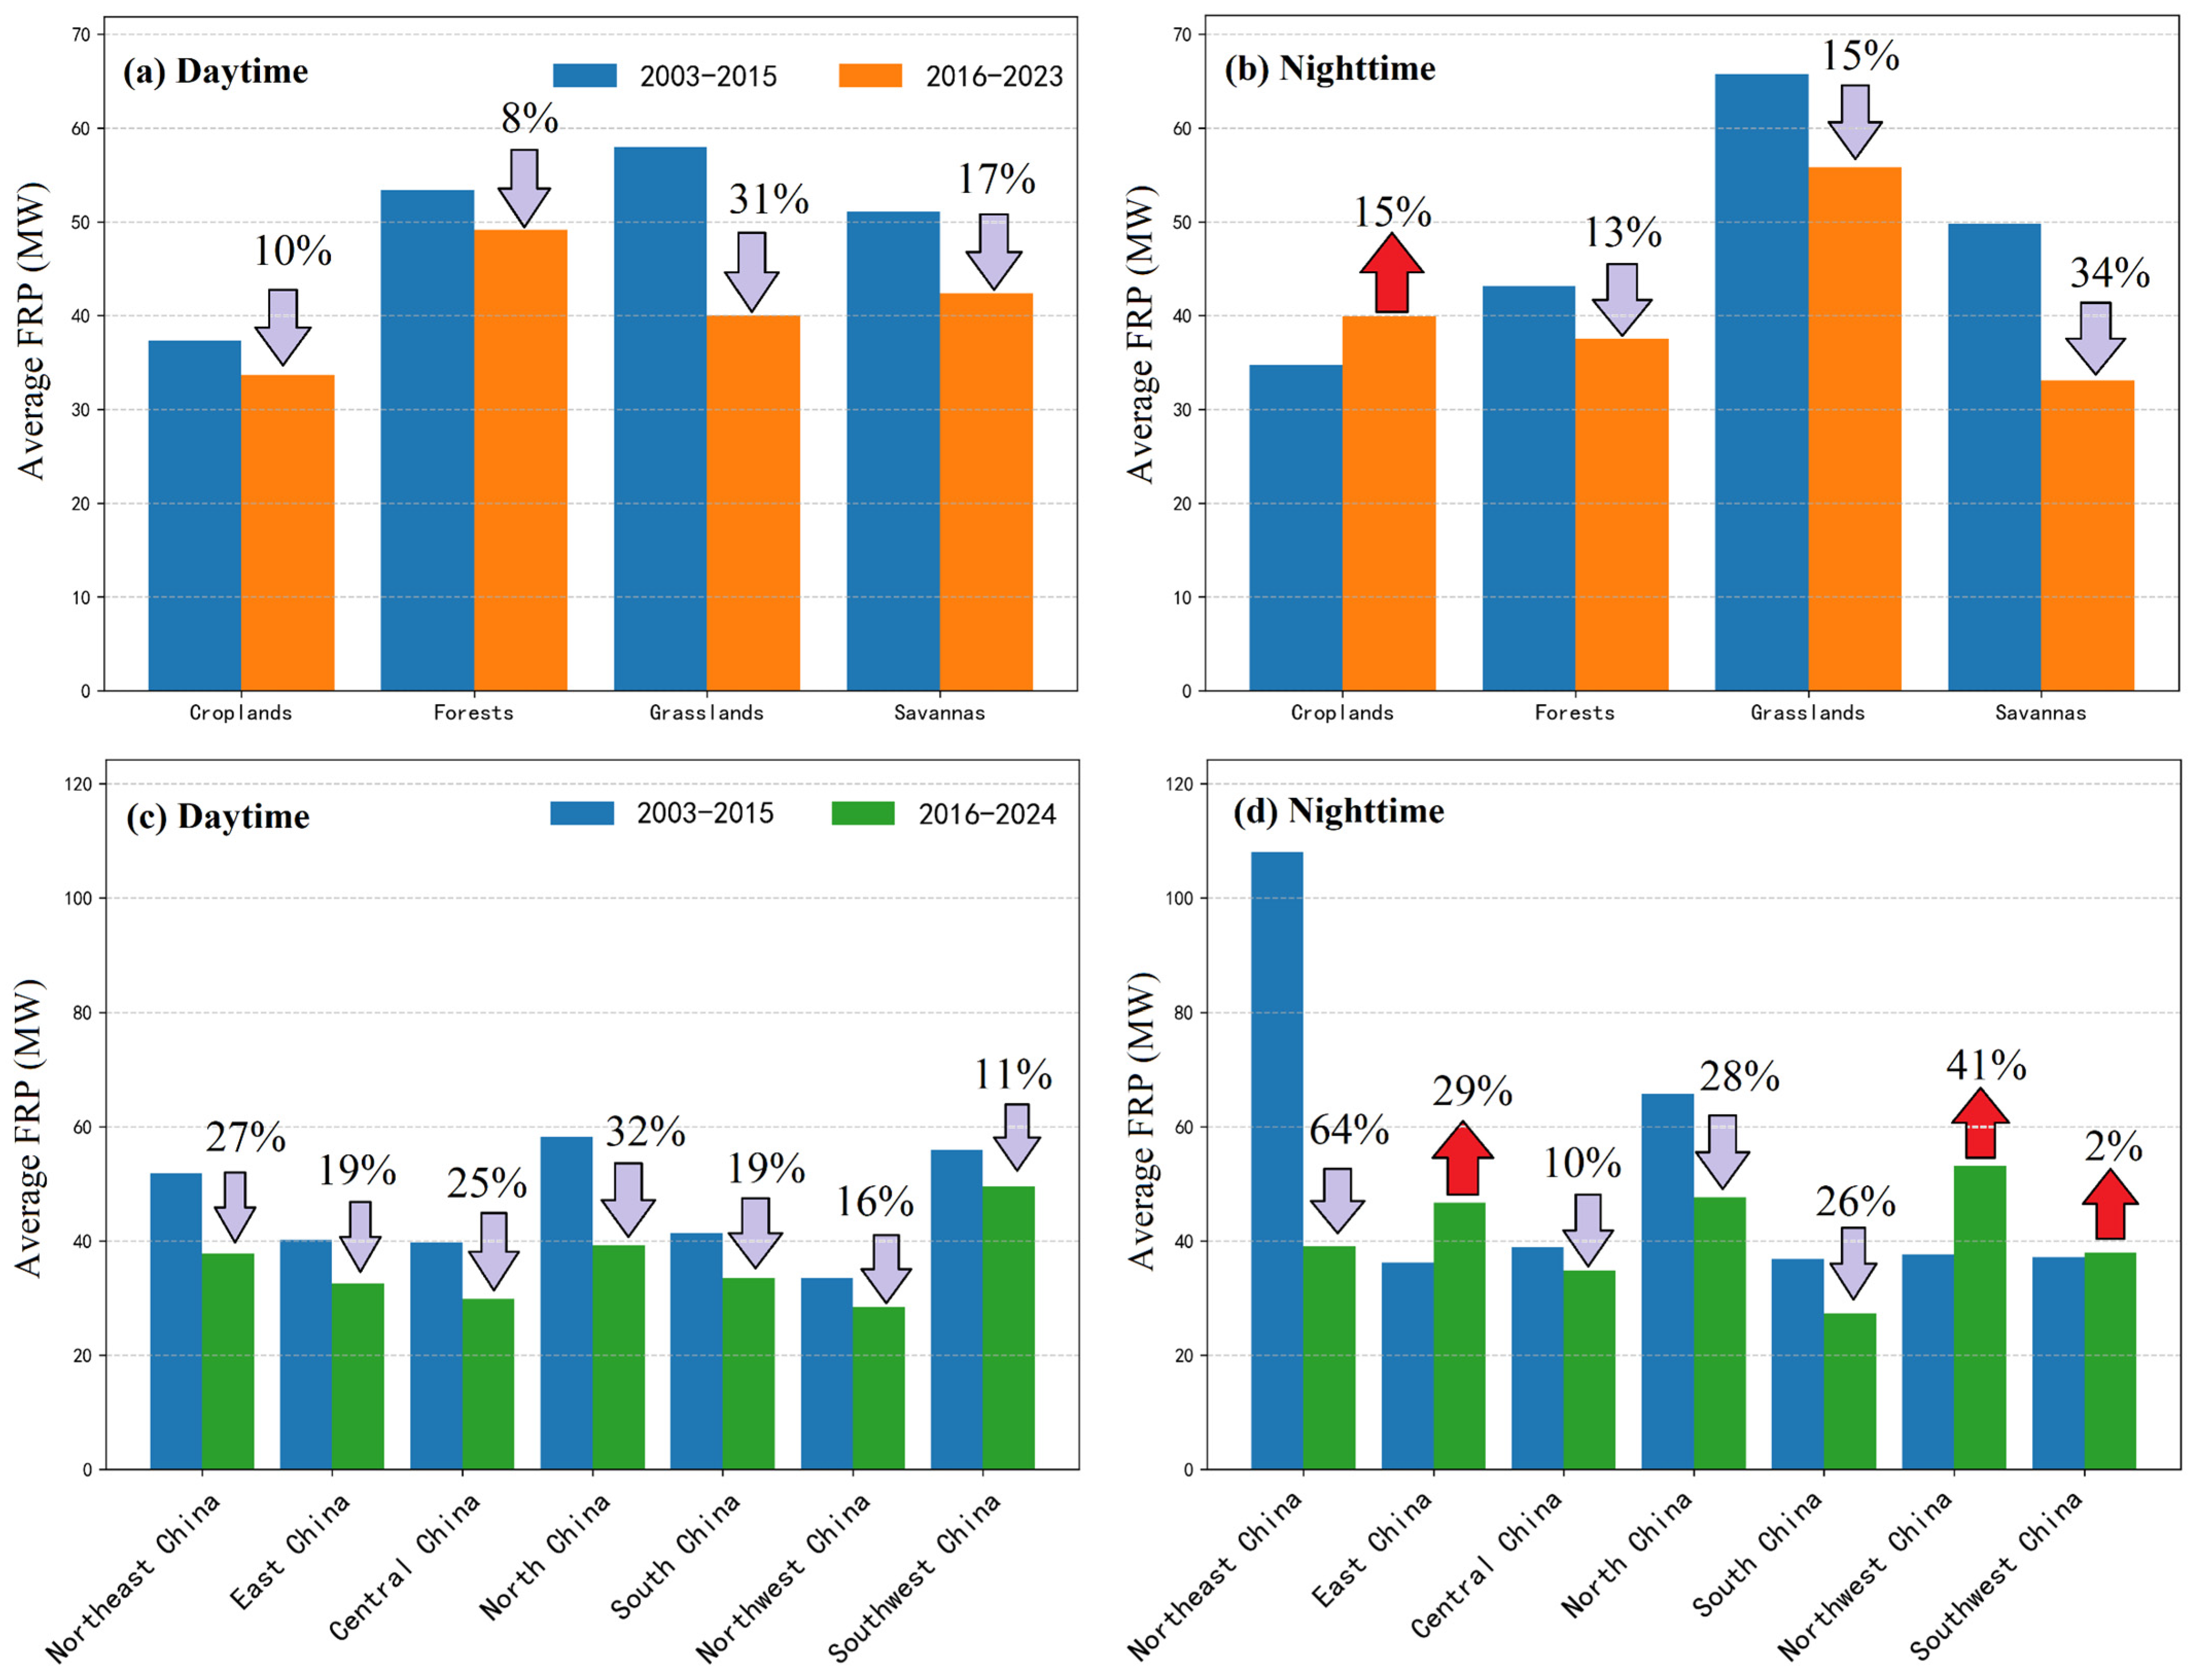
Figure 12 reveals FRP variations across different land cover types. The average FRP of daytime agricultural fires decreased 10% since 2016. This provides compelling evidence that crop residue burning bans were highly effective not only in reducing the number of fire events but also in diminishing fire strength and severity. In contrast, the average FRP of nighttime agricultural fires increased by 15%. It indicates that farmers have shifted their burning practices to nighttime to evade daytime enforcement, and extreme crop residue burning incidents are more likely to occur at night due to the lack of human intervention. Grasslands demonstrated considerable FRP declines both during the day (−31%) and at night (−15%). Savannas also exhibited improvement, especially at night (−34%). Forests showed reductions at daytime by 8% and at nighttime by 13%.
Figure 12. FRP changes in (a,c) daytime and (b,d) nighttime by land covers and regions in China during different periods. Arrows indicate the percentage change in average FRP between different periods, with red and purple representing an increase and decrease, respectively.
Geographically, traditional fire-prone regions like Northeast and North China showed the most substantial daytime FRP declines (−27% and −32%, respectively). Northeast China’s nighttime FRP decreased by 64%, but it is crucial to note that its baseline 2003–2015 nighttime FRP (108 MW) was vastly higher than any other region, suggesting it was previously a hotspot for intense nighttime fires that have now been effectively mitigated. The cases of Northwest China and East China are especially concerning, while their daytime FRP decreased by 16% and 19%, respectively, their nighttime FRP surged dramatically by 41% and 29%.

4. Discussion

This study provides a comprehensive spatiotemporal analysis of active fires across China from 2003 to 2024, revealing a significant national decline in fire activity since 2016, accompanied by a marked geographical shift in fire hotspots. While our results descriptively document these patterns, their deeper interpretation offers critical insights into the complex interplay of anthropogenic policy and regional environmental contexts in shaping contemporary fire regimes.

4.1. The Dominant Role of Policy and Its Regional Heterogeneity

The step-change decline in national fire counts observed after 2016 strongly suggests a systemic intervention rather than a gradual environmental shift. The most compelling evidence for the causal role of the straw burning bans lies not merely in the temporal coincidence, but in the spatial congruence between policy enforcement intensity and fire reduction magnitude. The dramatic decline in East China (65% decrease in average fires), which issued the most policies, contrasts sharply with the increasing fire activity in regions with weaker enforcement, such as Northeast China. This spatial disparity creates a powerful quasi-natural experiment, indicating that the policy signal overrode broader, nationwide trends.
The effectiveness of these bans appears to be mediated by a region’s socioeconomic capacity and agricultural structure. In economically developed regions like East China, the policy was likely bolstered by the financial ability to subsidize straw recycling technologies and stricter enforcement mechanisms [,]. Additionally, the transition from staple crop cultivation to higher-value activities, such as vegetable farming, orchard cultivation, or livestock production, may reduce the biomass available for burning, especially in economically marginal agricultural areas [,]. Conversely, in Northeast China, a major grain-producing area with increasing volumes of crop residue from the expansion of corn cultivation [], the initial lag and inconsistent enforcement of bans [], coupled with limited alternative disposal methods [], resulted in a significant increase in fire counts. This highlights a critical limitation of top-down environmental mandates: their success is contingent on local capacity and the availability of feasible alternatives for stakeholders. The subsequent policy tightening in Northeast China after 2018 and the observed suppression of fires provide a dynamic view of policy evolution and its delayed impact, underscoring that policy effectiveness is a process, not a single event.

4.2. Land Cover Specificity and the Phenomenon of Temporal Displacement

Our land cover analysis clarifies that the observed national trend is primarily driven by changes in fire activity over croplands and savannas. The substantial reduction in cropland fires, contributing the largest share to the national decline, is a direct testament to the targeted nature of the straw burning bans. However, a more nuanced story emerges from the diurnal analysis. The significant reduction in daytime cropland fires, accompanied by a decline in their average Fire Radiative Power (FRP), indicates successful suppression of large-scale, open burning. In contrast, the increase in nighttime FRP for agricultural fires in regions like East and Northwest China points to a potential temporal displacement of fire activity. This suggests that while the policy effectively curtailed overt burning, it may have inadvertently encouraged burning under the cover of darkness, where farmers resort to fewer but potentially more intense fires to evade daytime surveillance. This behavioral adaptation reveals a limitation of satellite-based policy monitoring and underscores the need for complementary nighttime enforcement strategies.
For natural vegetation, the substantial declines in savanna and forest fires, particularly in Southern and Southwestern China, likely reflect enhanced forest fire prevention measures and the implementation of layered legal frameworks []. The high concentration of persistent fire areas in these regions aligns with their ecological predisposition to fire, characterized by abundant biomass, seasonal drought, and high human population density []. The success in reducing fires here demonstrates that well-funded, integrated fire management can mitigate risks even in inherently fire-prone ecosystems.

4.3. Implications for Fire Management and Climate Adaptation

Our findings carry significant implications for environmental governance in China. The stark regional disparities in policy outcomes argue strongly against a “one-size-fits-all” approach to fire management. Future policies must be regionally tailored, considering local economic structures, agricultural practices, and ecological contexts. For instance, in major grain-producing regions like Northeast China, policy must be coupled with robust investments in straw recycling infrastructure and economic incentives, moving beyond purely punitive measures.
Furthermore, the interplay between human policy and climatic drivers cannot be ignored, while our study design cannot fully disentangle their effects. Climate change may undermine policy effectiveness in some regions while amplifying fire risks in others []. Therefore, future fire management must integrate climate adaptation strategies, anticipating how climate change might alter regional fire susceptibilities.

4.4. Limitations and Future Research

This study has several limitations that should be considered when interpreting the results. First, our finding of a marked increase in nighttime fire FRP in some regions (e.g., East China), despite a decrease in nighttime fire counts, lends indirect support to the existence of covert burning. This practice, potentially involving fewer but more intense fires to dispose of accumulated straw at nighttime, is consistent with the limitations of MODIS in detecting smaller fires. While our data cannot fully quantify this shift to smaller fires, the observed intensity increase in remaining nighttime fires highlights an unintended consequence of the policy and the need for enhanced nighttime surveillance. Furthermore, the use of the combined Terra-Aqua fire product introduces a known diurnal bias. Because agricultural burning often occurs in the mid-morning and is short-lived, the Aqua satellite (13:30 local time overpass) may be more effective at detection than Terra (10:30). Consequently, our fire count time series may be more representative of afternoon fire activity. The MCD12Q1 land cover product employed in this study carries inherent classification uncertainties, particularly in heterogeneous agricultural landscapes. As noted by Li et al. (2025), transitional vegetation types such as temperate savannas in northeastern China may be subject to misclassification []. These classification inaccuracies could potentially influence the results of land type-specific fire analysis.
Second, our study highlights the critical need to integrate quantitative climate and socioeconomic data to move from correlation to causation. While we argue for the primacy of the policy signal based on spatiotemporal patterns, a formal causal inference would require integrating gridded meteorological data (e.g., temperature, precipitation, drought indices) and data on enforcement intensity (e.g., fines distributed, subsidy levels) into a multivariate modeling framework. The absence of these variables limits our ability to precisely quantify the contribution of climate variability versus policy intervention.
Future research should integrate higher-resolution data, climate variables and human activities to better predict fire behavior. This study is a crucial first step that identifies where and when changes are happening, providing a foundation for future studies to incorporate these drivers and explicitly model causality.

5. Conclusions

This study analyzed the spatiotemporal patterns of active fires across China from 2003 to 2024 using MODIS data, emphasizing the critical role of anthropogenic activities and policy impacts. The nationwide straw burning ban implemented significantly reduced cropland fire occurrences after 2016, though pronounced regional disparities persist. East China and Central China demonstrated substantial declines in cropland fire, while Northeast China saw increased fires, likely due to climate change, agricultural demand and regional enforcement challenges. Temporal displacement toward nighttime straw burning was observed in East China. A general decrease in fire radiative power reflects successful management interventions, yet increased nighttime intensity in some regions suggests ongoing challenges. Strengthened forest fire management has also yielded significant results. Southwest China took the lead in reducing forest fires, while South China saw a prominent drop in savanna fires. These findings emphasize the need for regionally tailored fire management, considering differences in land use, policy enforcement, and environmental conditions.

Supplementary Materials

The following supporting information can be downloaded at: https://www.mdpi.com/article/10.3390/fire8110445/s1. Figure S1: Sensitivity analysis for fire counts. To simulate potential systematic observation errors, a multi-level random perturbation ±5%, ±10%, and ±15% was applied to the original fire count series. Only Mann-Kendall test significant linear trend lines (dashed lines) are displayed, where slope (k) quantifies trend direction and magnitude; Figure S2: Multivariate regression coefficients including policy coefficient estimates with associated p-values, climate variable coefficients for temperature, precipitation and wind speed. Annual total fire counts, mean annual temperature and wind speed, annual total precipitation, analyzed separately for each geographical region; Figure S3: Annual fire counts (left axis) and mean annual climate anomalies (right axis) with statistically significant trends (p < 0.05) highlighted using dashed trend lines in Central China and East China from 2003 to 2024; Figure S4: The same with Figure S3, for Southwest China and South China; Figure S5: The same with Figure S3, for Northeast China and Northwest China; Figure S6: The fire peak month identification for each geographical region; Figure S7: The same with Figure S2, using total fire counts, mean temperature and wind speed, total precipitation for identified peak fire months per year; Figure S8: Fire counts (left axis) and mean climate anomalies (right axis) in identified peak fire months with statistically significant trends (p < 0.05) highlighted using dashed trend lines in Central China and East China from 2003 to 2024; Figure S9: The same with Figure S8, for Southwest China and South China; Figure S10: The same with Figure S8, for Northeast China and Northwest China; Table S1: Ordinary least squares regression model fit statistics results; Table S2: Model fit statistics results.

Author Contributions

Conceptualization, W.W. and C.W.; methodology, W.W.; validation, C.W. and W.W.; formal analysis, W.W.; investigation, C.W.; data curation, C.W.; writing—original draft preparation, C.W.; writing—review and editing, W.W.; visualization, W.W.; project administration, W.W.; funding acquisition, W.W. All authors have read and agreed to the published version of the manuscript.

Funding

This research was funded by the National Natural Science Foundation of China (Grant No. 42405197) and the Natural Science Foundation of Henan Province (Grant No. 232300420451).

Data Availability Statement

The MODIS Active Fire data (Collection 6) used in this study are publicly available from NASA’s Fire Information for Resource Management System (FIRMS) at https://firms.modaps.eosdis.nasa.gov/active_fire/ (accessed on 13 November 2025). The MODIS Land Cover product (MCD12Q1) Version 6.1 is available from NASA Land Processes Distributed Active Archive Center at https://doi.org/10.5067/MODIS/MCD12Q1.061 (accessed on 13 November 2025). Processed datasets and analysis scripts developed for this study are available from the corresponding author upon reasonable request.

Acknowledgments

All authors are grateful to anonymous reviewers and editors for their constructive comments.

Conflicts of Interest

The authors declare no conflicts of interest.

References

  1. Zhao, J.; Ciais, P.; Chevallier, F.; Canadell, J.G.; van der Velde, I.R.; Chuvieco, E.; Chen, Y.; Zhang, Q.; He, K.; Zheng, B. Enhanced CH4 emissions from global wildfires likely due to undetected small fires. Nat. Commun. 2025, 16, 804. [Google Scholar] [CrossRef]
  2. Yu, Y.; Ginoux, P. Enhanced dust emission following large wildfires due to vegetation disturbance. Nat. Geosci. 2022, 15, 878–884. [Google Scholar] [CrossRef]
  3. de Souza Maria, L.; Rossi, F.S.; da Costa, L.M.; Campos, M.O.; Blas, J.C.G.; Panosso, A.R.; Silva, J.L.D.; da Silva Junior, C.A.; La Scala, N., Jr. Spatiotemporal analysis of atmospheric XCH4 as related to fires in the Amazon biome during 2015–2020. Remote Sens. Appl. Soc. Environ. 2023, 30, 100967. [Google Scholar] [CrossRef]
  4. Zhang, G.; Zhang, L.; Li, X.; Feng, X.; Wang, Y.; Guo, J.; Li, P.; Wei, X. Spatiotemporal evolution characteristics and driving mechanisms of wildfires in China under the context of climate change and human activities. Ecol. Indic. 2025, 176, 113694. [Google Scholar] [CrossRef]
  5. Xiang, M.; Xiao, C.; Feng, Z.; Ma, Q. Global distribution, trends and types of active fire occurrences. Sci. Total Environ. 2023, 902, 166456. [Google Scholar] [CrossRef]
  6. Chen, J.; Li, C.; Ristovski, Z.; Milic, A.; Gu, Y.; Islam, M.S.; Wang, S.; Hao, J.; Zhang, H.; He, C.; et al. A review of biomass burning: Emissions and impacts on air quality, health and climate in China. Sci. Total Environ. 2017, 579, 1000–1034. [Google Scholar] [CrossRef]
  7. Li, Y.; Zhao, J.; Guo, X.; Zhang, Z.; Tan, G.; Yang, J. The Influence of Land Use on the Grassland Fire Occurrence in the Northeastern Inner Mongolia Autonomous Region, China. Sensors 2017, 17, 437. [Google Scholar] [CrossRef]
  8. Li, W.; Li, P.; Feng, Z. Delineating Fire-Hazardous Areas and Fire-Induced Patterns Based on Visible Infrared Imaging Radiometer Suite (VIIRS) Active Fires in Northeast China. Remote Sens. 2022, 14, 5115. [Google Scholar] [CrossRef]
  9. Ke, H.; Gong, S.; He, J.; Zhou, C.; Zhang, L.; Zhou, Y. Spatial and temporal distribution of open bio-mass burning in China from 2013 to 2017. Atmos. Environ. 2019, 210, 156–165. [Google Scholar] [CrossRef]
  10. Huang, L.; Zhu, Y.; Wang, Q.; Zhu, A.; Liu, Z.; Wang, Y.; Allen, D.T.; Li, L. Assessment of the effects of straw burning bans in China: Emissions, air quality, and health impacts. Sci. Total Environ. 2021, 789, 147935. [Google Scholar] [CrossRef]
  11. Cheng, Z.; Wang, S.; Fu, X.; Watson, J.G.; Jiang, J.; Fu, Q.; Chen, C.; Xu, B.; Yu, J.; Chow, J.C.; et al. Impact of biomass burning on haze pollution in the Yangtze River delta, China: A case study in summer 2011. Atmos. Chem. Phys. 2014, 14, 4573–4585. [Google Scholar] [CrossRef]
  12. Hua, W.; Zhou, L.; Jiang, Y.; Zhou, L.; Xu, X.; Chen, H. Changes in fire-season burned area in northeastern China regulated by tropical North Atlantic variability. Environ. Res. Lett. 2024, 19, 124086. [Google Scholar] [CrossRef]
  13. Cui, S.; Song, Z.; Zhang, L.; Shen, Z.; Hough, R.; Zhang, Z.; An, L.; Fu, Q.; Zhao, Y.; Jia, Z. Spatial and temporal variations of open straw burning based on fire spots in northeast China from 2013 to 2017. Atmos. Environ. 2021, 244, 117962. [Google Scholar] [CrossRef]
  14. Liu, T.; He, G.; Lau, A.K.H. Statistical evidence on the impact of agricultural straw burning on urban air quality in China. Sci. Total Environ. 2020, 711, 134633. [Google Scholar] [CrossRef]
  15. Guo, F.; Su, Z.; Wang, G.; Sun, L.; Lin, F.; Liu, A. Wildfire ignition in the forests of southeast China: Identifying drivers and spatial distribution to predict wildfire likelihood. Appl. Geogr. 2016, 66, 12–21. [Google Scholar] [CrossRef]
  16. Wu, Z.; He, H.S.; Yang, J.; Liang, Y. Defining fire environment zones in the boreal forests of northeastern China. Sci. Total Environ. 2015, 518–519, 106–116. [Google Scholar] [CrossRef] [PubMed]
  17. Guo, F.; Innes, J.L.; Wang, G.; Ma, X.; Sun, L.; Hu, H.; Su, Z. Historic distribution and driving factors of human-caused fires in the Chinese boreal forest between 1972 and 2005. J. Plant Ecol. 2015, 8, 480–490. [Google Scholar] [CrossRef]
  18. Ying, L.; Cheng, H.; Shen, Z.; Guan, P.; Luo, C.; Peng, X. Relative humidity and agricultural activities dominate wildfire ignitions in Yunnan, Southwest China: Patterns, thresholds, and implications. Agric. For. Meteorol. 2021, 307, 108540. [Google Scholar] [CrossRef]
  19. Dong, B.; Li, H.; Xu, J.; Han, C.; Zhao, S. Spatiotemporal Analysis of Forest Fires in China from 2012 to 2021 Based on Visible Infrared Imaging Radiometer Suite (VIIRS) Active Fires. Sustainability 2023, 15, 9532. [Google Scholar] [CrossRef]
  20. Tian, X.; Zhao, F.; Shu, L.; Wang, M. Distribution characteristics and the influence factors of forest fires in China. For. Ecol. Manag. 2013, 310, 460–467. [Google Scholar] [CrossRef]
  21. Zong, X.; Tian, X.; Liu, J. A Fire Regime Zoning System for China. Front. For. Glob. Change 2021, 4, 717499. [Google Scholar] [CrossRef]
  22. Fang, K.; Yao, Q.; Guo, Z.; Zheng, B.; Du, J.; Qi, F.; Yan, P.; Li, J.; Ou, T.; Liu, J.; et al. ENSO modulates wildfire activity in China. Nat. Commun. 2021, 12, 1764. [Google Scholar] [CrossRef]
  23. Zhao, H.; Zhang, Z.; Ying, H.; Chen, J.; Zhen, S.; Wang, X.; Shan, Y. The spatial patterns of climate-fire relationships on the Mongolian Plateau. Agric. For. Meteorol. 2021, 308–309, 108549. [Google Scholar] [CrossRef]
  24. Kale, M.P.; Ramachandran, R.M.; Pardeshi, S.N.; Chavan, M.; Joshi, P.K.; Pai, D.S.; Bhavani, P.; Ashok, K.; Roy, P.S. Are Climate Extremities Changing Forest Fire Regimes in India? An Analysis Using MODIS Fire Locations During 2003–2013 and Gridded Climate Data of India Meteorological Department. Proc. Natl. Acad. Sci. India Sect. A Phys. Sci. 2017, 87, 827–843. [Google Scholar] [CrossRef]
  25. Liu, G.; Li, J.; Ying, T.; Su, H.; Huang, X.; Yu, Y. Increasing Fire Weather Potential Over Northeast China Linked to Declining Bering Sea Ice. Geophys. Res. Lett. 2023, 50, e2023GL105931. [Google Scholar] [CrossRef]
  26. Xiong, Q.; Luo, X.; Liang, P.; Xiao, Y.; Xiao, Q.; Sun, H.; Pan, K.; Wang, L.; Li, L.; Pang, X. Fire from policy, human interventions, or biophysical factors? Temporal–spatial patterns of forest fire in southwestern China. For. Ecol. Manag. 2020, 474, 118381. [Google Scholar] [CrossRef]
  27. Wei, X.; Wang, G.; Chen, T.; Hagan, D.F.; Ullah, W. A Spatio-Temporal Analysis of Active Fires over China during 2003–2016. Remote Sens. 2020, 12, 1787. [Google Scholar] [CrossRef]
  28. Lian, C.; Xiao, C.; Feng, Z. Spatiotemporal Characteristics and Regional Variations of Active Fires in China since 2001. Remote Sens. 2023, 15, 54. [Google Scholar] [CrossRef]
  29. Sun, L.; Yang, L.; Xia, X.; Wang, D.; Zhang, T. Climatological Aspects of Active Fires in Northeastern China and Their Relationship to Land Cover. Remote Sens. 2022, 14, 2316. [Google Scholar] [CrossRef]
  30. Guo, M.; Yao, Q.; Suo, H.; Xu, X.; Li, J.; He, H.; Yin, S.; Li, J. The importance degree of weather elements in driving wildfire occurrence in mainland China. Ecol. Indic. 2023, 148, 110152. [Google Scholar] [CrossRef]
  31. Lian, C.; Li, P.; Feng, Z. Accelerated reduction in China’s cropland fires against the background of policy enhancement. Environ. Impact Assess. Rev. 2024, 106, 107512. [Google Scholar] [CrossRef]
  32. Zhang, L.; Li, X.; Liu, X.; Lian, Z.; Zhang, G.; Liu, Z.; An, S.; Ren, Y.; Li, Y.; Liu, S. Dynamic monitoring and drivers of ecological environmental quality in the Three-North region, China: Insights based on remote sensing ecological index. Ecol. Inform. 2025, 85, 102936. [Google Scholar] [CrossRef]
  33. Ichoku, C.; Giglio, L.; Wooster, M.J.; Remer, L.A. Global characterization of biomass-burning patterns using satellite measurements of fire radiative energy. Remote Sens. Environ. 2008, 112, 2950–2962. [Google Scholar] [CrossRef]
  34. Justice, C.O.; Giglio, L.; Korontzi, S.; Owens, J.; Morisette, J.T.; Roy, D.; Descloitres, J.; Alleaume, S.; Petitcolin, F.; Kaufman, Y. The MODIS fire products. Remote Sens. Environ. 2002, 83, 244–262. [Google Scholar] [CrossRef]
  35. Giglio, L.; Schroeder, W.; Justice, C.O. The collection 6 MODIS active fire detection algorithm and fire products. Remote Sens. Environ. 2016, 178, 31–41. [Google Scholar] [CrossRef] [PubMed]
  36. Vadrevu, K.; Lasko, K. Intercomparison of MODIS AQUA and VIIRS I-Band Fires and Emissions in an Agricultural Landscape—Implications for Air Pollution Research. Remote Sens. 2018, 10, 978. [Google Scholar] [CrossRef]
  37. Xiao, C.; Feng, Z.; Li, P. Active fires show an increasing elevation trend in the tropical highlands. Glob. Change Biol. 2022, 28, 2790–2803. [Google Scholar] [CrossRef] [PubMed]
  38. Mark Friedl, D.S.-M. MODIS/Terra+Aqua Land Cover Type Yearly L3 Global 500m SIN Grid V061; NASA Land Processes Distributed Active Archive Center: Sioux Falls, SD, USA, 2022. [CrossRef]
  39. Sulla-Menashe, D.; Gray, J.M.; Abercrombie, S.P.; Friedl, M.A. Hierarchical mapping of annual global land cover 2001 to present: The MODIS Collection 6 Land Cover product. Remote Sens. Environ. 2019, 222, 183–194. [Google Scholar] [CrossRef]
  40. Liu, P.; Pei, J.; Guo, H.; Tian, H.; Fang, H.; Wang, L. Evaluating the Accuracy and Spatial Agreement of Five Global Land Cover Datasets in the Ecologically Vulnerable South China Karst. Remote Sens. 2022, 14, 3090. [Google Scholar] [CrossRef]
  41. Wang, H.; Wen, X.; Wang, Y.; Cai, L.; Peng, D.; Liu, Y. China’s Land Cover Fraction Change during 2001–2015 Based on Remote Sensed Data Fusion between MCD12 and CCI-LC. Remote Sens. 2021, 13, 341. [Google Scholar] [CrossRef]
  42. Li, P.; Wang, Y.; Wang, C.; Tian, L.; Lin, M.; Xu, S.; Zhu, C. A Comparison of Recent Global Time-Series Land Cover Products. Remote Sens. 2025, 17, 1417. [Google Scholar] [CrossRef]
  43. Hersbach, H.; Bell, B.; Berrisford, P.; Hirahara, S.; Horányi, A.; Muñoz-Sabater, J.; Nicolas, J.; Peubey, C.; Radu, R.; Schepers, D.; et al. The ERA5 global reanalysis. Q. J. R. Meteorol. Soc. 2020, 146, 1999–2049. [Google Scholar] [CrossRef]
  44. Gao, H.; Jin, J. Analysis of Water Yield Changes from 1981 to 2018 Using an Improved Mann-Kendall Test. Remote Sens. 2022, 14, 2009. [Google Scholar] [CrossRef]
  45. Theil, H. A Rank-Invariant Method of Linear and Polynomial Regression Analysis. In Henri Theil’s Contributions to Economics and Econometrics: Econometric Theory and Methodology; Raj, B., Koerts, J., Eds.; Springer: Dordrecht, The Netherlands, 1992; pp. 345–381. [Google Scholar]
  46. Sen, P.K. Estimates of the Regression Coefficient Based on Kendall’s Tau. J. Am. Stat. Assoc. 1968, 63, 1379–1389. [Google Scholar] [CrossRef]
  47. Pan, J.; Wu, X.; Zhou, L.; Wei, S. Spatial and Temporal Distribution Characteristics of Active Fires in China Using Remotely Sensed Data. Fire 2022, 5, 200. [Google Scholar] [CrossRef]
  48. World Meteorological Organization (WMO). State of the Global Climate 2024 (WMO-No. 1368); WMO: Geneva, Switzerland, 2025. [Google Scholar]
  49. Wang, S.; Yin, C.; Li, F.; Richel, A. Innovative incentives can sustainably enhance the achievement of straw burning control in China. Sci. Total Environ. 2023, 857, 159498. [Google Scholar] [CrossRef]
  50. Zhu, Z.; Zhang, Z.; Zhao, X.; Zuo, L.; Wang, X. Characteristics of Land Use Change in China before and after 2000. Sustainability 2022, 14, 14623. [Google Scholar] [CrossRef]
  51. Pausas, J.G.; Ribeiro, E. The global fire–productivity relationship. Glob. Ecol. Biogeogr. 2013, 22, 728–736. [Google Scholar] [CrossRef]
  52. van der Werf, G.R.; Randerson, J.T.; Giglio, L.; Gobron, N.; Dolman, A.J. Climate controls on the variability of fires in the tropics and subtropics. Glob. Biogeochem. Cycles 2008, 22, GB3028. [Google Scholar] [CrossRef]
  53. Hayes, J.P. Fire Suppression and the Wildfire Paradox in Contemporary China: Policies, Resilience, and Effects in Chinese Fire Regimes. Hum. Ecol. 2021, 49, 19–32. [Google Scholar] [CrossRef]
  54. Chen, J.; Di, X.-Y. Forest fire prevention management legal regime between China and the United States. J. For. Res. 2015, 26, 447–455. [Google Scholar] [CrossRef]
  55. Shang, Y.; Pei, Y.; Fu, P.; Ren, C.; Li, Z.; Ren, J.; Zheng, X.; Di, Y.; Zhou, Y.; Dong, J. Increased corn cultivation exacerbated crop residue burning in Northeast China in the 21st century. Geogr. Sustain. 2025, 6, 100244. [Google Scholar] [CrossRef]
  56. Cheng, Y.; Cao, X.-b.; Liu, J.-m.; Yu, Q.-q.; Zhong, Y.-j.; Geng, G.-n.; Zhang, Q.; He, K.-b. New open burning policy reshaped the aerosol characteristics of agricultural fire episodes in Northeast China. Sci. Total Environ. 2022, 810, 152272. [Google Scholar] [CrossRef] [PubMed]
  57. Wei, W.; Zhang, H.; Zhou, J.; Zhou, L.; Xie, B.; Li, C. Drought monitoring in arid and semi-arid region based on multi-satellite datasets in northwest, China. Environ. Sci. Pollut. Res. 2021, 28, 51556–51574. [Google Scholar] [CrossRef]
  58. Su, J.; Fan, L.; Yuan, Z.; Wang, Z.; Wang, Z. Quantifying the drought sensitivity of grassland under different climate zones in Northwest China. Sci. Total Environ. 2024, 910, 168688. [Google Scholar] [CrossRef]
  59. Xu, W.; Zhou, Q.; Ma, W.; Huang, Y. Analysis of the Spatial Distribution Pattern of Grassland Fire Susceptibility and Influencing Factors in Qinghai Province. Appl. Sci. 2025, 15, 3386. [Google Scholar] [CrossRef]
  60. Han, H.; Lin, H. Patterns of Agricultural Diversification in China and Its Policy Implications for Agricultural Modernization. Int. J. Environ. Res. Public Health 2021, 18, 4978. [Google Scholar] [CrossRef]
  61. Huang, J.; Yang, J.; Rozelle, S. China’s agriculture: Drivers of change and implications for China and the rest of world. Agric. Econ. 2010, 41, 47–55. [Google Scholar] [CrossRef]
  62. Pandey, P.; Huidobro, G.; Lopes, L.F.; Ganteaume, A.; Ascoli, D.; Colaco, C.; Xanthopoulos, G.; Giannaros, T.M.; Gazzard, R.; Boustras, G.; et al. A global outlook on increasing wildfire risk: Current policy situation and future pathways. Trees For. People 2023, 14, 100431. [Google Scholar] [CrossRef]
  63. Li, X.; Duan, T.; Yang, K.; Yang, B.; Wang, C.; Tian, X.; Lu, Q.; Wang, F. Mapping Temperate Savanna in Northeastern China Through Integrating UAV and Satellite Imagery. Sci. Data 2025, 12, 671. [Google Scholar] [CrossRef] [PubMed]
Disclaimer/Publisher’s Note: The statements, opinions and data contained in all publications are solely those of the individual author(s) and contributor(s) and not of MDPI and/or the editor(s). MDPI and/or the editor(s) disclaim responsibility for any injury to people or property resulting from any ideas, methods, instructions or products referred to in the content.

Article Metrics

Citations

Article Access Statistics

Article metric data becomes available approximately 24 hours after publication online.