Technical Note

Study on the Effect of Blockage Ratio on Maximum Smoke Temperature Rise in the Underground Interconnected Tunnel

1
School of Civil Engineering, Central South University (CSU), Changsha 410075, China
2
National Engineering Research Center of High-Speed Railway Construction Technology, Central South University, Changsha 410075, China
*
Author to whom correspondence should be addressed.
Submission received: 17 December 2022 / Revised: 12 January 2023 / Accepted: 30 January 2023 / Published: 31 January 2023
(This article belongs to the Special Issue Fire-Induced Smoke Movement and Control)

Abstract

:
The model-scale tunnel is used in this investigation to analyze the maximum smoke temperature rise of the interconnected tunnel for various longitudinal ventilation velocities, blockage ratios, and heat release rates where the fire is at the confluence of the underground interconnected tunnel. The results showed that the longitudinal ventilation velocities of both the ramp upstream of the fire source and the adjacent ramp influenced the maximum temperature rise under the underground interconnected tunnel, and the ventilation of both ramps jointly affected the maximum temperature rise. The change in the maximum temperature rise depends on who is more affected by the longitudinal ventilation velocity or the vehicle blockage ratio. As the longitudinal ventilation velocity in the interconnected tunnel increases, the convective heat transfer near the fire source increases, resulting in a decrease in the maximum temperature rise, and the effect of the blockage ratio on the maximum temperature rise is reduced. In this paper, a maximum temperature rise prediction model suitable for the case of blockage in the interconnected tunnel is proposed.

1. Introduction

Urban ground traffic congestion is a common problem faced in the development of cities. Building “three-dimensional transportation” in cities has gradually emerged to relieve traffic pressure in large cities. The underground interconnected infrastructure is used to change the three-dimensional traffic line from the ground to the underground [1]. The structure of an underground interconnected tunnel is complex, and the consequences are serious once a fire occurs [2,3].
Alpert [4] analyzed the maximum temperature rise generated by the structure fire in the absence of wind to establish a forecast model. Heskestad and Delichatsios [5] proposed another classical equation for calculating the maximum temperature rise through the dimensionless heat release rate (HRR). Moreover, researchers investigated the impact of parameters such as ventilation velocity, tunnel slope, and smoke exhausting methods on the maximum temperature rise [6,7,8,9,10].
Highway tunnel ventilation methods primarily include longitudinal, transverse, and semitransverse ventilation [11,12,13]. In terms of cost, longitudinal ventilation continues to be the most commonly used method of smoke control in the construction of tunnel projects around the world [14]. In 2003, Kurioka [15], a Japanese scholar, conducted experiments in three different scaling models and combined the tunnel section aspect ratio, HRR, and longitudinal ventilation velocity to propose the maximum temperature rise prediction equation:
Δ T m T 0 = γ ( Q ˙ * 2 / 3 F r 1 / 3 ) ε
Q ˙ * 2 / 3 / F r 1 / 3 < 1.35 ,     γ = 1.77 , ε = 6 / 5 Q ˙ * 2 / 3 / F r 1 / 3 1.35 ,     γ = 2.54 , ε = 0
where the dimensionless HRR and the Froude number were written as:
Q ˙ * = Q ˙ ρ c p T 0 g 1 / 2 H 5 / 2 , F r = V 2 g H
where:
  • Δ T m is the maximum temperature rise (K);
  • T 0 is the ambient temperature (K);
  • Q ˙ is the heat release rate (kW);
  • γ , ε is the experimental constant;
  • ρ is the air density (kg/m3);
  • c p is the specific heat at constant pressure (kJ/(kg·K));
  • g is the gravitational acceleration (m/s2);
  • H is the tunnel height (m);
  • V is the longitudinal ventilation velocity (m/s).
Li [16] discovered that Kurioka’s formula could not accurately predict the maximum temperature rise at a shallow velocity. Thus, Li improved the formula concerning the maximum temperature rise with longitudinal ventilation and without longitudinal ventilation as follows:
Δ T m = Q ˙ V b f o 1 / 3 H e f 5 / 3 ,     V > 0.19 17.5 Q ˙ 2 / 3 H e f 5 / 3 ,     V 0.19
where:
  • Q ˙ e s is the total HRR (kW);
  • b f o is the fire source’s radius (m);
  • H e f is the vertical distance above the bottom of the fire source (m);
  • V is the dimensionless longitudinal ventilation velocity.
With the construction of urban underground interconnected tunnels, the tunnels need to connect with the ground road or other underground roads, which makes the underground interconnected tunnel more complex and the traffic flow larger. It is simple to create a blockage once a fire has started.
The maximum tunnel temperature rise in the situation of a single-pipe tunnel blockage has been the subject of research. Li et al. [17] and Luo et al. [18] investigated the relationship between the maximum temperature rise and the blockage ratio during longitudinal ventilation. The maximum temperature is reduced as the blockage ratio rises. Tang [19] investigated the impact of the distance between the obstruction site and the fire source on the maximum temperature rise when the longitudinal ventilation was adjusted using a model-scale test. Wang [20] analyzed the maximum temperature rise at different velocities and heat release rates (HRRs) and provided a formula in the event of a blockage. In Kayili’s [21] study, the maximum temperature rise and the blockage ratio were correlated. The results showed that the blockage ratio was proportional to the maximum temperature rise for a particular ventilation velocity. In addition, Li et al. [22] experimentally investigated the influence of blockage on the maximum smoke temperature and revised the Kurioka model by introducing the blockage ratio coefficient ϕ .
Δ T m T 0 = γ Q ˙ 2 / 3 F r 1 / 3 ( 1 ϕ ) 5 / 2 ε
where:
  • ϕ is the blockage ratio (%).
Due to the existence of the interconnected tunnel, the ventilation airflow velocity at the bifurcation is inconstant, and the smoke diffusion characteristics and control under fire conditions are very different from those of ordinary single-pipe tunnels. Huang et al. [23] investigated the influence of bifurcated angles, HRRs, and velocities on maximum temperature rise. A correlation equation for the maximum temperature variation under the bifurcated tunnel’s ceiling was proposed. Whether the fire source was upstream or at the bifurcation point, Chen et al. [24] found that as the velocity increased, the maximum temperature rise in the main tunnel decreased linearly.
Previous research focused on the bifurcation angle, longitudinal ventilation velocity, and fire source location, most of which employed a single-pipe straight tunnel. However, in the interconnected tunnel, it has not yet been possible to develop a predicted correlation of the maximum temperature rise that takes into account the coupling impact of various blockage ratios, ventilation velocities, and HRRs. In this work, a prediction method is proposed along with physical model tests to evaluate the effects of the blockage ratio, ventilation velocity, and HRR on smoke maximum temperature rise.

2. Experimental Setup

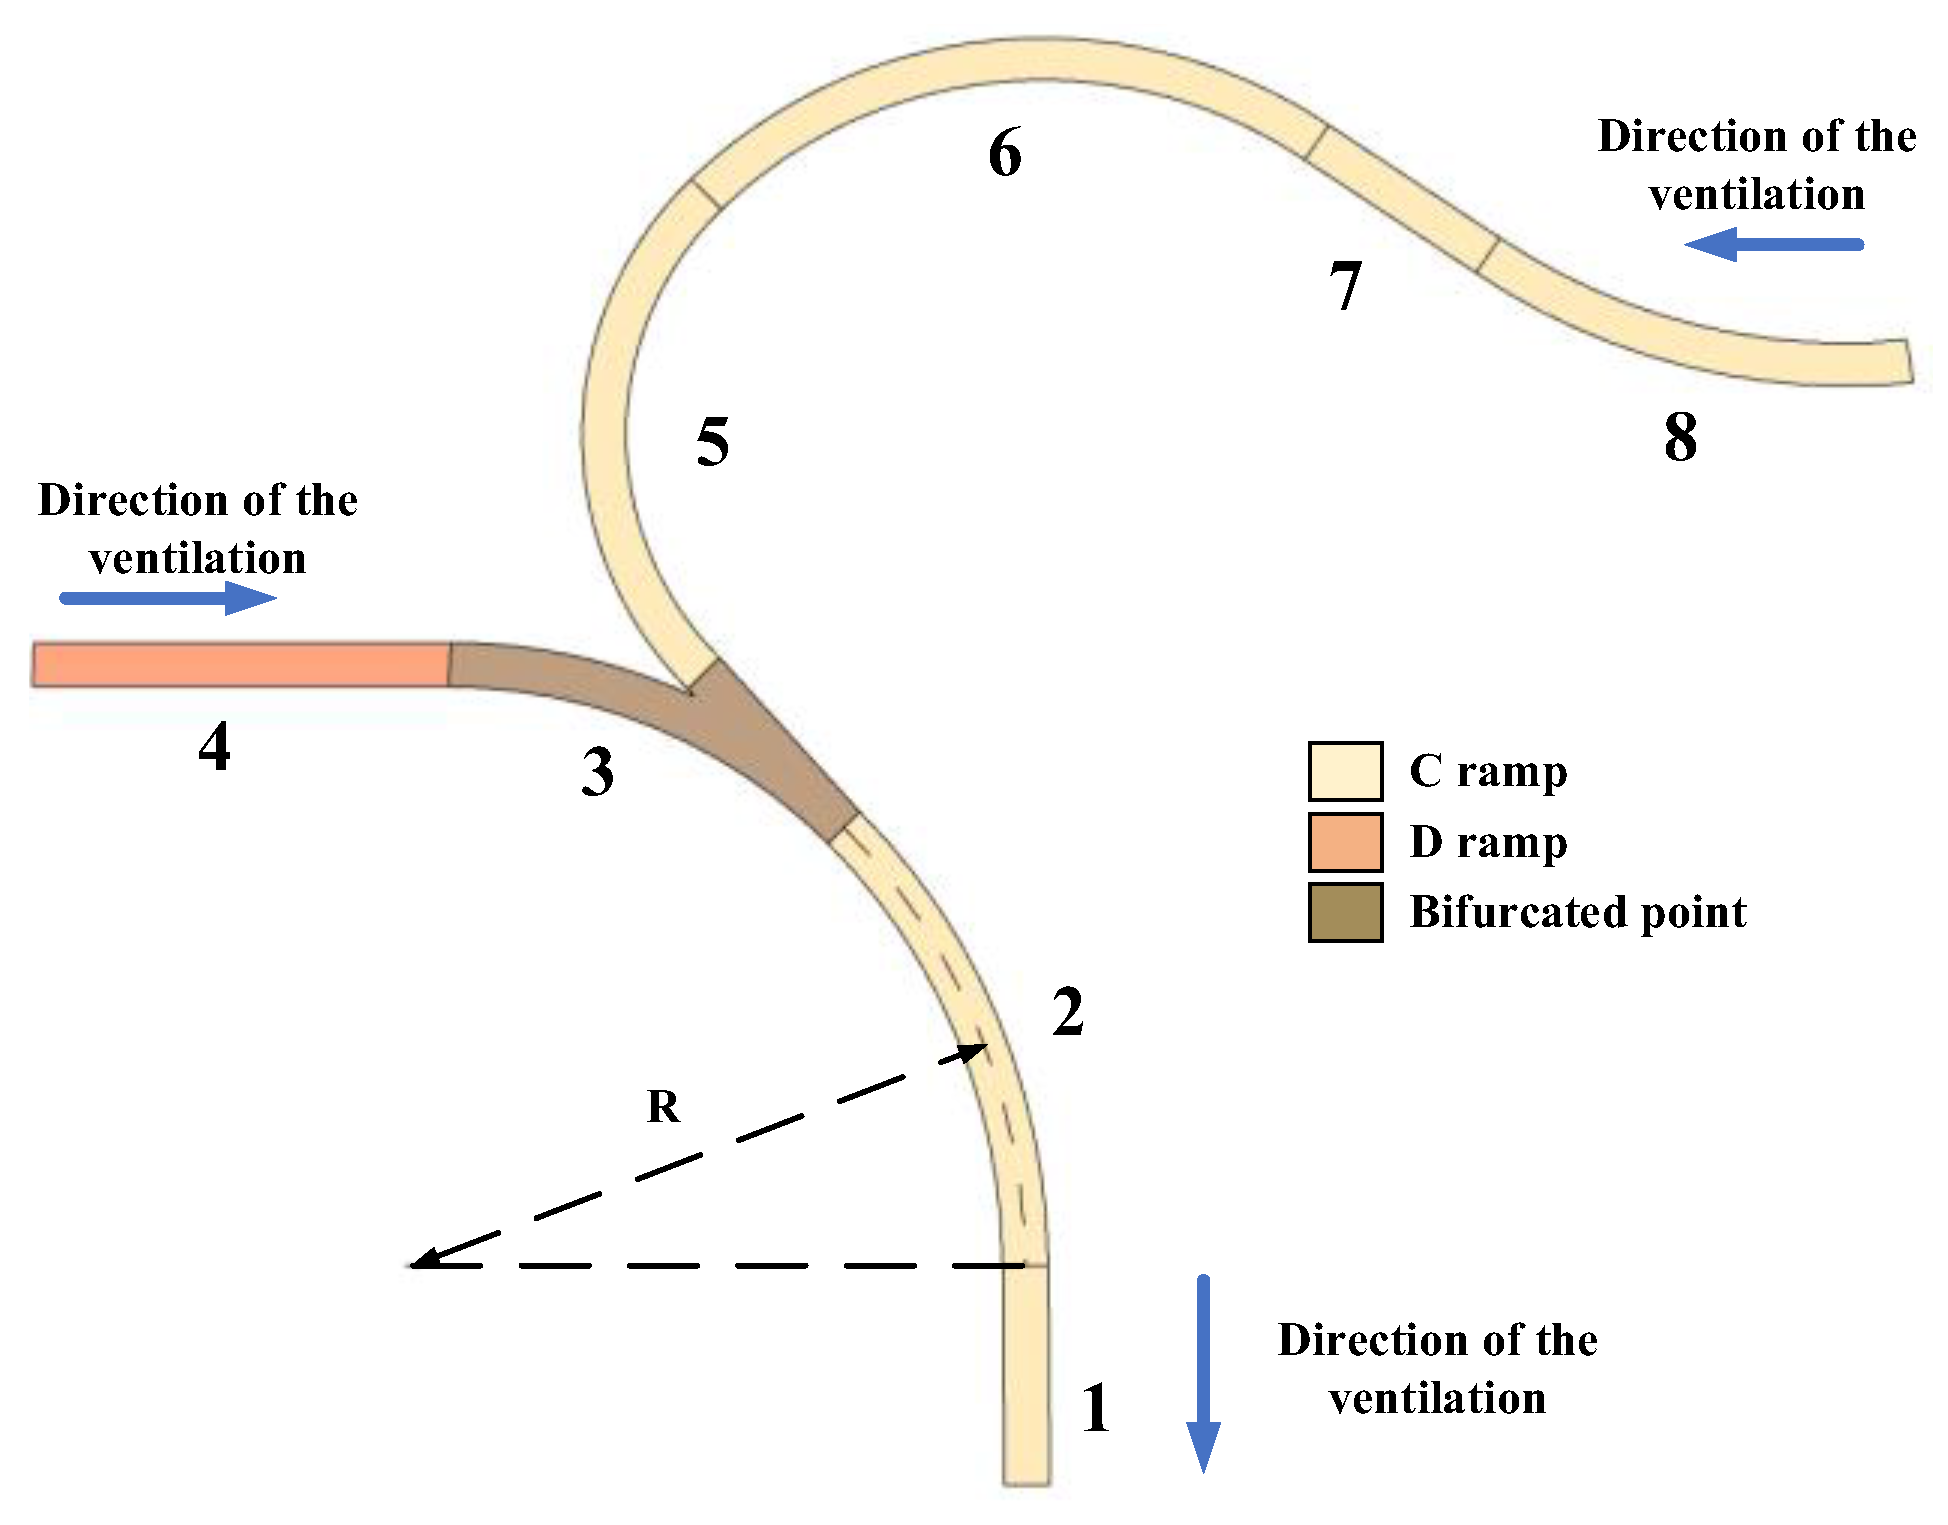
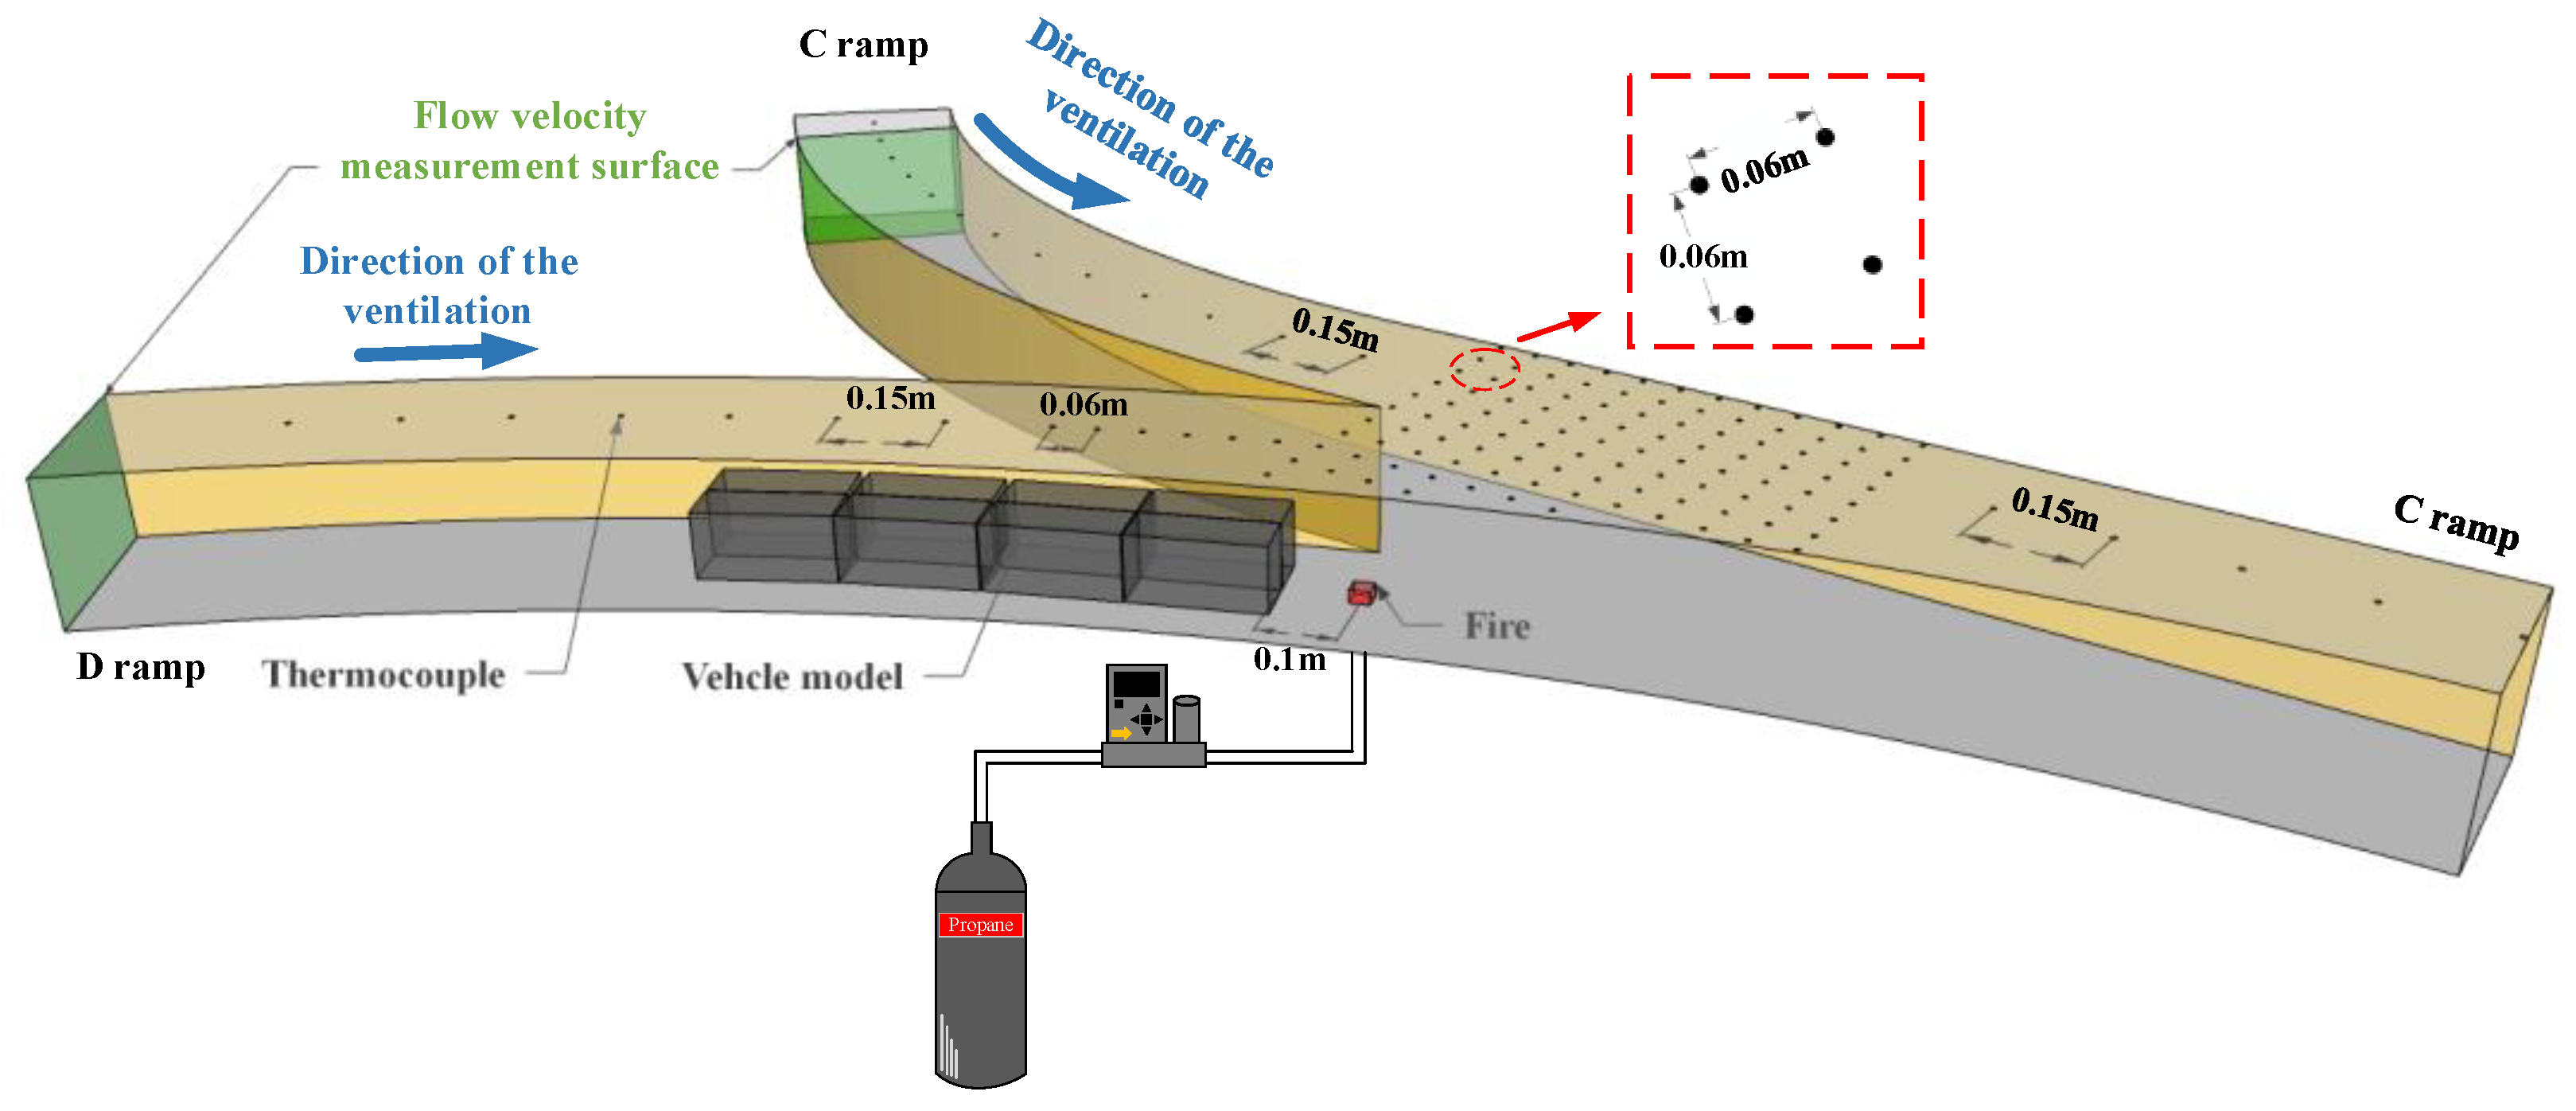
2.1. Model-Scale Tunnel

A 1:30 underground interconnected tunnel model was constructed. The interconnected tunnel consisted of multiple curved and straight tunnel sections, a ramp D length of 6 m, and a ramp C length of 21.5 m, and the cross-sectional dimension of the ramp was 0.32 m (W) × 0.22 m (H). The tunnel sidewalls were composed of 6 mm thick fire-proof glass, while the tunnel ceilings were composed of 3 mm thick fire-proof plates. The model-scale tunnel is shown in Figure 1. Ramp C and ramp D traffic flows were at a confluence at the bifurcated point.
The underground interconnected tunnel was made up of 8 multiple curved tunnel segments, as shown in Figure 2, with Ramp C and D forming a merge at the splitting point. The tunnel had no slopes. Table 1 shows the length and radius of curvature of each segment.
The thermocouples arrangement is shown in Figure 2. They were placed 0.01 m under the tunnel ceiling, and the longitudinal distance was 0.15 m. For a more accurate measurement of the maximum temperature rise of the tunnel, the thermocouple array was arranged at the confluence. There were a total of 108 horizontal and longitudinal intervals of 0.06 m. Propane gas was used as the fire source fuel in the test. Propane has the characteristics of low pollution and controllable combustion. At present, a large number of scholars have applied it to the test of reduced-size fire. In the experiment, the mass flow rate of fuel was measured and controlled by a mass flowmeter to control the HRR of the fire source. The burner’s inner diameter was 0.03 m × 0.03 m. The fire source was situated near the bottom of the tunnel, in the center of the D ramp, and was 0.02 m high.
This test adopted the longitudinal smoke exhaust mode. The jet fans were 0.185 m long, had an outlet diameter of 37 mm, and an operating voltage of 4.5 V–12 V. As shown in Figure 1, a group of jet fans was arranged at the entrance of ramp C and ramp D, and in each group with two jet fans, wind was blown from the entrance of ramp C and ramp D to the exit of ramp C. The fans were fixed in the tunnel by customized brackets, and the tunnel’s ceiling was 0.045 m from the jet fans’ center. The lateral distance between the two jet fans was 0.11 m, which achieved the triple outlet diameter of the jet fans. The adjustable direct current (D.C.) power was used to manage the longitudinal ventilation velocities. The locations for measuring the airflow velocity were in the center of the tunnel cross-section, but the blockage measurement points were above the obstruction.
The selection of the HRR was the most critical aspect of the tunnel fire test. The HRRs were set to be 5 MW, 8 MW, 12 MW, 16 MW, and 20 MW, which should be 1.01 kW, 1.83 kW, 2.43 kW, 3.24 kW, and 4.05 kW, respectively, when generalized on a small scale by using the Froude number.
As the blockage vehicle at the upstream fire source, three typical vehicles were chosen. The distance between the fire source and the vehicle was 0.1 m. For the convenience of calculation, the vehicles are simplified as rectangular bodies, and the width and height of each vehicle were 0.06 m (W) × 0.055 m (H), 0.08 m (W) × 0.10 m (H), and 0.08 m (W) × 0.13 m (H). The vehicle blockage length was 0.8 m, and the blockage area was the area of the same type of two vehicles side by side, as shown in Figure 3. Therefore, the tunnel blockage ratios ( ϕ ) were 0%, 10%, 20%, and 30%, respectively.

2.2. Experimental Conditions

Table 2 summarizes the parameters of the model-scale tunnel experiment. The blockage ratios ( ϕ ) were set to be 0%, 10%, 20%, and 30%. In addition, five different HRRs (1.01 kW, 1.83 kW, 2.43 kW, 3.24 kW, and 4.05 kW) and six ventilation methods (velocity was based on the velocity at ϕ = 0%) were considered. A total of 120 test conditions were developed.

3. Results and Discussion

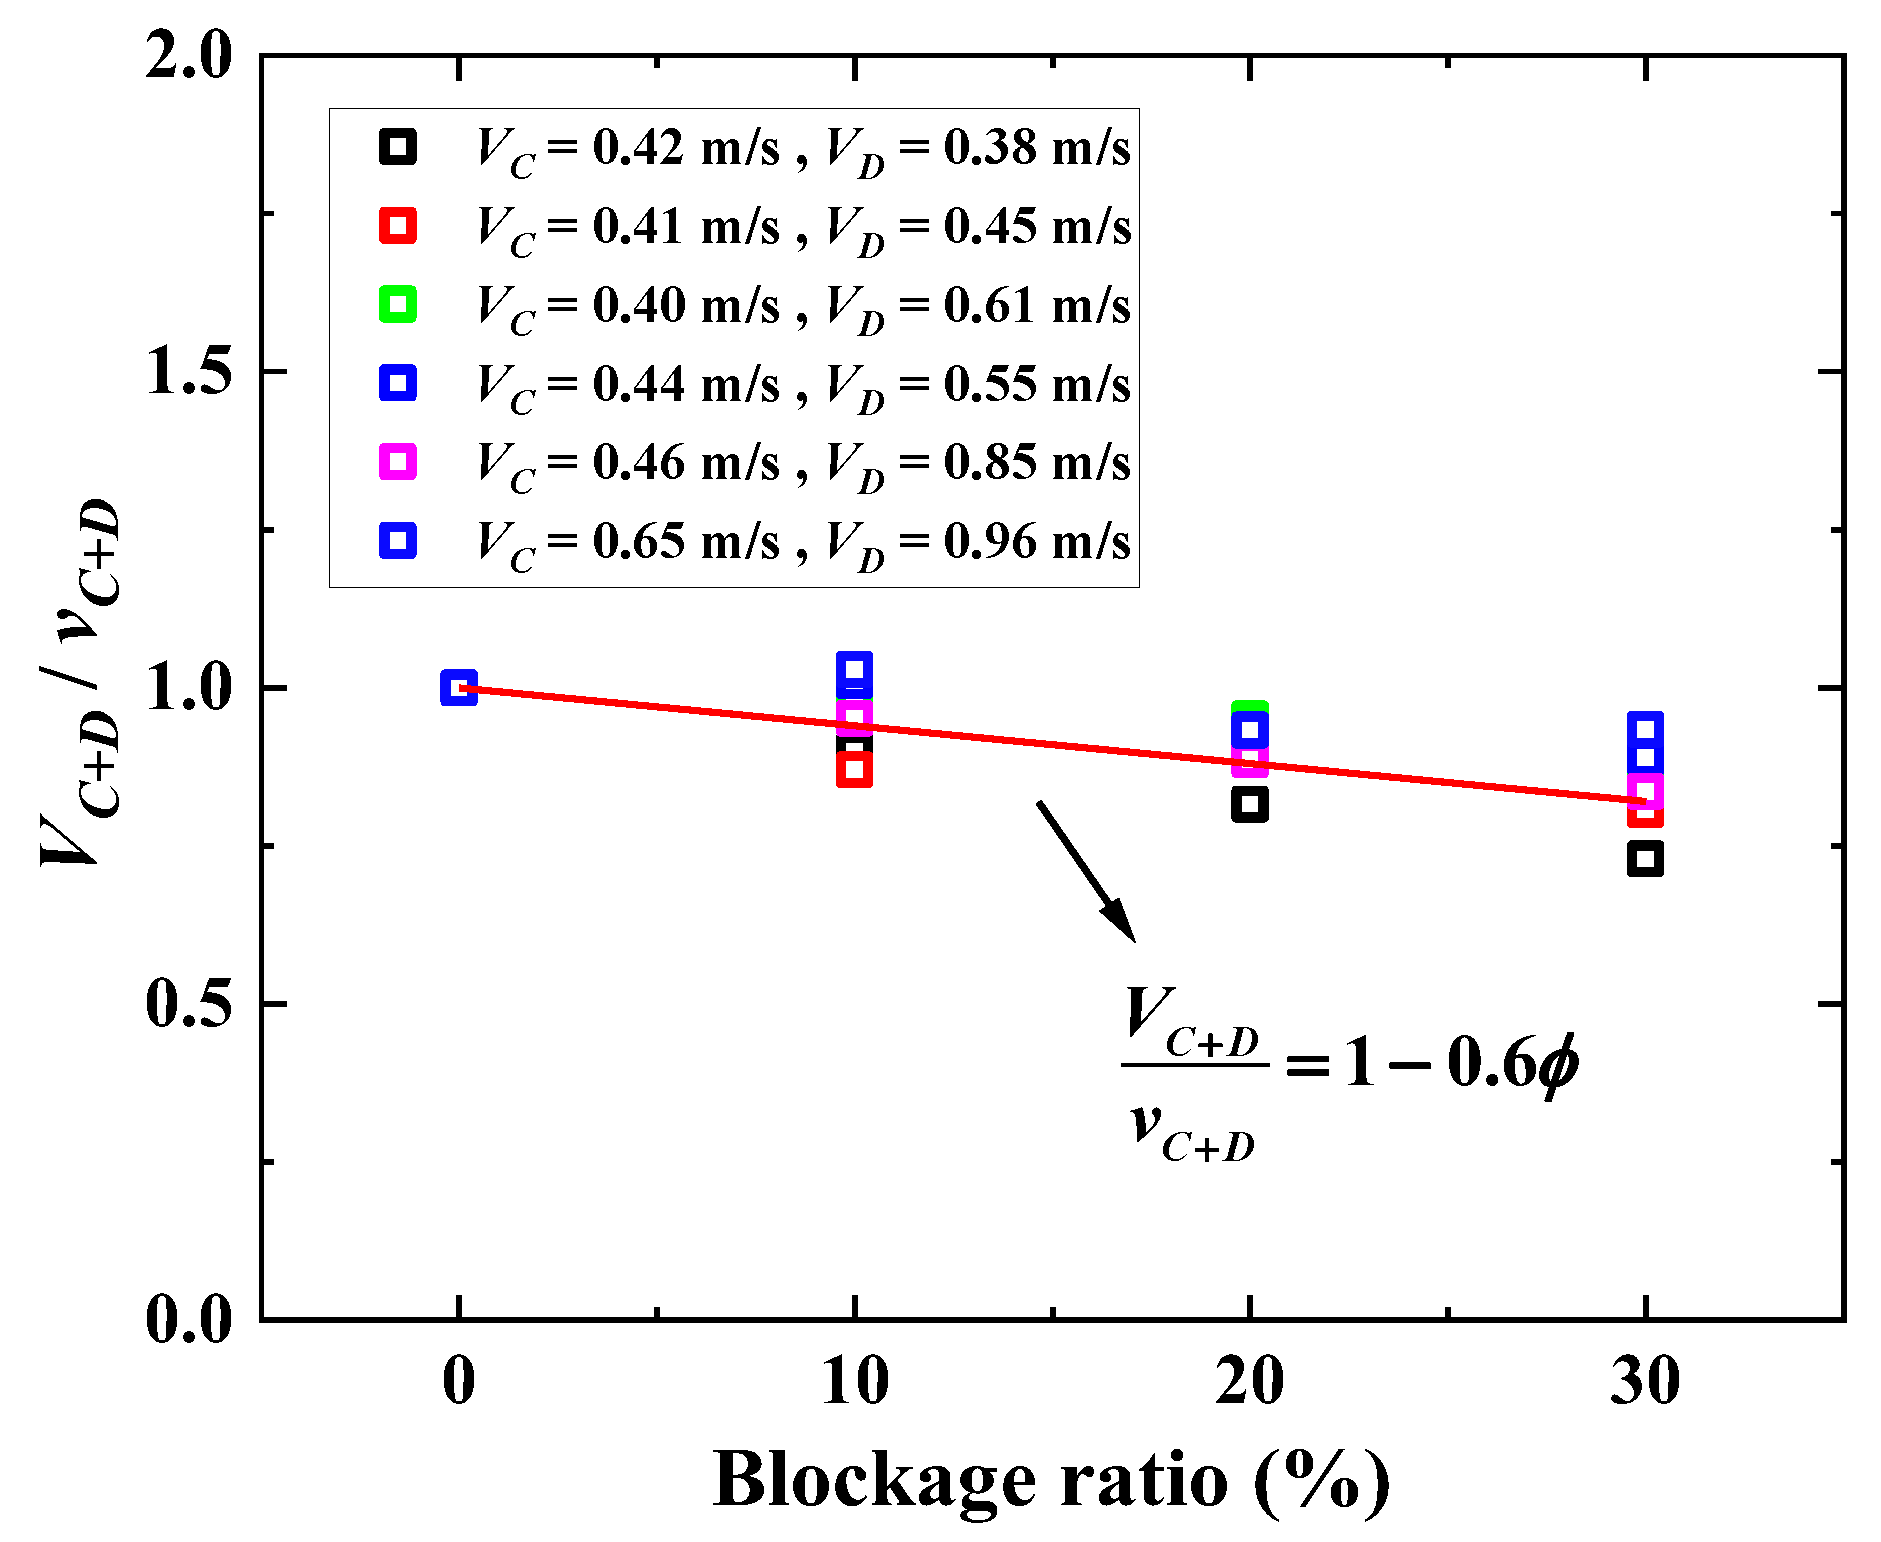
3.1. Variations in Longitudinal Ventilation Velocities in the Interconnected Tunnel

Figure 4 shows the variations in the longitudinal ventilation velocities with different blockage ratios for the same velocity scheme. When velocity Scheme 1 was used for the interconnected tunnel, the velocity at ramp C remained essentially constant, as the blockage ratio rose. The velocity of ramp D showed a decreasing trend. The velocity dropped from 0.38 m/s to 0.16 m/s and changed significantly. When velocity Scheme 6 was used for the interconnected tunnel, as the blockage ratio rose, the velocity at ramp C varied between 0.6 m/s and 0.8 m/s. The velocity of ramp D showed a decreasing trend. The velocity dropped from 0.96 m/s to 0.78 m/s, which also changed significantly. Even though the interconnected tunnel used the same velocity scheme, the actual velocity changed as a result of the blockage in the tunnel, among which ramp D changed greatly. Therefore, the longitudinal ventilation velocities of ramp C and ramp D in this paper were based on the actual velocity measured by the flow velocity measuring point in the interconnected tunnel, as shown in Table 3.
Figure 5 shows the sum of the ramps C and D velocities with the blockage ratios. In the interconnected tunnel, both ramps C and D had longitudinal ventilation. When the blockage ratio increased, the velocity total (VC+D) of ramps C and D dropped to some amount. According to Figure 3, this was because VD decreased as the blockage ratio increased.
Ramp C and ramp D had longitudinal ventilation in the interconnected tunnel. Figure 6 selects the data for ramp C with similar velocities and ramp D with different velocities. When ϕ = 20%, Q ˙ = 4.05 kW, ramp C’s velocities were comparable, and ramp D’s velocities varied from 0.25 m/s to 0.73 m/s, and the maximum temperature rise drastically dropped from 501 K to 267 K. The maximum temperature rise varied dramatically when the velocities at ramp D changed while the blockage ratio was constant and the velocities at ramp C were similar. This may be related to the fire source located on ramp D, which made ramp D velocities have a greater impact on the smoke.
Figure 7 selects the maximum temperature rise data when the velocities of the D ramp were similar and the velocities of the C ramp were different. When ϕ = 20%, Q ˙ = 4.05 kW, the ramp C velocities were 0.37 m/s and 0.46 m/s, and the maximum temperature was 405 K while the minimum was 317 K. The longitudinal ventilation velocity in ramp C also caused a change in the maximum temperature rise.
The velocities of ramp C and ramp D jointly affected the maximum temperature rise. Any change in the velocities of one of the ramps would cause the maximum temperature rise to vary. The influence of ramp D was greater, which could have been because the fire source was positioned on ramp D and influenced it significantly.
From Figure 6, Figure 7 and Figure 8, with an increasing HRR, the maximum temperature rise increased. When the velocity increased for both ramps C and D, Q ˙ = 4.05 kW, the maximum temperature rise fell from 405 K to 107 K. The addition of HRR gradually reduced the increase in the maximum temperature rise.

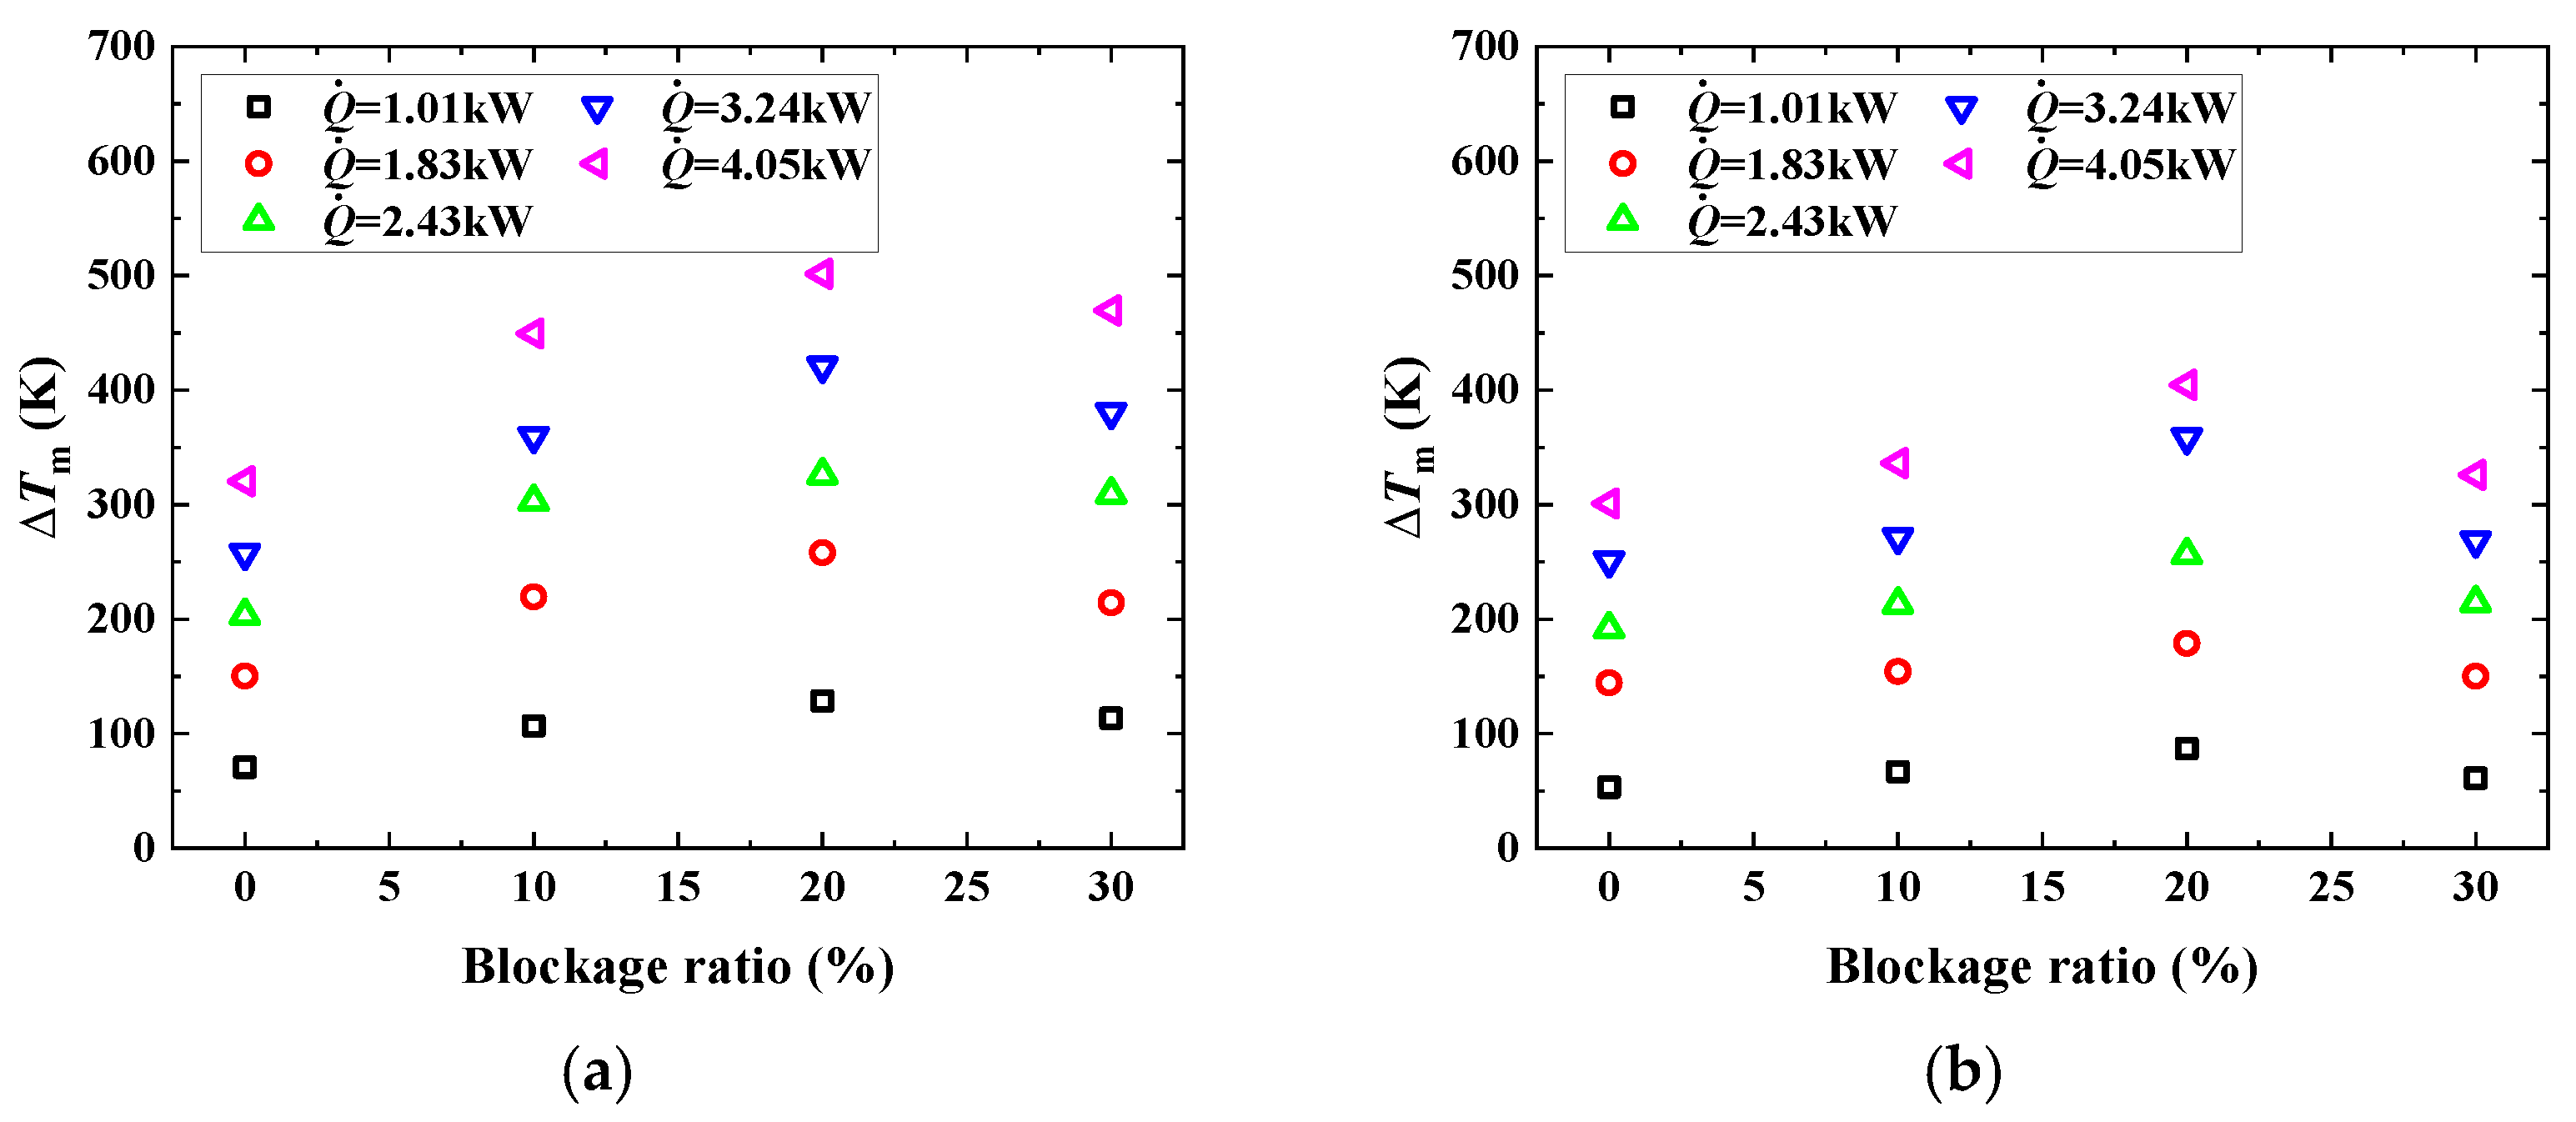
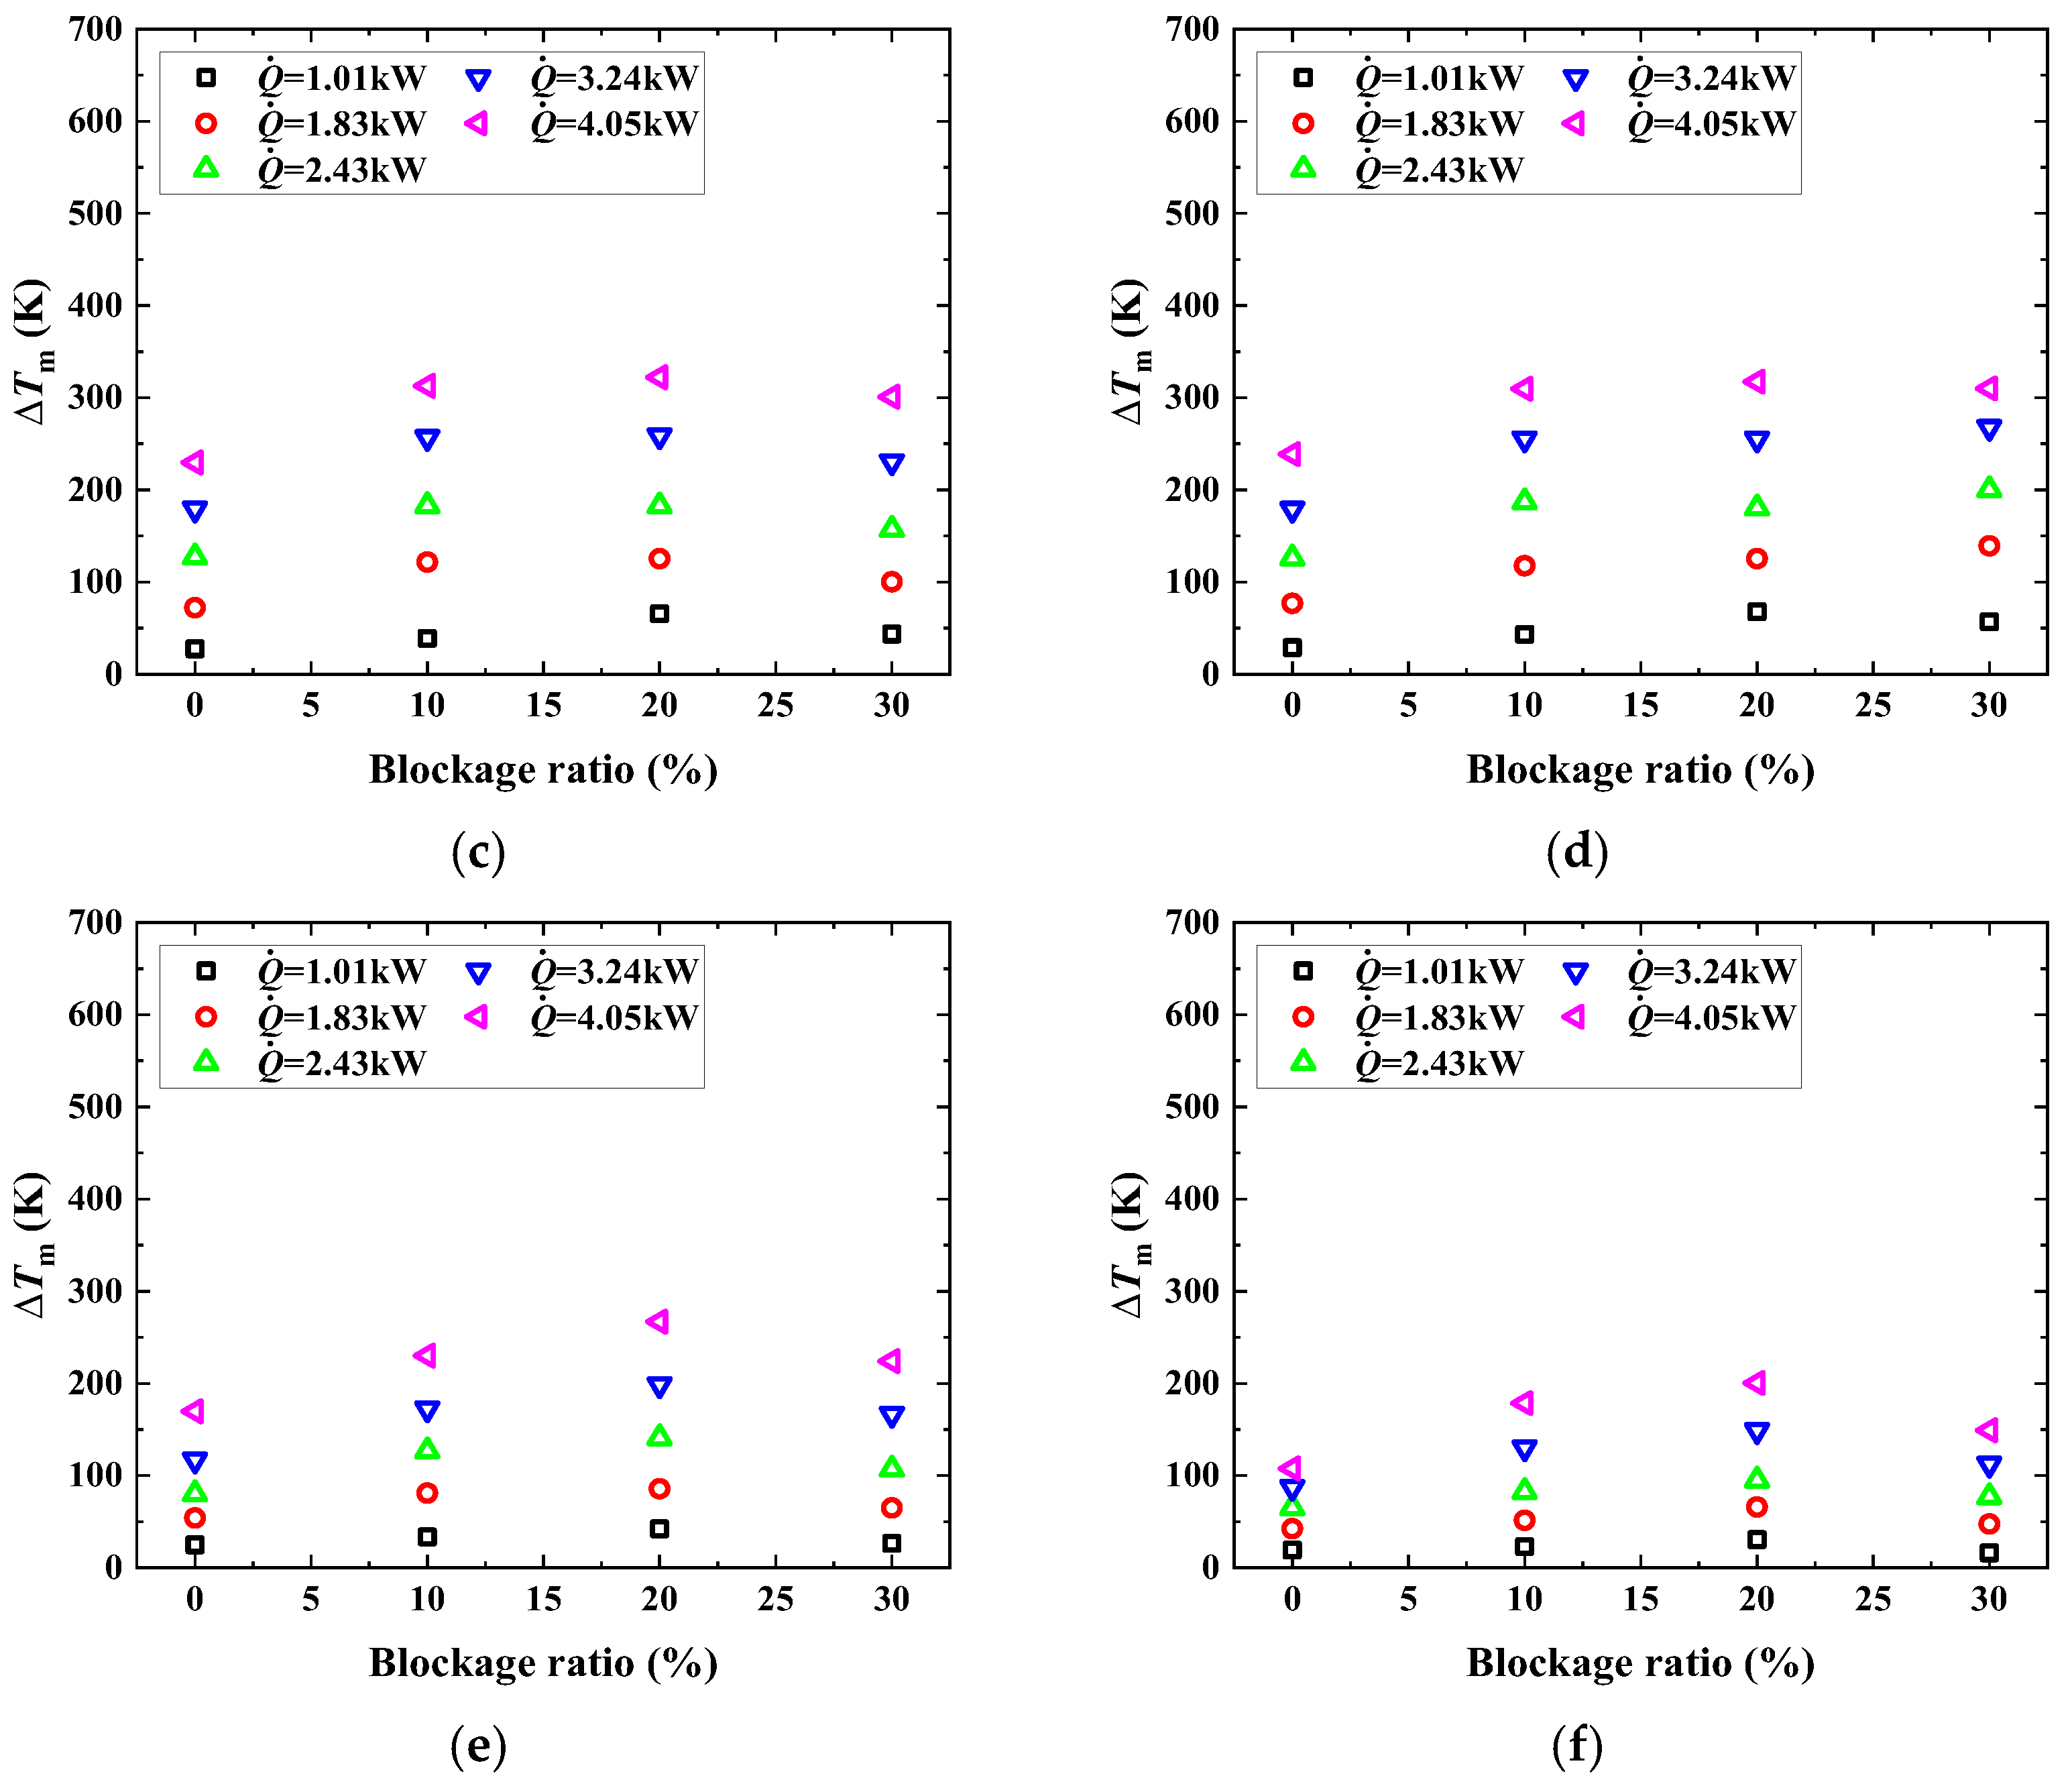
3.2. Variation in Maximum Temperature Rises with Blockage Ratios in the Interconnected Tunnel

At a certain ventilation velocity, the maximum temperature rise increased with the blockage ratio for the 0%, 10%, and 20% blockage ratios, as shown in Figure 9. Behind the blockage, the wind created a vortex area. Because the wind flow created a vortex area behind the obstruction when the blockage was located upstream of the fire, it resulted in a slowed local velocity and enhanced thermal feedback of the fire source, as well as an increase in the maximum temperature. The length and size of the vortex would have steadily risen as the blocking ratio increased [21]. When the blockage ratio was 30%, it was rather high; when the blockage ratio was increased, velocity increased, but the maximum temperature rise was reduced. Who was more impacted by the vehicle blockage ratio or velocity determines the maximum temperature rise in the interconnected tunnel.
According to the analysis of 3.1, the velocities of ramp C and ramp D jointly affected the maximum temperature rise of the interconnected tunnel. The change in the maximum temperature rise from velocity Scheme 1 to 6 shows that as the velocity increased in the interconnected tunnel, convective heat transfer near the fire source increased, resulting in a decrease in temperature and a decrease in the effect of the blockage ratio on the maximum temperature rise.

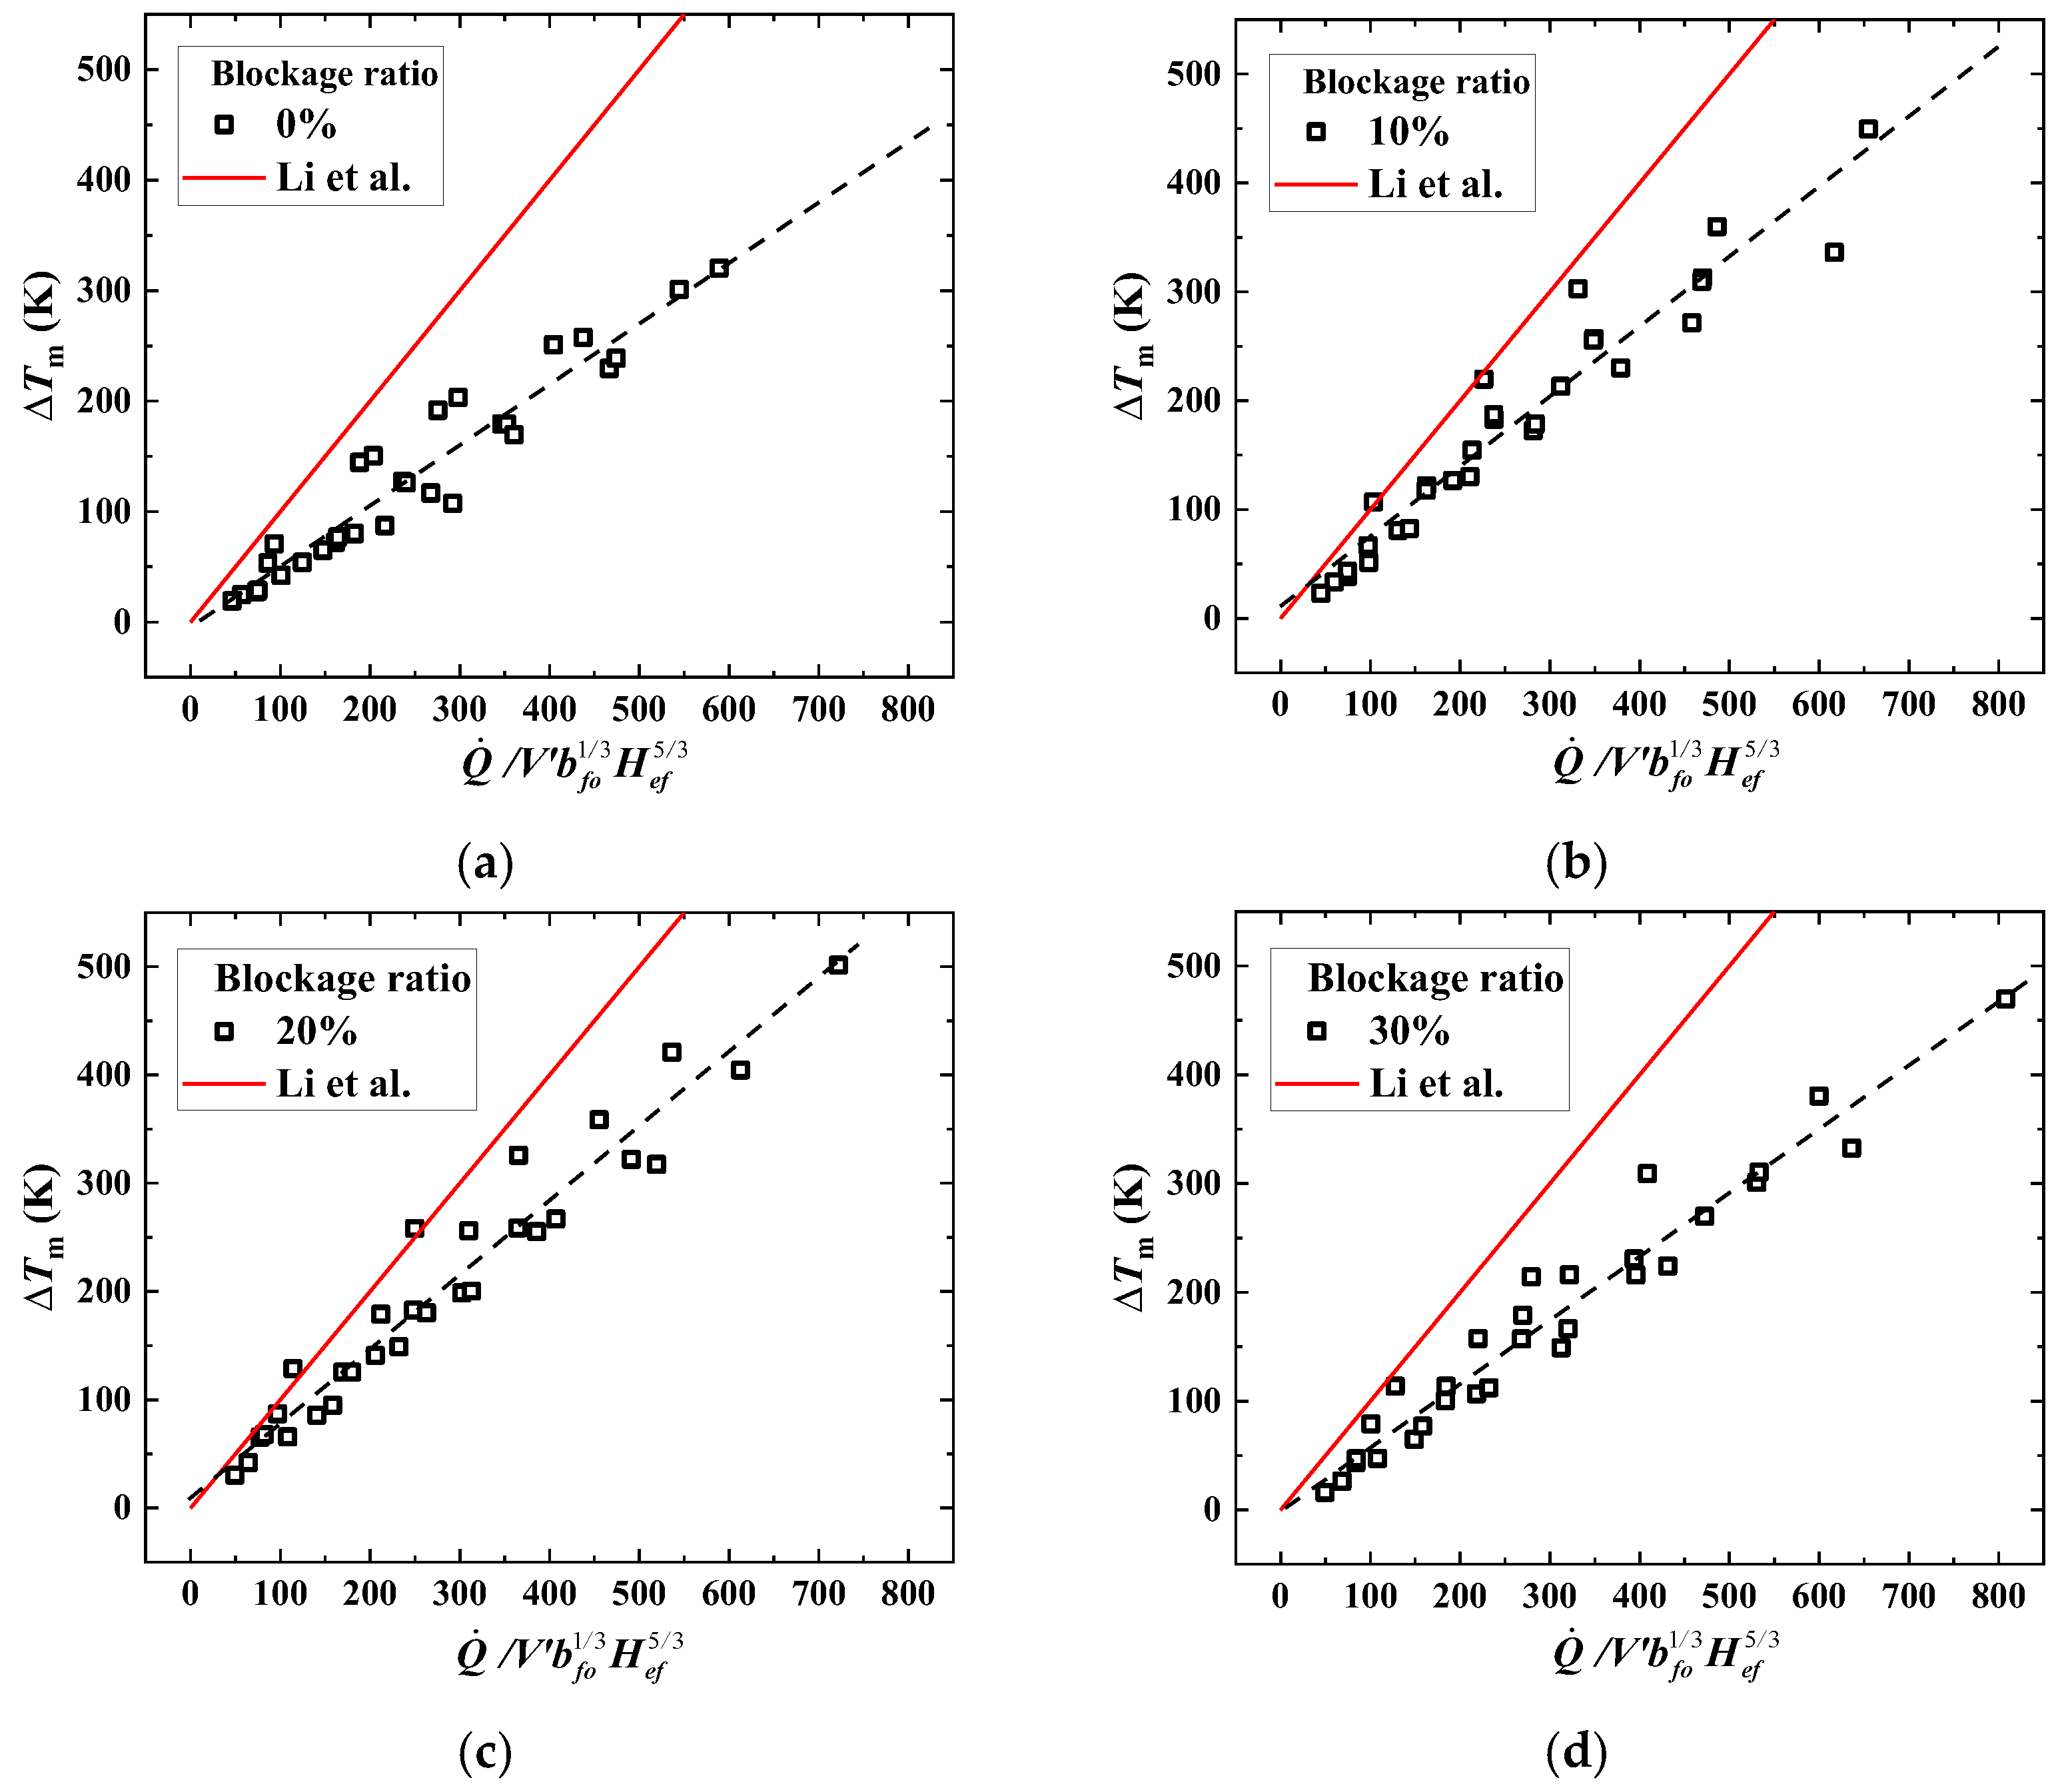
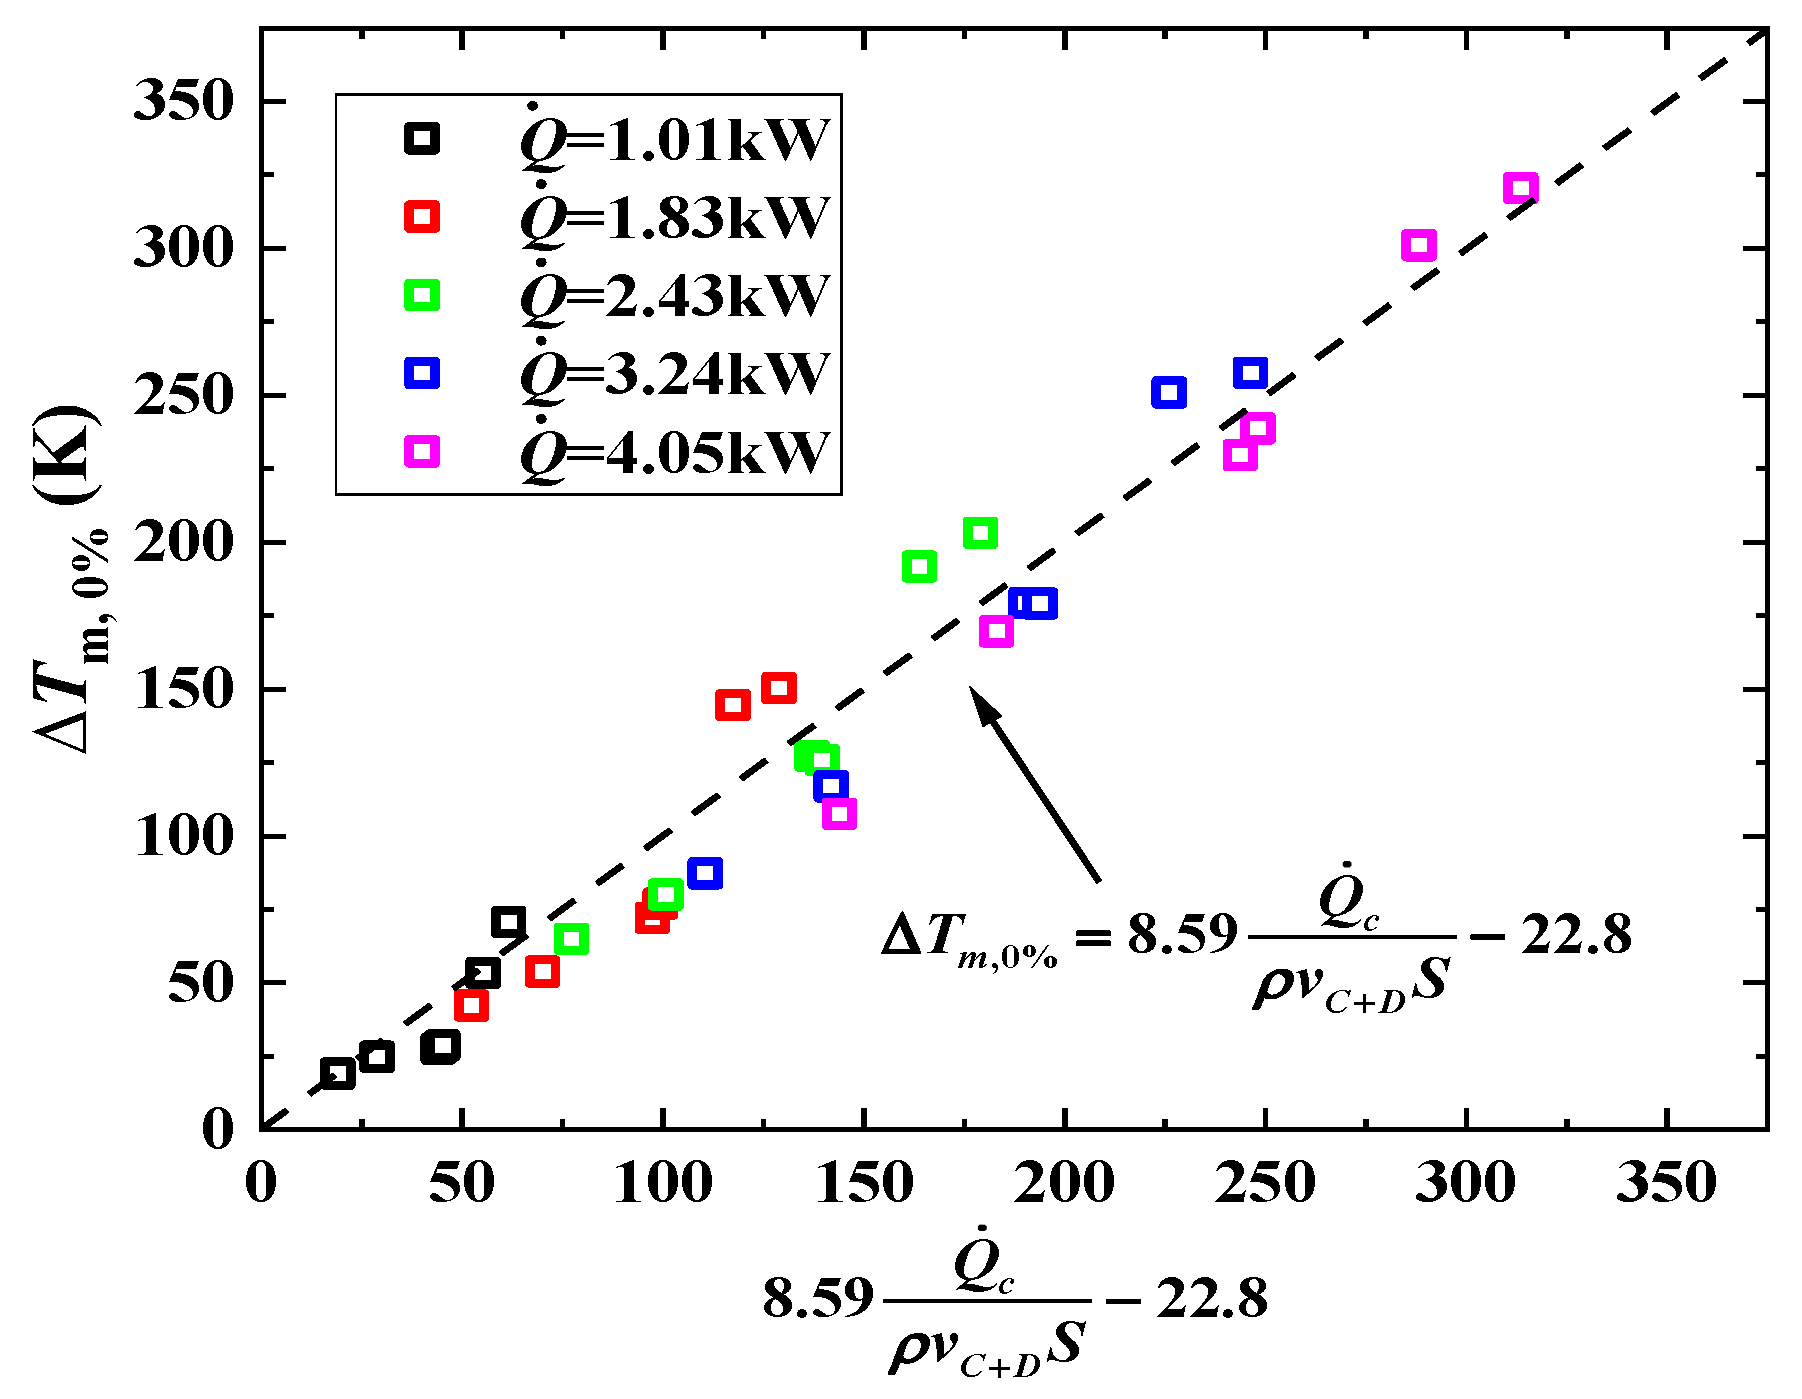
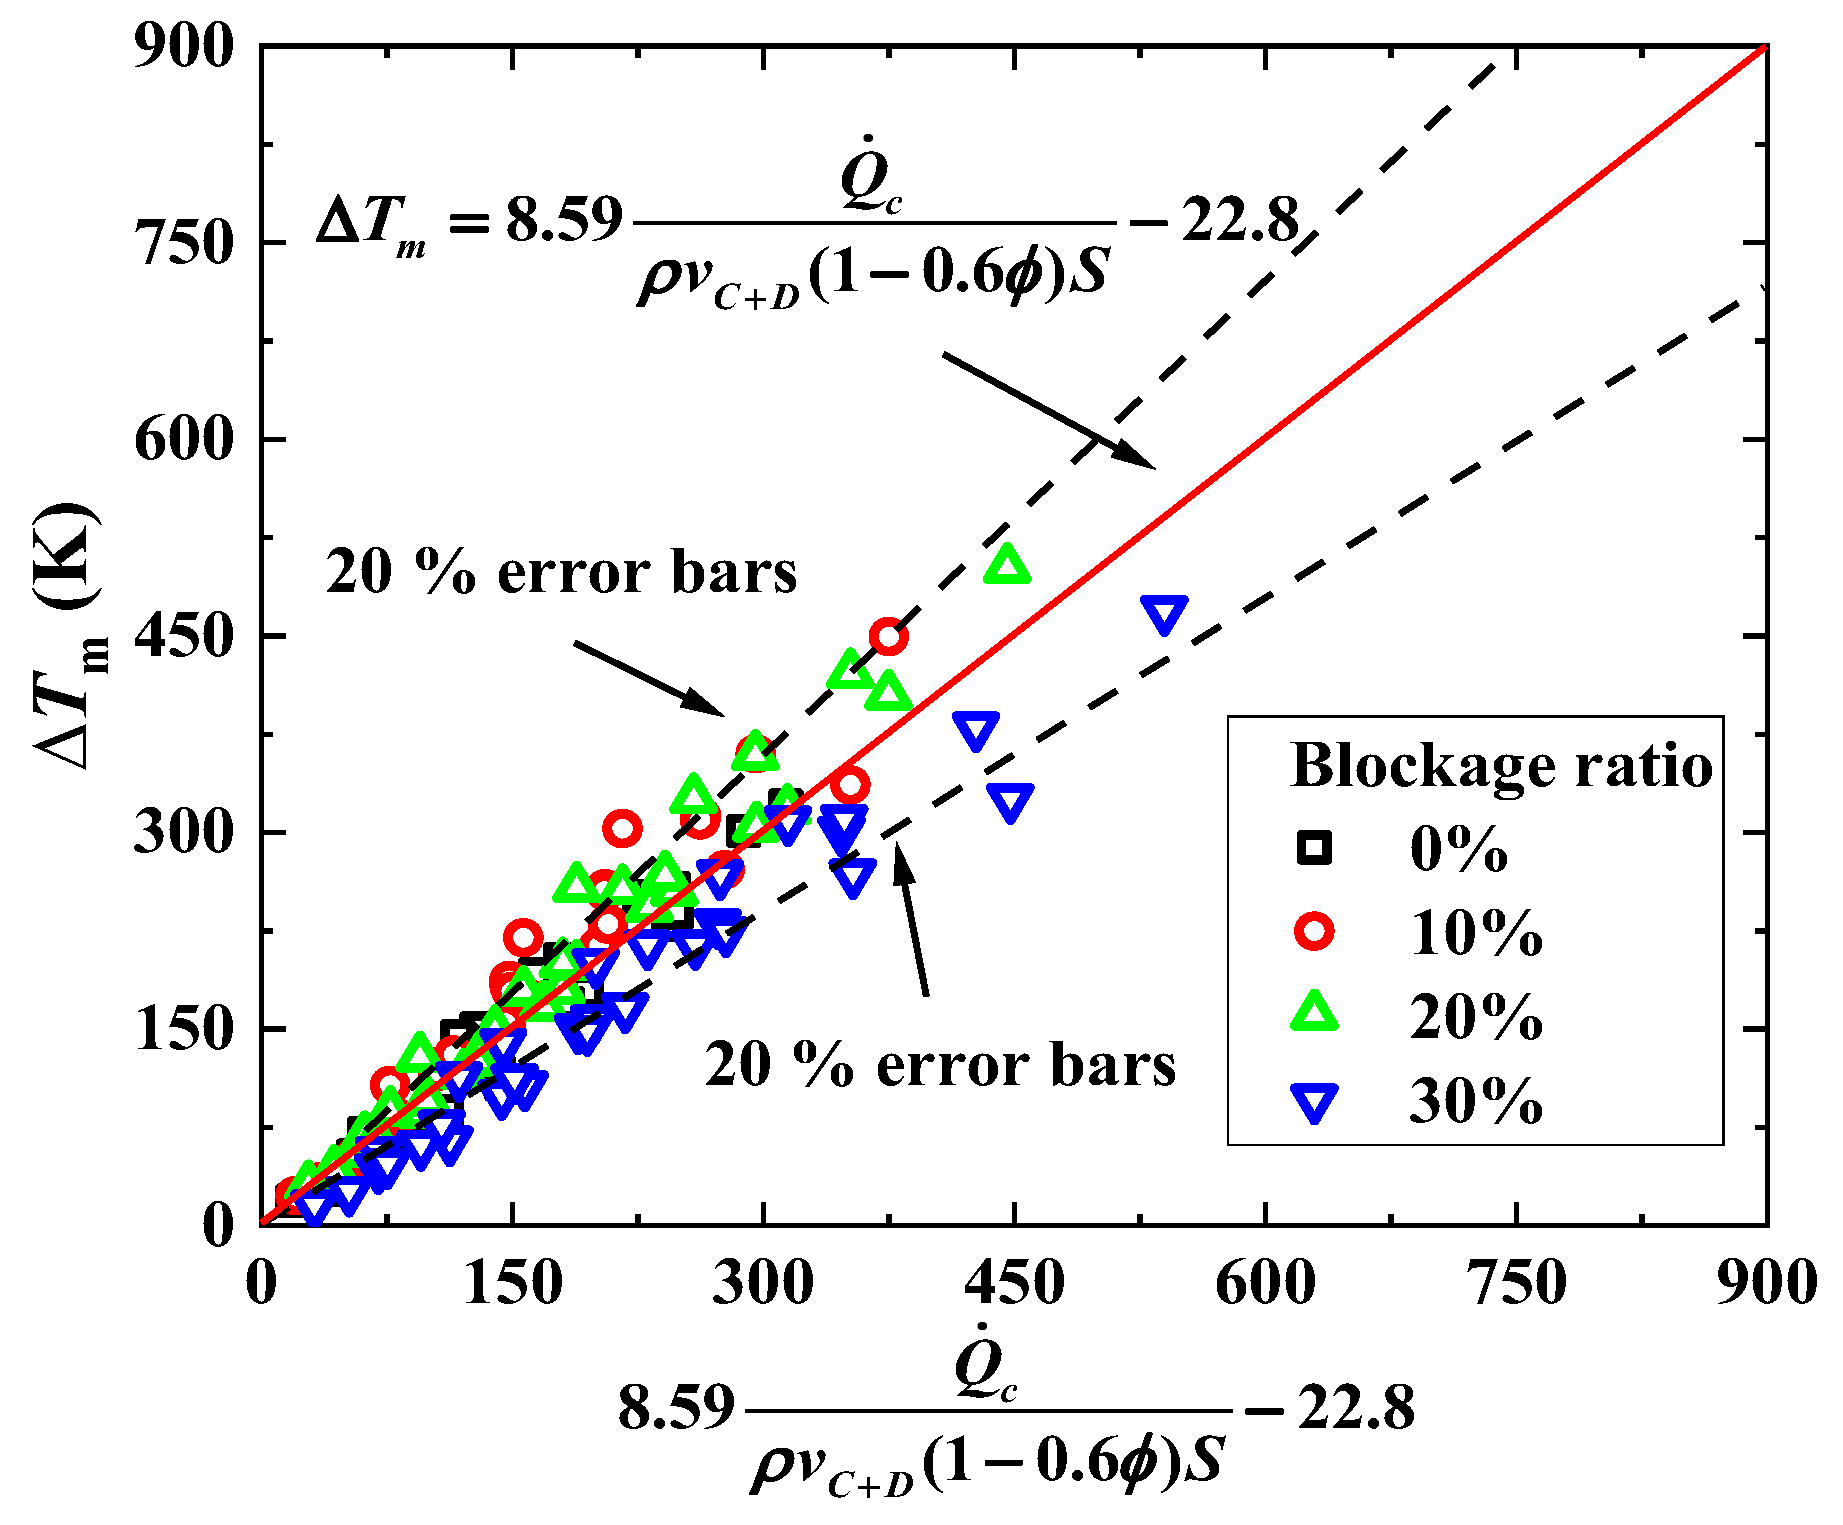
3.3. Maximum Temperature Rise Prediction Model for Interconnected Tunnel

The experimental data were processed by the maximum temperature rise prediction Equation (6) proposed by Li [16]. The sum of the velocities of ramps C and D was used as the characteristic velocity. The maximum temperature rise data fit well, as shown in Figure 10. It demonstrated how the velocities of ramp C and ramp D had an impact on the maximum temperature rise. However, the experimental results were lower than the prediction of Equation (6).
Δ T m = Q ˙ V b f o 1 / 3 H e f 5 / 3 ,     V > 0.19
  V = V C + D = V C + D w * w * = Q ˙ g b f o ρ 0 c p T 0 1 / 3
where:
  • V C + D is the sum of ramps C and D velocity (m/s).
This is because the maximum temperature rise prediction equation proposed by Li is based on ventilation tests in the single-pipe tunnel. The maximum temperature rise in this paper was based on the interconnected tunnel. At the same velocity, the tunnel section where the fire source was located was larger than the tunnel section in the Li model, so the air volume was also larger than that in the Li model. Ramp C and ramp D supplied air at the same time, which increased the contact area between the fire plume and the airflow, so the air entrainment of the fire plume in the tunnel section also increased, which resulted in the decrease in the temperature. Therefore, the experiment data were lower than Equation (6).
Figure 11 contrasts the maximum temperature increases with various blockage ratios with the predictions of the Li model. It was discovered that there were no obvious fluctuation tendencies in the distribution under the various blockage ratios. This demonstrates that when the interconnected tunnel was blocked, Equation (6) was not capable of forecasting the increase in temperature.
Equation (6) focuses on the maximum temperature rise of the single-pipe tunnel. To better understand the maximum temperature rise during the interconnected tunnel’s blockage, this paper establishes a suitable maximum temperature rise model for different blockage ratios of the test data. The effects of vehicle blockage, longitudinal ventilation velocity, and HRR on the maximum temperature increase in an interconnected tunnel were studied in this model, where the ventilation velocity of ramp D was directly affected by the vehicle blockage.
In the underground interconnected tunnel, the maximum temperature rise was affected by the velocities of both ramp C and ramp D, while the velocity of ramp D changed with the vehicle blockage ratios. The longitudinal velocity and blocking ratio were combined with interconnected tunnels, and this paper analyzed the smoke mass flow rate to establish a prediction model.
The smoke mass flow was mainly composed of the fuel mass flow and air mass flow in ramp C and ramp D.
m ˙ s = m ˙ C + m ˙ D + m ˙ f
The fuel mass flow rate was much lower than that of ramp C and ramp D. Therefore, the mass flow rate of smoke can be expressed by the sums of the longitudinal ventilation velocities of ramps C and D:
m ˙ s = ρ V C + D S
where:
  • S is the tunnel cross-sectional area (m2).
Based on the heat calculation formula, where Q ˙ c = 0.7 Q ˙ :
Q ˙ c = C × m ˙ × Δ T m
where C is a constant.
The maximum temperature rise is proportional to Q ˙ c / m ˙ , as shown in Equation (11):
Δ T m Q ˙ c ρ V C + D S
When the blockage ratio is 0%, the relation (12) is obtained from Equation (11), which is shown in Figure 12 by fitting the data.
Δ T m , 0   % Q ˙ c ρ v C + D S
where:
  • v C + D is the sum of the velocity of ramps C and D when the blockage ratio is 0%.
As can be seen from Figure 12, the prediction equation at 0% blockage is shown in Equation (13), which agrees well with the experimental results.
Δ T m , 0   % = 8.59 Q ˙ c ρ v C + D S 22.8 ,     0.6 v C + D 1.6
For the velocity sum of ramps C and D, introducing the blockage ratio ϕ , the following relationship can be obtained:
V C + D = v C + D g ( ϕ )
As the blockage ratio increases in the interconnected tunnel, the sum of the velocities at ramps C and D becomes lower. If the relationship between V C + D and v C + D satisfies Equation (15), the data are fitted by fitting the data as shown in Figure 13.
g ( ϕ ) = V C + D / v C + D = ( 1 a ϕ )
The relationship between the ratio V C + D and v C + D and the blockage ratio can be obtained from Figure 13, as shown in Equation (16).
g ( ϕ ) = V C + D / v C + D = ( 1 0.6 ϕ ) ,     0 % ϕ 30 %
Equations (13) and (16) may be used to derive the link (11) between the maximum temperature rise and velocity and blockage ratio, and the data are fitted, as shown in Figure 14. The test data under different blockage ratios of the interconnected tunnel fit well with the prediction formula, while Li’s [22] formula cannot predict it well, as shown in Figure 15. The prediction formula is shown in Equation (17). This formula applies to interconnected tunnel blockage rates between 0% and 30%.
Δ T m = 8.59 Q ˙ c ρ v C + D ( 1 0.6 ϕ ) S 22.8 ,     0.6 v C + D 1.6

4. Conclusions

The model-scale tunnel calculates the maximum temperature increase in the smoke under the interconnected tunnel by combining the velocity and HRR of the fire source under various blockage ratios. The following are the key conclusions of this paper:
(1) The velocity of the ramps upstream of the fire source and the adjacent ramp have an impact on the maximum temperature rise in the interconnected tunnel. The maximum temperature rise is jointly impacted by both ramps’ ventilation.
(2) The maximum temperature rise in the interconnected tunnel varies with velocity and the blockage ratio. Depending on who is more impacted by the velocity or blockage ratio, the maximum temperature rise differs. The maximum temperature rise decreases, and the impact of the blockage ratio diminishes when the velocity in the interconnected tunnel decreases. This is because the convective heat transfer near the fire source increases.
(3) In an underground interconnected tunnel fire, the maximum temperature rise is influenced by the velocity upstream of the fire source and the adjacent tunnel. As a result, this research provides a novel method for predicting the maximum temperature rise under the underground interconnected tunnel that is blocked by vehicles.
We only studied blockage rates between 0% and 30% in this paper. Additionally, the angles between ramp C and ramp D were not considered. More research will be carried out in the next stage.

Author Contributions

Methodology, Z.X.; software, J.Z.; validation, H.Y.; formal analysis, H.Y.; investigation, H.Y.; resources, B.X.; data curation, Y.Z.; writing—original draft preparation, Y.Z.; writing—review and editing, S.M.S.T. All authors have read and agreed to the published version of the manuscript.

Funding

The Science and Technology Research and Development Program Project of China railway group limited (Major Special Project, No.: 2021-Special-04-2) funded this research.

Institutional Review Board Statement

Not applicable.

Informed Consent Statement

Not applicable.

Data Availability Statement

Not applicable.

Acknowledgments

We acknowledge the High-Performance Computing Center of Central South University for its support.

Conflicts of Interest

The authors declare no conflict of interest.

References

  1. Guo, X.X.; Pan, X.H.; Zhang, L.J.; Wang, Z.L.; Hua, M.; Jiang, C.C. Comparative study on ventilation and smoke extraction systems of different super-long river-crossing subway tunnels under fire scenarios. Tunn. Undergr. Space Technol. 2021, 113, 103849. [Google Scholar] [CrossRef]
  2. Zhou, T.N.; He, Y.P.; Lin, X.; Wang, X.H.; Wang, J. Influence of constraint effect of sidewall on maximum smoke temperature distribution under a tunnel ceiling. Appl. Therm. Eng. 2017, 112, 932–941. [Google Scholar] [CrossRef]
  3. Kang, K. Characteristic length scale of critical ventilation velocity in tunnel smoke control. Tunn. Undergr. Space Technol. 2009, 25, 205–211. [Google Scholar] [CrossRef]
  4. Alper, R.L. Calculation of response time of ceiling-mounted fire detectors. Fire Technol. 1972, 8, 181–195. [Google Scholar] [CrossRef]
  5. Heskestad, G.; Delichatsios, M.A. The initial convective flow in fire. Symp. Int. Combust. 1979, 17, 1113–1123. [Google Scholar] [CrossRef]
  6. Yi, L.; Xu, Q.Q.; Xu, Z.S.; Wu, D.X. An experimental study on critical velocity in sloping tunnel with longitudinal ventilation under fire. Tunn. Undergr. Space Technol. 2014, 43, 198–203. [Google Scholar] [CrossRef]
  7. Zhang, X.L.; Lin, Y.J.; Shi, C.L.; Zhang, J.P. Numerical simulation on the maximum temperature and smoke back-layering length in a tilted tunnel under natural ventilation. Tunn. Undergr. Space Technol. 2021, 107, 103661. [Google Scholar] [CrossRef]
  8. Hu, L.H.; Chen, L.F.; Wu, L.; Li, Y.F.; Zhang, J.Y.; Meng, N. An experimental investigation and correlation on buoyant gas temperature below ceiling in a slopping tunnel fire. Appl. Therm. Eng. 2013, 51, 246–254. [Google Scholar] [CrossRef]
  9. Tang, F.; Cao, Z.L.; Palacios, A.; Wang, Q. A study on the maximum temperature of ceiling jet induced by rectangular source fires in a tunnel using ceiling smoke extraction. Int. J. Therm. Sci. 2018, 127, 329–334. [Google Scholar] [CrossRef]
  10. Zhu, Y.T.; Tang, F.; Zhao, Z.X.; Wang, Q. Effect of lateral smoke extraction on transverse temperature distribution and smoke maximum temperature under ceiling in tunnel fires. J. Therm. Anal. Calorim. 2022, 147, 4275–4284. [Google Scholar] [CrossRef]
  11. Li, Y.Z.; Ingason, H. Overview of research on fire safety in underground road and railway tunnels. Tunn. Undergr. Space Technol. 2018, 81, 568–589. [Google Scholar] [CrossRef]
  12. Zhuang, Y.Z.; Ding, H.; Zheng, G.P.; Cui, Y.K.; Huang, Y. Study on Ventilation System Linkage Control Strategy in a Double-Hole Tunnel Fire. Adv. Mater. Sci. Eng. 2020, 2020, 5163632. [Google Scholar] [CrossRef]
  13. Han, J.Q.; Liu, F.; Wang, F.; Weng, M.C.; Liao, S.J. Full-scale experimental investigation on smoke spreading and thermal characteristic in a transversely ventilated urban traffic link tunnel. Int. J. Therm. Sci. 2021, 170, 107130. [Google Scholar] [CrossRef]
  14. Zhong, W.; Liu, L.; Han, N.; Gao, Z.H.; Zhao, J. Investigation on the maximum ceiling temperature of the weak plume impingement flow in tunnel fires under longitudinal ventilation. Tunn. Undergr. Space Technol. 2023, 131, 104821. [Google Scholar] [CrossRef]
  15. Kurioka, H.; Oka, Y.; Satoh, H.; Sugawa, O. Fire properties in near field of square fire source with longitudinal ventilation in tunnels. Fire Saf. J. 2003, 38, 319–340. [Google Scholar] [CrossRef]
  16. Li, Y.Z.; Lei, B.; Ingason, H. The maximum temperature of buoyancy-driven smoke flow beneath the ceiling in tunnel fires. Fire Saf. J. 2011, 46, 204–210. [Google Scholar] [CrossRef]
  17. Li, L.M.; Cheng, X.D.; Cui, Y.; Li, S.; Zhang, H.P. Effect of blockage ratio on critical velocity in tunnel fires. J. Fire Sci. 2012, 30, 413–427. [Google Scholar] [CrossRef]
  18. Luo, J.L.; Xu, Z.S.; Li, F.L.; Zhao, J.M. Effect of vehicular blocking scene on smoke spread in the longitudinal ventilated tunnel fire. Case Stud. Therm. Eng. 2019, 14, 100495. [Google Scholar] [CrossRef]
  19. Tang, F.; Cao, Z.L.; Chen, Q.; Meng, N.; Wang, Q.; Fan, C.G. Effect of blockage-heat source distance on maximum temperature of buoyancy-induced smoke flow beneath ceiling in a longitudinal ventilated tunnel. Int. J. Heat Mass Transf. 2017, 109, 683–688. [Google Scholar] [CrossRef]
  20. Meng, N.; Liu, B.B.; Li, X.; Jin, X.N.; Huang, Y.J.; Wang, Q. Effect of blockage-induced near wake flow on fire properties in a longitudinally ventilated tunnel. Int. J. Therm. Sci. 2018, 134, 1–12. [Google Scholar] [CrossRef]
  21. Kayili, S.; Yozgatligil, A.; CahitEralp, O. An experimental study on the effects of blockage ratio and ventilation velocity on the heat release rate of tunnel fires. J. Fire Sci. 2011, 29, 555–575. [Google Scholar] [CrossRef]
  22. Li, L.M.; Cheng, X.D.; Cui, Y.; Dong, W.H. Effect of blockage ratio on the maximum temperature under the ceiling in tunnel fires. J. Fire Sci. 2013, 31, 245–257. [Google Scholar] [CrossRef]
  23. Huang, Y.B.; Li, Y.F.; Li, J.F.; Li, J.X.; Wu, K.; Zhu, K.; Li, H.H. Experimental investigation on maximum gas temperature beneath the ceiling in a branched tunnel fire. Int. J. Therm. Sci. 2019, 145, 105997. [Google Scholar] [CrossRef]
  24. Chen, L.F.; Mao, P.F.; Zhang, Y.C.; Xing, S.S.; Li, T. Experimental study on smoke characteristics of bifurcated tunnel fire. Tunn. Undergr. Space Technol. 2020, 98, 103295. [Google Scholar] [CrossRef]
Figure 1. Model-scale underground interconnected tunnel.
Fire 06 00050 g001
Figure 2. Schematic diagram of the different sections of the underground interconnected tunnel.
Fire 06 00050 g002
Figure 3. The layout of test points for the model-scale test.
Fire 06 00050 g003
Figure 4. Variation in longitudinal ventilation velocities with different blockage ratios under the same velocity scheme: (a) ramp C velocity; (b) ramp D velocity.
Fire 06 00050 g004
Figure 5. Variation in the sum of longitudinal ventilation velocities with blockage ratio for ramps C and D.
Fire 06 00050 g005
Figure 6. Variation in maximum temperature rise with HRR under similar velocities on ramp C: (a) ϕ = 10%; (b) ϕ = 20%.
Fire 06 00050 g006
Figure 7. Variation in maximum temperature rise with HRR under similar velocities on ramp D: (a) ϕ = 10%; (b) ϕ = 20%.
Fire 06 00050 g007
Figure 8. The maximum temperature rise varies with HRR ( ϕ = 0%).
Fire 06 00050 g008
Figure 9. The maximum temperature rise varies with blockage ratio: (a) Scheme 1; (b) Scheme 2; (c) Scheme 3; (d) Scheme 4; (e) Scheme 5; (f) Scheme 6.
Fire 06 00050 g009aFire 06 00050 g009b
Figure 10. Fitting of maximum temperature rise with different blockage ratios: (a) ϕ = 0%; (b) ϕ = 10%; (c) ϕ = 20%; (d) ϕ = 30%.
Fire 06 00050 g010
Figure 11. Comparison of the maximum temperature rise with the prediction equation of Li.
Fire 06 00050 g011
Figure 12. Maximum temperature rise prediction formula ( ϕ = 0%).
Fire 06 00050 g012
Figure 13. Variation in velocities with blockage ratio.
Fire 06 00050 g013
Figure 14. Maximum temperature rise prediction formula of different blockage ratios.
Fire 06 00050 g014
Figure 15. Comparison between the Li’s model and the experimental data considered in this study.
Fire 06 00050 g015
Table 1. Parameters of different segments of the underground interconnected tunnel.
RampNumberCurvature Radius R (m)Length (m)
C13.00
C24.353.41
D3(bifurcated point)--
D43.00
C52.503.93
C62.504.88
C71.50
C84.503.22
Table 2. Experimental conditions.
Test NO.Velocity SchemeHRR (kW)Blockage Ratio (%) ϕ Ramp C Velocity (m/s)Ramp D Velocity (m/s)
VCVD
1–20Scheme 11.01,
1.83,
2.43,
3.24,
4.05
0, 10,
20, 30
0.420.38
21–40Scheme 20.410.45
41–60Scheme 30.400.61
61–80Scheme 40.440.55
81–100Scheme 50.460.85
101–120Scheme 60.650.96
Table 3. Longitudinal ventilation velocity measured values of ramp C and ramp D.
Test NO.Longitudinal Ventilation Velocities (m/s)
ϕ 0%10%20%30%
RampCDCDCDCD
1–20 0.420.380.400.320.410.250.420.16
21–40 0.410.450.280.470.370.440.300.40
41–60 0.400.610.350.650.340.620.330.55
61–80 0.440.550.400.600.460.460.470.41
81–100 0.460.850.380.870.430.730.430.68
101–120 0.650.960.750.910.650.830.720.78
Disclaimer/Publisher’s Note: The statements, opinions and data contained in all publications are solely those of the individual author(s) and contributor(s) and not of MDPI and/or the editor(s). MDPI and/or the editor(s) disclaim responsibility for any injury to people or property resulting from any ideas, methods, instructions or products referred to in the content.

