Article

Optimization of Smoke-Detector Installation Location Based on Effect of Fan Equipment inside Distribution Panel on Fire Detection Performance

1
METIS 84, Pungsesandan-ro, Pungse-myeon, Dongnam-gu, Cheonan-si 330912, Chungcheongnam-do, Republic of Korea
2
Department of IT Convergence Software Engineering for Highly-Skilled Professionals, Korea University of Technology & Education (KOREATECH) 503, Damheon Hall of Practical Education, 1600 Chungjeol-ro, Dongnam-gu, Cheonan-si 31253, Chungcheongnam-do, Republic of Korea
*
Author to whom correspondence should be addressed.
Submission received: 14 November 2022 / Revised: 4 January 2023 / Accepted: 27 January 2023 / Published: 28 January 2023
(This article belongs to the Special Issue Fire Detection and Public Safety)

Abstract

:
Inhalation and exhaust fans are installed inside a distribution panel for cooling. However, in the event of fire inside the panel, these fans change the flow of smoke, which interferes with quick detection by fire sensors installed on the panel ceiling, thereby increasing fire damage. The purpose of this study is to develop a smoke detector that can be installed inside distribution panels and to propose an optimal smoke detector position based on the influence of the position on detection performance. To this end, an experimental distribution panel was fabricated and four smoke detector samples were installed near the fans. The smoke detection performance experiment was repeated on ignition source positions corresponding to widths of 15, 30, 45, and 50 cm, a depth of 55 cm, and heights of 0, 30, and 60 cm. The results indicated that the smoke detection performance and CO absorption concentration were higher when the smoke detector was positioned closer to the left or right side of the exhaust fan. In particular, compared with current designs in which smoke detectors are installed on distribution panel ceilings, the elapsed time until smoke detection decreased by 75%, whereas the CO absorption concentration increased by more than 100%. This study presents a theoretical ground for the installation of built-in smoke detectors near exhaust fans for closed power industry equipment that includes airflow-changing devices. Additionally, this study raises awareness on the importance of fire sensors and the need to improve policies and standards for fire prevention.

1. Introduction

In general, a fire that occurs in a building forms an airflow that reaches the ceiling and spreads in all directions because of the buoyancy caused by the heat of the smoke generated from the ignition source, resulting in a thick layer and a room filled with smoke [1]. However, in the event of an electrical fire in a distribution panel, the smoke is discharged by the buoyancy due to heat through the inhalation and exhaust fans installed in the panel [2] or the time by which the smoke reaches the ceiling of the panel is delayed [3]. This is the main cause of an increase in burning damage at the beginning of a fire.
For industrial equipment designed with closed structures, inhalation and exhaust fans are installed to reduce the temperature of the heat generated inside. The hot air is guided toward the top by buoyancy, cooled slowly, and discharged through the exhaust fans [2]. Inside the distribution panel, which controls the supply and distribution of electricity for automation equipment [4,5], various thermometers [6,7] and fire sensors [8] are installed and operated for electric fire prevention and early detection. Smoke detectors, which are a type of fire sensor, are divided into ionization and photoelectric smoke detectors. An ionization smoke detector detects changes in the ion current from the smoke concentration of combustion products generated from fire, such as heat, smoke, and flame [9,10,11,12]. A photoelectric smoke detector detects changes due to smoke in the amount of light that contacts its photovoltaic device when a certain concentration of smoke is contained in the chamber [13] and includes a transmitter and a receiver [14,15]. For type-1 photoelectric smoke detectors (light sensitivity of 7.5%) [16] and type-2 photoelectric smoke detectors (light sensitivity of 15%) [15], the attachment height is determined according to the detector type and light sensitivity, as stipulated in Article 7 of the “fire safety standards for automatic fire detection equipment and visual information devices (NFSC 203)”; Article 7(3) No. 2 stipulates that smoke detectors must be attached to the ceiling or a concealed space inside the ceiling for installation [11,17,18].
Accordingly, in this study, certain positions inside a distribution panel were selected and the detection time and carbon monoxide (CO) concentration of a smoke detector installed on the ceiling were measured via a fire simulation. The simulation results were then compared with those of an experiment in which the detection time at each position was measured to propose an optimal fire sensor position for closed electrical equipment that includes airflow-changing devices.
This study provides a new social awareness that fire detection equipment, such as smoke detectors having embedded gas-sensor functions, that are installed inside electrical panel structures, such as distribution boards, and fire detectors installed on a ceiling should be positioned as close to the exhaust fans as possible. It also provides a theoretical basis for selecting fire sensor positions inside a distribution panel. Specifically, this study presents a theoretical basis for the installation of built-in smoke detectors near exhaust fans for closed power industry equipment. Additionally, the results of this study are expected to significantly contribute to the prevention of large fires caused by the more widespread usage of automation equipment, increase recognition of the importance of fire sensors, and lead to improvements in fire prevention policies.

2. Literature Review

Hong et al. [9] proposed a combined smoke detector based on multiple sensors for early fire detection in rack-type warehouses. They performed an experiment to verify the smoke detection performance of their smoke detector, which was composed of a thermistor temperature sensor, photoelectric smoke sensor, and electrochemical CO sensor. Their study was similar to the present study in that the fire detection speed was measured as an indicator of performance. However, there is a difference in that the main topic of the present study is the relationship between the smoke detection speed and the influence of airflow change caused by inhalation/exhaust fans installed in a confined space.
Zhong et al. [15] placed ten fire sensors in the center of a 3 m-high ceiling in a 10 m (W) × 8 m (L) × 4 m (H) chamber to test their fire detection performance. Smoke combustion data were extracted for firewood, raw cotton, polyurethane, and flame liquid (n-heptane) as ignition sources and butter oil and incense as interfering ignition sources. They presented a method for increasing the reliability of fire sensors based on a comparison of the smoke combustion intensities of two experiments. However, whereas they performed experiments to increase the reliability of fire sensors by analyzing general butter smoke and incense smoke from various ignition sources, the present study is different in that the reliability of fire sensors is increased using suggestions for detector installation positions based on an analysis of the flow of smoke under the influence of exhaust fans.
Choi and Lee [17] analyzed the influence of airflow from a ceiling-type air conditioner on a fire detector operation. They performed an experiment to analyze the smoke detector response time by airflow in the same manner as in the present study; however, their target was an office space rather than specific equipment such as a distribution panel. Additionally, in their study, the experiment was on smoke and heat from ignition caused by cotton, whereas in the present study the investigation was on smoke generated from electric cables. Finally, based on their findings, they proposed the installation of additional detectors based on changes in detection performance.
As described, there is a significant difference between [17] and the present study in that, in the latter, an experiment on fire detection performance was performed based on the structure of a distribution panel rather than external environmental factors, such as air conditioners, even though both studies deal with the relationship between airflow and fire detection. The present study is also significantly different in that an experiment was performed to optimize the detector position rather than the number of detectors as an approach to increasing fire sensitivity.
Because there are limitations in purifying air using conventional fans when smoke is being generated in an indoor and closed space, Munir and Erfianto [2] performed a study in which they installed three fans and a sensor controller in an 8 m (W) × 2.4 m (L) space and developed a controller that uses a distributed fuzzy execution system, which, when smoke is generated, increases air circulation by controlling the speed of the exhaust fan next to the sensor with the highest smoke concentration among the three sensors. By comparison, the present study was also based on the fact that the smoke concentration near an exhaust fan is typically high; however, the two studies differ in that the earlier study performed air purification by controlling exhaust fans based on the concentration.
Choi et al. [19] analyzed the flow of heat and smoke generated in the event of a fire in a rack-type warehouse using fire dynamic simulator (FDS) numerical analysis software. They modeled the simulation space, four-layer rack structure, and ceiling and analyzed the flow of smoke and heat generated by the flame fire based on the sensitivity of n-heptane and cotton wick. Based on this investigation, they determined optimal smoke detector installation conditions for early smoke detection in the event of a fire in a four-layer rack-type structure. Subsequently, they prepared standards for the fire sensor installation position in a rack and the installation of combined fire sensors for early fire detection in rack-type warehouses. As in the present study, they examined the optimal smoke detector installation conditions; however, the material of the smoke and the ignition sources, which were used as simulation input conditions, were different. There is also a difference in that the diffusion characteristics caused by the heat flow rather than the airflow change caused by the fans were analyzed.
Roh and Yoon [20] conducted research to select fire sensors suitable for wooden cultural assets, which have different structural and fire characteristics from those of typical buildings. They conducted an experiment to identify the fire sensor type and installation location suitable for wooden cultural asset structures.
With regard to smoke detector installation location, smoke detectors are recommended for indoor fire monitoring in closed and open spaces, whereas flame and fixed-temperature linear detectors are recommended for outdoor fire monitoring. For indoor fire monitoring in a closed space, such as the experimental environment in the present study, a smoke detector is considered appropriate. However, the experimental site for the present study is different from that used for the aforementioned recommendations because the present study deals with a distribution panel rather than buildings and there is a significant difference in that the smoke detector installation location and response speed were analyzed under the influence of fan airflow in a fireplace.
Son and So [21] fabricated a combined smoke detector and evaluated its performance using a 1 m (W) × 1 m (L) × 1 m (H) closed chamber. Their study was similar to the present study in that a chamber environment was used. However, the influence of the airflow generated by inhalation/exhaust fans was not examined in their study because their experiment focused on the performance of their combined Internet of Things (IoT) multi-fire detector.
He et al. [22] analyzed the entrainment of a mechanical smoke exhaust port installed inside a tunnel and suggested a method for designing a smoke control system for safety inside the tunnel. Based on the simulation result that the smoke concentration was high near the exhaust port, as determined by the entrainment analysis, the experimental environment of their study was similar to that of the present study where fire sensor samples were installed near the exhaust fans.
Xavier and Visakha [23] proposed a video fire detection technology to solve problems associated with conventional fire sensors that are limited in their fire detection capabilities. However, as indicated by the authors, the cost of the solution was high and the installation location in accordance with the camera angle was also important. Specifically, it was difficult to install cameras and secure the camera angle because of internal equipment inside the distribution panel, as was the case for the experimental environment of the present study. Additionally, installing cameras inside multiple distribution panels is considerably costly.
Xie et al. [24] reported that sensor-based fire detectors are not suitable for enclosed indoor fires in the early stage because of their slow speed, the slow flow of smoke in an enclosed environment, and the difficulty for video-based fire detectors to detect enclosed-space fires. Therefore, they proposed early indoor occluded fire detection based on light reflection characteristics as an alternative to conventional sensor- and video-based fire detectors. However, it was not easy to secure the camera angle inside the distribution panel, as in the experimental environment of the present study, because of the internal equipment. In addition, the cost of installing cameras inside the distribution panel was high.
Birajdar et al. [25] proposed real-time vision-based fire detection based on a Raspberry Pi-based vision system that detects smoke flow and tracks people using a deep neural network (DNN). In this study, if additional experiments are conducted in which a smoke flow detection device is added and the smoke density at each position is analyzed, it is expected that more complete research data will be obtained.
Baek et al. [26] developed a fire detection algorithm based on using multiple sensors at different locations and reported that the system reliability was improved compared with that of a single sensor. For comparison, in this study, the smoke detector was developed as a combination of a smoke detection sensor and a CO sensor. Thus, these [21,26] two studies were similar in that both employed experimental methods that utilized multiple sensors; however, the earlier study differed in that the sensors were installed at several locations over a wide space.
Table 1 summarizes the previous studies examined thus far for each research topic.
The present study differs from these past research endeavors in the following aspects. First, in the present study, an experiment on smoke detection was performed in a closed space inside a distribution panel rather than in typical buildings, warehouses, or wooden buildings. Second, the present study analyzed the response time at each installation position due to the airflow of exhaust fans instead of performing an experiment on the airflow formed by cooling/heating equipment, such as ceiling-type air conditioners. Third, the present study aimed to more accurately measure the influence of inhalation and exhaust fans on airflow. To this end, a combined [22] fire sensor was directly fabricated and the smoke detector response speed in the distribution panel was measured in real time through RS-485 [28] communication while the inhalation and exhaust fans were operating. Fourth, a sample dedicated to the experiment performed in the present study was directly fabricated to obtain product approval from an authorized certification agency. Although the characteristics of the present study are based on past research, the results of this study are significantly distinct in that it is an empirical experimental study that specifically deals with differences owing to the internal design structures of closed facilities for the purpose of rapid fire detection.

3. Research Procedure and Experimental Prototype Fabrication

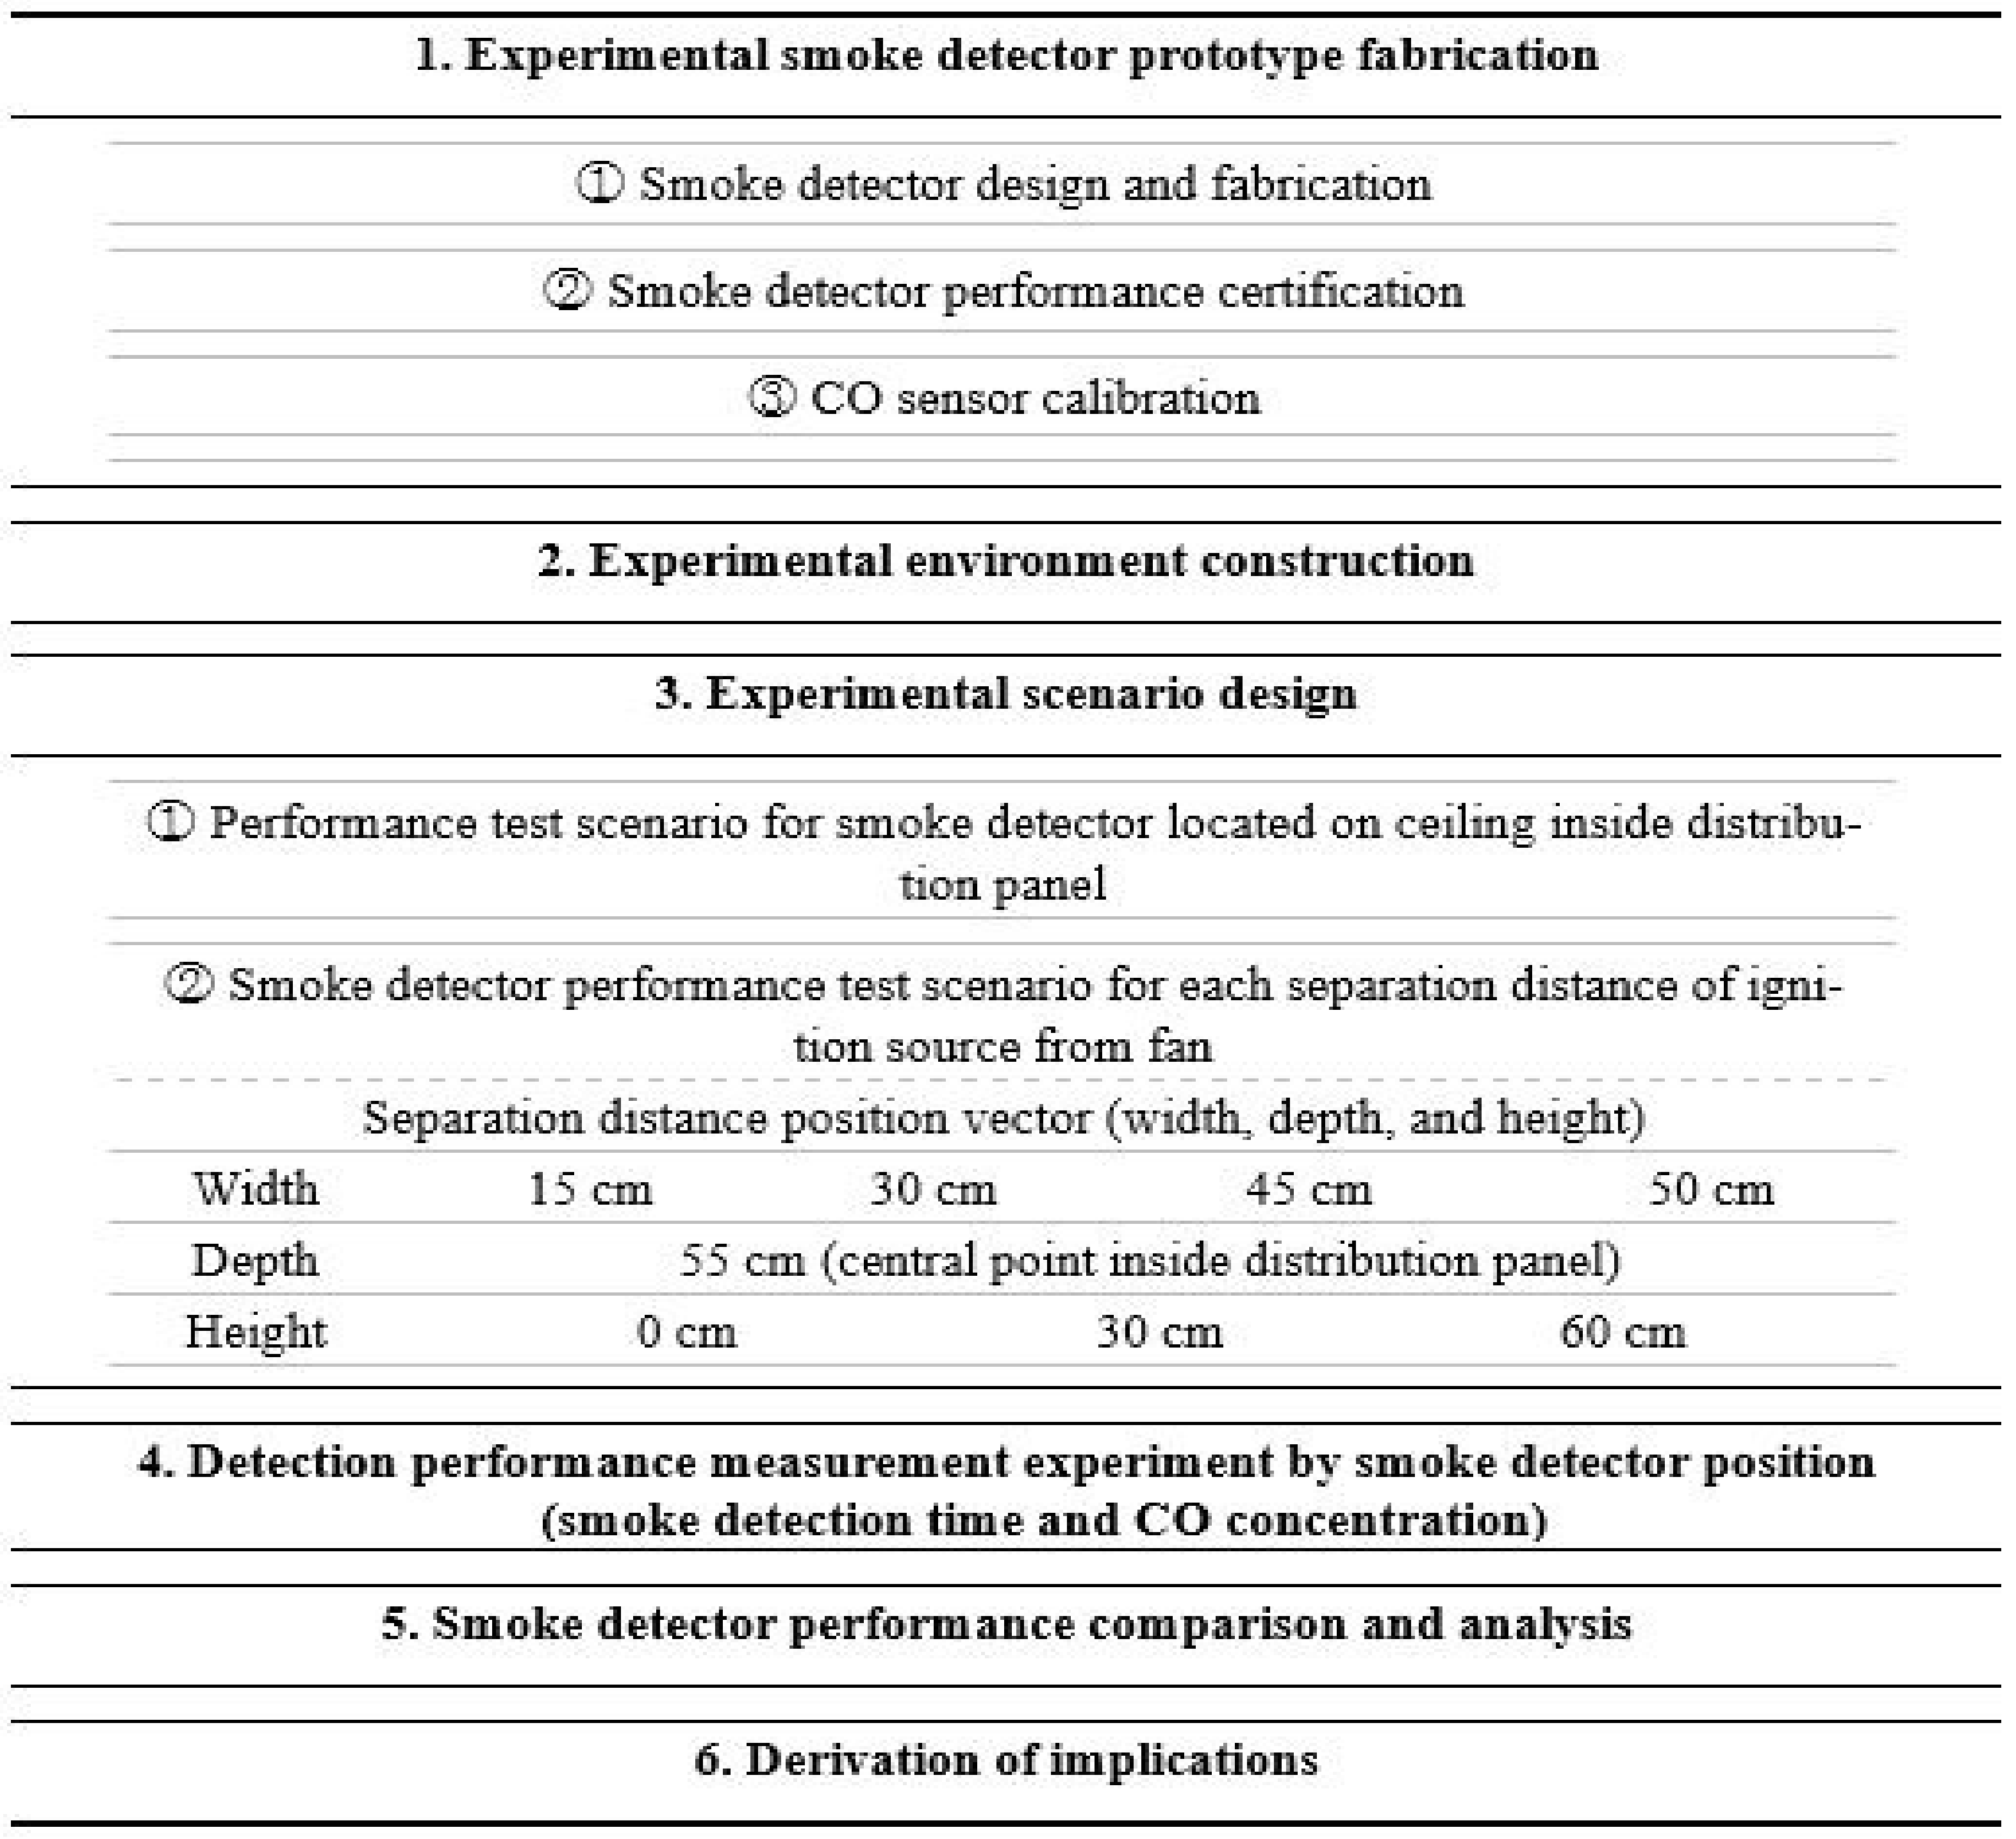
3.1. Research Procedure

For the experiment, a scenario-based performance test using a smoke detector was performed. To this end, the locations of the ignition source and smoke detector were changed for each scenario centering on the exhaust fan and the time until smoke detection and the concentration of carbon monoxide were measured. The smoke detector performance was assessed to be superior because the fire detection time was faster and the carbon monoxide concentration measurement was improved.
Figure 1 shows the research procedure used in this study. In preparation for the experiment, an experimental smoke detector prototype was developed and its product certification was obtained. To this end, a smoke detector was directly designed and fabricated and its performance certification was achieved. Additionally, the performance of the CO sensor inside the smoke detector was calibrated. Subsequently, an experimental environment for this study was constructed and specific experimental scenarios were designed. Finally, a smoke detection performance test was conducted on the performance-certified smoke detector according to the designed scenarios and the detection times were measured and compared to derive implications.

3.2. Experimental Smoke Detector Prototype Fabrication

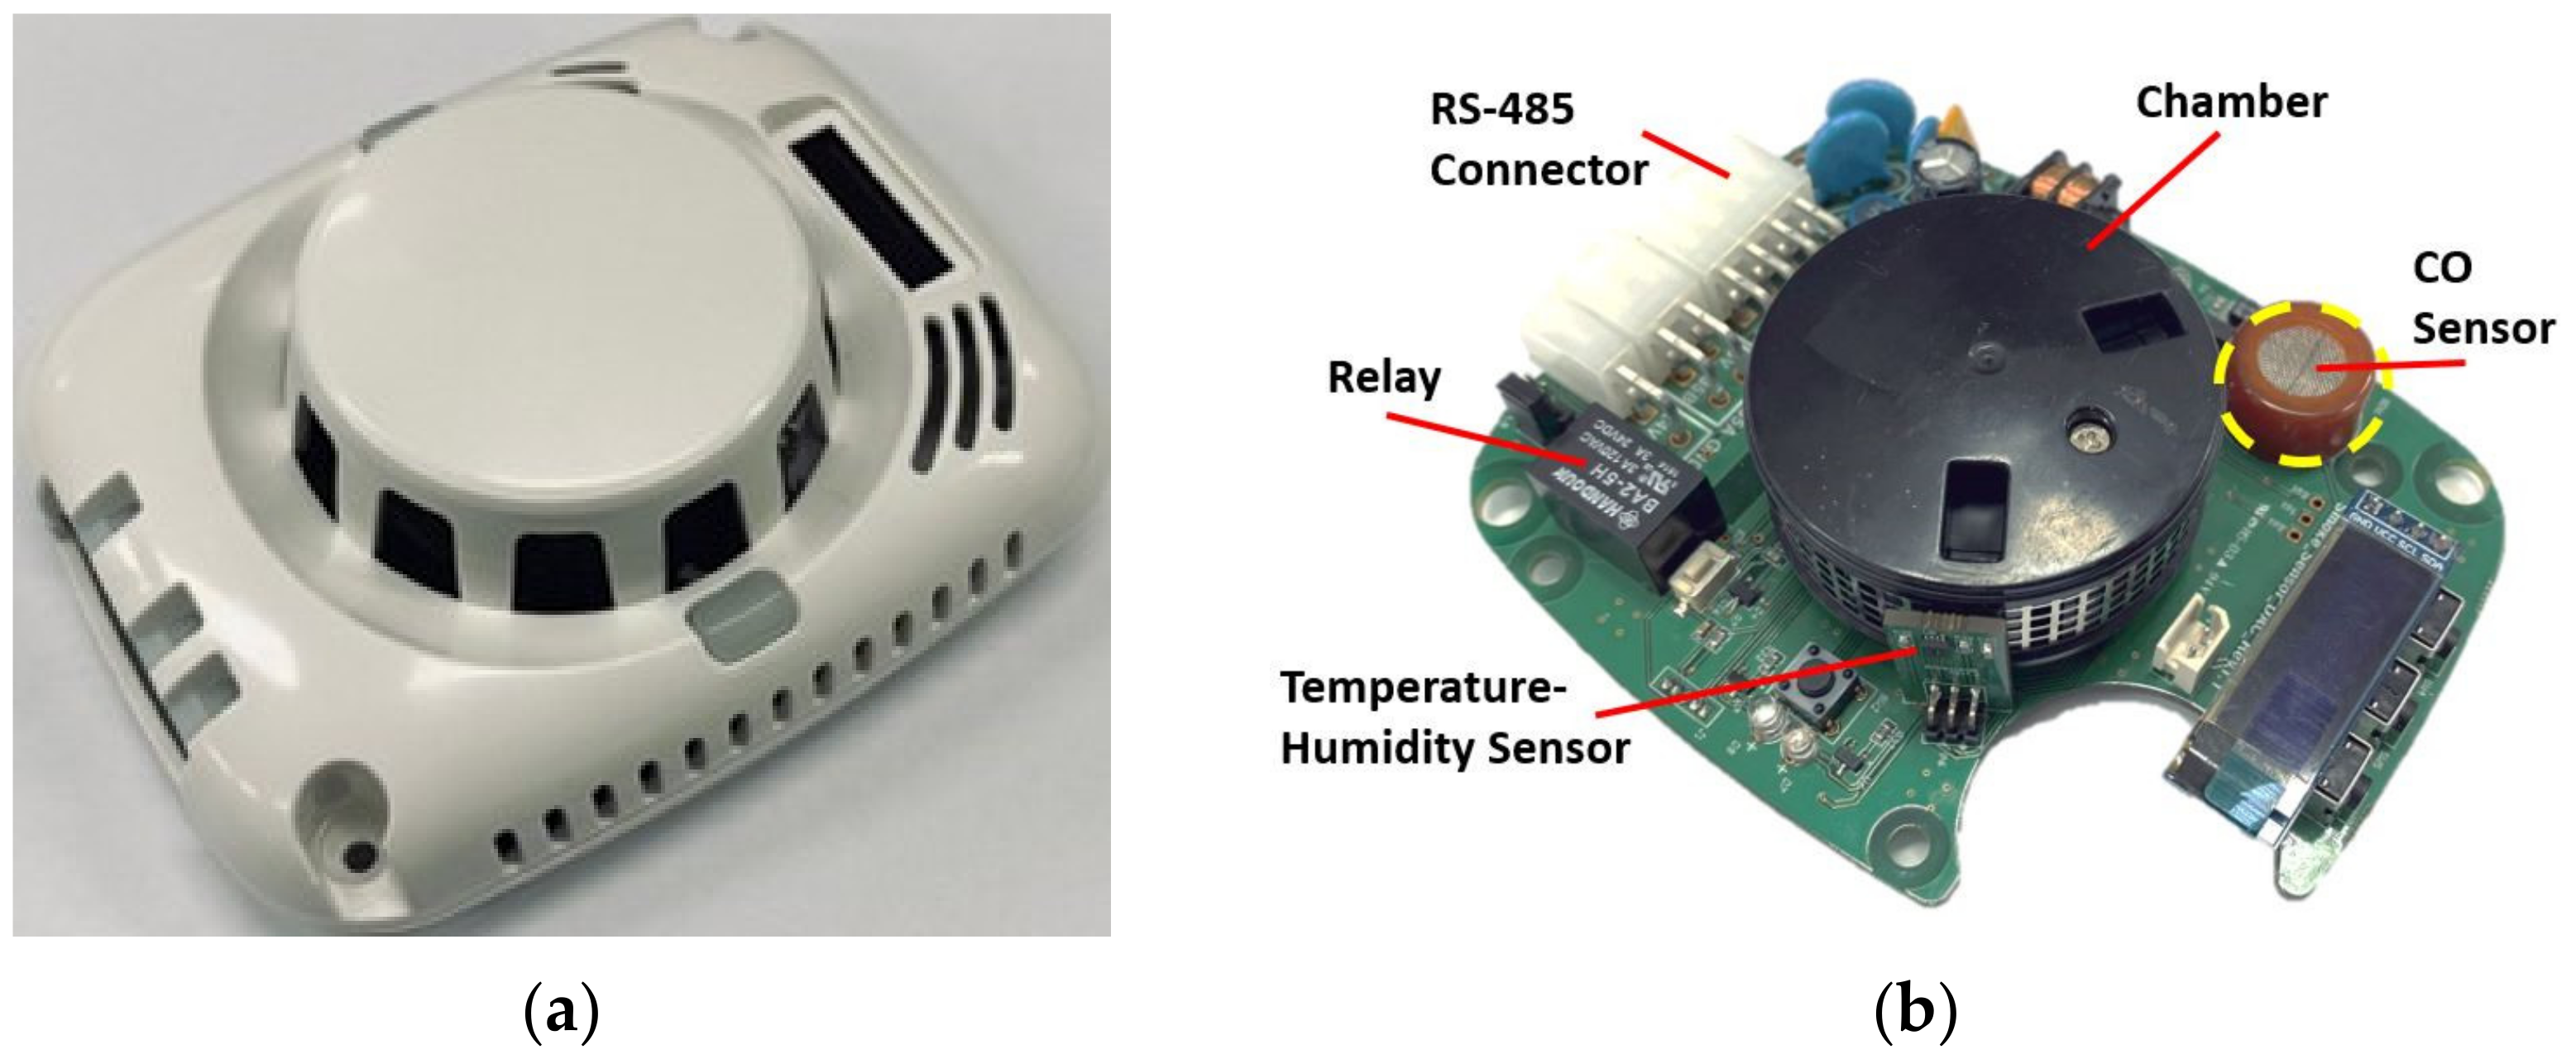
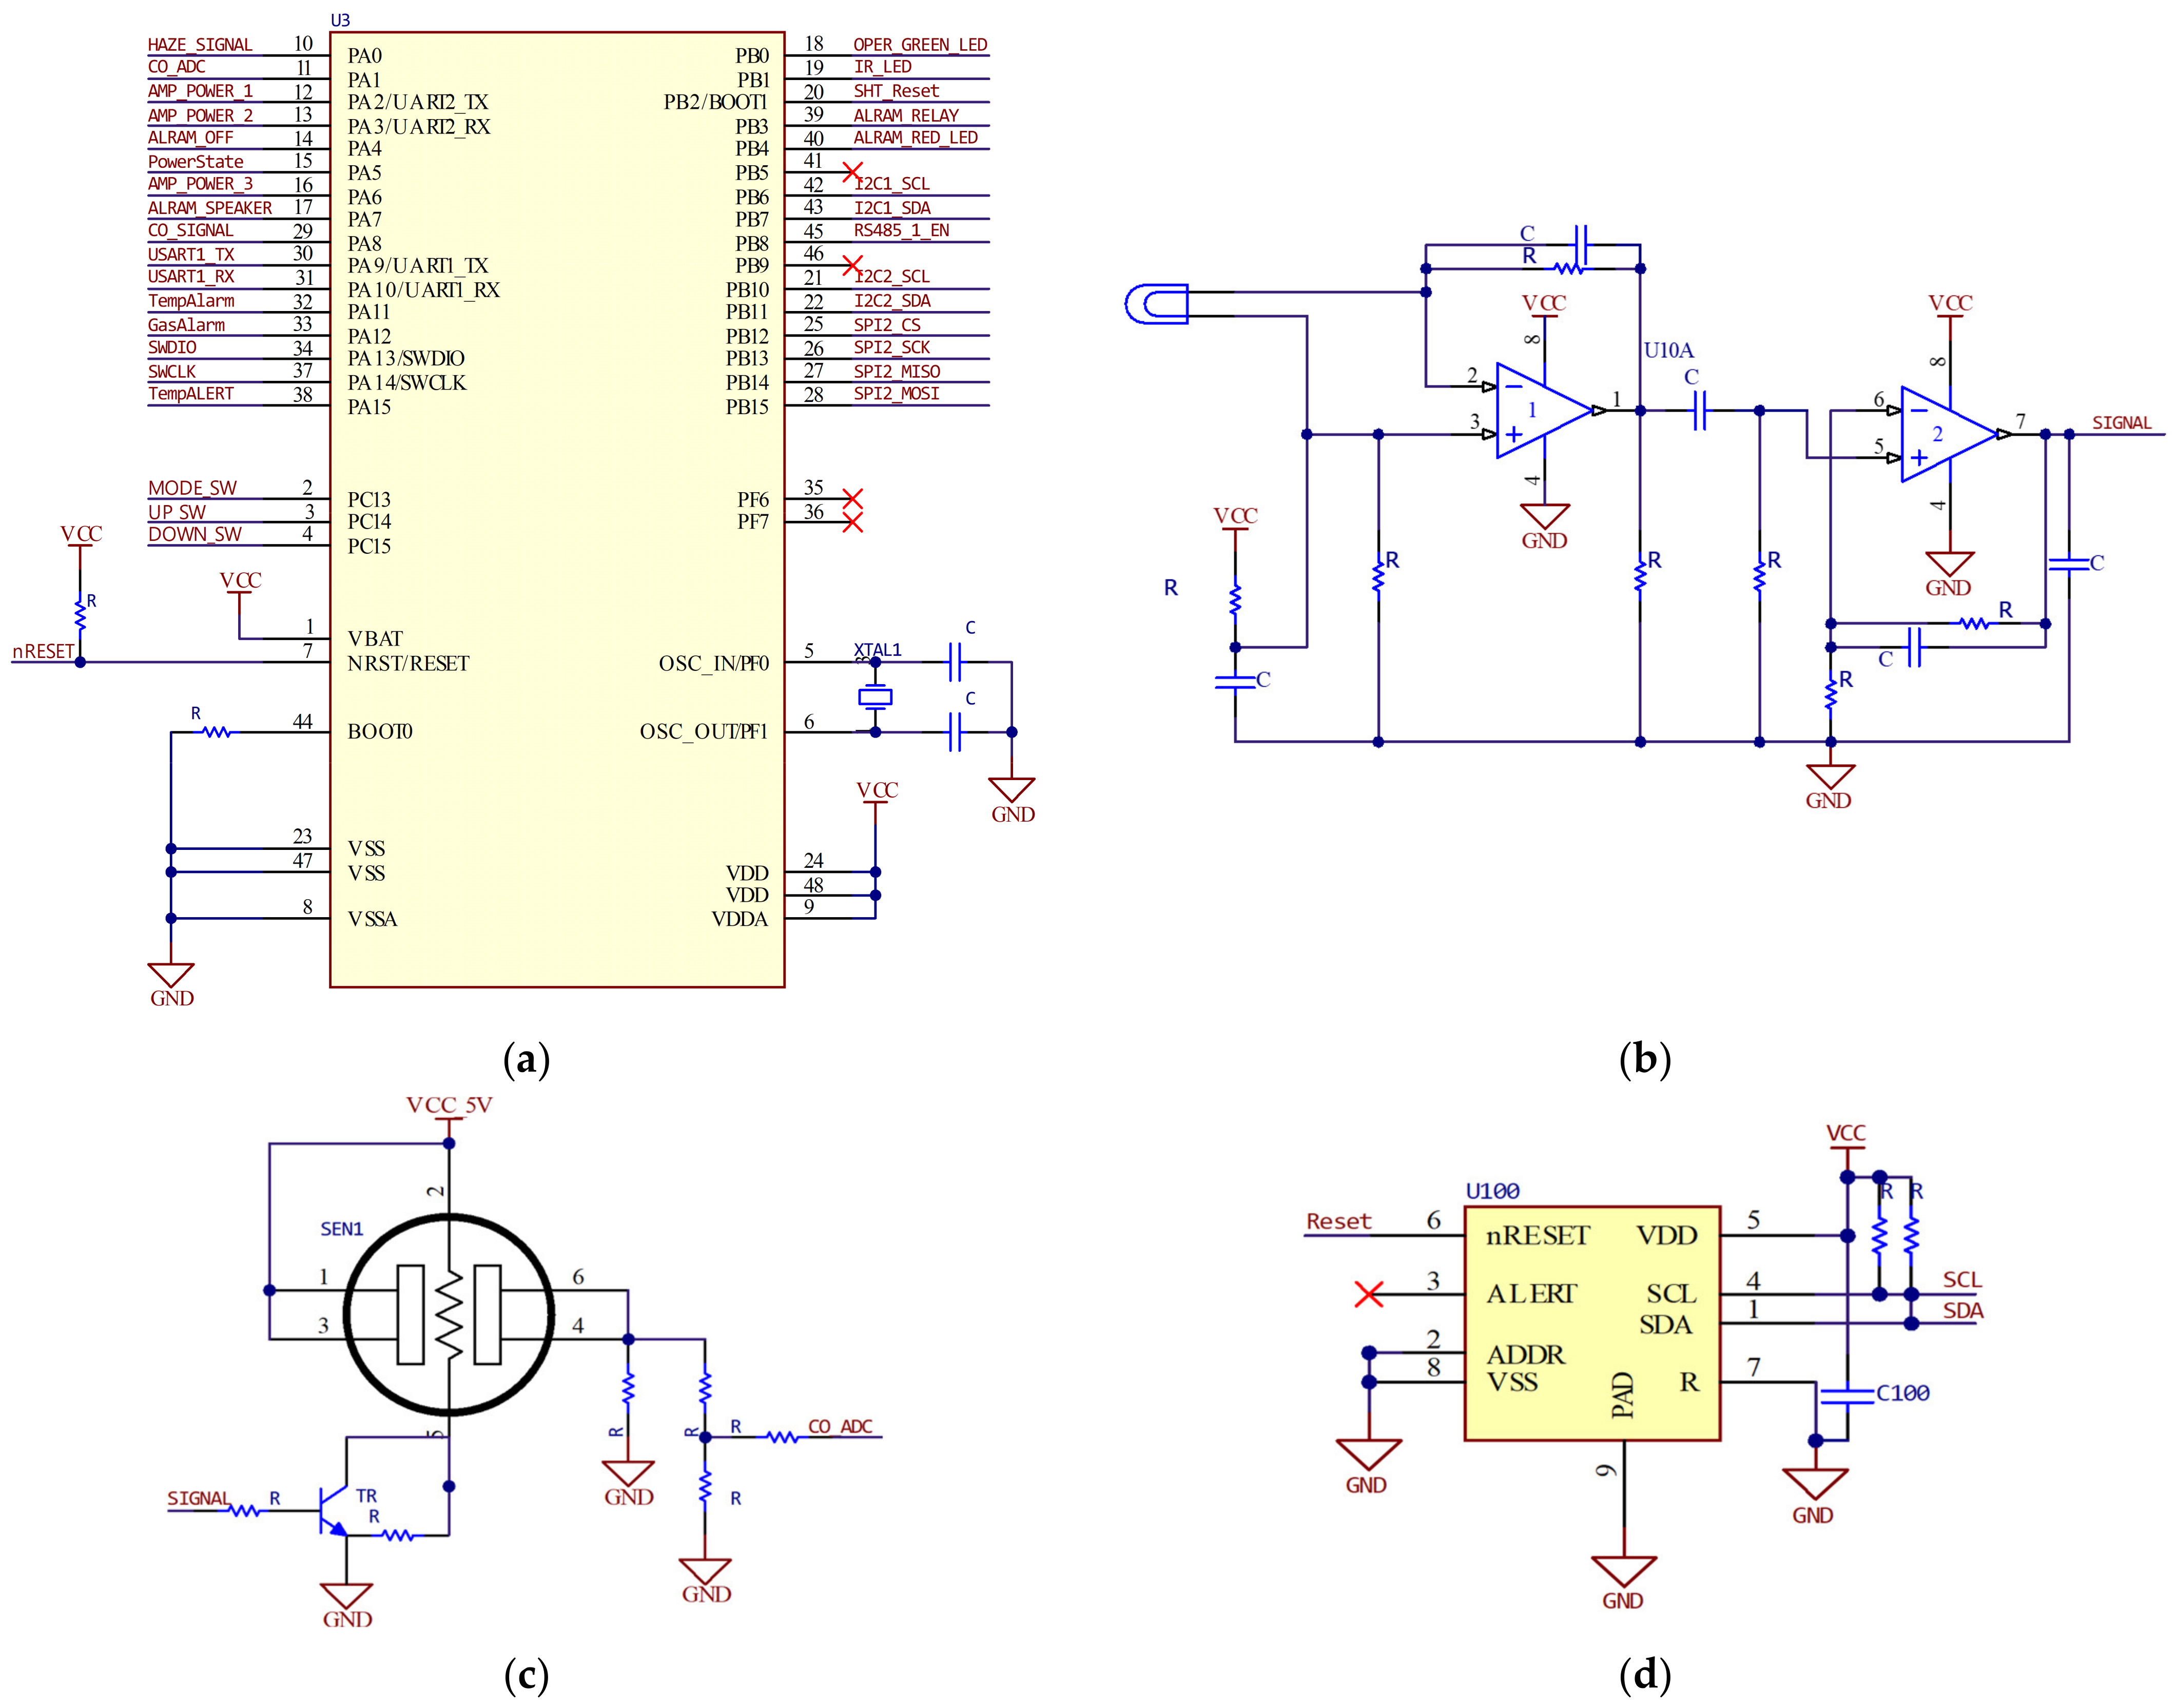
3.2.1. Smoke Detector Design and Fabrication

A smoke detector was designed and fabricated for an experiment on smoke detector performance according to airflow. The panel material and specifications selected for the smoke detector were those commonly used in the field. Consequently, a combined smoke detector that included smoke sensor and CO sensor functions, as shown in Figure 2, was fabricated.
The main microcontroller unit (MCU) of the smoke detector was developed using an STM32F051 IC in accordance with the circuit-diagram design shown in Figure 3a. The smoke detection sensor, CO sensor, temperature/humidity sensor, and RS485 communication circuit were fabricated in accordance with the designs shown in Figure 3b–e, respectively. Smoke sensitivity was measured using the smoke detection circuit shown in (b) and based on (a).
Because the system reliability for fire detection compared with that for a single sensor has been demonstrated to improve with the use of multiple sensors [26], the smoke detector was developed such that it was composed of both smoke detection and CO sensors.
The data collected using the CO and temperature/humidity sensors were transmitted through RS485 communication. Table 2 shows detailed information on the parts.

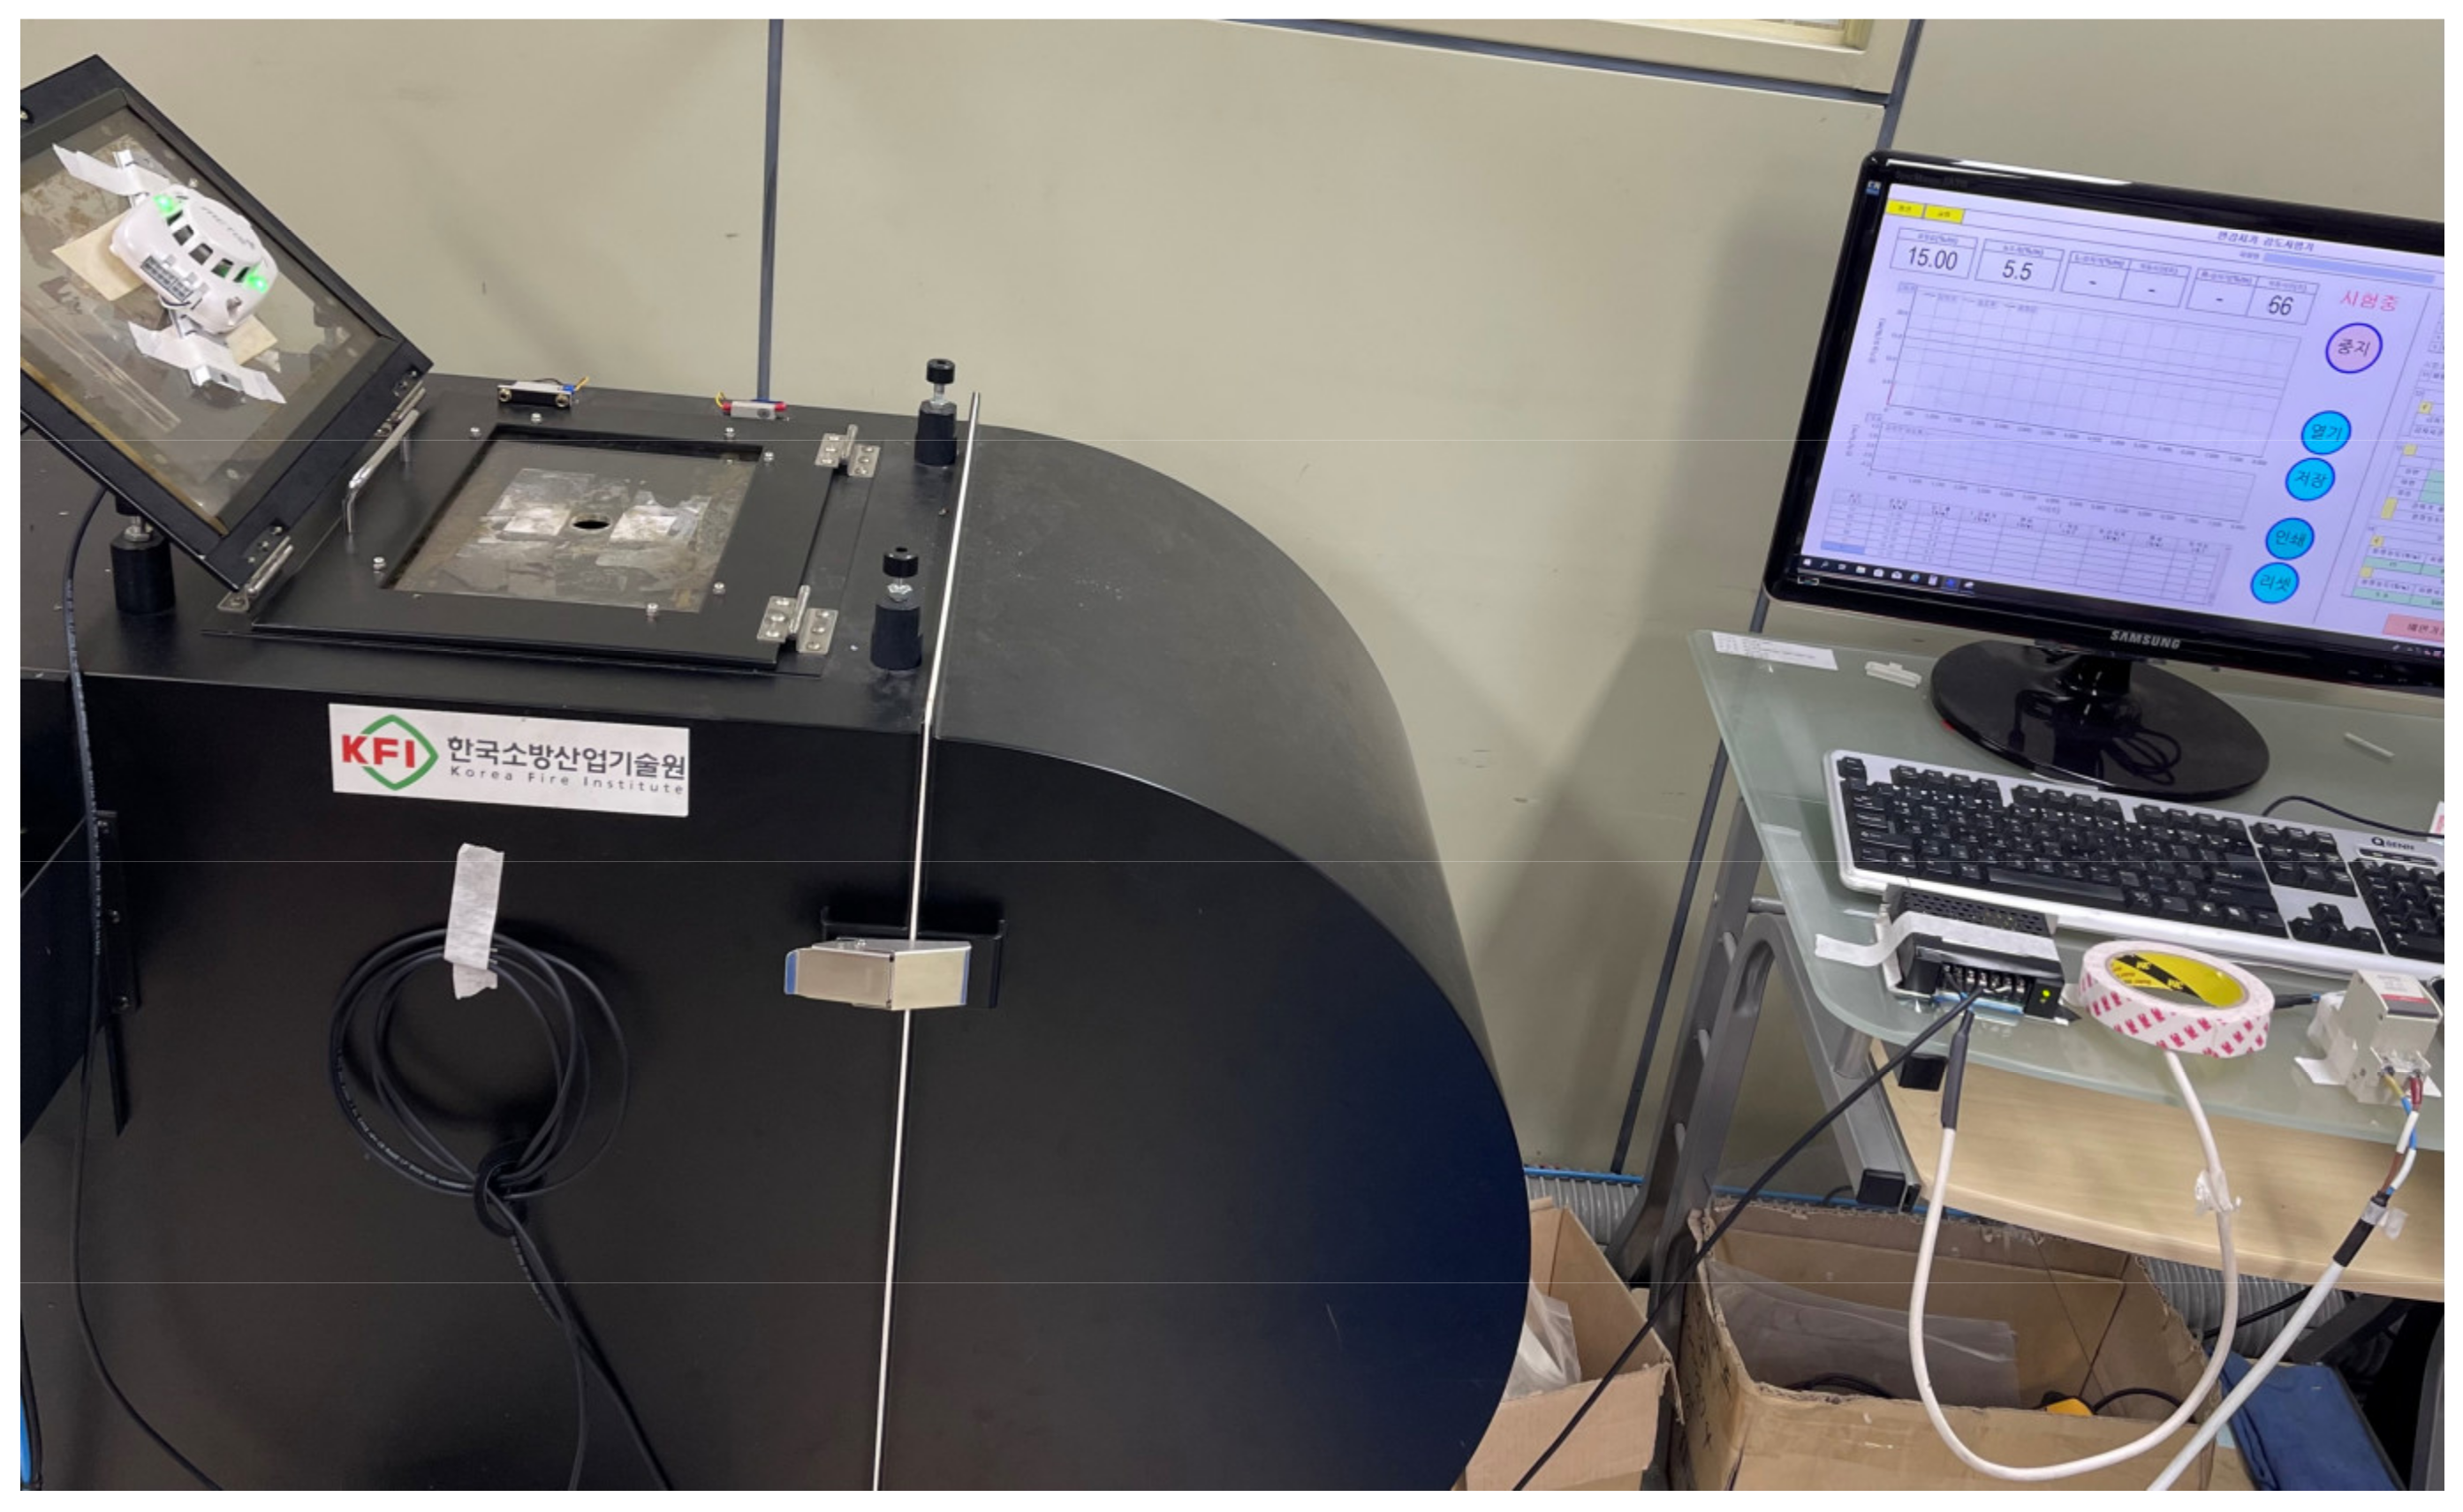
3.2.2. Smoke Detector Product Certification

To guarantee the quality and reliability of the smoke detector fabricated for the experiments, the detector was tested by the Korea Fire Institute (KFI), a Korean certification agency for firefighting equipment and products. For product testing and certification, Article 19 (sensitivity test for photoelectric detectors) of the “fire safety standards for automatic fire detection equipment and visual alarm systems” [14] was applied using the fire detection chamber at KFI, as shown in Figure 4. Accordingly, a smoke-detection sensor calibration experiment was performed. Product performance certification was accomplished through operation and non-operation tests, as shown in Table 3, that measure the sensitivity performance of the detector to smoke concentrations for types 1 (7.5%) and 2 (15%).

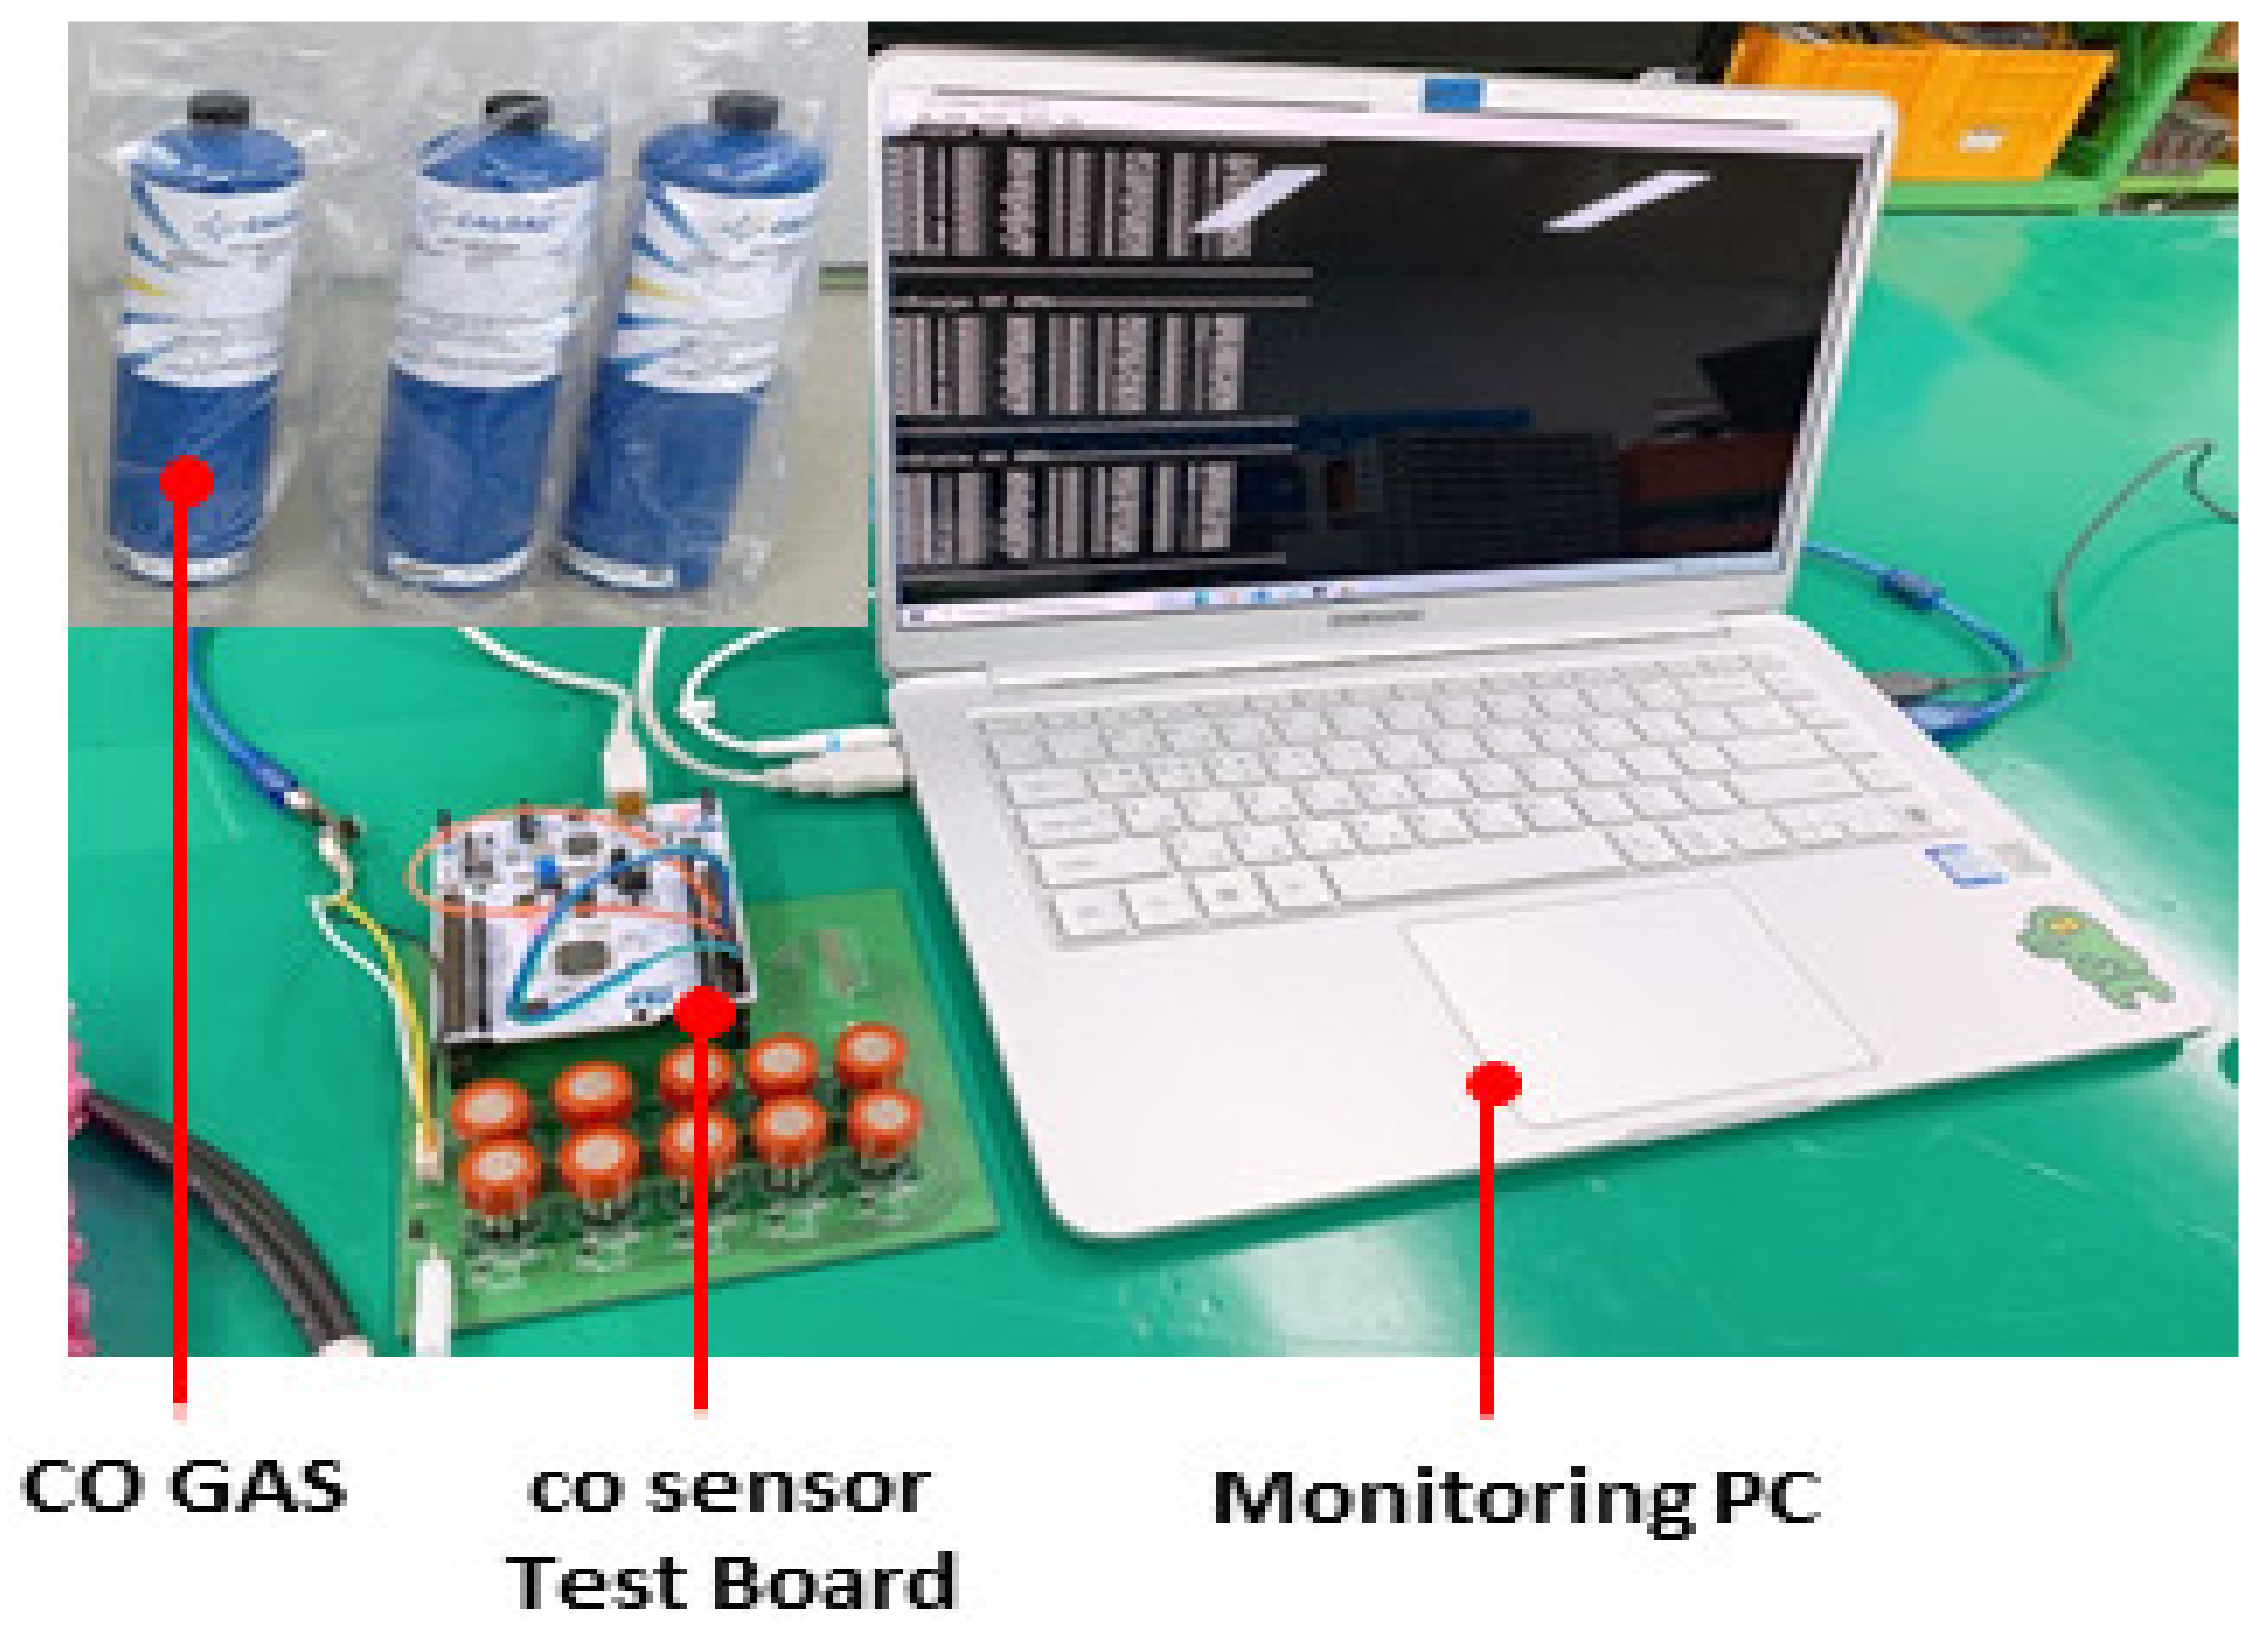
3.2.3. CO Sensor Calibration

To ensure the quality and reliability of the CO sensor, calibration was performed using 50, 100, and 250 ppm CO gases from CALGAZ, as shown in Figure 5. After the gases were injected into the CO sensor of the smoke detector, an experiment to calibrate the difference in the CO sensor value was conducted and repeated several times and the results were compared with the smoke circuit and time chart provided by the manufacturer. In this way, it was confirmed that the CO sensor data of the smoke detector exactly matched the information provided by the manufacturer.

3.3. Experimental Environment Construction

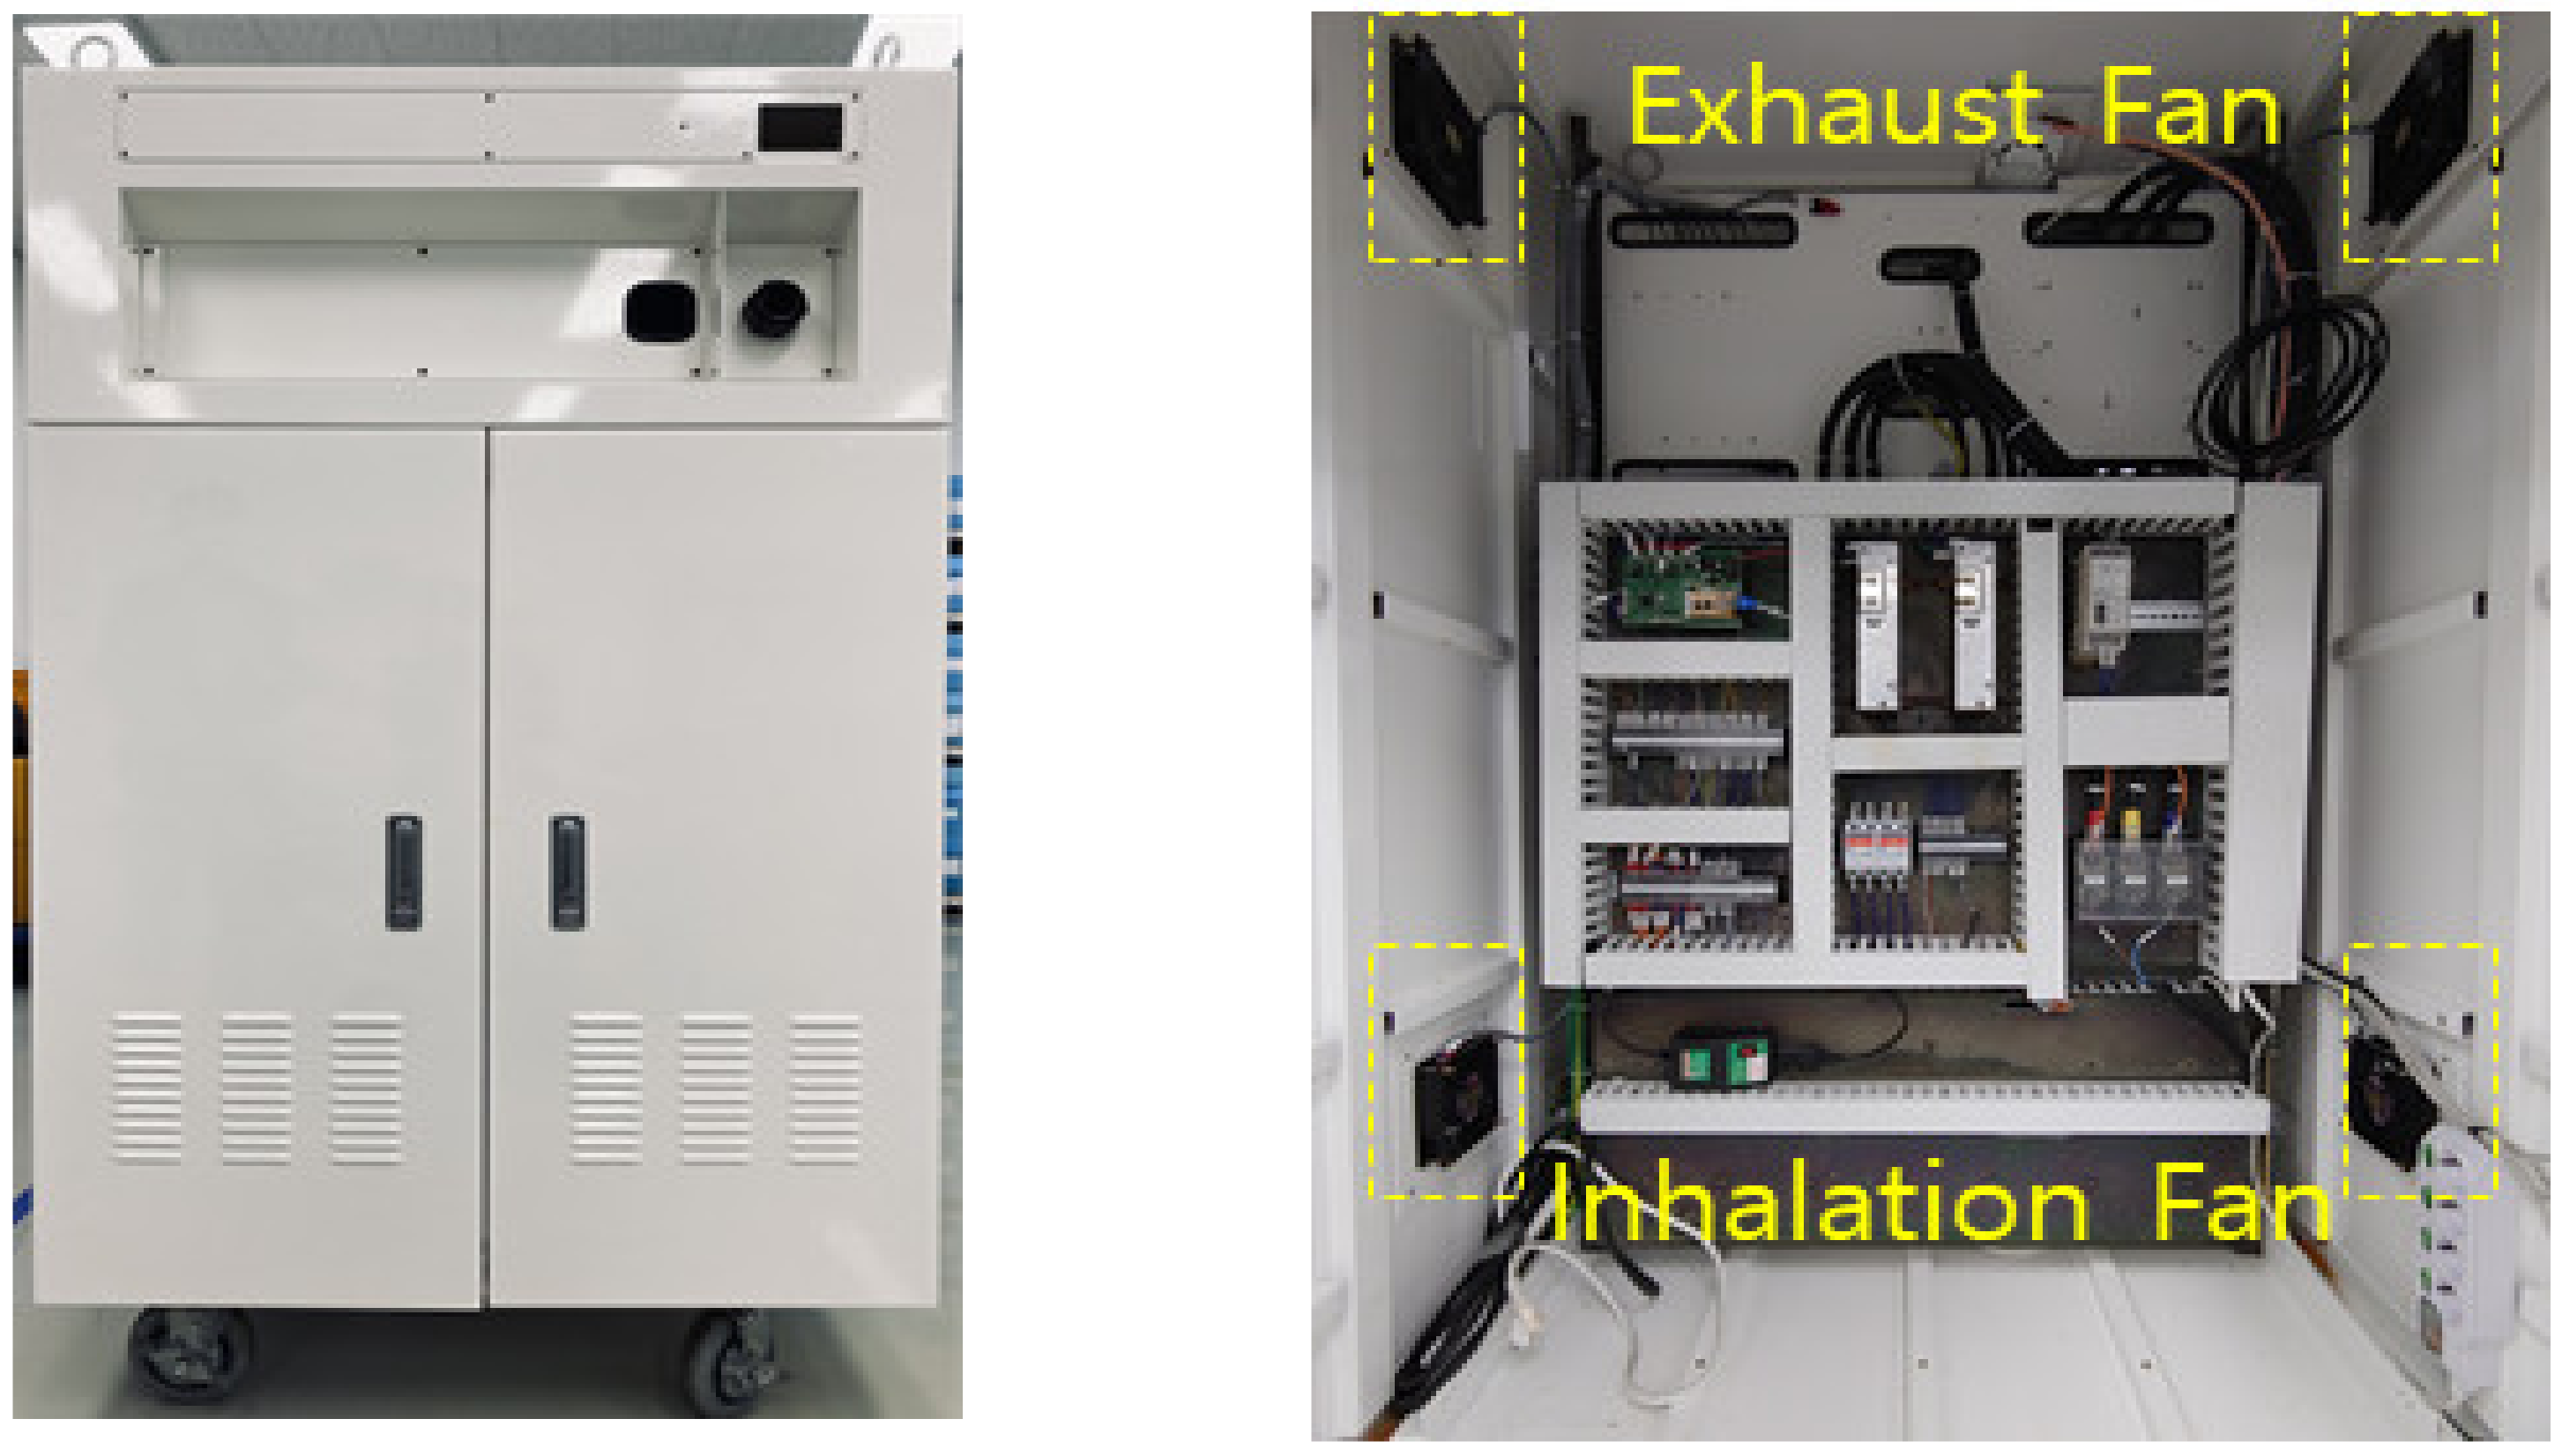
3.3.1. Distribution Panel Equipped with Inhalation and Exhaust Fans

For the subsequent experiment to study the influence of airflow change in a distribution panel due to inhalation and exhaust fans on the smoke sensitivity of the smoke detector, a distribution panel with a width of 1000 mm, depth of 1000 mm, and height of 1550 mm was constructed and exhaust and inhalation fans were installed at the top and bottom of the panel, respectively, as shown in Figure 6. The fans used were the WYA1V12C25TBT and WYA2V12C25TBT-2 models from Woon Young, Korea.
The exhaust fans were installed at a depth of 550 mm [29] and a distance of 200 mm from the ceiling, whereas the inhalation fans were installed at a depth of 550 mm and a distance of 300 mm from the floor. When the fans were in operation, the airflow was measured to be 1.72 m/s on the side of the surface in direct contact with the fans, 1.0 m/s at a distance of 5 cm, 0.6 m/s at a distance of 10 cm, and 0.4 m/s at a distance of 15 cm.

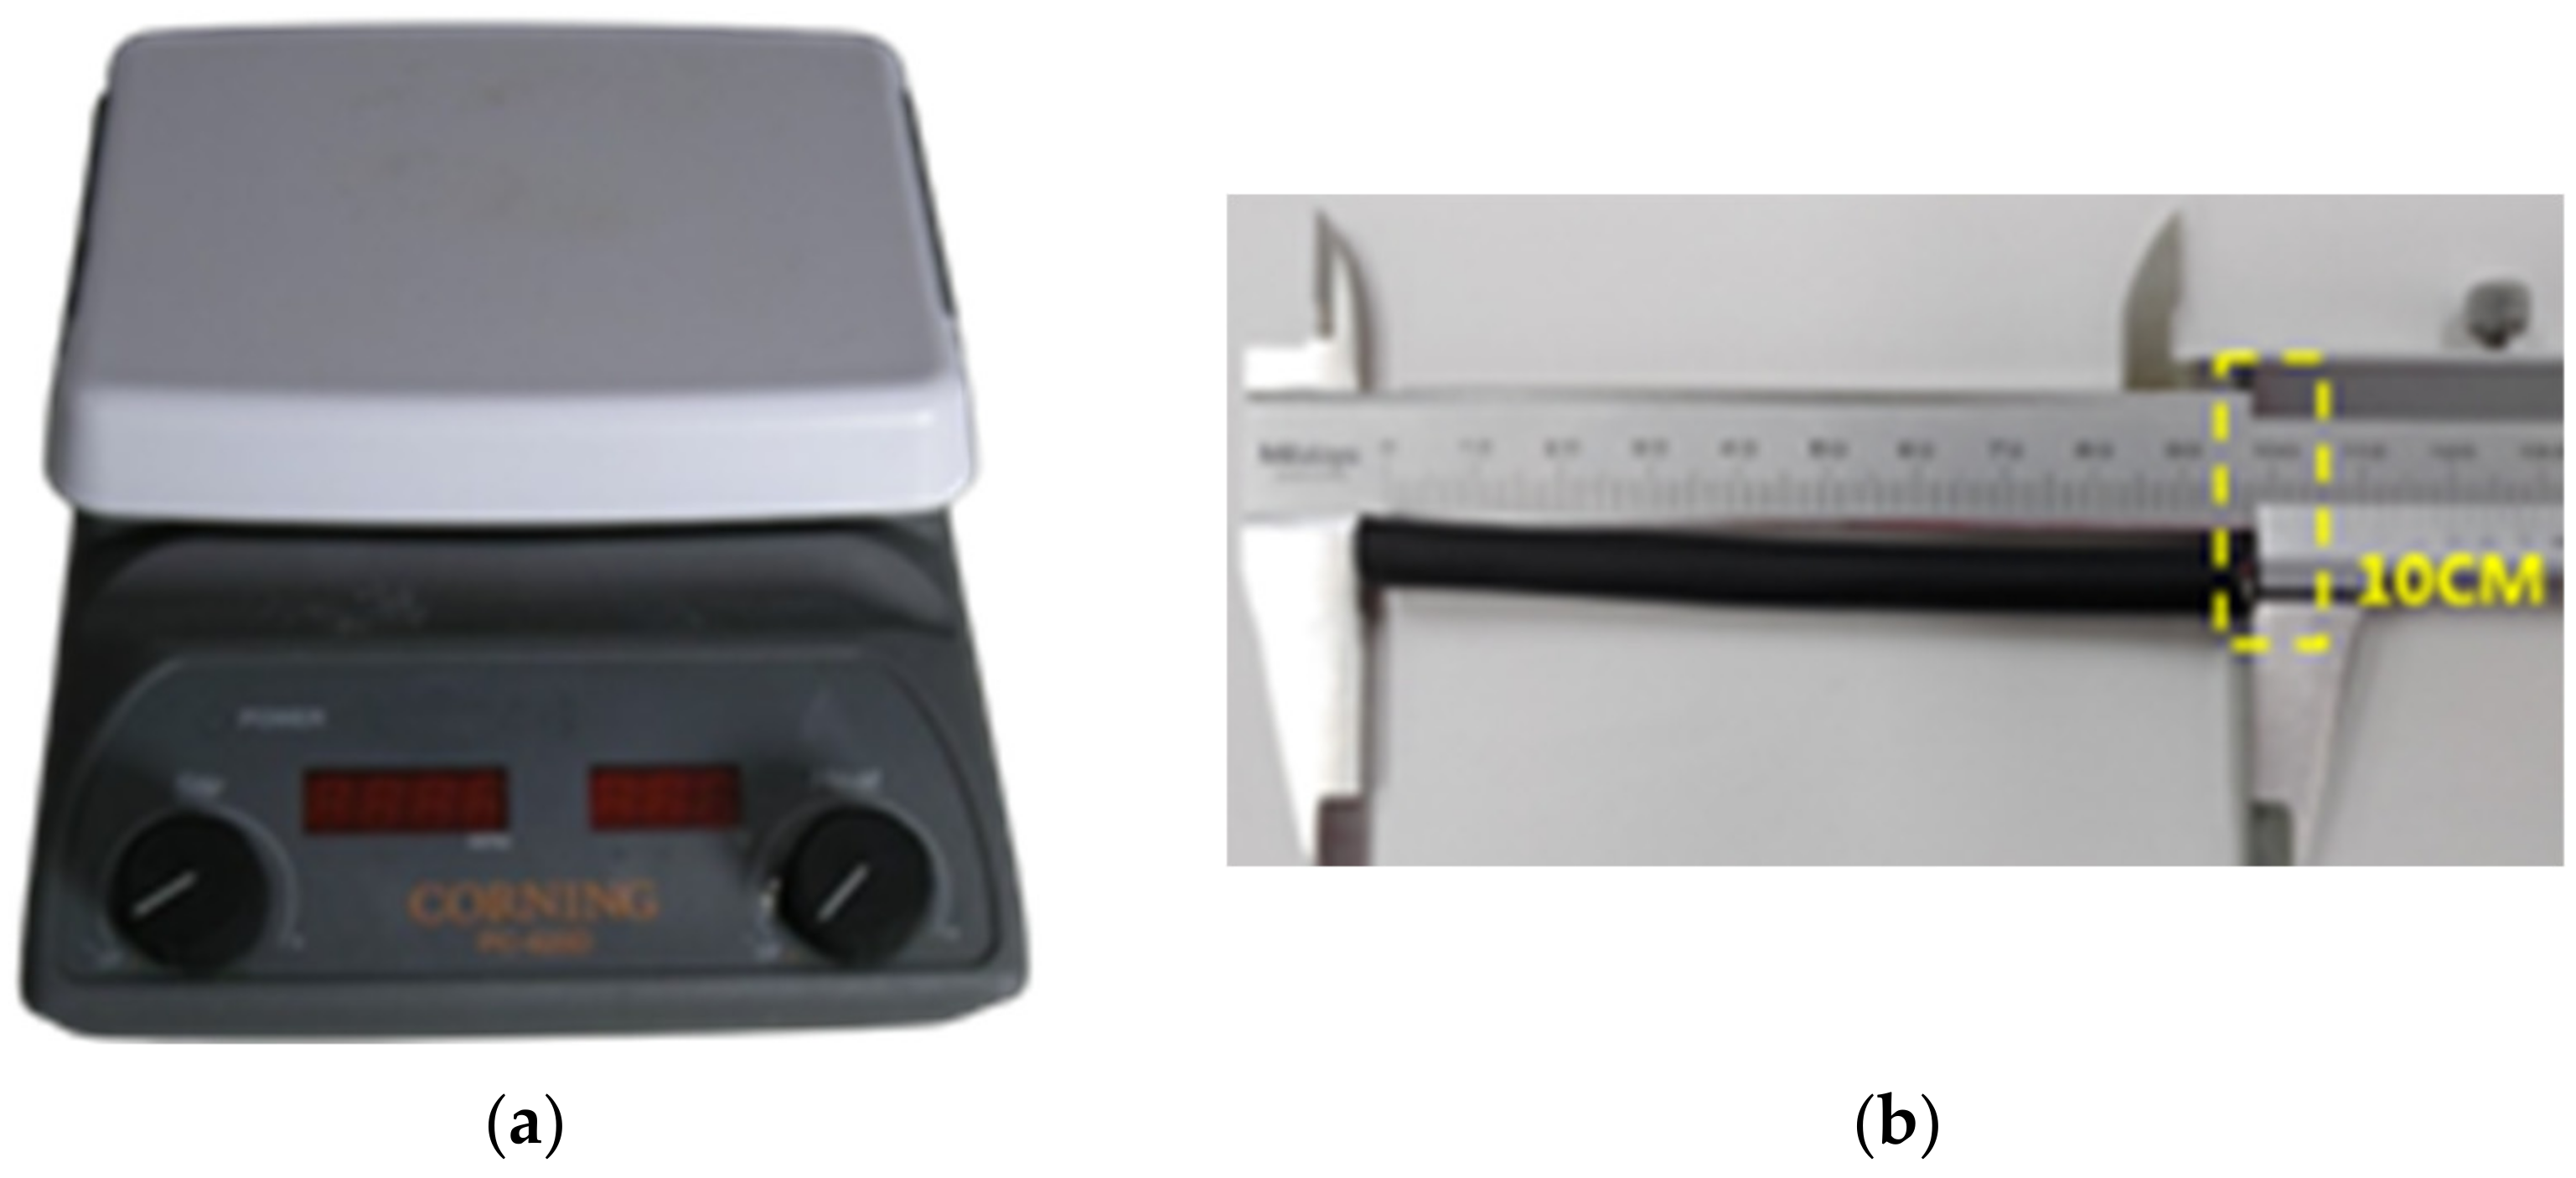
3.3.2. Fire Reproduction Simulation Materials

The hot plate that was used to reproduce a fire situation was the PC420D model from CORNING, as shown in Figure 7a. The temperature of the hot plate was set to 550 °C to simulate an arc fire accident [30], which is similar to an electric fire accident in a distribution panel. Figure 7b shows the electric cable used as the ignition source for the fire (UL 2464 AMS). An experiment was conducted on a panel in use at the site and a cable in use for that panel was used as a sample for more accurate experiments reflecting field conditions.

4. Detection Performance Test by Smoke Detector Position

4.1. Experimental Scenario Design

After the smoke detectors were installed inside the distribution panel, as shown in Figure 8, the time required for smoke detectors to detect fire inside the distribution panel was measured. To this end, five type-2 photoelectric smoke detector samples with a light sensitivity of 15% were installed inside the distribution panel and the smoke detection time and CO concentration were measured while the ignition height was varied between experiments. Figure 8a shows a 3D image of the inside of the distribution panel. Figure 8b shows a fire origin and sample location inside the distribution panel. Two 10 cm cables were burned in each fire simulation. On both panels of the distribution panel, the top green part is the exhaust fan, whereas the bottom green part is the inhalation fan. One smoke detector was installed on the ceiling and four smoke detectors were installed near the exhaust fan. The height of the ignition source was set to 0, 30, and 60 cm from the floor. For each height, ignition was induced at four different positions (15, 30, 45, and 50 cm away from the inhalation fan), after which the smoke detection time and CO concentration were measured.

4.1.1. Performance Experiment Scenario for Detector Installed on Ceiling

After the smoke detector was installed on the ceiling inside the distribution panel, the time required for the detector to detect the fire was measured. Figure 9 shows the sample position inside the panel and the separation distance of the ignition source. In the diagram, #5 indicates a smoke detector sample installed at the center of the ceiling. Considering the possibility of ignition at multiple points of the electrical wiring under the assumption of an electric fire inside the distribution panel, the height of the ignition source, positioned at a width of 50 cm and depth of 55 cm, was set to 0, 30, and 60 cm, as shown in Figure 8b.
The experimental sequence can be summarized in seven steps. The position of the ignition source is expressed as a vector (û) of the width, depth, and height, respectively.
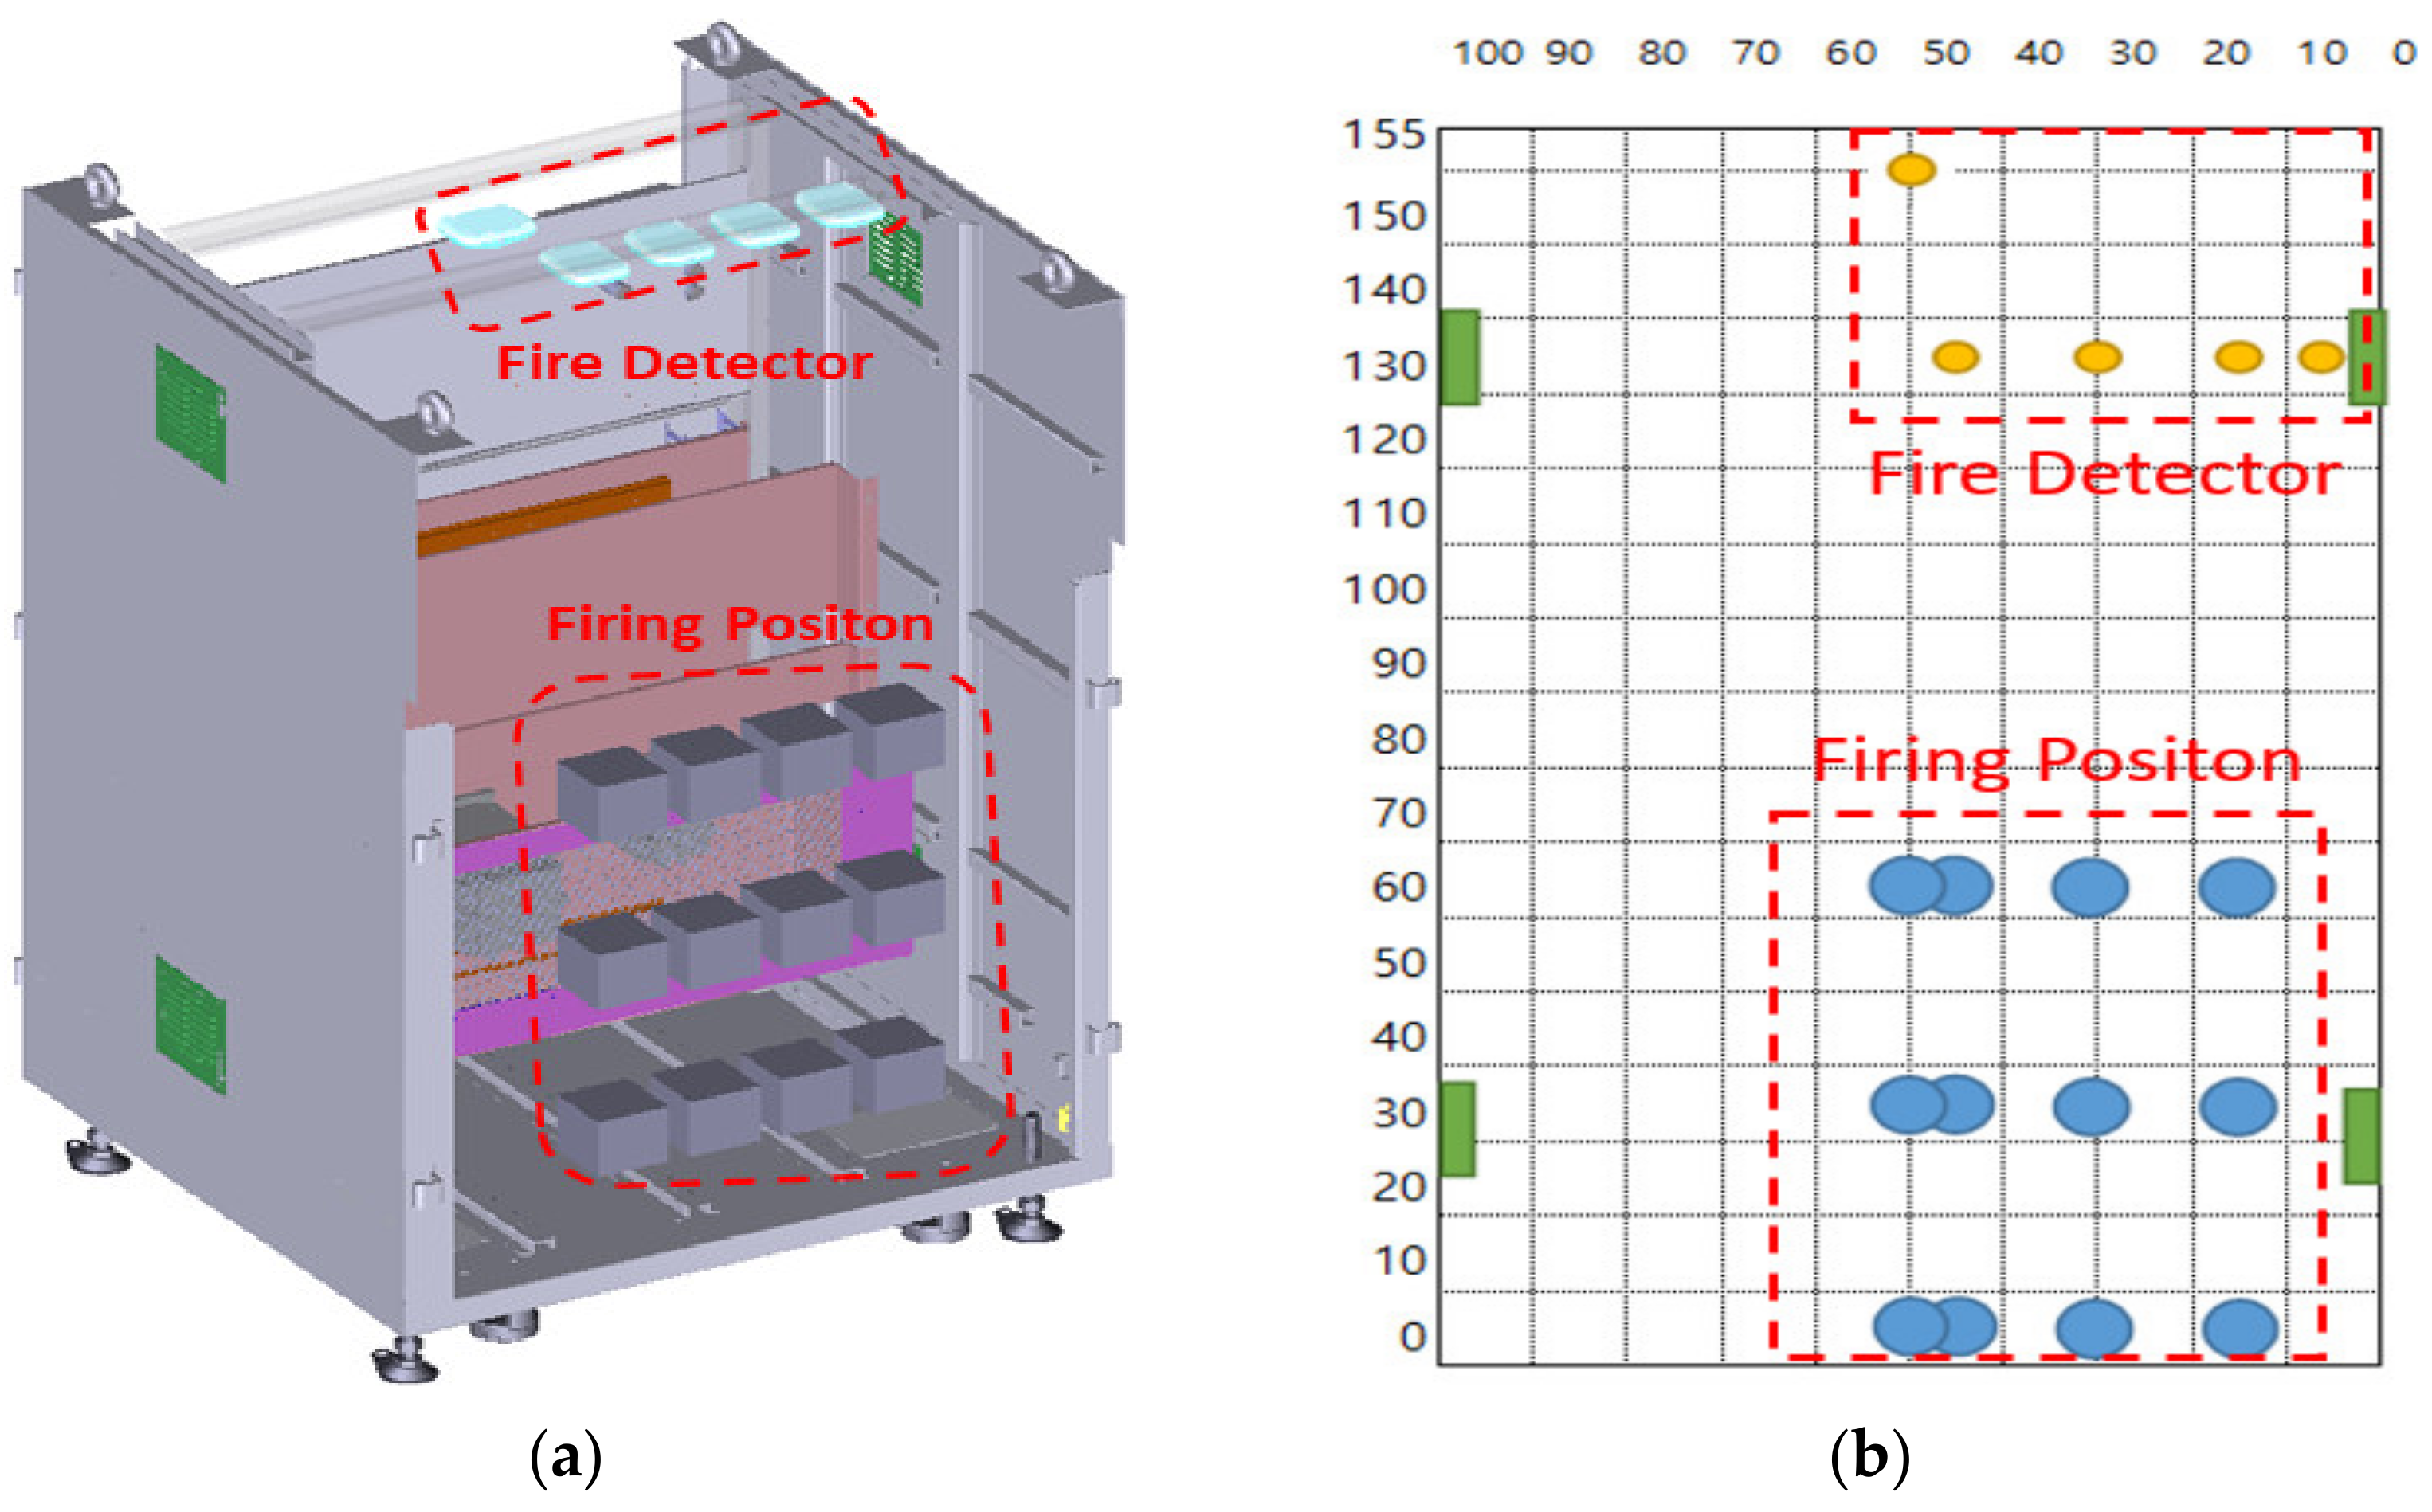
smoke detector was installed at the center of the ceiling of the distribution panel (indicated by #5 in Figure 9).
The ignition source hot plate was installed at the û (50, 55, 0) position of the panel floor, indicated by D in Figure 9.
The ignition source sample was installed at position D.
The inhalation and exhaust fans were operated.
The power line was connected to the smoke detector and the RS485 line was connected to the PC to enable the smoke detection status and CO concentration to be monitored in real time
The smoke detection alarm time and CO concentration were measured.
Upon completion of the measurement, the ignition source sample was moved to positions C (û(45, 55, 0)), B (û(30, 55, 0)), and A (û(15, 55, 0)) and process steps ④ to ⑥ were repeated.
The height was then changed to 30 and 60 cm and process steps ② to ⑦ were repeated.

4.1.2. Detector Performance Experiment Scenarios for Each Separation Distance of Ignition Source from Fan

Smoke Detector Position Setting

To compare the detection performance of the combined smoke detector samples by position, the smoke detector was installed at distances of 0, 15, 30, and 45 cm from the exhaust fan, as shown in Figure 10. The smoke detector at a distance of 0 cm from the exhaust fan was defined as sample 1 (#1), that at 15 cm as sample 2 (#2), that at 30 cm as sample 3 (#3), and that at 45 cm as sample 4 (#4).

Experimental Scenarios by Ignition Source Height

In a previous study, the system reliability for fire detection was reported to improve through the use of multiple sensors compared with that of a single sensor [26]. Therefore, to compare and analyze the smoke and CO detection performance based on the ignition source height, the smoke detection time was measured at the height of the ignition source, positioned at a width of 50 cm and depth of 55 cm, was changed to 0, 30, and 60 cm between experiments.
Scenario 1: The ignition source was positioned on the floor (height: 0 cm) and the smoke detector alarm time and CO concentration were measured while the distance from the inhalation fan installation surface to the ignition source was changed to 15, 30, 45, and 50 cm. The experiment was performed in seven steps as follows:
The ignition source hot plate was safely installed at the û(15, 55, 0) position, as indicated by A in Figure 11.
The ignition source was installed at position A.
The inhalation and exhaust fans were operated.
The power line was connected to the smoke detectors and the RS485 line was connected to the PC to enable the smoke detection status and CO concentration to be monitored for all four smoke detectors in real time.
The smoke detection alarm time and CO concentration were measured.
Upon completion of the measurement, the ignition source sample was moved to position B (û(30, 55, 0)) and process steps ④ to ⑤ were repeated.
When measurement at position B was completed, the ignition source sample was moved to positions C (û(45, 55, 0)) and D (û(50, 55, 0)) and process steps ④ to ⑤ were repeated.
Scenario 2: The ignition source was positioned at a height of 30 cm and the smoke detector alarm time and CO concentration were measured. The experiment was performed in the same sequence as that of the previous experiment (i.e., with an ignition source height of 0 cm). However, in this scenario, the ignition source hot plate and ignition source were safely installed at the û(15, 55, 30) position, as shown in Figure 11.
Upon completion of the measurement, the ignition source sample was moved to positions B (û(30, 55, 30)), C (û(45, 55, 30)), and D (û(50, 55, 30)) and process steps ④ to ⑤ were repeated.
Scenario 3: The ignition source was positioned at a height of 30 cm and the smoke detector alarm time and CO concentration were measured. The experiment was performed in the same sequence as those of the previous experiments (i.e., with ignition source heights of 0 and 30 cm). However, in this scenario, the ignition source hot plate and ignition source were installed at the û(15, 55, 60) position, as shown in Figure 11.
Upon completion of the measurement, the ignition source sample was moved to positions B (û(30, 55, 60)), C (û(45, 55, 60)), and D (û(50, 55, 60)) and the experiment was performed in the same way as in scenarios 1 and 2.

4.2. Detection Performance Measurement Experiment by Smoke Detector Position

4.2.1. Smoke Detection Time and CO Concentration of Smoke Detector Installed on Ceiling

The experimental results indicate that the smoke detection time was longer and the CO concentration was lower for the smoke detector sample installed on the ceiling than for the samples next to the exhaust fan.
The smoke detector performance measurement results indicate that the smoke detector sample on the ceiling did not sound an alarm when the amount of smoke was small; instead, the smoke detector at #5 on the ceiling required up to 2 min and 49 s to indicate a detection.
The CO concentration was measured using an analog-to-digital converter (ADC), where the ADC value increased as the CO absorption performance improved. For the smoke detector sample at #5, the CO concentration ranged from 41 to 96.

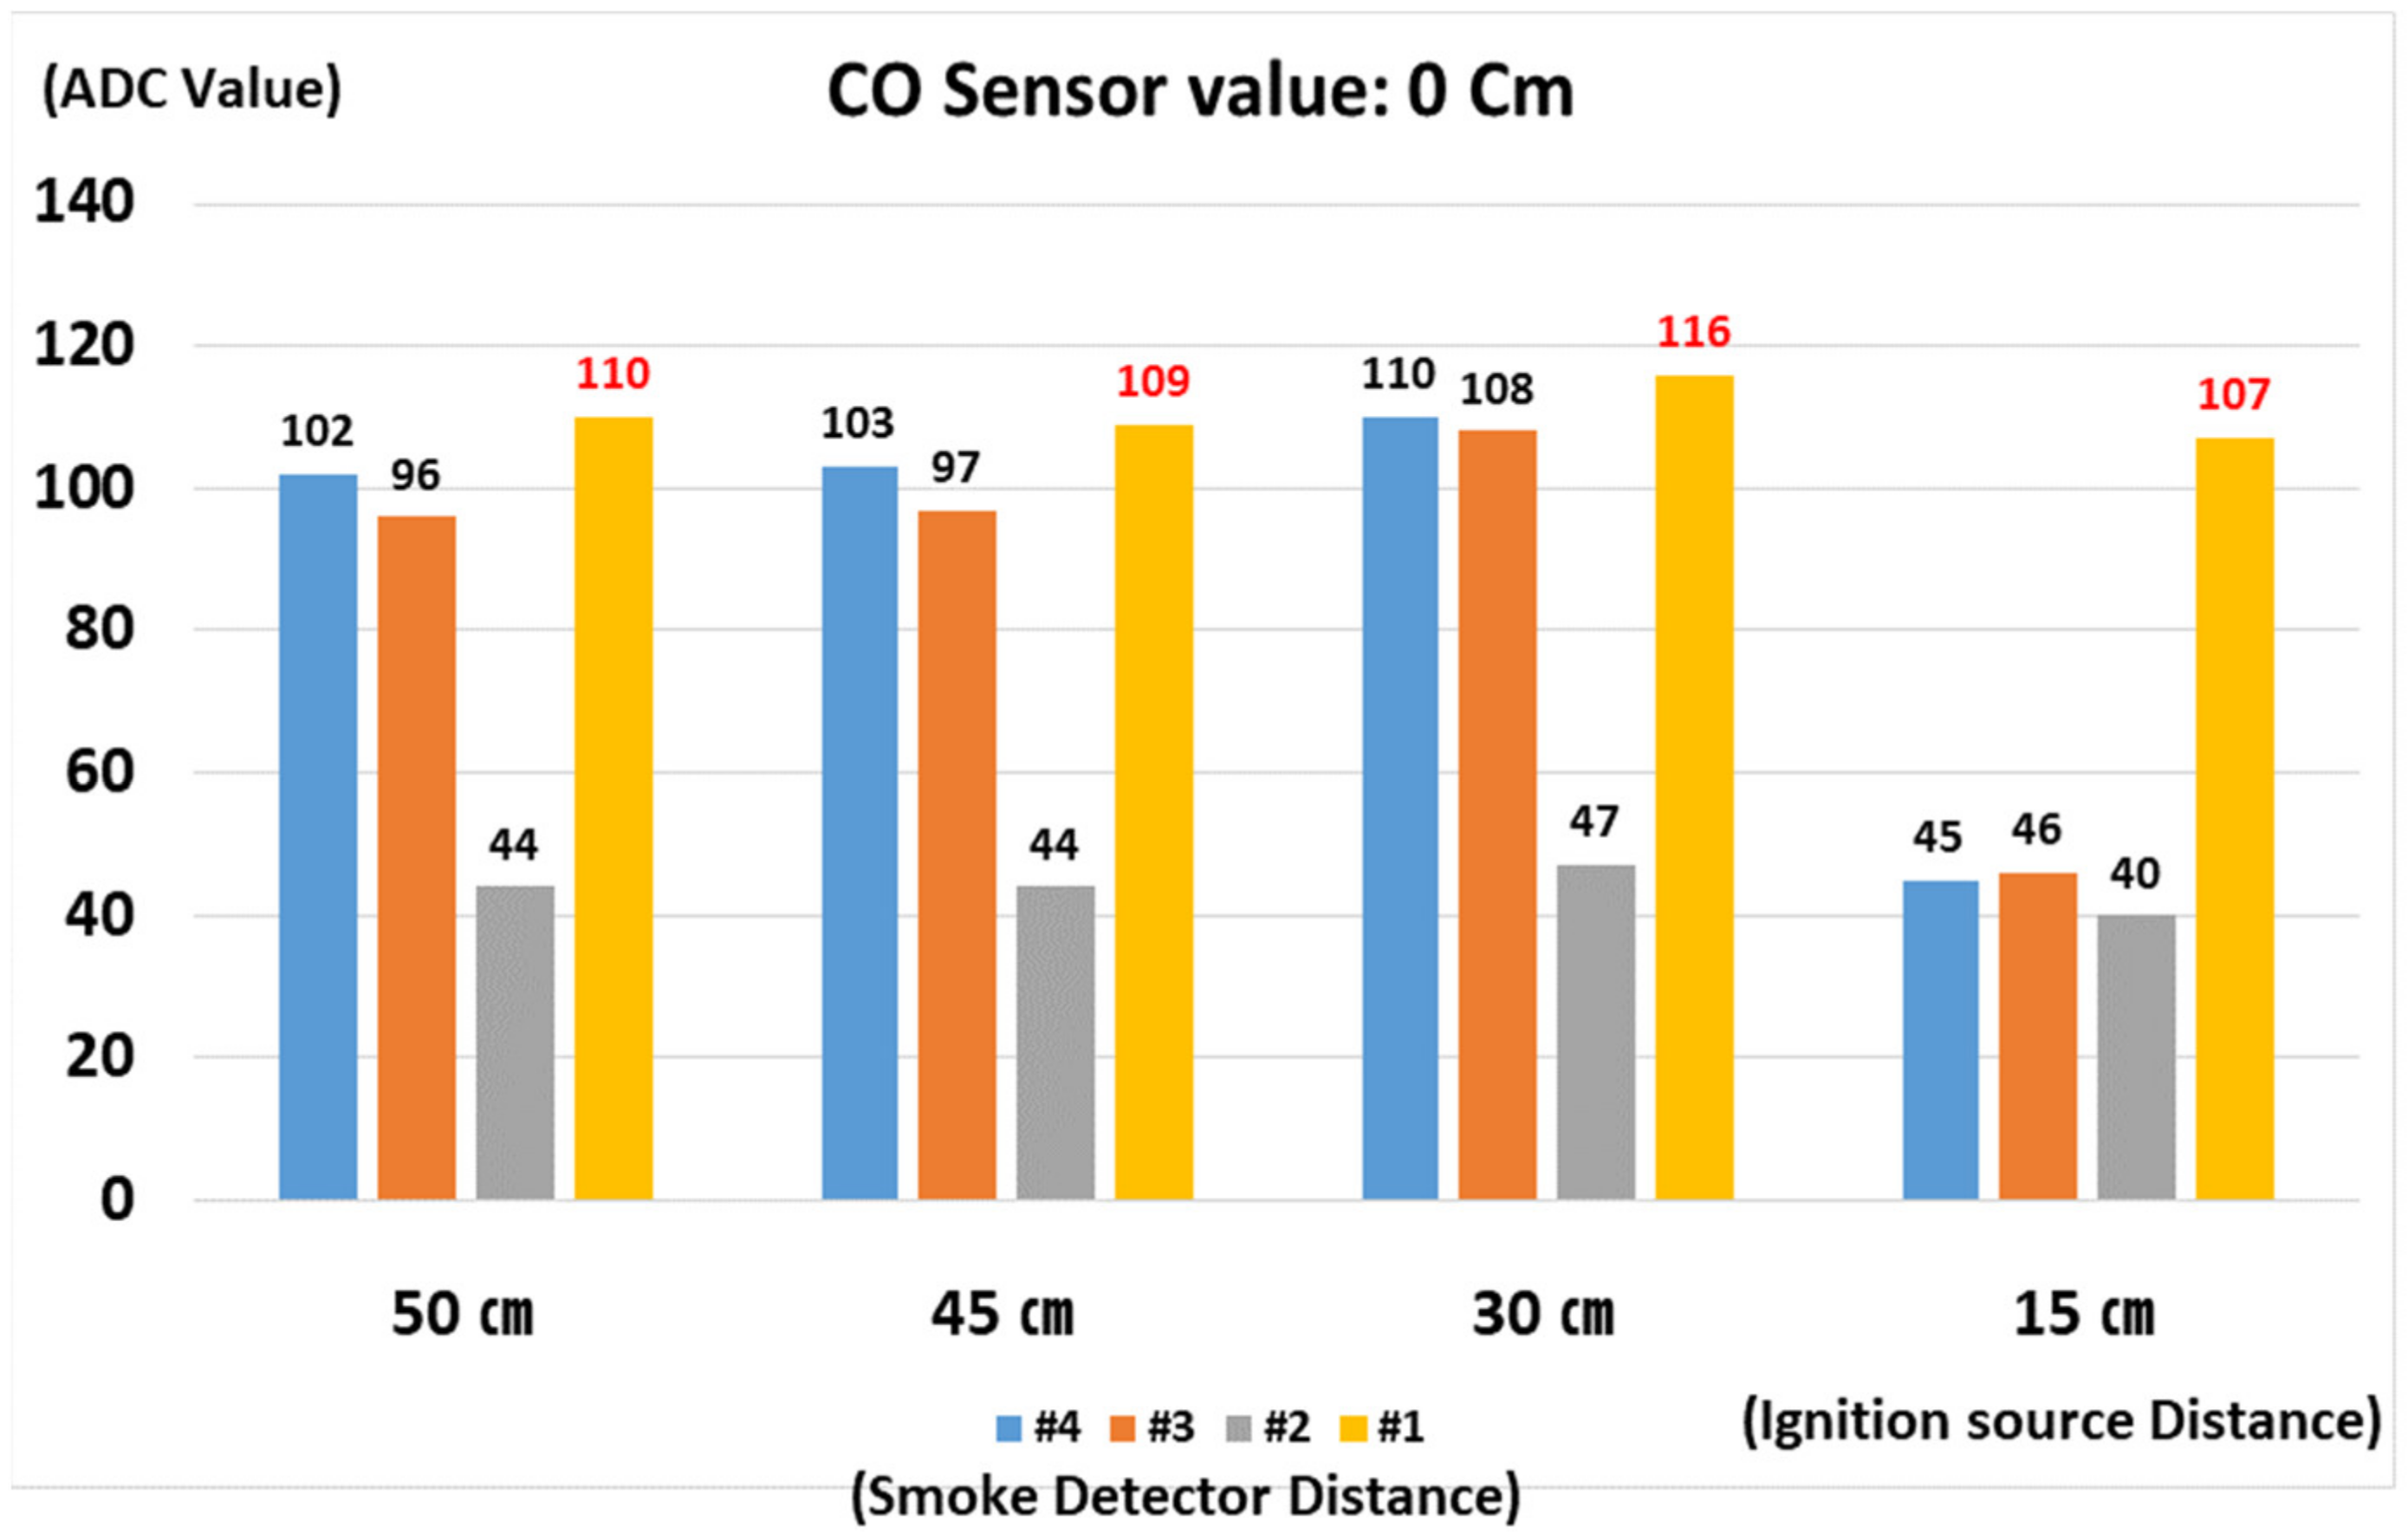
4.2.2. Scenario 1: Smoke Detection Time and CO Concentration for Smoke Detectors Installed near the Fan for Ignition Source Height of 0 cm

Smoke Detection Time

The smoke detection times for an ignition source height of 0 cm and ignition source distances of 15, 30, 45, and 50 cm were measured; the results are shown in Figure 12. The shortest detection times were 49 s at a distance of 15 cm, 1 min and 21 s at 30 cm, 57 s at 45 cm, and 1 min and 17 s at 50 cm. For all distances, smoke detector #1, which was the closest to the exhaust fan, exhibited the fastest detection performance.

CO Concentration

In the case of CO concentration, the highest values measured were 107 ADC at an ignition source distance of 15 cm, 116 ADC at 30 cm, 109 ADC at 45 cm, and 110 ADC at 50 cm, as shown in Figure 13. For all distances, smoke detector #1 exhibited the highest CO concentration.

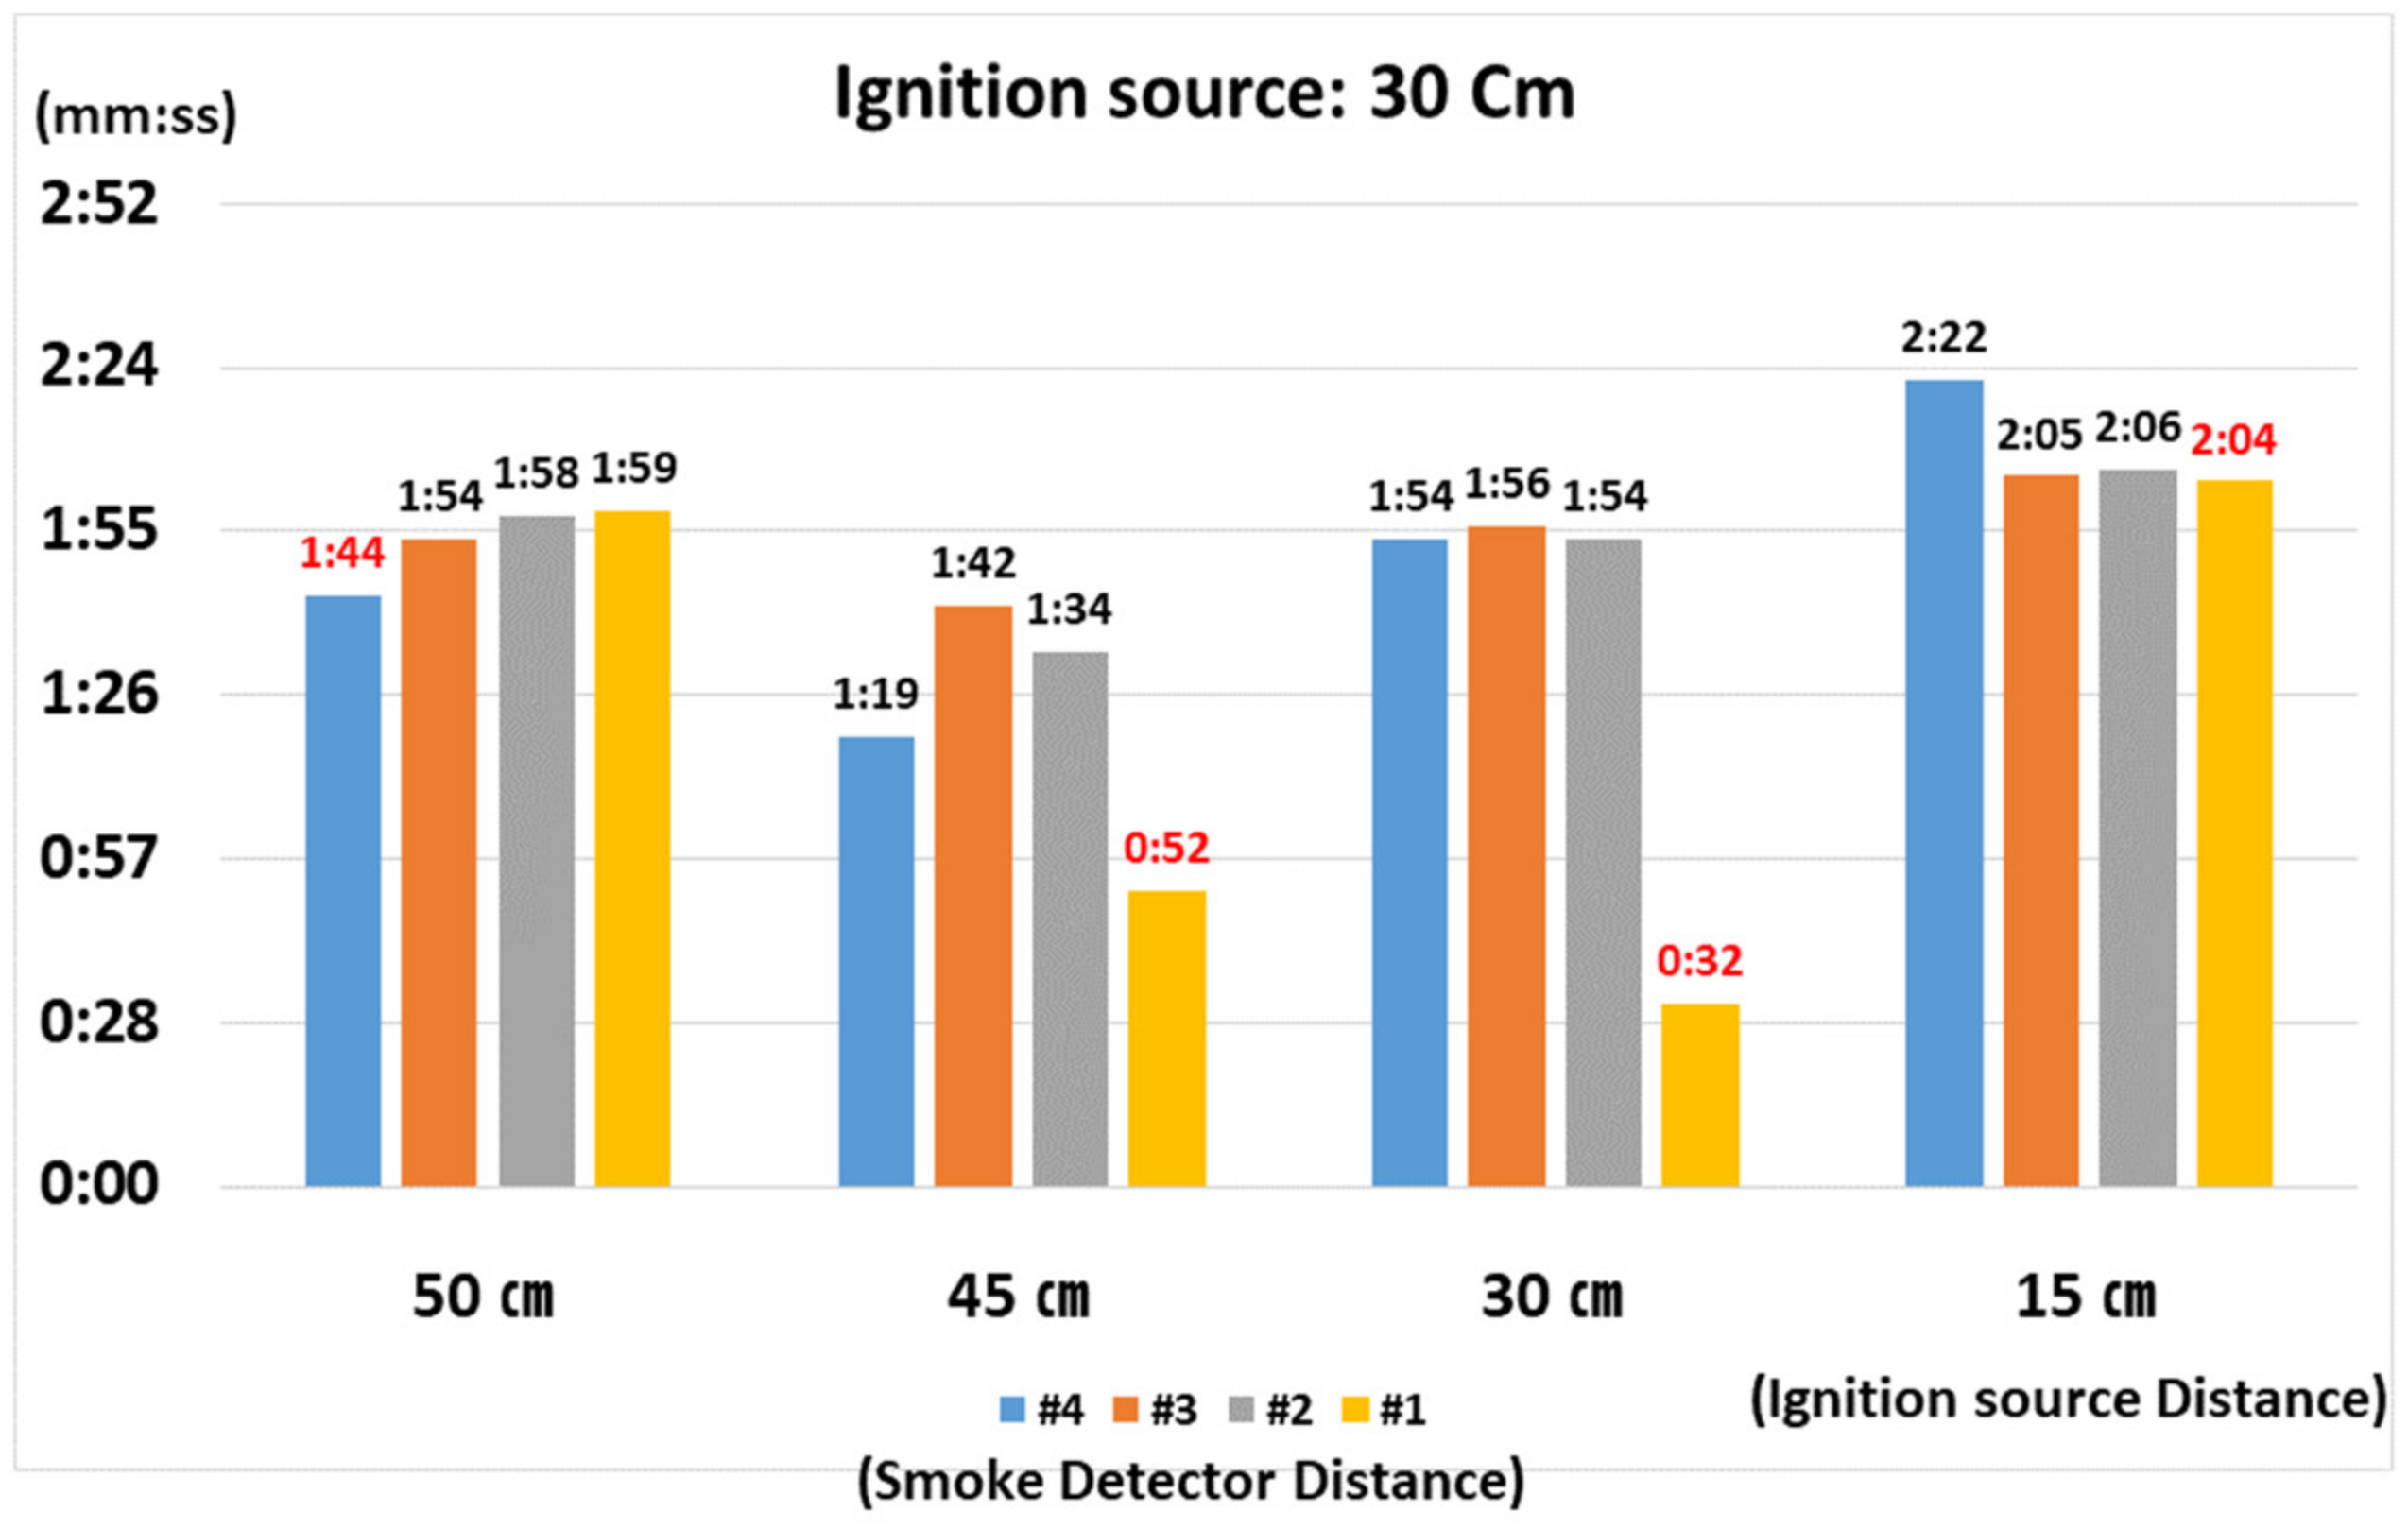
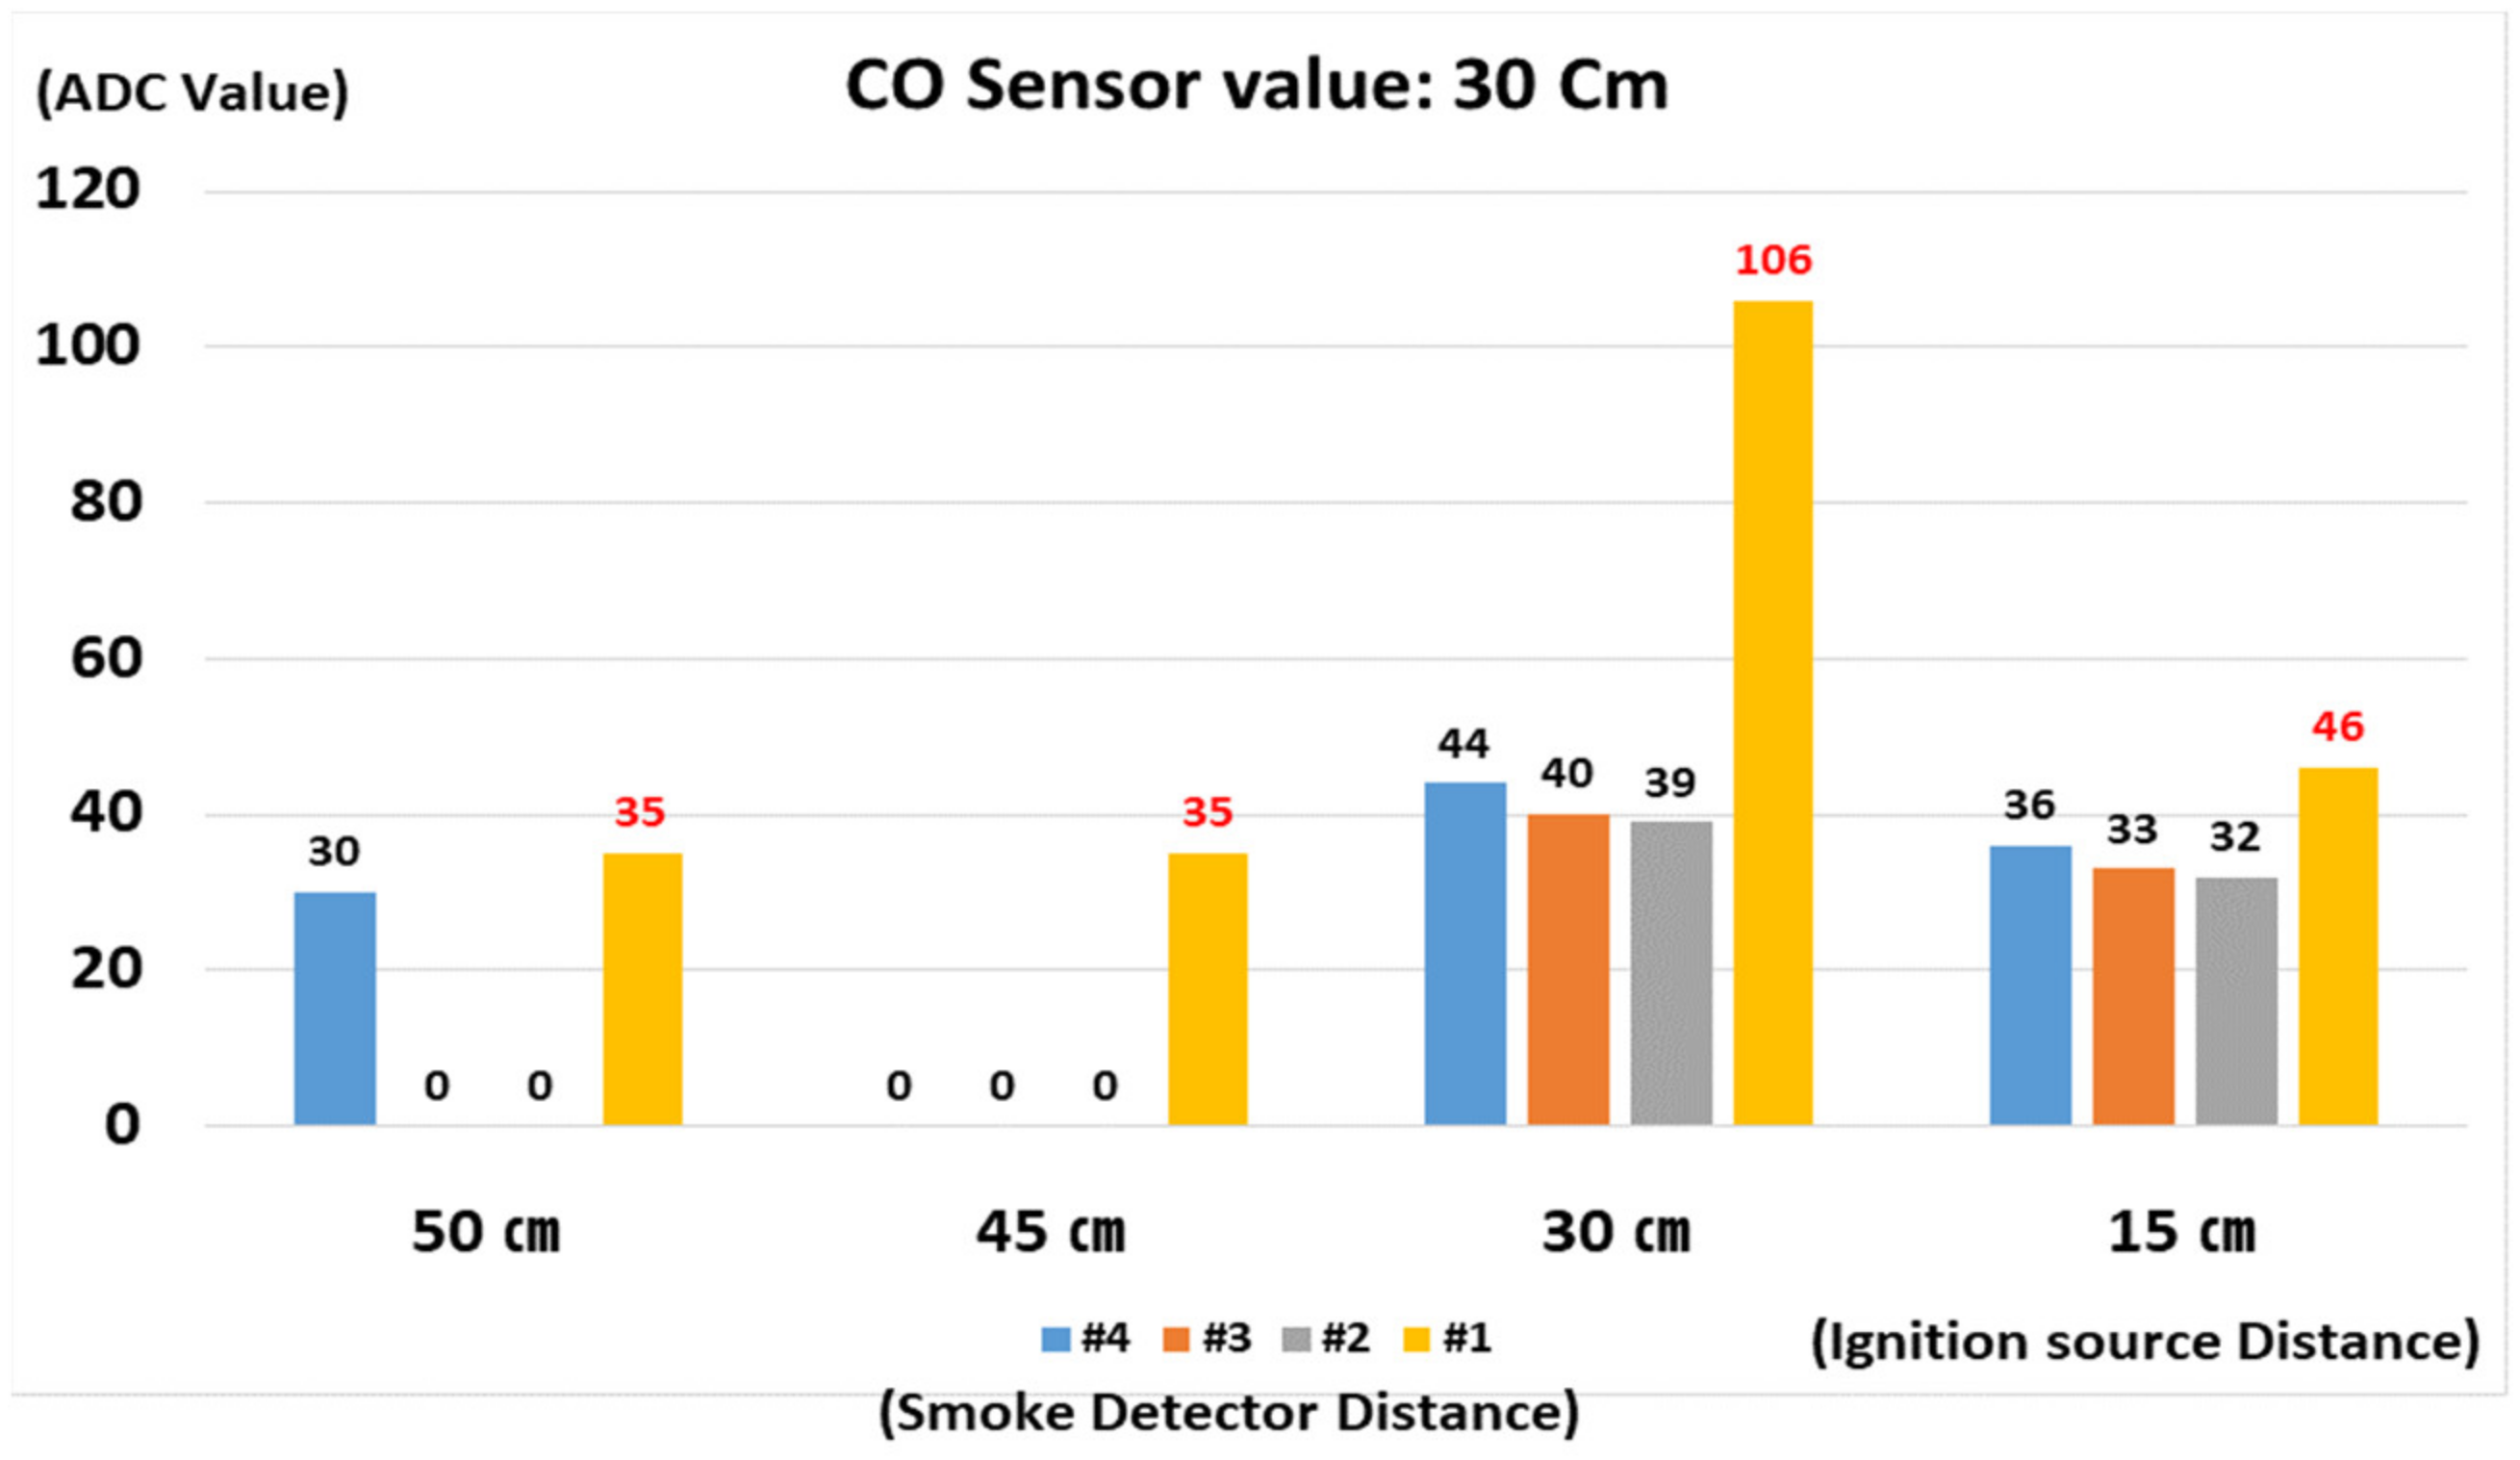
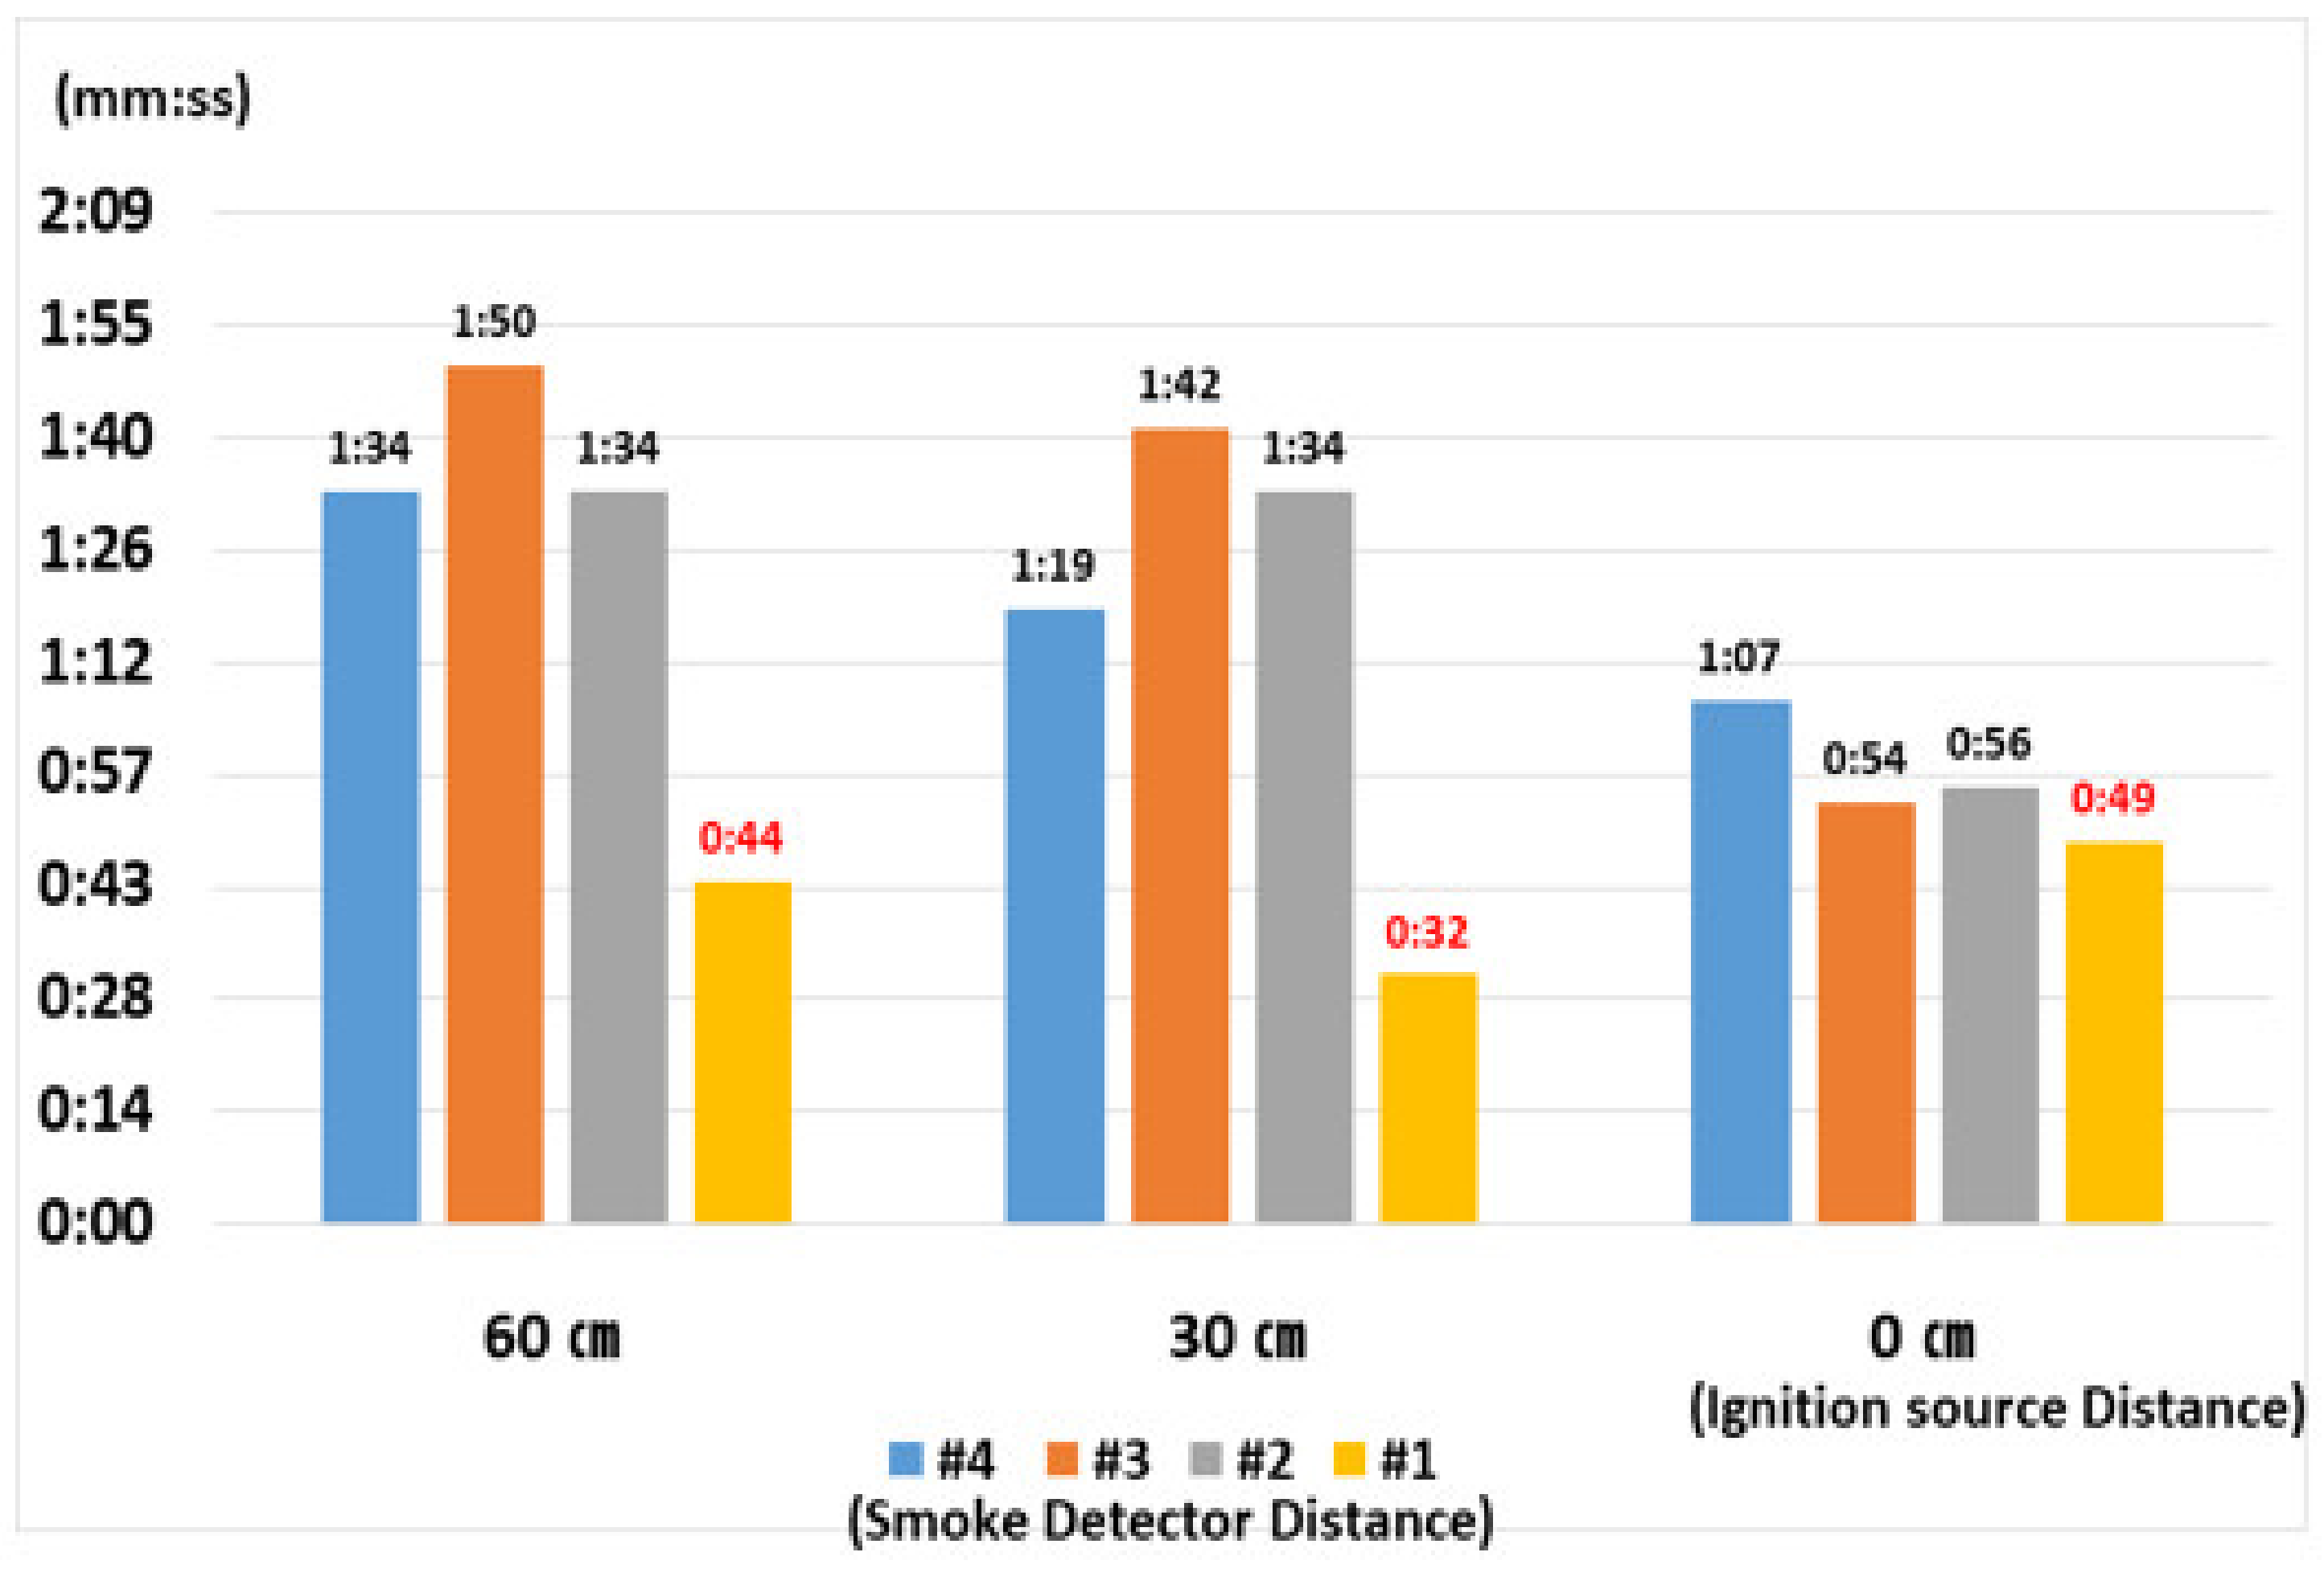
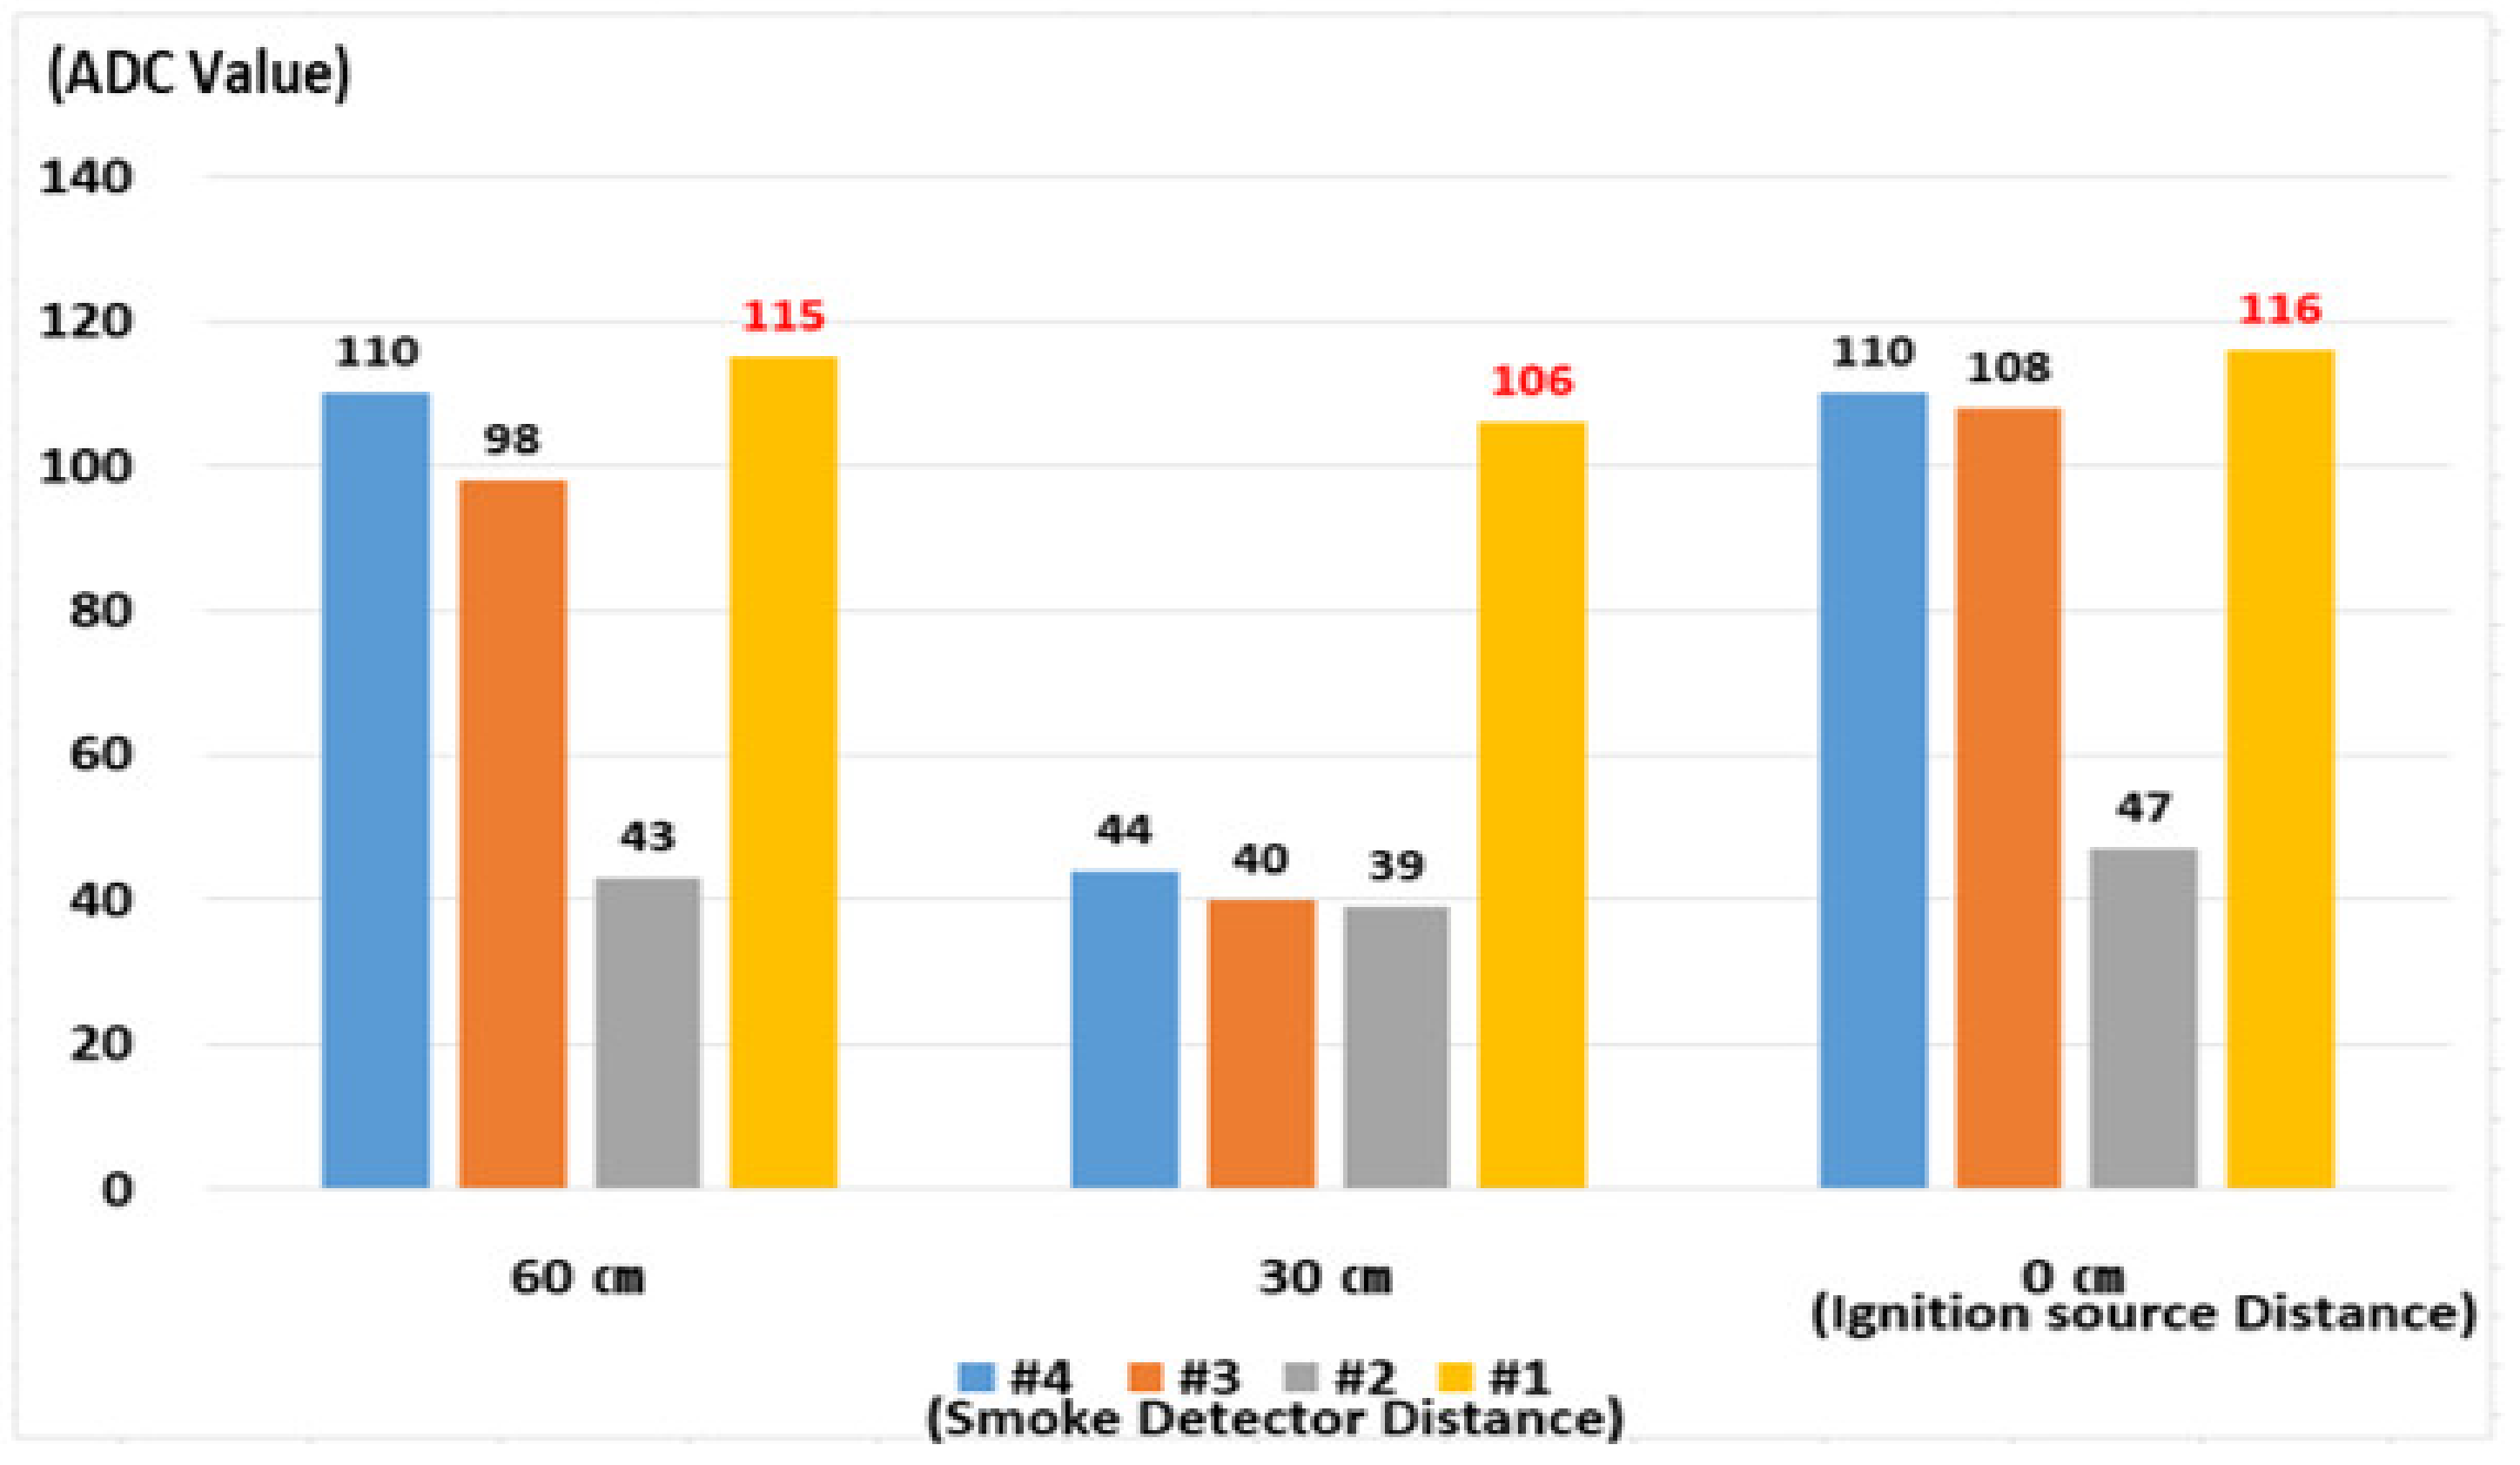
4.2.3. Smoke Detection Time and CO Concentration for Smoke Detectors Installed near Fan for Ignition Source Height of 30 cm

Smoke Detection Time

As shown in Figure 14, the fastest detection times for each ignition source distance were 2 min and 4 s at 15 cm, 32 s at 30 cm, 52 s at 45 cm, and 1 min and 44 s at 50 cm. One of these results was observed for smoke detector #4, whereas the other results were observed for smoke detector #1.
At a distance of 50 cm, smoke detector #4 exhibited the fastest detection time, although the time difference between smoke detectors #1 and #4 was not large (15 s). The fastest detection time was observed for smoke detector #1, which was the closest to the exhaust fan.

CO Concentration

With regard to the CO concentration, the highest values measured were 46 ADC at an ignition source distance of 15 cm, 106 ADC at 30 cm, 35 ADC at 45 cm, and 35 ADC at 50 cm, as shown in Figure 15. For all distances, smoke detector #1 exhibited the highest CO concentration.

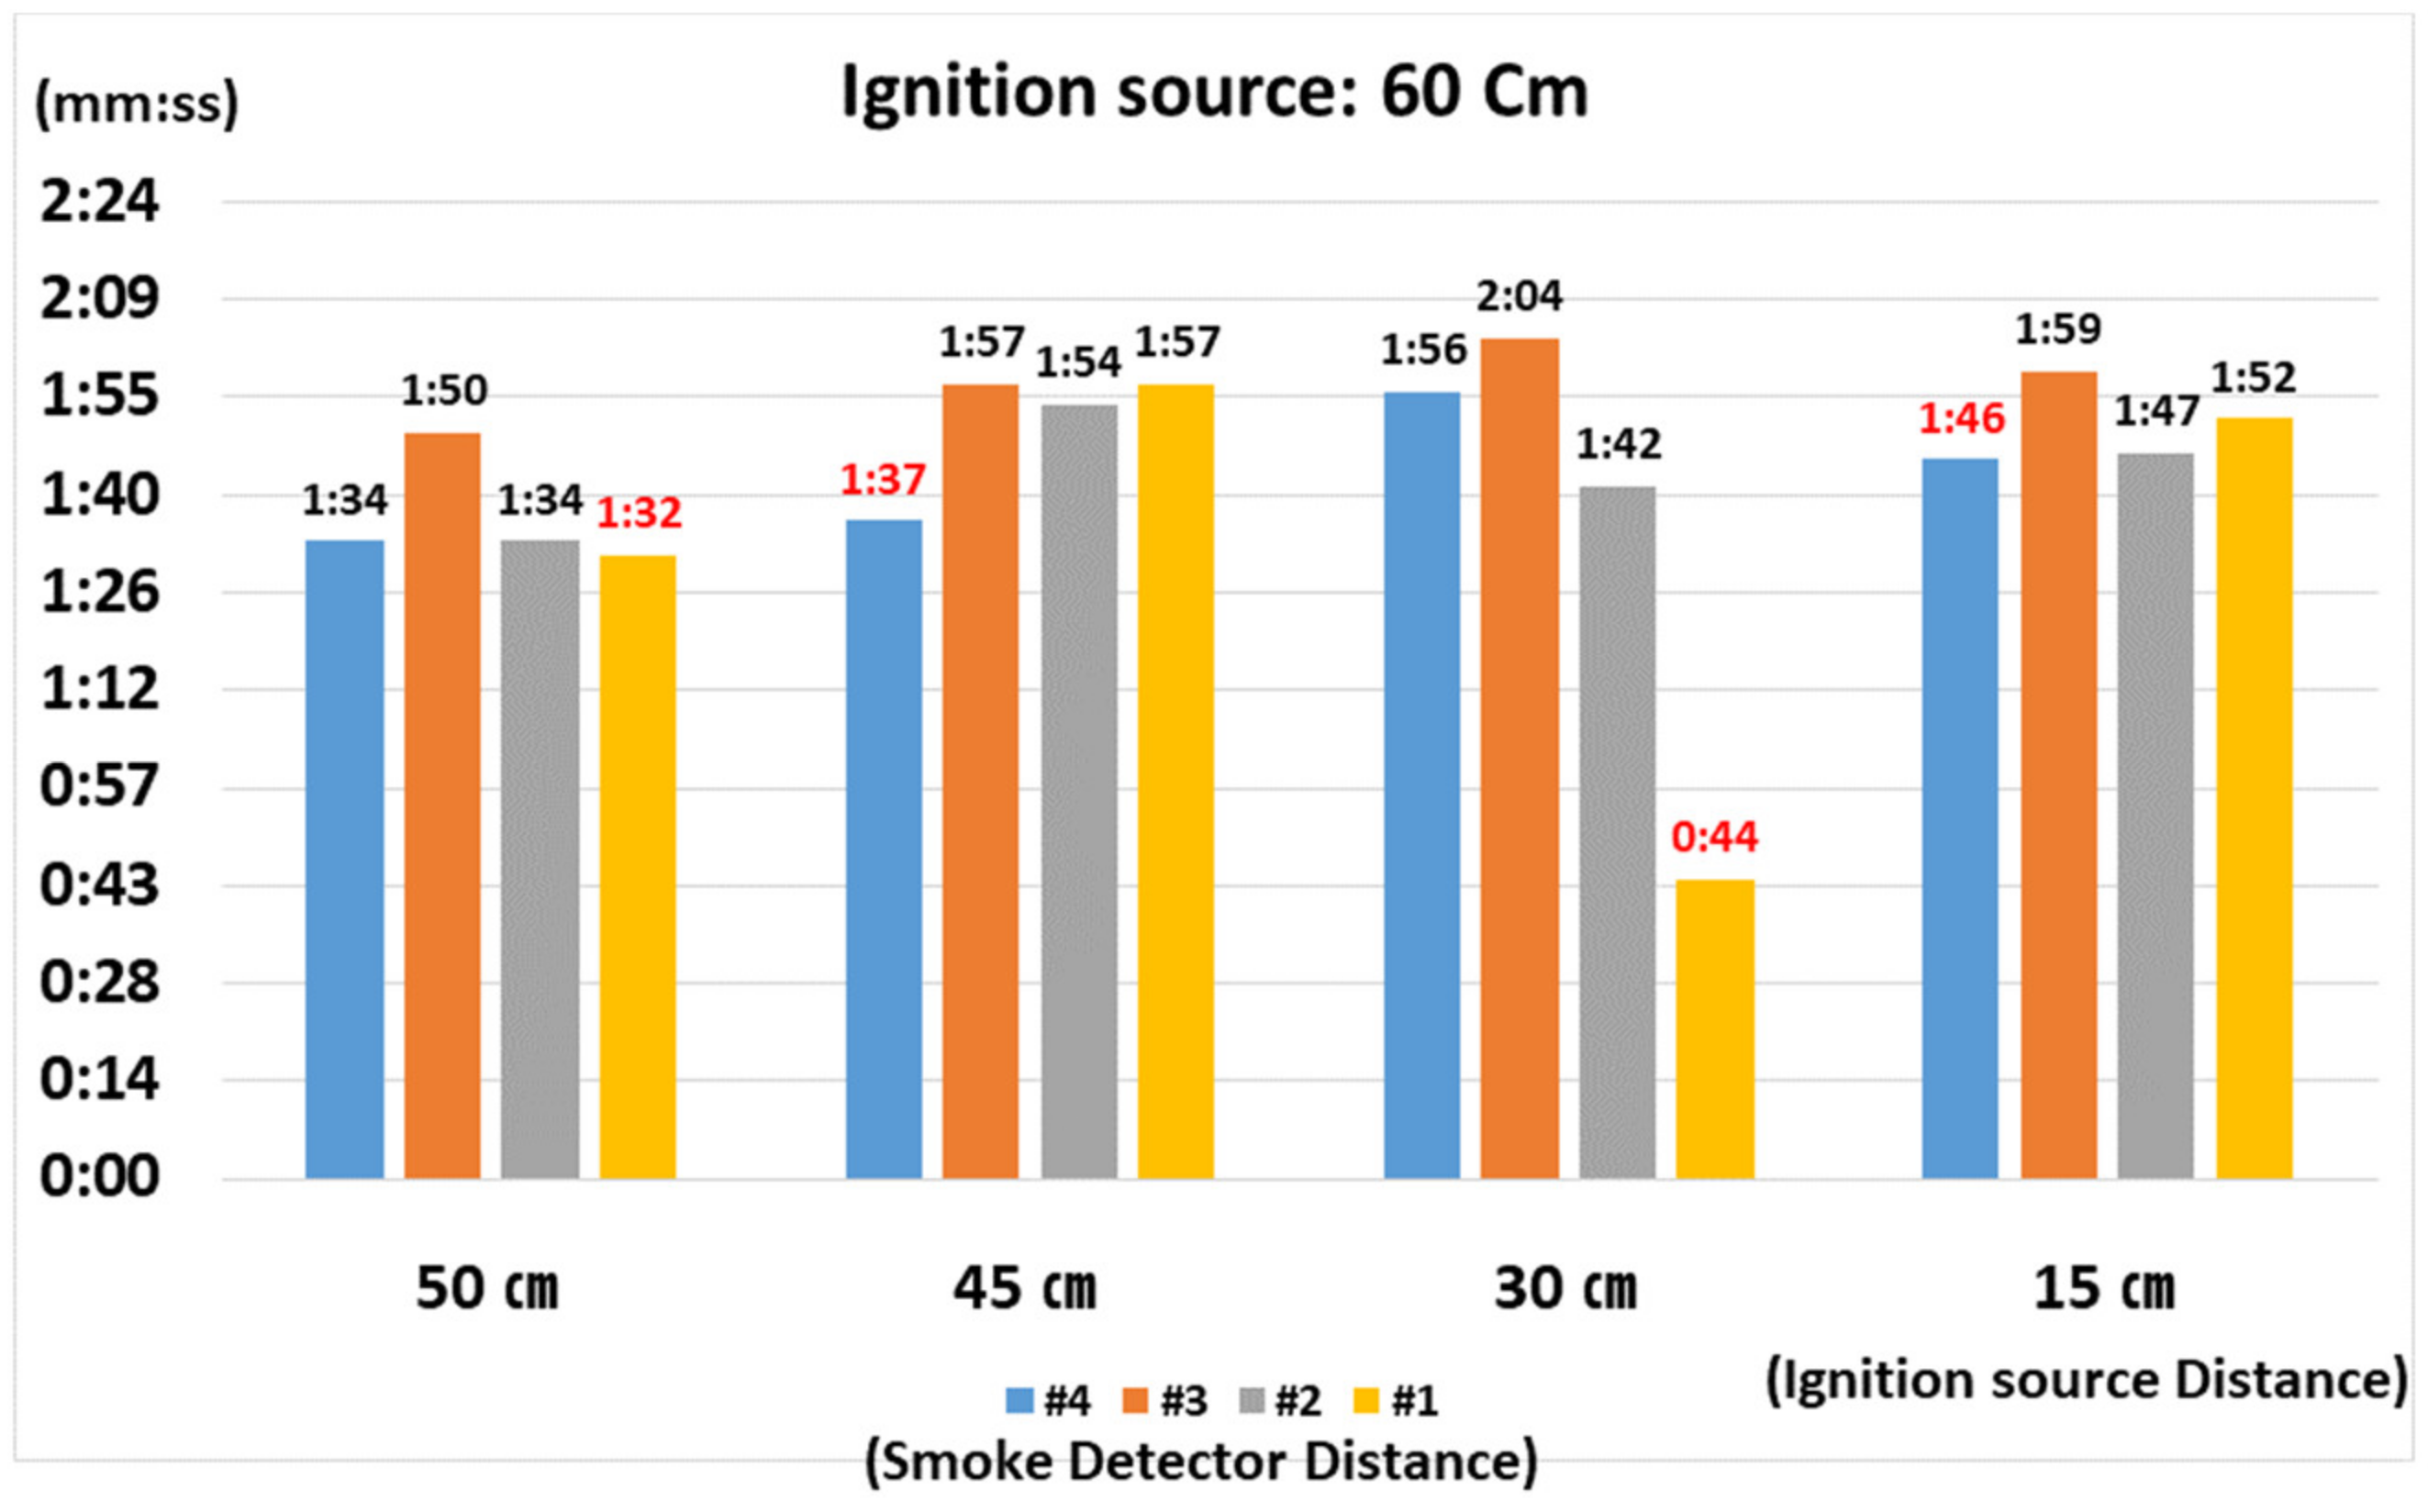
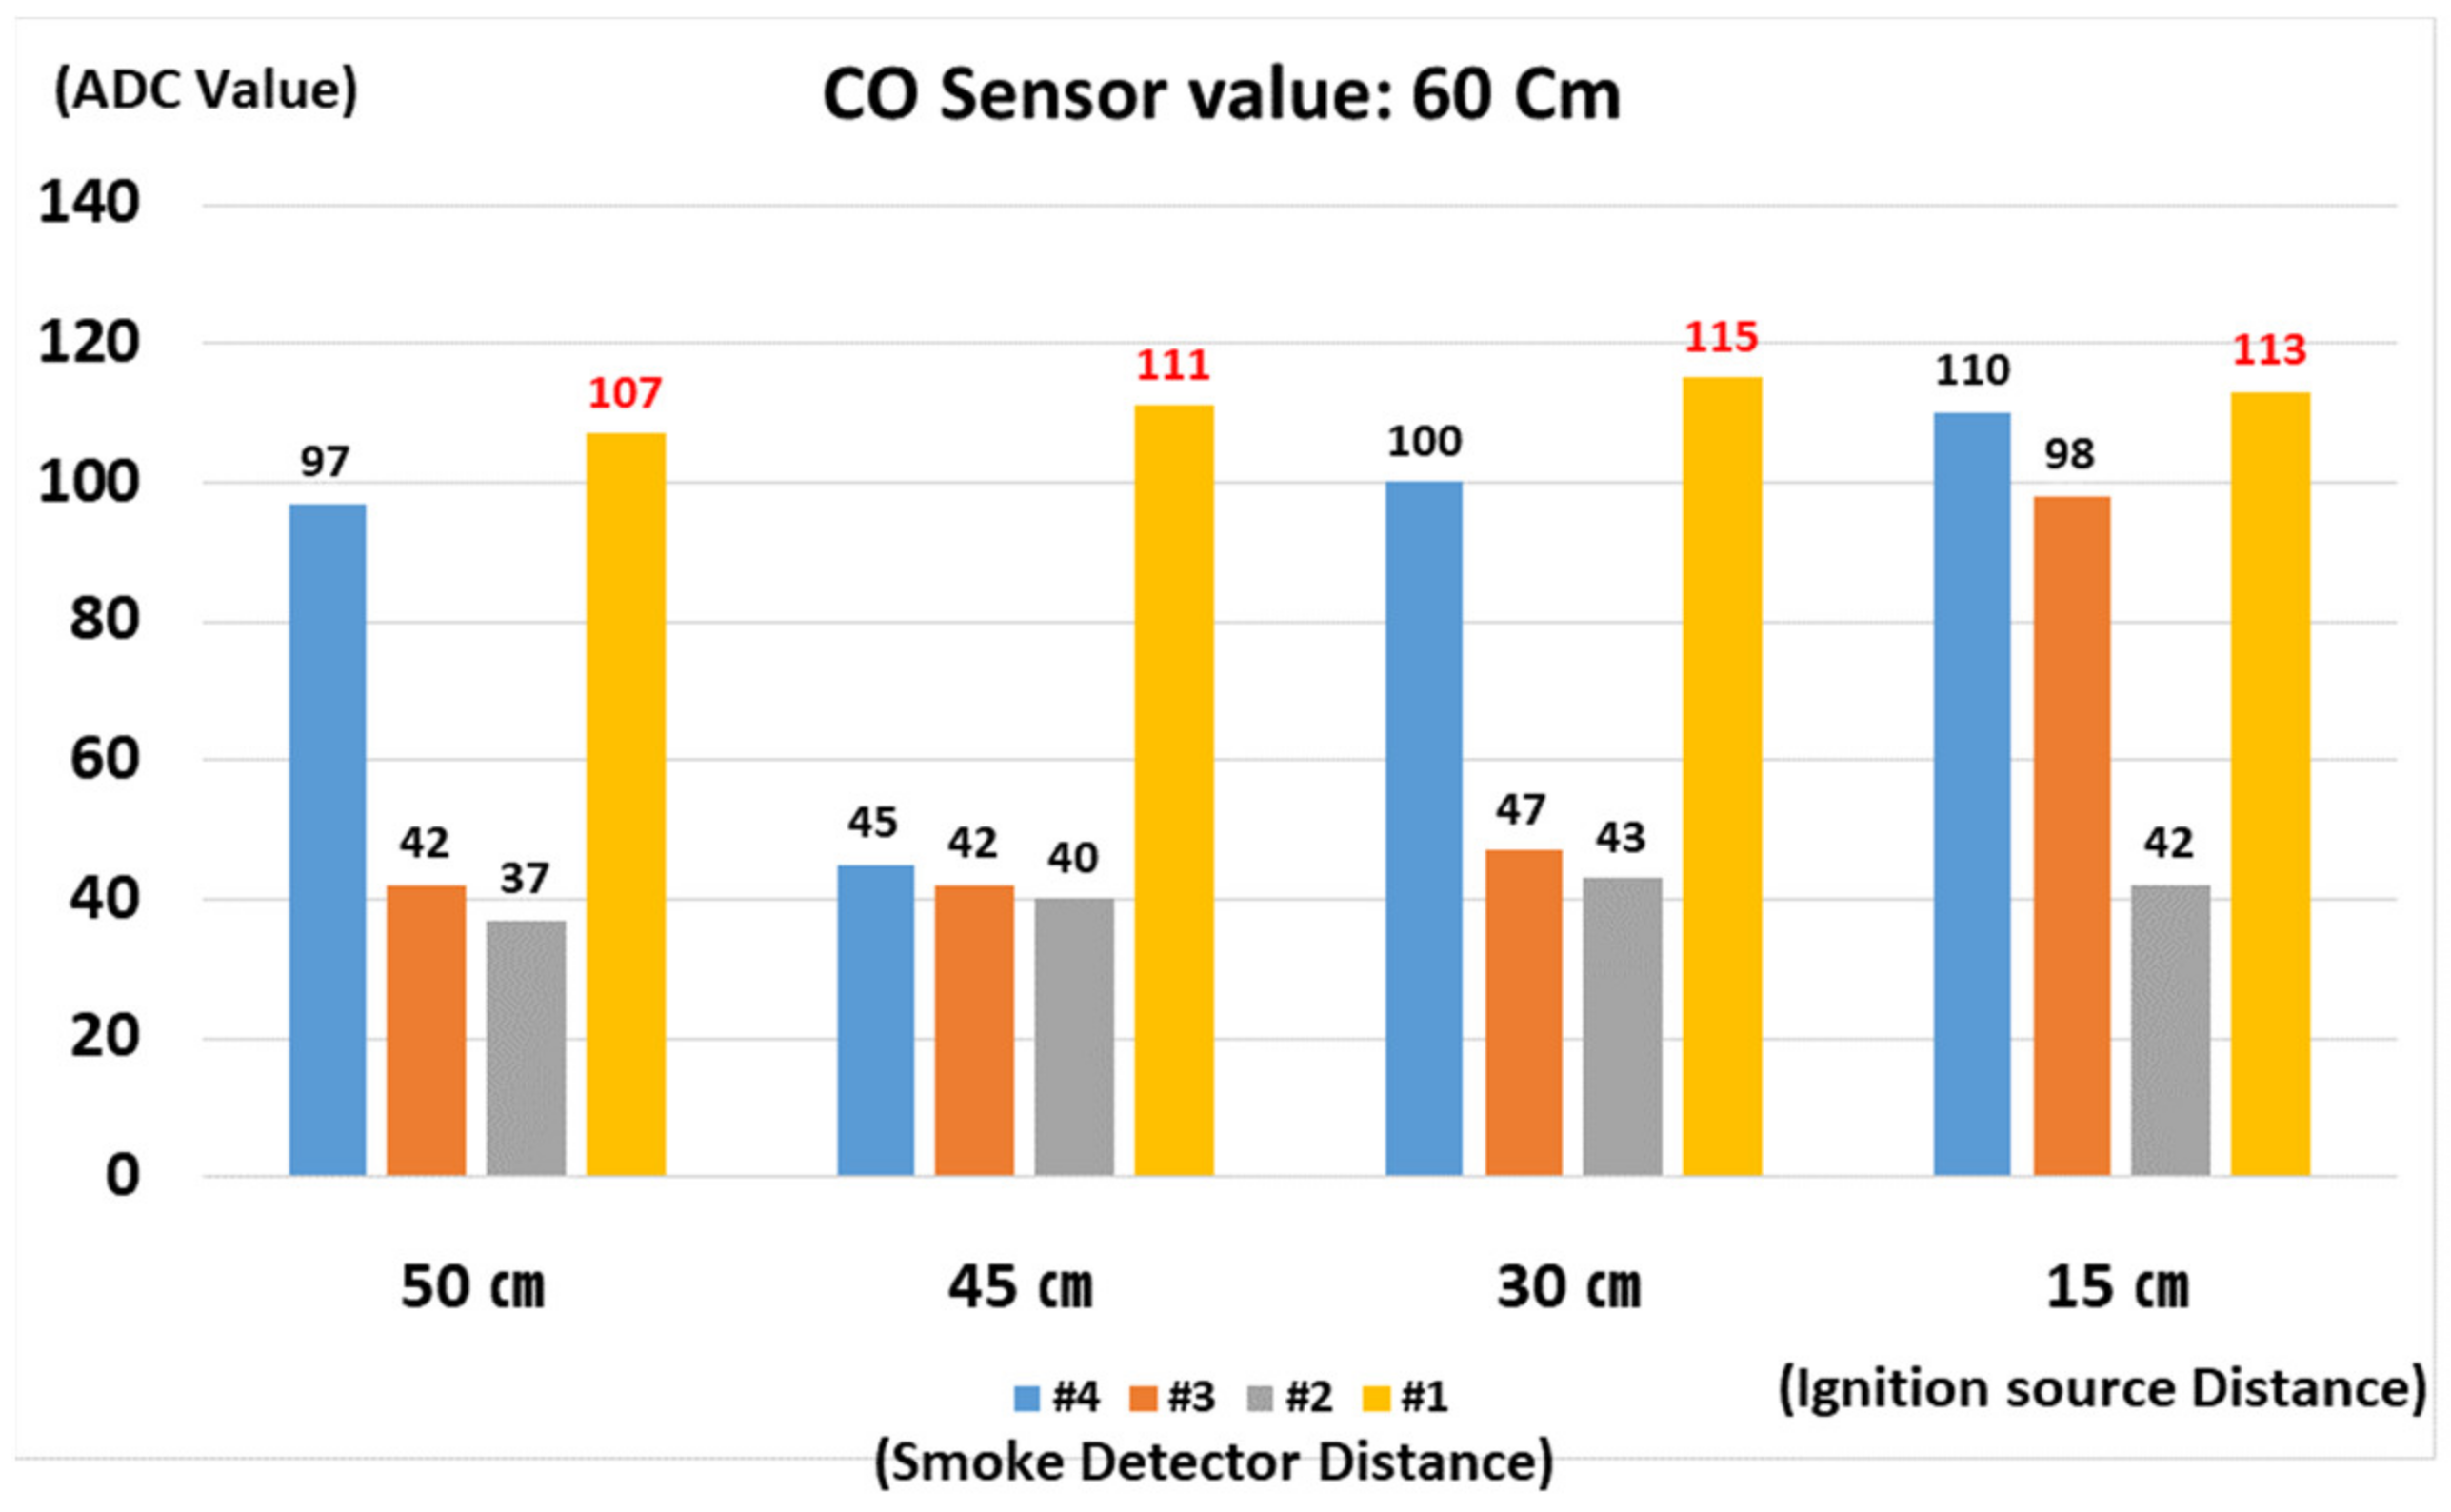
4.2.4. Smoke Detection Time for Smoke Detectors Installed near Fan for Ignition Source Height of 60 cm

Smoke Detection Time

For this scenario, the ignition source height was changed to 60 cm and the ignition source distance was set in the same manner as in Section 4.3.2. The measurements obtained are shown in Figure 16.
The fastest detection times for each ignition source distance were 1 min and 46 s at 15 cm, 44 s at 30 cm, 1 min and 37 s at 45 cm, and 1 min and 32 s at 50 cm. Two of these results were obtained for smoke detector #1, whereas the remaining two were obtained for smoke detector #4.
At distances of 50 and 45 cm, where smoke detector #4 exhibited fast detection, the time difference between smoke detectors #1 and #4 was not large (up to 17 s). For the remaining cases, the fastest detection time was observed for smoke detector #1, which was the closest to the exhaust fan.

CO Concentration

With regard to the CO concentration, the highest values measured were 113 ADC at an ignition source distance of 15 cm, 115 ADC at 30 cm, 111 ADC at 45 cm, and 107 ADC at 50 cm, as shown in Figure 17. For all distances, smoke detector #1 exhibited the highest CO concentration.
The highest CO concentration was measured by the CO sensor of smoke detector #1, which was the closest to the exhaust fan.

4.3. Performance Comparison and Analysis by Smoke Detector Position

4.3.1. Smoke Detection Time Comparison and Analysis

Figure 18 compares the shortest smoke detection times for the smoke detector positions when the ignition source height was changed from 0 to 30 and 60 cm. Smoke detector #1 exhibited the fastest detection performance and required only 49 s to operate the detection alarm. On the one hand, smoke detector #5 installed on the ceiling exhibited the slowest detection performance, requiring 2 min and 49 s to indicate detection, as shown in Table 4. Between the two, a performance difference of up to 2 min was observed based on the experimental data.
Regardless of the ignition source height, smoke detector #1, which was the closest to the exhaust fan, exhibited the highest detection performance. This indicates that the ignition source position has no correlation with the reduction in smoke detection time. On the other hand, the smoke detector performance increased as the distance from the exhaust fan decreased.
The smoke detection time was, on average, slightly inversely proportional to the ignition source height. The smoke detector operation became faster as the ignition source height decreased. This was because of the scattering of smoke by the airflow of the inhalation fan. Specifically, the inhalation fan scattered smoke at the ignition position, thus decreasing the smoke concentration and the smoke was rapidly discharged by the airflow of the exhaust fan.
This can be verified based on the finding that smoke detector #1 exhibited the fastest detection times at ignition source distances of 15, 30, and 45 cm, at which the ignition sources were affected by the airflow of the inhalation fan, when the ignition source heights were 30 and 60 cm, as shown in Figure 18. Smoke detector #4 exhibited a faster detection performance than those of smoke detectors #2 and #3 at an ignition source distance of 50 cm, at which the ignition source was least affected by the airflow because the smoke vertically ascended. Based on the same principle, the detection time deviation of smoke detector #4 according to the ignition source height was determined to be 11.0 s, which was significantly lower than those of smoke detectors #3 (24.7 s) and #2 (17.9 s).
These experimental results indicate that a fire situation in a closed facility can be more rapidly detected if smoke detectors are attached to the ceiling of the facility or if several smoke detectors are installed in the absence of factors that cause airflow change. However, when devices and equipment that can change airflows, such as inhalation and exhaust fans, are installed inside the closed facility, considerably fast smoke detection can be expected if at least one smoke detector is installed closest to the exhaust fan.

4.3.2. CO Concentration Comparison and Analysis

Figure 19 compares the CO concentration according to the smoke detector position when the ignition source height is varied from 0 to 30 and 60 cm.
For all heights, smoke detector #1, which was the closest to the exhaust fan, exhibited the highest smoke concentration. This appears to be due to the accumulation of CO gas around smoke detector #1 as the smoke was discharged through the exhaust fan. When the ignition source height was 30 cm, the smoke was scattered under the influence of the inhalation fan and discharged through the exhaust fan, resulting in a high measurement for smoke detector #1. When the ignition source height was 60 cm, high CO concentrations were measured by smoke detectors #3 and #4 because of the small influence of airflow and the short distance to the samples because the ignition source was installed higher than the inhalation fan. Nonetheless, smoke detector #1 still exhibited the highest CO concentration as the smoke was discharged through it because of airflow due to the exhaust fan.
In terms of smoke detection time, û(15, 55, 0) exhibited the highest performance, as shown in Figure 18. This result indicated that the smoke detector closest to the exhaust fan can most rapidly detect smoke, regardless of the position of the fire on the floor of the distribution panel.
Parameters û(15, 55, 0) also exhibited the highest detection performance in terms of CO concentration, as shown in Figure 19. It can be inferred that the concentration for the smoke detector sample installed near the fan was measured to be high because the gas was collected around the exhaust fan because of smoke discharge through the fan. In the CO measurement experiment, smoke detector #1 rapidly detected smoke and exhibited high CO concentrations on average, confirming that smoke detection performance in the distribution panel can be increased via the placement of the smoke detector as close as possible to the exhaust fan.

4.4. Discussion

4.4.1. Main Findings

Typically, in an actual distribution panel, fire sensors are installed at the center of the panel ceiling. However, the experimental results of this study confirmed that the reaction time was delayed and that the CO concentration was lower for a smoke detector installed on the ceiling of a panel equipped with exhaust and inhalation fans than for a smoke detector installed near the exhaust fan.
Based on this finding, the following implications were derived:
First, smoke that occurs at a height of 60 cm or higher, which is unaffected by inhalation fans, rises vertically and is rapidly detected by the smoke detector immediately above the ignition source. If only one detector is installed inside the distribution panel, the position next to the exhaust fan is probabilistically good for fire prevention. On the other hand, if many exhaust fans are installed in the distribution panel, installing each smoke detector as close as possible to all exhaust fans is recommended.
Second, although smoke detectors #1, #2, #3, and #4 had different operation times in each experiment, smoke detector #1 exhibited the highest CO concentration, confirming that the largest amount of CO was collected near the exhaust fan as it was discharged through the fan. If the smoke concentration is low, fire may not be detected because the smoke is discharged to the outside under the influence of the exhaust fan. Therefore, the smoke detectors must be supplemented with separate gas sensors. A smoke sensor’s performance is determined by the amount of smoke not by the rate of smoke emission. Therefore, the smoke release rate is not necessarily related to the detection rate, etc., when there are multiple flashpoints.

4.4.2. Comparison with Previous Studies

The results of this study imply that, inside certain pieces of equipment or within specific confined places, installing a smoke detector near the exhaust fan rather than on the ceiling makes it possible to promptly detect a fire when airflow changes due to inhalation/exhaust fans is expected.
This is consistent with the experimental results of previous studies by Munir and Erfianto [2] and He et al. [22] and shows that the argument by Choi and Lee [17] that multiple smoke detectors need to be installed is convincing.
The experimental method by Munir and Erfianto [2], in which fire detectors are promptly operated via the control of a nearby exhaust fan upon the detection of smoke, is identical to that in the present study, which is based on the occurrence of high CO concentrations near exhaust fans; thus, fire detectors near these fans are rapidly operated while the fire smoke is released to the outside under the influence of the exhaust fans. According to He et al. [22], ventilator speed control based on the surrounding entrainment phenomenon caused by the suction power of the ventilator is important in the event of fire in a tunnel. Finally, the recommendation by Choi and Lee [17], that multiple smoke detectors should be installed around a ceiling-type air conditioner for early fire detection because of the airflow of the air conditioner, and the observation by Baek et al. [26], that multiple sensors improved the system reliability for fire detection compared with that for only a single sensor, both supported the comparative advantages of combined fire detectors in terms of faster fire detection and more reliability than those for a single fire detector.

4.4.3. Key Strengths

Typically, in a distribution panel, the fire sensor is installed at the center of the ceiling. This is because people think that it is good to install them on the ceiling, as in buildings. However, the experimental results proved that this method is ineffective.
Therefore, this study strongly suggests that it is necessary to consider the change in the flow of smoke as an effect of the specifications of the inhalation/exhaust fans, ignition source material, hot plate temperature, and internal structure of the distribution panel. This study also provides a theoretical basis for revising current regulations on smoke detector installation position in relation to electrical facilities that involve airflow changes, such as distribution panels.
An exhaust fan is a device that manages heat inside the panel and maintains cooling conditions. In Korea [31], fans should be installed on the ceiling or middle upper boundary between the ceiling and floor of the building according to the smoke detector installation regulations. However, there are no standardized regulations for fan installation locations in closed installations such as cabinets. For this reason, most industrial sites install exhaust fans in the upper ceiling for the cooling of closed equipment. There is an urgent need for regulations and standardization in this area.
These results suggest that it is necessary to reflect on such considerations during the installation of smoke detectors in equipment with inhalation and exhaust fans and for changes in policies in the field of fire and environmental safety, such as test methods for environmental safety inspection standards in relation to the introduction of equipment.
Additionally, this study can be applied in a similar manner to most offices with separated spaces. Generally, in offices, each space is equipped with its own air conditioners. The wind from air conditioners can affect smoke detectors depending on the size of the space and the number and positions of air conditioners installed in the space. Therefore, in the case of offices with air-conditioning equipment, it is necessary to review the policy that presents consumer guidelines on the selection of smoke detector positions.

4.4.4. Key Limitations

The smoke detection time derived in this study is not an absolute standard for smoke detection performance.
Distribution panels used at industrial sites have different sizes and internal structures depending on the site and equipment involved. The smoke flow may also change depending on the environment and weather. Therefore, the smoke detection time derived in this study has limitations in providing a basis for comparing smoke detection performance and understanding its relationship with inhalation/exhaust fans.

5. Conclusions

Because of the airflow generated by the inhalation/exhaust fans installed in distribution panels, the response speed of a smoke detector according to the installation position and the effect of fans on the fire detection performance were analyzed. To this end, an experimental study was conducted, in which five type-2 photoelectric smoke detector samples with a light sensitivity of 15% were installed in a distribution panel. One of the samples was installed on the ceiling, whereas the remaining four samples were installed near the fan at certain distances. The smoke detection time and CO concentration were then measured while the ignition source height was varied between experiments. The ignition source height was discretely varied between 0, 30, and 60 cm. For the smoke detector position, the separation distance from the wall was discretely varied between 15, 30, 45, and 50 cm.
According to the experimental results, smoke detector #5, which was installed on the ceiling of the distribution panel, exhibited the lowest performance in terms of smoke and CO concentration detection. However, smoke detector #1, which was located immediately next to the exhaust fan, detected smoke most rapidly in 9 experiments out of 12 for all ignition source heights for û(15, 55, 0), û(15, 55, 30), and û(15, 55, 60). It also exhibited the highest CO concentration for all ignition source heights.
When the experimental results were analyzed, it was observed that for different ignition source positions and heights, the smoke detection time decreased by 75% and the CO concentration increased by 100% for the smoke detector immediately next to the exhaust fan compared with those for the smoke detector installed on the ceiling because of airflow changes caused by the inhalation/exhaust fans.
To design an optimal sensor position for such an internal structure, additional experiments on the alarming speed of an electric fire in a distribution panel and the detection performance of various gas sensors will be performed using type-1 photoelectric smoke detectors (light sensitivity 7.5%) in the presence of airflow due to inhalation/exhaust fans in the distribution panel.
In the future, the alarming speed of an electric fire in a distribution panel will be analyzed using type-1 photoelectric smoke detectors (light sensitivity of 7.5%), the performance of which will be compared in the presence of airflow due to inhalation/exhaust fans in the distribution panel. In addition, the smoke detector response speed will be analyzed through the installation of various additional sensors and research will be conducted on monitoring systems for the prevention of electrical fires. Further research is required—through the simulation of smoke detector locations—to design optimal sensor locations and develop a theoretical analysis that accounts for the various site characteristics and different internal structures of the equipment. Through this, it can be determined that more rapid fire prediction and detection will be possible by closely examining the movement tendencies of smoke in the cabinet.

Author Contributions

Conceptualization, Y.-M.Y. and S.-H.K.; methodology, I.-M.G.; Y.-M.Y. and S.-H.K.; software, I.-M.G.; validation, Y.-M.Y., D.-S.R. and S.-H.K.; formal analysis, Y.-M.Y. and S.-H.K.; investigation, I.-M.G.; resources, Y.-M.Y.; data curation, I.-M.G. and Y.-M.Y.; writing—original draft preparation, I.-M.G. and S.-H.K.; writing—review and editing, I.-M.G. and S.-H.K.; visualization, I.-M.G., D.-S.R. and S.-H.K.; supervision, S.-H.K.; project administration, Y.-M.Y. and S.-H.K.; funding acquisition, S.-H.K. All authors have read and agreed to the published version of the manuscript.

Funding

This research received no external funding.

Institutional Review Board Statement

Not applicable.

Informed Consent Statement

Not applicable.

Data Availability Statement

The data supporting the reported results are available upon request.

Conflicts of Interest

The authors declare no conflict of interest.

References

  1. Choi, M.S.; Hong, S.H.; Park, S.T.; Yu, S.H. Sensitivity performance change of fire detector due to inflow velocity from air inlet. In Proceedings of the 2013 Spring Annual Conference, Korea Institute of Fire Science and Engineering, Daejeon, Republic of Korea, 18–19 April 2013; pp. 148–149. [Google Scholar]
  2. Munir, M.; Erfianto, B. A distributed fuzzy logic with consensus for exhaust fan controller. In Proceedings of the 2020 8th International Conference on Information and Communication Technology (ICoICT), Yogyakarta, Indonesia, 24–26 June 2020; IEEE: New York, NY, USA, 2020; pp. 1–6. [Google Scholar] [CrossRef]
  3. Kim, T.H.; Kim, Y.J.; Rie, D.H. The effect of air purifier on smoke detector revealed by fire dynamics simulation. Sustainability 2022, 14, 2259. [Google Scholar] [CrossRef]
  4. Kim, C.M.; Kim, T.H.; Kim, Y.S.; Shong, K.M. Development device for decrease electrical accident in panel. In Proceedings of the 2016 Fall Annual Conference. The Korean Institute of Electrical Engineers, Kwangju, Republic of Korea, 13–15 July 2016; pp. 273–274. [Google Scholar]
  5. Shin, S.S.; Lee, S.I.; Kim, G.H.; Bae, S.M. Development of fire detector with communication function in cabinet panel. In Proceedings of the 2011 Spring Annual Conference. The Korean Institute of Electrical Engineers, Yongpyong, Republic of Korea, 20–22 July 2011; pp. 91–92. [Google Scholar]
  6. Yeon, Y.M.; Kim, S.H. Analysis of the risk of heat generation due to bolt loosening in terminal block connector parts. Fire Sci. Eng. 2020, 34, 67–75. [Google Scholar] [CrossRef]
  7. Yeon, Y.M.; Kim, S.H. Diagnosis of abnormal heat generation in the connection part in low voltage MCCBs for fire risk prediction. Fire Sci. Eng. 2020, 34, 42–49. [Google Scholar] [CrossRef]
  8. Park, S.H.; Choi, J.C. A study on the development of the photo-electric single station smoke alarm of low power consumption for residential fire prevention. Fire Sci. Eng. 2010, 24, 46–53. [Google Scholar]
  9. Hong, S.H.; Park, M.W.; Yoo, Y.S. An experimental study on the fire detection performance of combined fire detector using multi-sensor for rack-type warehouse. Korean J. Hazard. Mater. 2019, 7, 59–63. [Google Scholar] [CrossRef]
  10. Jee, S.W. Analysis of the response time of a photoelectric spot-type smoke detector depending on the type of fires. J. Korean Inst. Illum. Electr. Install. Eng. 2013, 27, 89–94. [Google Scholar] [CrossRef]
  11. Jung, J.J.; Kim, C.T. Development of a fire smoke detector that satisfies the UL 268 (7th edition) fire sensitivity tests. J. Korean Soc. Hazard Mitig. 2022, 22, 101–108. [Google Scholar] [CrossRef]
  12. Tu, R.; Fang, J.; Zeng, Y.; Guan, J.; Zhang, Y. A prediction model of point-type smoke detector response signal variation in high altitude area. In Proceedings of the 2011 International Conference on Electrical and Control Engineering, Yichang, China, 16–18 September 2011; IEEE: New York, NY, USA, 2011; pp. 972–975. [Google Scholar] [CrossRef]
  13. Kim, W.H.; Noh, J.H.; Song, S.B.; Yeo, I.S. Study on optical structure for improving detection efficiency of photoelectric fire detectors. In Proceedings of the 2021 Fall Annual Conference. Illuminating and Electrical Installation Engineers, Kangwon, Republic of Korea, 12–14 May 2021; p. 29. [Google Scholar]
  14. Hong, H.S.; Choi, M.S.; Park, S.T.; Baek, D.H. A study on the reliability test for smoke detection chamber of smoke detector. In Proceedings of the 2012 Spring Annual Conference. Fire Science and Engineering, Daegu, Republic of Korea, 3–4 May 2012; pp. 389–392. [Google Scholar]
  15. Zhong, C.; Liu, X.; Tian, Z.; Li, H. Anti-interference smoke fire detection technology in typical sacrificial places. In Proceedings of the 2021 3rd International Conference on Intelligent Control, Measurement and Signal Processing and Intelligent Oil Field (ICMSP), Xi’an, China, 23–25 July 2021; IEEE: New York, NY, USA, 2021; pp. 317–321. [Google Scholar] [CrossRef]
  16. National Fire Agency. Type Approval of Detectors and Technical Standards for Product Inspection: Notice Partial Revision; National Fire Agency: Sejong-si, Republic of Korea, 2019. [Google Scholar]
  17. Choi, M.S.; Lee, K.O. Study on influence of air flow of ceiling type air conditioner on fire detector response. Fire Sci. Eng. 2018, 32, 40–45. [Google Scholar] [CrossRef]
  18. National Fire Agency. Fire Safety Standards for Automatic Fire Detection Facilities and Visual Alarm Devices (NFSC203): Notice no2020-182; National Fire Agency: Sejong-si, Republic of Korea, 2020. [Google Scholar]
  19. Choi, K.O.; Park, M.W.; Choi, D.M. Improvement of fire detection in rack-type warehouses using FDS. Fire Sci. Eng. 2019, 33, 55–60. [Google Scholar] [CrossRef] [Green Version]
  20. Roh, S.K.; Yoon, H.U. Selection of a fire detector for wood cultural property. Fire Sci. Eng. 2016, 30, 88–93. [Google Scholar] [CrossRef]
  21. Son, G.S.; So, S.H. A study on fire alarm test of IoT multi-fire detector combined smoke/CO and smoke/temperature sensors. J. Soc. Disaster Inf. 2021, 17, 236–244. [Google Scholar] [CrossRef]
  22. He, L.; Xu, Z.; Chen, H.; Liu, Q.; Wang, Y.; Zhou, Y. Analysis of entrainment phenomenon near mechanical exhaust vent and a prediction model for smoke temperature in tunnel fire. Tunn. Undergr. Space Technol. 2018, 80, 143–150. [Google Scholar] [CrossRef]
  23. Xavier, K.L.B.L.; Visakha, K.N. Development of an early fire detection technique using a passive infrared sensor and deep neural networks. Fire Technol. 2022, 58, 3529–3552. [Google Scholar] [CrossRef]
  24. Xie, Y.; Zhu, J.; Guo, Y.; You, J.; Feng, D.; Cao, Y. Early indoor occluded fire detection based on firelight reflection characteristics. Fire Saf. J. 2022, 128, 103542. [Google Scholar] [CrossRef]
  25. Birajdar, G.S.; Baz, M.; Singh, R.; Rashid, M.; Gehlot, A.; Akram, S.V.; Alshamrani, S.S.; AlGhamdi, A.S. Realization of people density and smoke flow in buildings during fire accidents using raspberry and openCV. Sustainability 2021, 13, 11082. [Google Scholar] [CrossRef]
  26. Baek, J.; Alhindi, T.J.; Jeong, Y.S.; Jeong, M.K.; Seo, S.; Kang, J.; Shim, W.; Heo, Y. Real-time fire detection system based on dynamic time warping of multichannel sensor networks. Fire Saf. J. 2021, 123, 103364. [Google Scholar] [CrossRef]
  27. Park, D.S. Development of intelligent complex fire detectors for railway vehicles. Railw. J. 2009, 12, 12–17. [Google Scholar]
  28. Park, J.O.; Lee, W.J.; Yim, H.B. The design of a reliable hardware and S/W protocol in RS485 multi-communication. In Proceedings of the 2021 Fall Annual Conference. Korean Institute of Communications and Information Sciences, Yeosu, Republic of Korea, 17–19 November 2021; pp. 196–199. [Google Scholar]
  29. Vinten, A.J.A.; Davies, R.; Castle, K.; Baggs, E.M. Control of nitrate leaching from a nitrate vulnerable zone using paper mill waste. Soil Use Manag. 1998, 14, 44–51. [Google Scholar] [CrossRef]
  30. Kim, T.W.; Park, C.H.; Lee, S.I. Study on the temperature characteristics & fire risk in accordance with the series Arcing in the connecting portion of the circuit breaker. In Proceedings of the 2016 Summer Annual Conference. Journal of the Korean Institute of Electrical Engineers, Jeju-si, Republic of Korea, 21–23 March 2016; pp. 1553–1554. [Google Scholar]
  31. National Fire Agency. Fire Safety Standards for Smoke Control Systems (NFSC501): Notice no2022-23; National Fire Agency: Sejong-si, Republic of Korea, 2022. [Google Scholar]
Figure 1. Research process.
Fire 06 00049 g001
Figure 2. Smoke detector prototype for experiment: (a) case of combined detector; (b) PCB of combined detector.
Fire 06 00049 g002
Figure 3. Smoke detector circuit diagram. (a) MCU STM32F051; (b) smoke detector; (c) CO sensors; (d) temp. sensors; (e) RS485.
Fire 06 00049 g003aFire 06 00049 g003b
Figure 4. Chamber for the KFI experiment.
Fire 06 00049 g004
Figure 5. Verification experiment for quality accuracy of the CO sensor.
Fire 06 00049 g005
Figure 6. Distribution panel manufactured for experiment with installed exhaust and inhalation fans.
Fire 06 00049 g006
Figure 7. Experiment environment. (a) Hot plate, (b) UL 2464 AMS.
Fire 06 00049 g007
Figure 8. Distribution board drawing. (a) The 3D drawing; (b) fire origin and sample location.
Fire 06 00049 g008
Figure 9. Sample installation on ceiling.
Fire 06 00049 g009
Figure 10. Location of a smoke detector which has been positioned around the exhaust fan for an experiment.
Fire 06 00049 g010
Figure 11. Height of the ignition source.
Fire 06 00049 g011
Figure 12. Elapsed time until smoke detection for ignition source height of 0 cm.
Fire 06 00049 g012
Figure 13. Carbon monoxide detection concentration for ignition source height of 0 cm.
Fire 06 00049 g013
Figure 14. Elapsed time until smoke detection at height of 30 cm from ignition source.
Fire 06 00049 g014
Figure 15. Carbon monoxide detection concentration for ignition source height of 30 cm.
Fire 06 00049 g015
Figure 16. Elapsed time until smoke detection for ignition source height of 60 cm.
Fire 06 00049 g016
Figure 17. Carbon monoxide detection concentration for ignition source height of 60 cm.
Fire 06 00049 g017
Figure 18. Time comparison test result by ignition source height.
Fire 06 00049 g018
Figure 19. Concentration value comparison test result by ignition source height.
Fire 06 00049 g019
Table 1. Preliminary study summary.
CategoryReferenceMain Contents
Fire sensor performanceMunir and Erfianto [2]Reason for using exhaust fans is described. Exhaust fan controller is developed using “system executes distributed fuzz” technology.
Hong et al. [9]Fire sensors suitable for rack-type warehouses are proposed based on experiment in rack-type warehouse on response characteristics according to fire sensor type.
Jee [10]Reference data to improve smoke detector performance are presented based on analysis of reaction times of photoelectric smoke detectors according to ignition source (paper, wood, and oil).
Tu et al. [12]Principles of ionization detectors are described.
Kim WH et al. [13]Method for designing an optical chamber interior structure effective for performance improvement of photoelectric smoke detectors is proposed.
Hong et al. [14]Method for verifying performance and reliability of photoelectric smoke detectors is proposed.
Zhong et al. [15]Principles of photoelectric smoke detectors are described and method for reliability improvement is proposed.
Choi and Lee [17]Changes in sensitivity of fire sensors are analyzed based on experiment involving various conditions of airflow formed by cooling/heating equipment.
Kim TH et al. [3]Influence of air purifiers on smoke detector operation is analyzed.
Choi et al. [19]Optimal fire sensor installation conditions that account for flow of heat and smoke in rack-type warehouse are presented using fire dynamic simulator (FDS).
He et al. [22]Safe design method is proposed based on analysis of smoke flow according to entrainment phenomenon around exhaust fan in event of fire.
Fire sensor development and function improvementShin et al. [5]Characteristics of electric fire are analyzed through simulation and fire detection device, equipped with communication function that reflected analysis results, inside distribution panel is developed.
Park and Choi [8]Photoelectric alarm-type detector with low power consumption is developed to prevent house fires.
Son and So [21]IoT multi-fire detector is developed by combining three sensors (smoke, CO, and heat) and its fire detection performance is verified.
Park [27]Intelligent combined fire sensor specialized for railway vehicles is developed.
Xavier and Visakha [23]Video fire detection technology that uses HC-SR501 PIR motion sensor is proposed.
Xie et al. [24]Early indoor occluded fire detection technology based on light reflection characteristics is proposed.
Birajdar et al. [25]Vision-based fire detection technology that uses population density inside building and smoke detection system in event of fire is proposed.
Fire sensor selection methodRoh and Yoon [20]Method for selecting detectors that accounts for space types of closed and opened wooden structures is presented.
Baek et al. [26]Effect of multiple sensors, compared to a single sensor, on improving system reliability for fire detection was reported.
Table 2. List of parts used for prototyping.
PartPurposeManufacturerSpecification
ChamberPhotoelectric smoke chamberMetis-
SensorReceiverKodenshi AUKHPI-6FFR4
TransmitterSI5312H
Catalytic gas sensorCO detectionWinsenMQ-7B
SensorTemperature/humidity detectionSensirionSHT-31
Protocol
(RS-485)
Status monitoring and notificationTexas InstrumentsSN75176B
Table 3. Photoelectric sensor sensitivity test regulations.
Test ItemTest Criteria
Operation testWhen flowing wind containing smoke with light sensitivity of 15% per 1 m is introduced into an airflow of 20 to 40 cm/s, non-accumulating type operates within 30 s.
Non-operation testWhen flowing wind containing smoke with light sensitivity of 15% per 1 m is introduced into an airflow of 20 to 40 cm/s, operation must not occur within five minutes.
Table 4. Performance in terms of detection time for smoke time and carbon monoxide from ignition source height of 0 cm (ceiling).
Ceiling Sample #5Distance from Fan Installation Surface
(Separation Distance)
15 cm30 cm45 cm50 cm
Smoke detection (minute: second)1:341:372:092:49
CO concentration (unit: ADC)41964542
Disclaimer/Publisher’s Note: The statements, opinions and data contained in all publications are solely those of the individual author(s) and contributor(s) and not of MDPI and/or the editor(s). MDPI and/or the editor(s) disclaim responsibility for any injury to people or property resulting from any ideas, methods, instructions or products referred to in the content.

