Article

Image-Based Formalization of Tabular Data for Threshold-Based Prediction of Hospital Stay Using Convolutional Neural Networks: An Intelligent Decision Support System Applied in COPD

by
Alberto Pinheira
1,2,3,*,
Manuel Casal-Guisande
4,5,6,*,
Julia López-Canay
4,5,
Alberto Fernández-García
7,
Rafael Golpe
8,
Cristina Represas-Represas
5,6,9,
María Torres-Durán
5,6,9,
Jorge Cerqueiro-Pequeño
1,2,
Alberto Comesaña-Campos
1,2 and
Alberto Fernández-Villar
5,6,9,10
1
Department of Design in Engineering, University of Vigo, 36208 Vigo, Spain
2
Design, Expert Systems and Artificial Intelligent Solutions Group (DESAINS), Galicia Sur Health Research Institute (IIS Galicia Sur), SERGAS-UVIGO, 36312 Vigo, Spain
3
Department of Computer Engineering, Superior Institute of Engineering of Porto, 4249-015 Porto, Portugal
4
Fundación Pública Galega de Investigación Biomédica Galicia Sur, Hospital Álvaro Cunqueiro, 36312 Vigo, Spain
5
NeumoVigo I+i Research Group, Galicia Sur Health Research Institute (IIS Galicia Sur), SERGAS-UVIGO, 36312 Vigo, Spain
6
Centro de Investigación Biomédica en Red, CIBERES ISCIII, 28029 Madrid, Spain
7
Diagnostic Imaging Department, Hospital Ribera Povisa, 36211 Vigo, Spain
8
Pulmonary Department, Hospital Lucus Augusti, 27003 Lugo, Spain
9
Pulmonary Department, Hospital Álvaro Cunqueiro, 36312 Vigo, Spain
10
School of Industrial Engineering, University of Vigo, 36310 Vigo, Spain
*
Authors to whom correspondence should be addressed.
Appl. Syst. Innov. 2025, 8(5), 128; https://doi.org/10.3390/asi8050128
Submission received: 28 May 2025 / Revised: 17 July 2025 / Accepted: 26 August 2025 / Published: 2 September 2025

Abstract

Background: Chronic Obstructive Pulmonary Disease (COPD) often leads to acute exacerbations requiring hospitalization. While artificial intelligence (AI) has been increasingly used to improve COPD management, predicting whether the length of hospital stay (LOHS) will exceed clinically relevant thresholds remains insufficiently explored. Methods: This study presents a novel clinical decision support system to predict whether LOHS following an acute exacerbation will surpass specific cutoffs (6 or 10 days). The approach involves two stages: (1) clinical, demographic, and social variables are encoded into structured signals and transformed into spectrogram-like images via a pipeline based on sinusoidal encoding and Mel-frequency cepstral coefficients (MFCCs); and (2) these images are fed into a Convolutional Neural Network (CNN) to estimate the probability of extended hospitalization. Feature selection with XGBoost reduced dimensionality to 16 variables. The model was trained and tested on a dataset of over 500 patients. Results: On the test set, the model achieved an AUC of 0.77 for predicting stays longer than 6 days and 0.75 for stays over 10 days. Sensitivity and specificity were 0.79/0.72 and 0.74/0.80, respectively. Conclusions: This system leverages image-based data formalization to predict LOHS in COPD patients, facilitating early risk stratification and more informed clinical planning. Results are promising, but external validation with larger and more diverse datasets remains essential.

1. Introduction

Chronic Obstructive Pulmonary Disease (COPD) is a progressive respiratory condition characterized by persistent symptoms such as cough, dyspnea, and sputum production. These manifestations arise from structural abnormalities in the airways and alveoli, resulting in chronic airflow obstruction [1]. Globally, COPD remains one of the leading causes of mortality, with its prevalence expected to rise in the coming years due to an aging population and ongoing exposure to major risk factors, including smoking, air pollution, and occupational hazards [2]. A critical aspect of COPD’s clinical course is acute exacerbation of COPD (AECOPD), defined as a sudden worsening of respiratory symptoms, most notably increased dyspnea, cough, and sputum volume or purulence. These exacerbations are often triggered by respiratory infections and are associated with accelerated decline in lung function, increased healthcare usage, and, in severe cases, hospital admissions or intensive care support [3].
The implications of AECOPD extend far beyond its immediate clinical effects. In addition to accelerating disease progression, exacerbations substantially reduce patients’ quality of life and place a significant economic burden on healthcare systems. Therefore, effective management of AECOPD is essential not only for relieving acute symptoms but also for preventing long-term health deterioration and controlling healthcare costs. This highlights the importance of early intervention strategies and comprehensive clinical guidelines aimed at reducing the frequency and severity of exacerbations, improving patient outcomes, and decreasing hospital readmissions.
The length of hospital stay (LOHS) for COPD patients is influenced by a complex interplay of clinical, sociodemographic, and healthcare-related factors [4,5,6]. Among these, comorbidities present a significant challenge, particularly in elderly populations where multi-organ involvement and frailty can complicate recovery [7]. In a study conducted by Ko et al. [8], eosinophil counts were identified as critical predictors of LOHS. Specifically, a lower eosinophil count below 2% of the total leukocyte count and an absolute eosinophil count of 0.144 × 10⁹/L were significantly associated with prolonged hospitalizations. Notably, this association remained significant even after adjusting for traditional risk factors such as age, gender, and baseline lung function, suggesting that eosinophil levels may serve as potential biomarkers for risk stratification in COPD-related admissions. Further supporting these findings, a retrospective cross-sectional study by Pokharel et al. [9] reported that a higher number of comorbidities, elevated eosinophil counts, and the use of mechanical ventilation were all associated with extended LOHS in COPD patients. Collectively, these findings underscore the importance of early identification of high-risk patients to guide personalized treatment strategies, improve clinical outcomes, and reduce hospitalization durations.
Classical statistical models have long been used to assess the determinants of LOHS in COPD patients. A prospective cohort study by Fernandez-Garcia et al. [10] employed logistic regression to identify predictors of shorter or longer hospitalizations. Their analysis found that a COPD Assessment Test (CAT) score greater than 10 and social–family risk factors were associated with extended hospital stays, whereas unexpectedly active smoking was correlated with shorter stays. In a related study, Turgeman et al. [11] introduced a cubistic regression tree model to predict LOHS in patients with congestive heart failure, which included COPD as a comorbid condition. The model incorporated admission data, including comorbidities, and demonstrated superior predictive accuracy compared to traditional regression models and other machine learning algorithms. This underscores the potential of non-linear modeling techniques, such as Cubist models, in capturing complex variable interactions that conventional methods may fail to detect. Further emphasizing the need for robust predictive models, Lüthi-Corridori et al. [12] conducted a retrospective cohort study using multivariable zero-truncated negative binomial regression and logistic regression to evaluate risk factors for LOHS, mortality, and rehospitalization. Their findings indicated that oxygen supplementation at admission was a strong predictor of prolonged hospital stay, extending it by approximately two days. Notably, conventional demographic and clinical variables such as age, sex, comorbidities, and laboratory values did not emerge as significant predictors, highlighting the limitation of traditional metrics and the need for more advanced predictive approaches.
In recent years, artificial intelligence (AI), particularly machine learning (ML) techniques, has emerged as a powerful alternative to traditional statistical models in the healthcare sector [13,14,15,16,17,18,19,20,21,22,23]. These approaches have also been used for predicting LOHS in COPD patients, offering the ability to capture complex, non-linear patterns often overlooked by traditional models. For instance, Dogu et al. [24] proposed an integrated framework combining Statistical-Based Fuzzy Cognitive Maps (SBFCMs) and Artificial Neural Networks (ANNs) to enhance predictive performance. Two models were developed: the first incorporated statistically significant variables, while the second integrated expert-driven insights via the SBFCM method. The latter outperformed the former, achieving an accuracy of 79.95% compared to 72.86%. It also demonstrated notable improvements in Mean Absolute Percentage Error (MAPE) (20.05% vs. 27.14%) and Root Mean Square Error (RMSE) (3.13 vs. 3.50 days). These results highlight the advantages of combining expert knowledge with data-driven modeling to improve prediction accuracy in clinical settings. Similarly, Zolbanin et al. [25] used a Multi-Layer Perceptron (MLP) neural network to predict LOHS in patients with COPD and pneumonia. Their study analyzed an extensive dataset comprising 73,901 COPD patients across 182 hospitals and 53,476 pneumonia patients across 202 hospitals. The model yielded an average LOHS of 5.15 days for COPD patients and achieved 86% accuracy within ±2 days and 91% within ±3 days, with a coefficient of determination (R2) of 0.61. These findings underscore the capability of neural network models to capture complex, non-linear interactions within large datasets, facilitating improved clinical decision support.
The development of specific predictive tools that identify patients requiring extended or shortened LOHS could enable the design of strategies aimed at optimizing patient management. In this work, we address this challenge by transforming complex and heterogeneous patient data—traditionally stored in tabular format—into image-like representations. This approach aligns with a growing trend in artificial intelligence research that explores alternative data formulations beyond conventional tables. By encoding clinical variables into spectrogram-like images, the system enables the use of Convolutional Neural Networks (CNNs), which are naturally suited for visual data processing. Although a feature selection step is included to enhance clinical applicability and reduce dimensionality, CNNs were chosen for their ability to extract spatial and hierarchical patterns from these compact image structures. This allows the model to capture inter-variable dependencies and improve predictive performance, even with a reduced set of relevant features. Building on this foundation, we present the design, development, and proof of concept of a novel clinical intelligent decision support system focused on predicting short or long-term hospitalizations for COPD patients.
The main contributions of this article are the following:
  • Proposing an innovative image-based formalization of tabular clinical and social data, enabling the use of Convolutional Neural Networks for hospital stay prediction.
  • Introducing a conceptual architecture for a novel intelligent decision support system aimed at predicting short- or long-term hospital stays.
  • Selecting a reduced subset of relevant variables from a large dataset, enhancing the prediction of hospitalization duration.
  • Implementing the system into a user-friendly interface and exemplifying its applicability through a practical case study.
The structure of this work is divided into five sections. Section 1 defines the framework of the proposed system. Section 2 is further divided into Section 2.1, which describes the database used, Section 2.2, which presents the conceptual design, and Section 2.3, which details the system’s implementation through a software artifact and model performance. Section 3 exemplifies system functionality through a proof-of-concept case study, and Section 4 provides a comprehensive discussion. Finally, Section 5 presents the conclusions of the study.

2. Materials and Methods

2.1. Database

To define this system, we utilized a database comprising a total of 593 patients from two combined cohorts derived from previous studies conducted by the research team [26]. Both cohorts included patients admitted with AECOPD to the Pulmonology departments of Álvaro Cunqueiro Hospital in Vigo and Lucus Augusti Hospital in Lugo—two major public hospitals located in northwest Spain, collectively serving a population of approximately 600,000 inhabitants.
The study was approved by the Ethics and Research Committee of Galicia (code 2016/524), and all patients were prospectively and consecutively recruited in accordance with ethical guidelines.
Data collection was carried out by clinical staff and a social worker, who systematically gathered patient information through medical record reviews and structured interviews with both patients and their caregivers, ensuring data consistency and reliability as described in prior studies [26]. Beyond clinical and social history data, information related to the LOHS, readmissions, and mortality at one and two years was collected.
For this study, we defined the LOHS as the target variable. A median term of six days was selected as the primary threshold to predict bed occupancy and availability. This cutoff not only facilitates hospital resource planning but also provides clinicians with an indirect framework to evaluate the necessity for invasive or conservative treatments. Additionally, a secondary threshold of ten days was established to reflect severe cases requiring prolonged hospitalization, thereby informing decisions related to resource allocation and intensive care management.
The database includes a comprehensive set of variables from clinical, demographic, and social domains, which are summarized in Table 1. This table outlines the name, type (continuous or categorical), and a brief description of each variable. Categorical variables, represented in a binary format, were encoded as 0 or 1. For example, the variable “Drug abuse” was coded as 0 for the absence of drug abuse and 1 for the presence of drug abuse.
As previously described, the number of hospitalization days was established as the target variable, with two defined thresholds (6 and 10 days) for stratifying patients. This dual-threshold approach enables effective identification of standard and prolonged hospitalizations, enhancing the model’s capacity to predict resource demands and clinical complexity.
After data preprocessing and quality control, the final dataset comprised 544 patients out of the original 593, following the exclusion of incomplete or inconsistent records. A portion of the dataset, specifically 80%, was allocated for model training, 10% was allocated for model validation, while the remaining data (10%) constituted the test set, reserved exclusively for evaluating the model’s generalization performance and predictive robustness.

2.2. Conceptual Design

Figure 1 illustrates the architecture of the intelligent decision support system (IDSS) proposed in this study. It consists of three stages, which are described below: the initial collection of patient information, data processing, and finally, decision-making based on the results provided by the system. The system is designed as a binary classifier, operating independently for each predefined threshold (6 and 10 days). This effectively differentiates between patients requiring extended hospitalization and those expected to have shorter stays. The threshold values used to distinguish hospitalization duration are initially set based on clinical observations (6 and 10 days); however, the system is flexible, allowing physicians to adjust this threshold according to clinical judgment or emerging medical evidence.

2.2.1. Stage 1: Patient’s Information Compilation

The first stage of the intelligent system refers to the process for compiling the patient’s information, which has already been commented on and introduced in Section 2.1. However, not all variables described will be used, but rather a subset of these, as will be discussed later. This includes Body Mass Index (BMI), Forced Expiratory Volume in 1 s (FEV1), age, CAT score, number of basic activities of daily living with dependency (BADL), number of instrumental activities of daily living with dependency (IADL), dyspnea mMRC, Arterial Hypertension, continuous home oxygen therapy, Income (EUR > 800), type of residency, hospitalized in the previous year, cardiopathy, Pneumococcal vaccination, and number of hospitalizations in the previous year.

2.2.2. Stage 2: Data Processing

Once the patient’s information is collected and structured, it is processed by the intelligent system. Below is a description of the different blocks that make up the system:
  • Feature selection and preprocessing: First, the variables are preprocessed by rescaling the numerical variables using the Min-Max Scaler, transforming their values into a [0–1] range. Categorical variables are encoded as binary values; for example, diabetes is represented as 1 for ‘Yes’ and 0 for ‘No’. After preprocessing, a feature selection process is carried out to determine the optimal subset of variables that enables an accurate estimation of the average hospital stay and facilitates its future application in clinical practice. To achieve this, the XGBoost algorithm is employed, allowing the identification of the most relevant features in the database by leveraging feature rankings derived from fast and scalable tree-boosting models [27]. Although other feature selection techniques could be applied, such as filter-based methods (e.g., Chi-square, ANOVA) or wrapper-based approaches (e.g., Recursive Feature Elimination) [28], XGBoost was chosen due to its ability to efficiently perform feature selection during the model’s training phase. This embedded characteristic optimally balances computational cost and predictive accuracy, making it particularly suitable for large datasets and complex clinical variables.
  • Data transformation: After preprocessing and feature selection, the dataset—initially in tabular format and containing the selected and rescaled variables—is subjected to a new formalization process by transforming it into an image representation. This transformation allows for a more compact representation of patient data, optimizing its structure for processing. Furthermore, this image-based formalization enables the application of more complex inference models and advanced architectures, which are highly effective in capturing intricate patterns and dependencies within multidimensional data. The image generation process is performed in two phases: first, the tabular data is converted into a sinusoidal sound wave. Next, once the sound wave is generated, the Mel-frequency cepstral coefficients (MFCCs) are extracted, which are then used to create the final image representation.
  • Inference: Once the image has been determined, it is processed by the system using a Convolutional Neural Network. The dataset used to train the CNN was previously introduced in Section 2.1. However, prior to this step, the construction of the image associated with each patient is performed. Based on these images and their corresponding labels, the CNN is trained to operate as a binary classifier for each predefined threshold. In this study, two specific thresholds were established for calculating the LOHS: 6 and 10 days. Nevertheless, these cut-off values are flexible and can be adjusted according to medical team recommendations. At the output of the CNN, a score is generated for each case, referred to as the Risk of Extended Stay (RES), providing a probability estimate for exceeding each threshold.

2.2.3. Stage 3: Alert Generation and Decision Making

By representing the patients’ data encoded as images, it is possible to process them using a CNN, obtaining a risk value as its output. In this final stage, the interpretation of the obtained risk values is performed, allowing the determination of the final label associated with the patient under study. Based on this information, the medical team can make informed decisions regarding the patient’s care and management.
In this context, three possible scenarios are considered:
  • Fewer than 6 days of hospital stay;
  • Between 6 and 10 days of hospital stay;
  • More than 10 days of hospital stay.

2.3. System Implementation

Once the architecture of the intelligent decision support system is introduced and defined, this section details its implementation through a software artifact.
The system was implemented using the Python programming language, version 3.9.15, specifically RAPIDS 22.10 for accelerated data processing [29]. For model training, the TensorFlow library, version 2.9.1, was employed [30], while wavio was used for sound generation and librosa for extracting Mel-frequency cepstral coefficient (MFCC) features [31]. Additionally, the graphical interface was developed using the Tkinter library, version 8.6, also in Python.
The equipment used for training the models consists of an AMD Ryzen 7 4800H CPU running at 2.90 GHz, an NVIDIA GeForce RTX 2060 Laptop GPU, and 32 GB of RAM.
A screenshot of the main screen of the developed software artifact is shown in Figure 2. As illustrated, the interface is structured into three main areas:
  • Stage 1—Data Collection Panel—where patient information is gathered;
  • Stage 2—Data Processing Panel—where the collected data is transformed into images and the RES (Risk of Extended Stay) is computed for each threshold;
  • Stage 3—Alert Generation and Decision-Making Panel—where risk alerts are generated and appropriate decisions can be made.
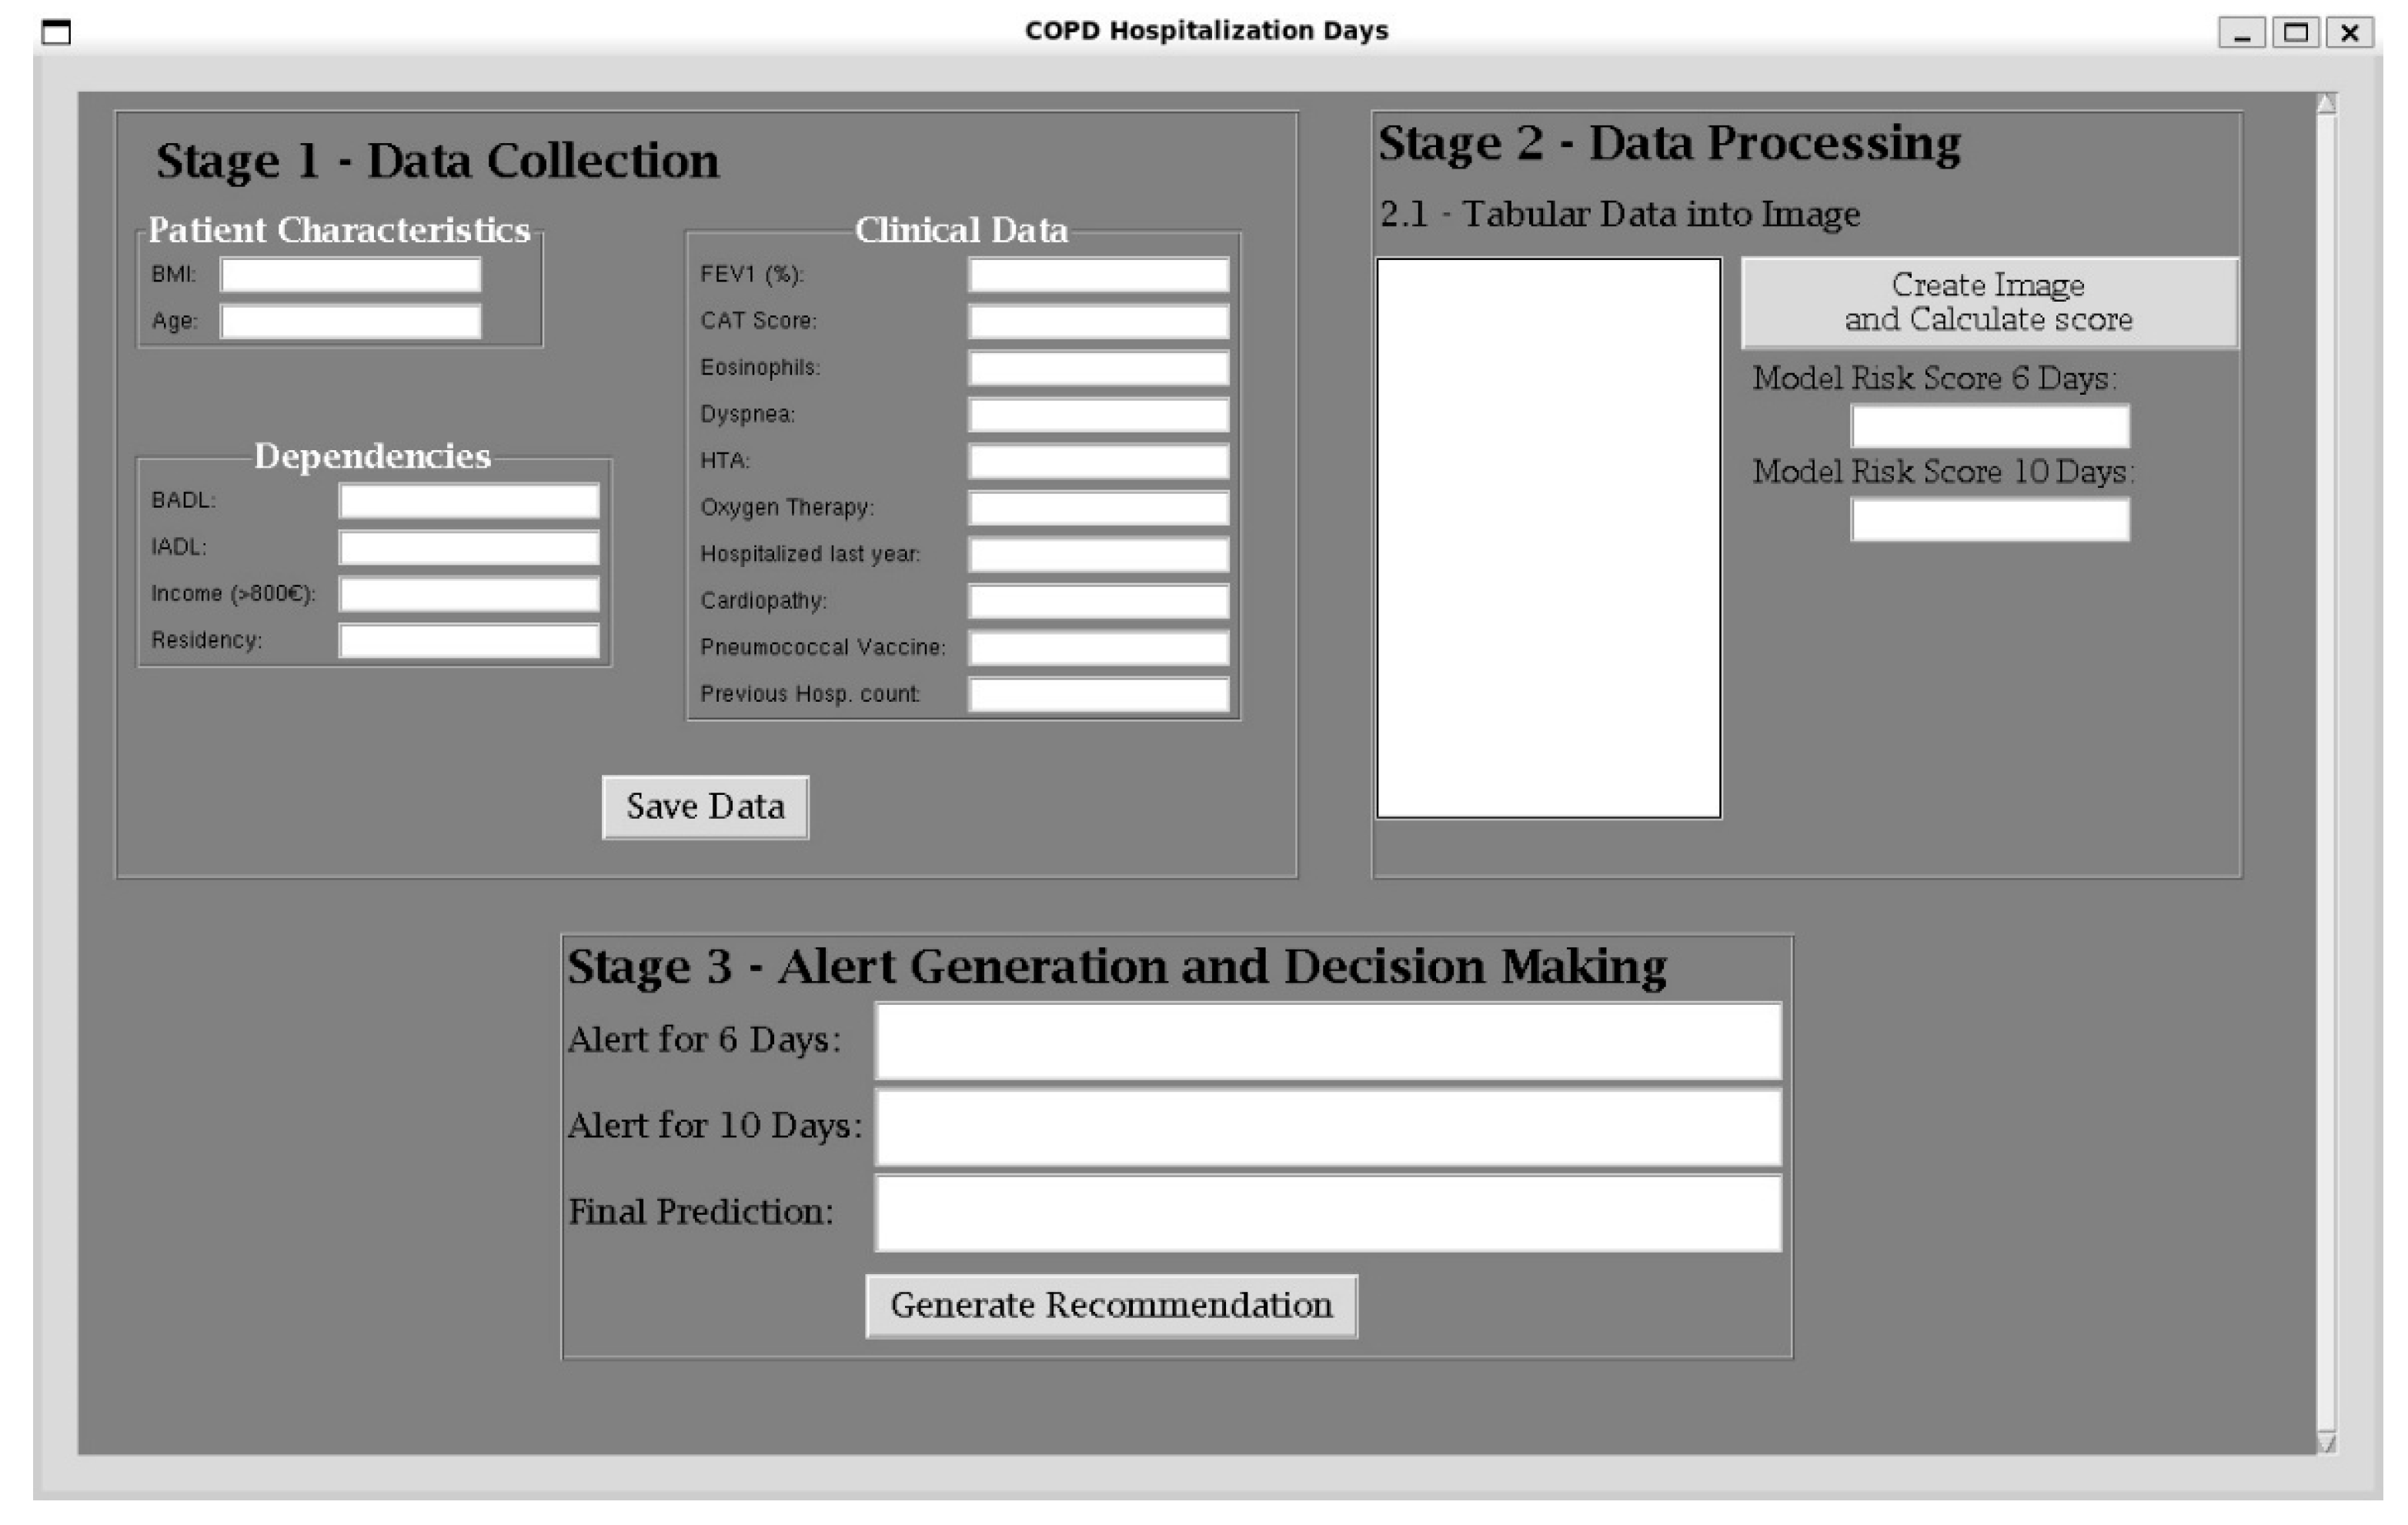
Figure 2. Screenshot of the main interface of the tool. The interface presents three main panels: Panel (1) is related to the collection of patient data; Panel (2) has two sub-panels—Panel (2.1), related to the transformation of the tabulated data into an image, and Panel (2.2), related to the calculation of the risk score of days of hospitalization. Panel 3 shows the interpretation of the results obtained in the previous panel and provides a recommendation regarding the condition of the patient.
Asi 08 00128 g002

2.3.1. Data Collection

The patient’s data are loaded into the application through the form shown in Figure 2, specifically within the Stage 1—Data Collection panel. It is crucial that the user verifies the information carefully to ensure there are no omissions or potential errors, as these could reduce the system’s accuracy and increase the existing level of uncertainty.

2.3.2. Data Processing

Once the data is entered into the system, it is processed by the intelligent system, as illustrated in Figure 2, within the Stage 2—Data Processing panel. Initially, the patient’s data, structured in a tabular format, is transformed into an image. This transformation is performed in the Tabular Data to Image (2.1) panel of Figure 2. Subsequently, the resulting image is processed by a Convolutional Neural Network (CNN), which generates the risk score for the interval previously defined by the physician. This step is carried out in the Convolutional Neural Network (2.2) panel of Figure 2.
Image Construction
The process of image construction consists of three main stages, executed sequentially as illustrated in Figure 3. The structured design of these stages allows for a systematic transformation of patient data into a format suitable for CNN:
  • Stage 1—Sinusoidal Wave Generation: The preprocessed data, already normalized to the [0, 1] interval, is structured into pairs of variables (e.g., BMI, FEV1 (%)). For each pair, a sinusoidal wave is generated, where one variable defines the amplitude (A) and the other controls the frequency (f). This is mathematically represented as shown in Equation (1), where t is the time vector, generated using the line-space function from NumPy [32]. We defined t as follows: creating a sample rate/f samples between 0 and the period (p) of the wave. The wave is sampled at 440 Hz to maintain consistency across all variables. This step transforms each pair of numerical patient data into structured waveform signals. Once all sinusoidal waves are created, they are merged into a single continuous signal per patient, appending each wave in sequence. To standardize input lengths across the dataset, the audio sample with the longest duration was first identified. All remaining samples were then zero-padded at the end with silence to match this maximum duration, ensuring uniform temporal dimensions for subsequent processing.
    y = A   s i n   ( 2 p f t )
  • Stage 2—MFCC Extraction and Image Generation: Once the combined signal for each patient is generated, it is treated as a sound representation. A custom function was implemented to extract and plot the Mel-frequency cepstral coefficients (MFCCs). For each input audio file, the signal was loaded using the librosa library [31] with the default sampling rate. The choice of MFCCs is motivated by their ability to capture both temporal and spectral characteristics of audio signals, making them highly effective for feature extraction. A total of 40 MFCC coefficients are selected, encapsulating the main features of the sinusoidal wave. Each MFCC matrix was visualized as a spectrogram with a reversed grayscale colormap to enhance contrast. For a cleaner image output, the axes figures were removed, and each plot was saved as a PNG file.
  • Stage 3—Image Structuring and Final Preparation: To enhance the perceptual contrast of MFCC spectrogram images, a post-processing step was implemented using a custom tone curve transformation. Each image was processed using a piecewise quadratic interpolation curve defined by three control points: (0, 0), (14, 180), and (255, 255). This transformation significantly increases the brightness of darker regions while preserving highlights, thereby improving the visibility of low-intensity features that may carry relevant information for classification tasks. The transformation was implemented by generating a lookup table (LUT) based on the interpolated curve and applying it to all pixel values in the image, saving the processed images into transparent PNG files. To extract spatially localized features and reduce input dimensionality, a multistage image preprocessing pipeline was implemented. The first stage segmented each spectrogram image into six equal parts by dividing it into a 2 × 3 grid of tiles. This was achieved using a custom function that cropped each input image into six rectangular regions based on the specified dimensions (900 × 400 pixels total). Subsequently, each tile underwent horizontal resolution reduction through a custom local averaging function. This function processed each row of RGBA pixel data, excluding fully transparent pixels (i.e., alpha channel = 0), and grouped the remaining visible pixels into non-overlapping sets of three. The average of the red, green, blue, and alpha values for each group was computed, producing a smooth, horizontally compressed image representation that preserved essential spectral features while minimizing noise. The reduced tiles were saved in a dedicated output directory, with filenames encoding their original row and column positions to maintain spatial context. To facilitate visual inspection and provide CNN-compatible input, a final step recombined the reduced tiles into a composite grid image. This reconstruction preserved the original 2 × 3 tile arrangement, resulting in a single, spatially structured image per spectrogram. These final images were used as input for the model.
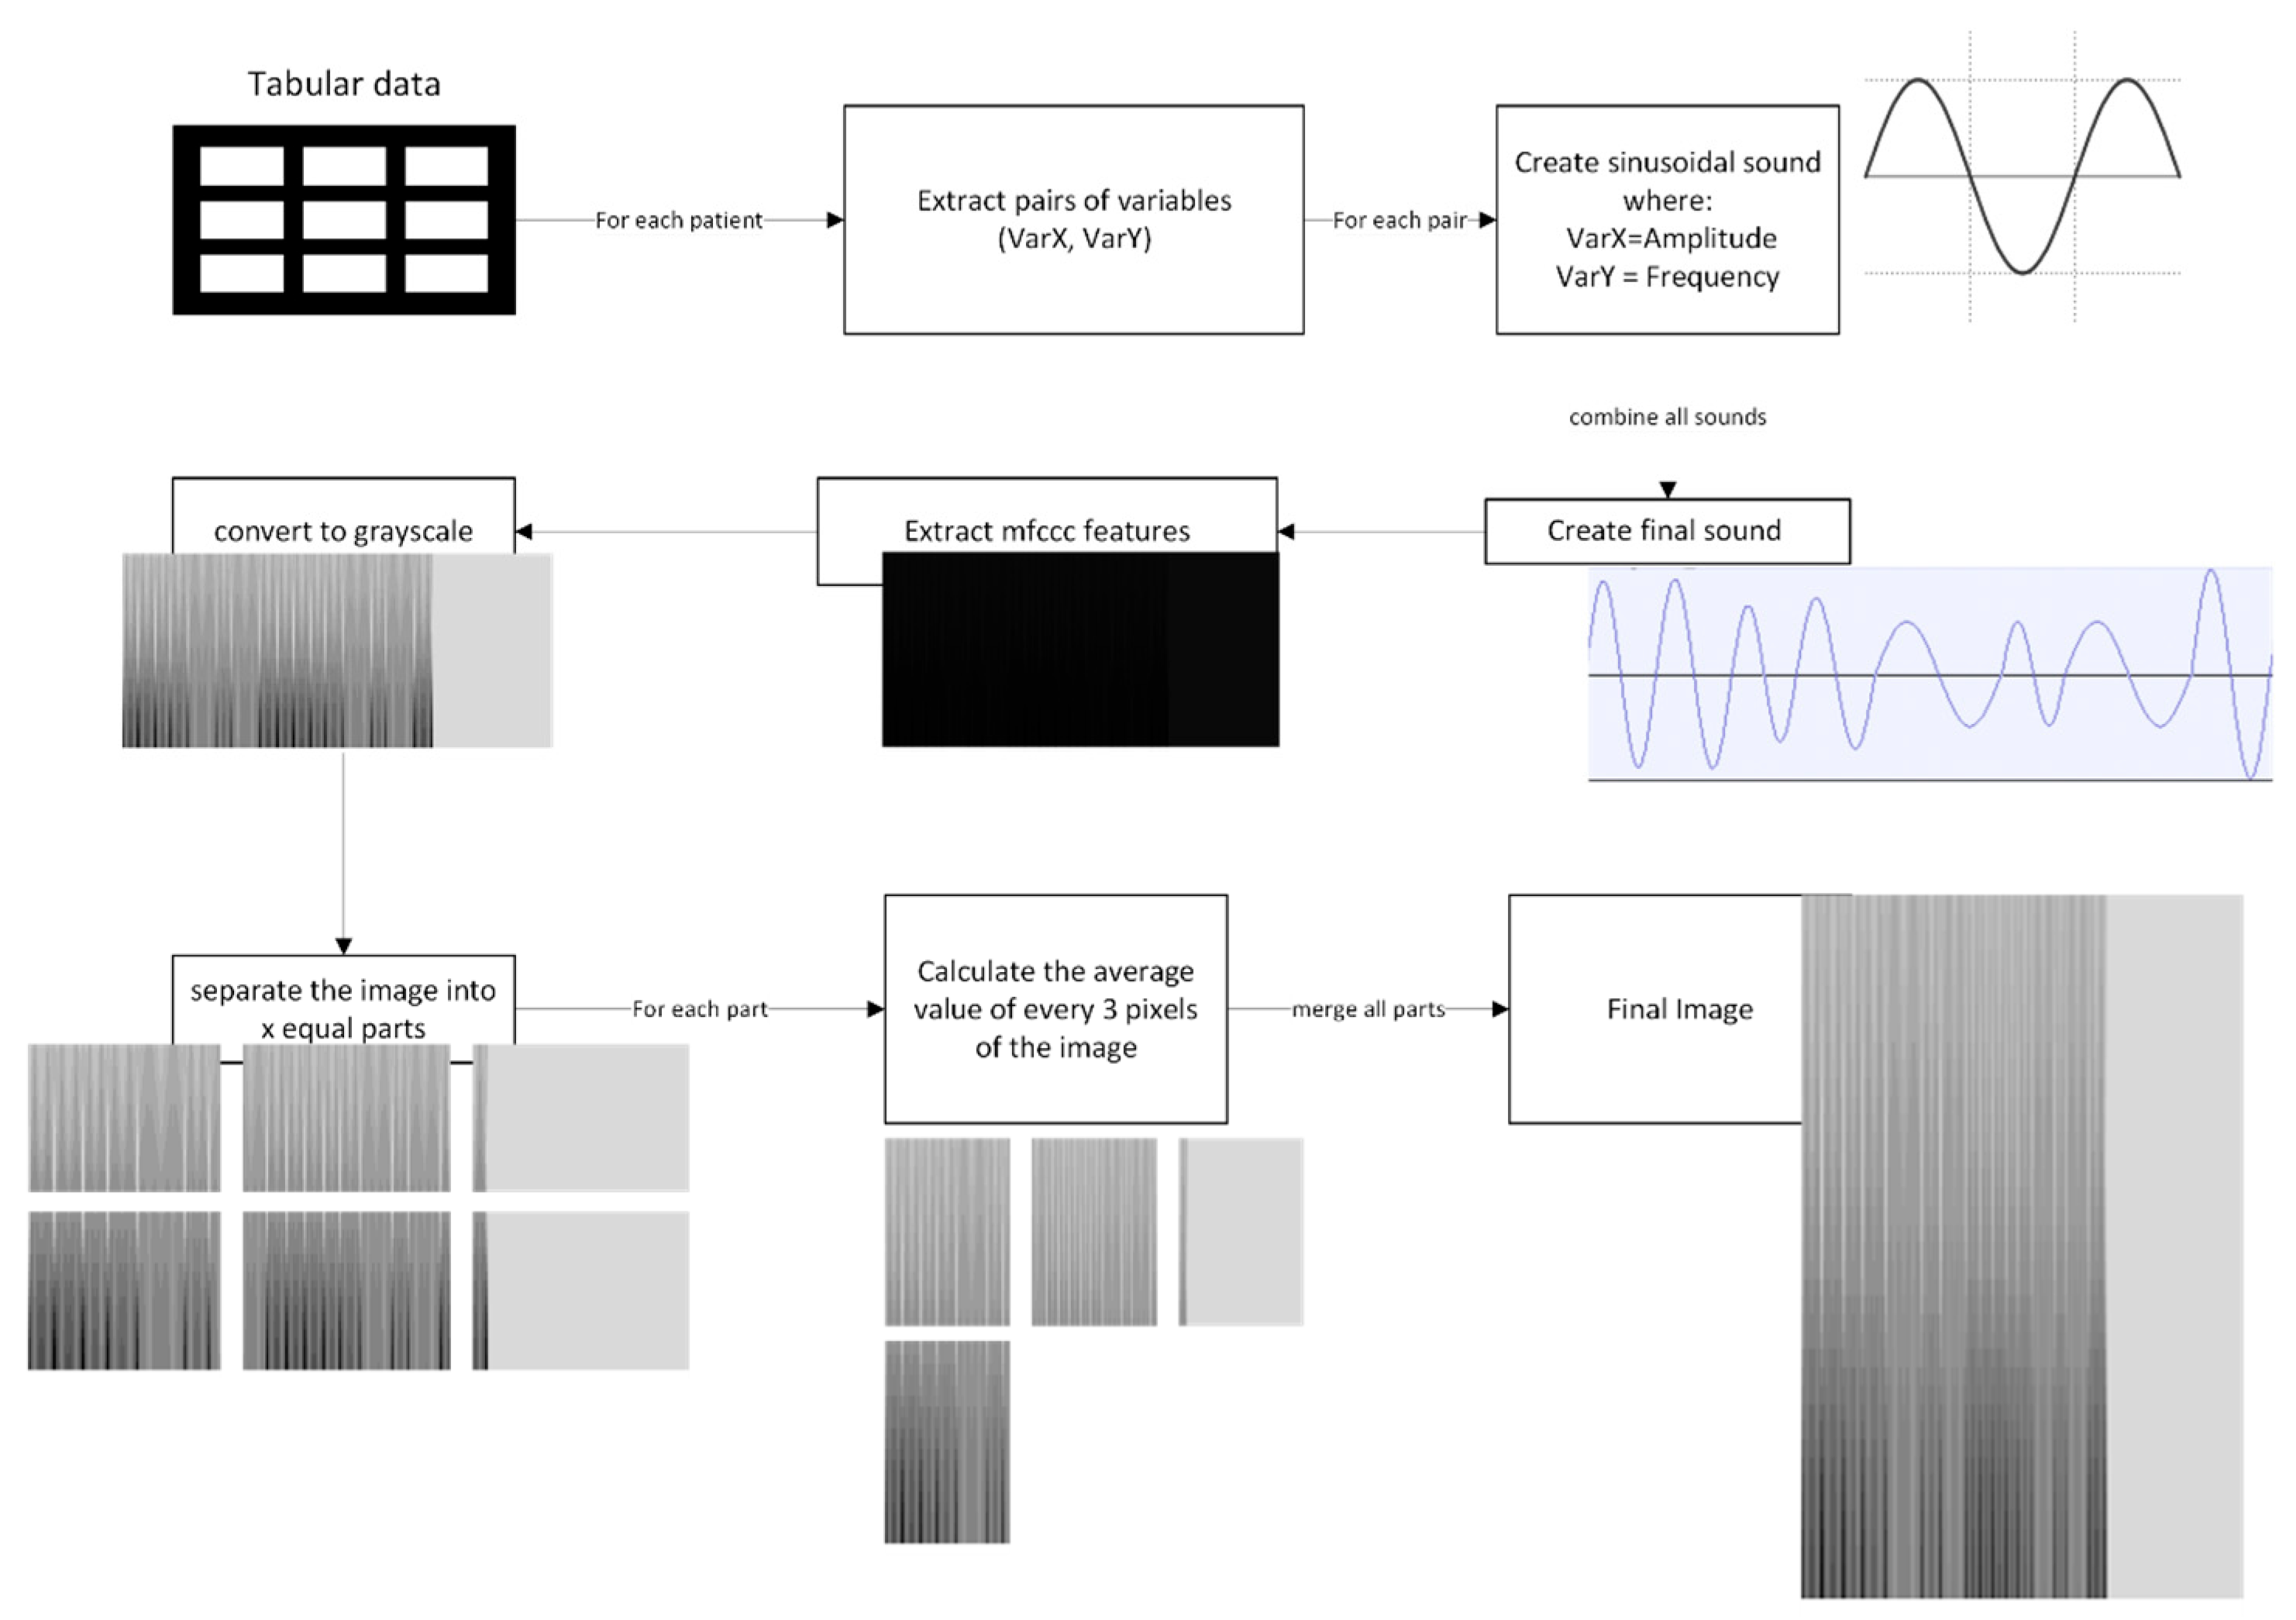
Figure 3. Construction of the image for the model.
Asi 08 00128 g003
Inference with Convolutional Neural Network
Once the image is created, it is processed by CNNs. However, previous to this, it is necessary to address its training. Two CNNs were developed using the TensorFlow library in Python [30]. Each CNN is designed to perform binary classification based on two predefined hospitalization thresholds: 6 days and 10 days. Specifically, one model classifies whether the patient is likely to require more or less than 6 days of hospitalization, while the other performs the same task for the 10-day threshold. This dual-model approach allows the system to independently evaluate different risk levels, enhancing clinical decision-making.
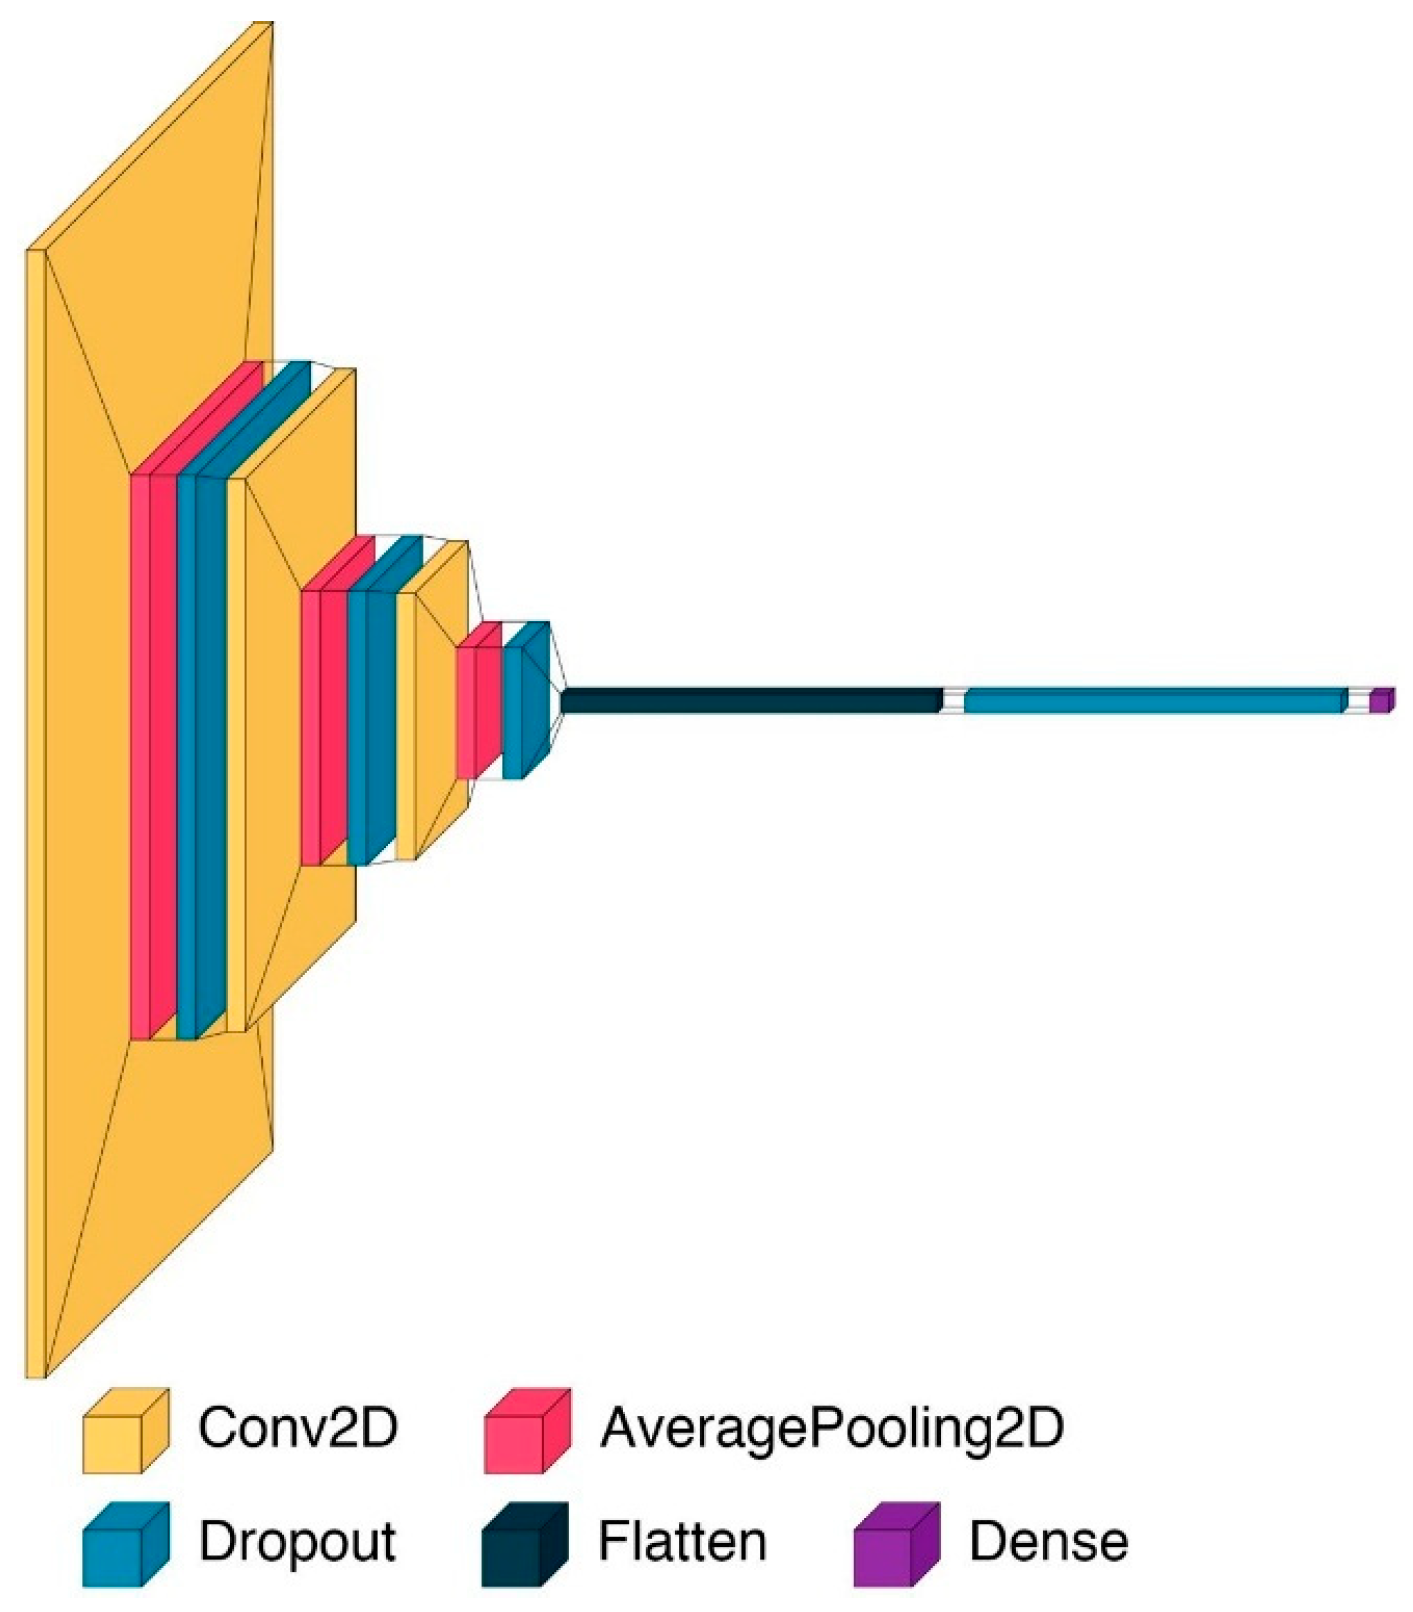
The CNN architecture consists of three hidden layers, structured as follows:
  • The model includes three convolutional layers, each followed by average pooling and dropout. All convolutional layers use the ReLU (Rectified Linear Unit) activation function to introduce non-linearity. The first convolutional layer applies 16 filters of size 5 × 5, the second uses 32 filters of size 4 × 4, and the third uses 64 filters of size 3 × 3. This progressive reduction in filter size is designed to allow initial layers to capture broad spectral features, while deeper layers extract increasingly fine-grained local patterns.
  • Each convolutional layer is followed by an AveragePooling2D layer with a 2 × 2 pooling window. Average pooling is selected over max pooling to retain smooth transitions and preserve the overall energy distribution in the data.
  • After the final convolutional block, the feature maps are flattened into a one-dimensional vector. This is followed by a fully connected layer. A dropout layer with a rate of 0.3 is applied prior to this output neuron to further mitigate overfitting by randomly deactivating features during training.
  • The output layer contains a single neuron with a sigmoid activation function. This setup is appropriate for binary classification tasks, as it outputs a probability score between 0 and 1, representing the model’s confidence in the predicted class.
  • Dropout is used throughout the architecture to improve generalization—specifically, 0.2 dropout rates follow each of the first two convolutional blocks, and a 0.3 rate precedes the final dense layer. The model is trained using the Stochastic Gradient Descent (SGD) optimizer, with a learning rate of 0.001 applied consistently across both the 6-day and 10-day thresholds and momentum set to 0.9, providing controlled and stable convergence during training. This optimization technique allows the model to converge efficiently by iteratively updating the weights in small batches.
Figure 4 presents the architecture of the proposed model, showing the convolutional layers (Conv2D, shown in yellow), average pooling layers (AveragePooling2D, shown in red), dropout layers (Dropout, shown in cyan), a flattening layer (Flatten, shown in dark blue), and a fully connected dense layer (Dense, shown in purple).
The dataset was divided into three distinct subsets to optimize the training and evaluation process: 80% for training, 10% for validation, and 10% for testing. Each subset was converted into a data generator. The training set was used for learning patterns and features from the data, while the validation set was employed during model training to fine-tune hyperparameters and prevent overfitting. The testing set, reserved exclusively for the final evaluation, enabled the assessment of the model’s generalization capability.
To address potential class imbalance in the training data, a basic oversampling strategy was implemented by duplicating existing image samples. Specifically, batches were repeatedly sampled from the training data generator, and each batch was duplicated a fixed number of times (three, in our case). This was done to increase the representation of underrepresented classes and mitigate potential model bias toward majority classes. Although this approach does not explicitly target specific minority classes, it contributes to a more balanced class distribution during training by increasing the overall dataset size and providing additional exposure to rare class instances. The augmented dataset was constructed by concatenating duplicated batches of images and their corresponding labels into a single training set.
Hospitalization Day Interval at Threshold 6 Days
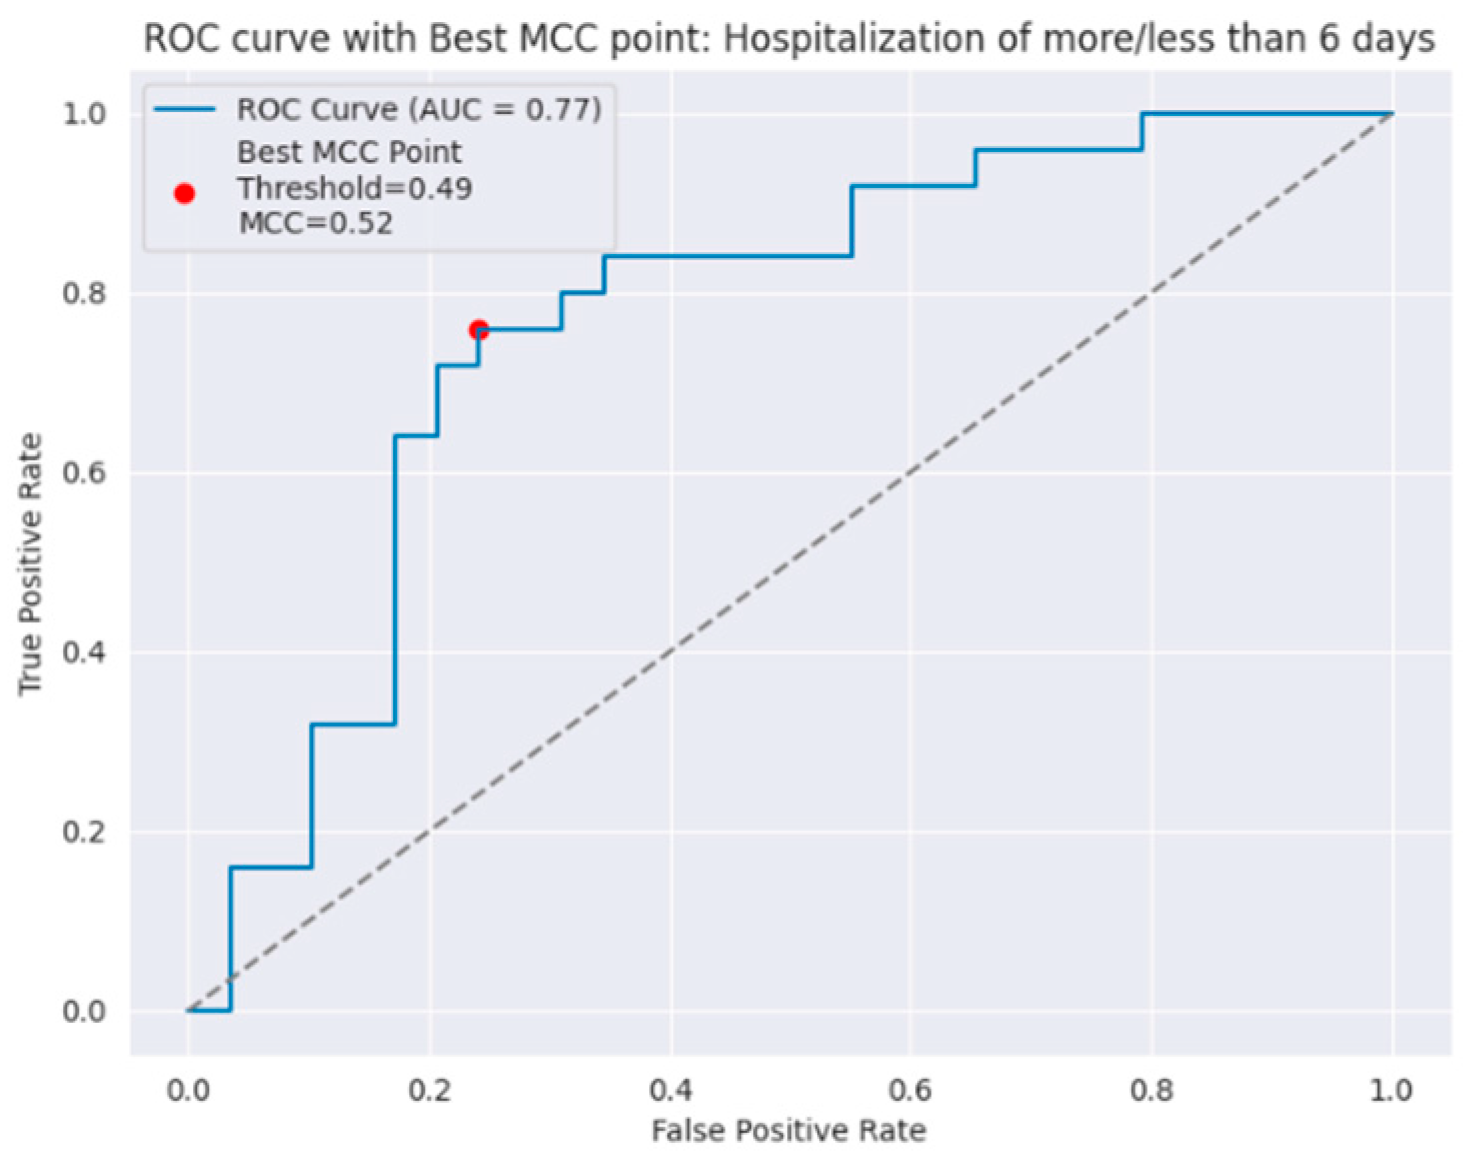
The performance of the classification model was evaluated on the test set using a Receiver Operating Characteristic (ROC) curve, as shown in Figure 5. The area under the ROC curve (AUC) was 0.77, indicating a satisfactory discriminatory performance. Using the matthews_corrcoef function from the sklearn library [33], the point on the curve (in red) corresponding to the highest Matthews Correlation Coefficient (MCC) was highlighted to identify the optimal threshold for classification. At a threshold of 0.49, the model achieved a maximum MCC of 0.52, indicating a moderated correlation between predicted and actual outcomes. The MCC is valuable in this context due to its robustness in scenarios involving class imbalance.
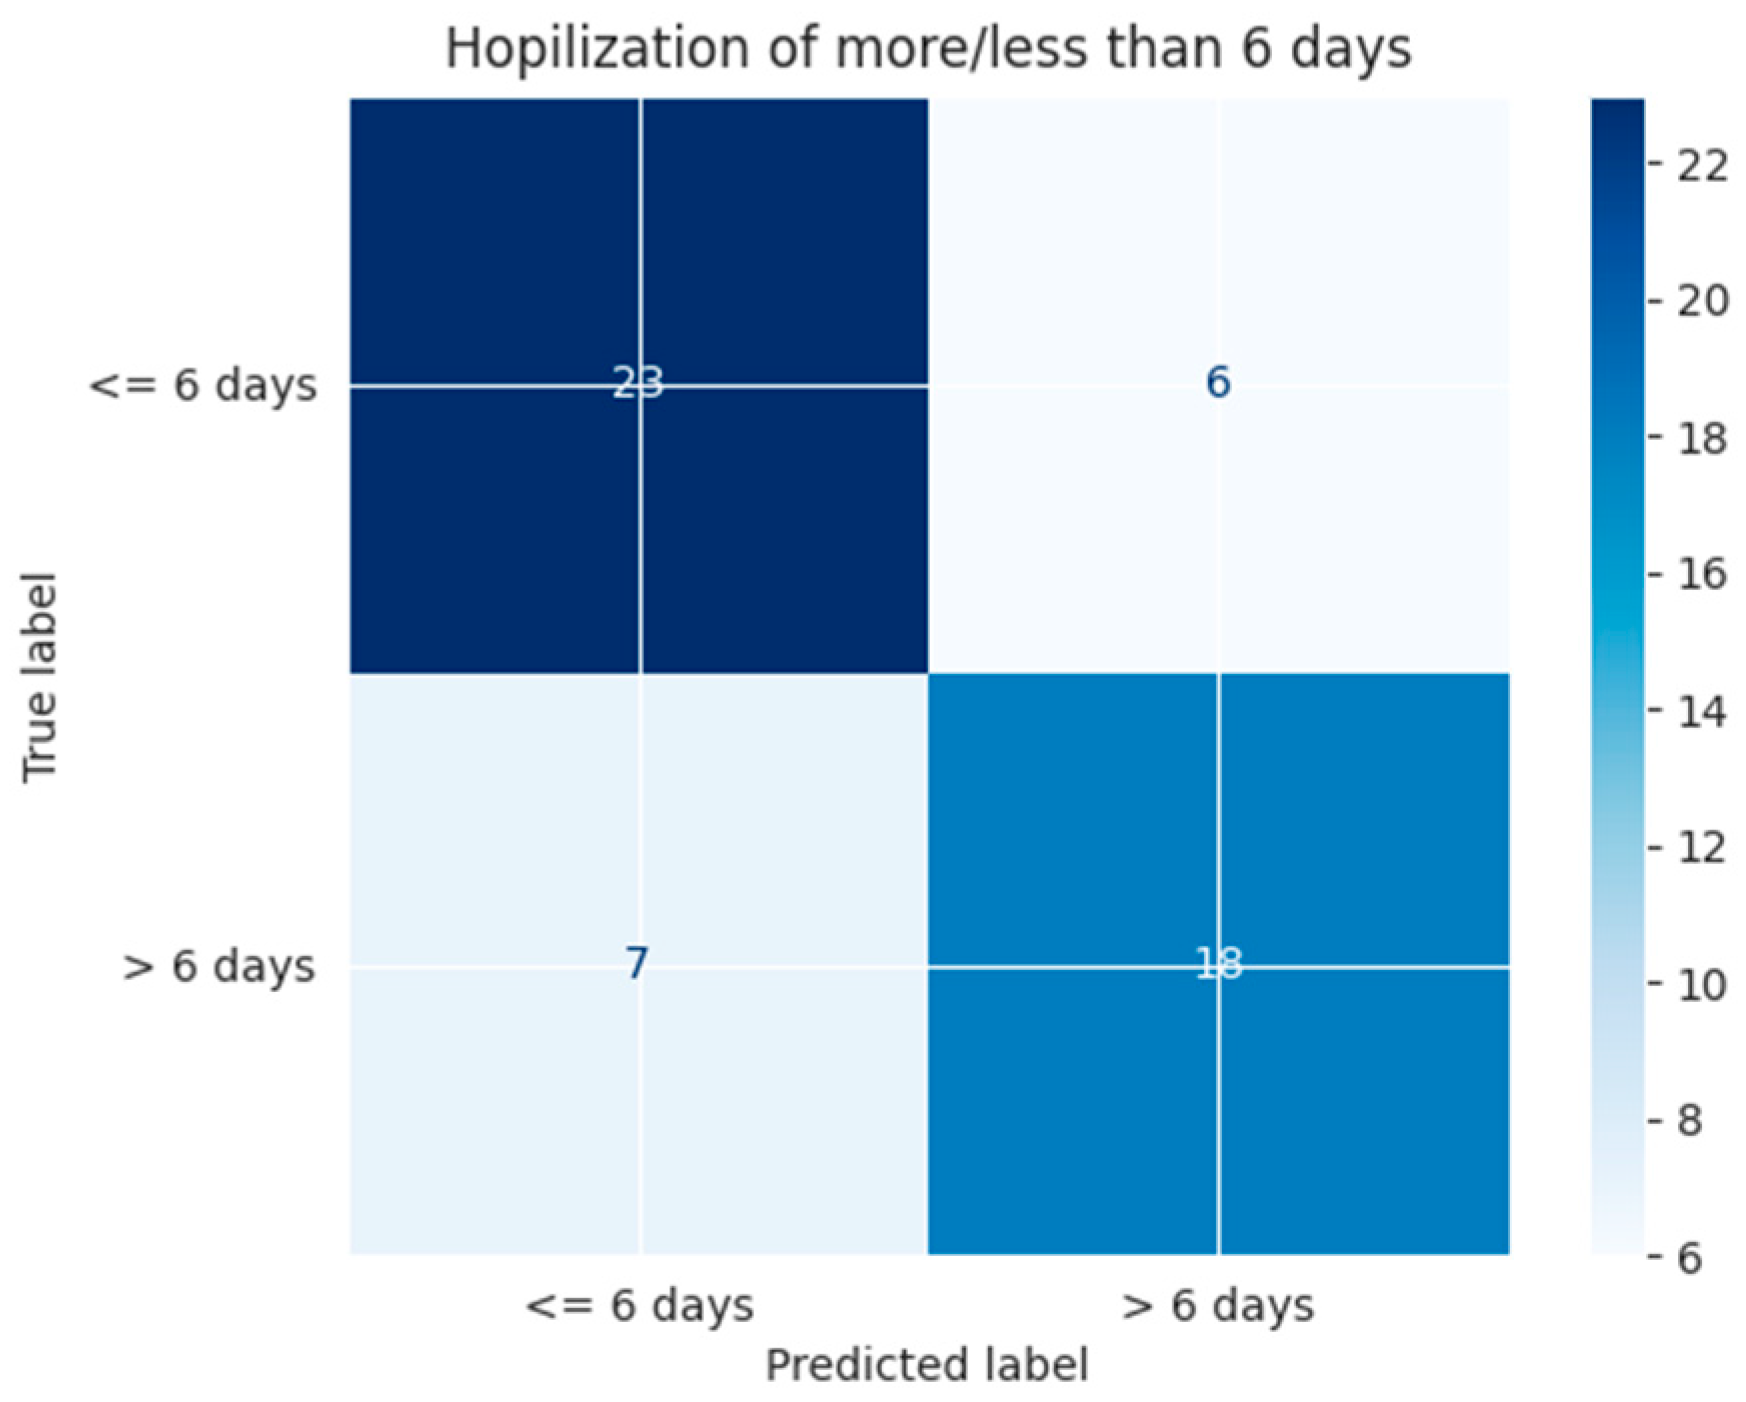
The confusion matrix in Figure 6 illustrates the performance of the model on the test set for the task of classifying patients based on hospitalization duration (≤6 days vs. >6 days). The model correctly classified 23 out of the 29 patients with hospital stays of 6 days or less and 18 out of 25 patients with stays longer than 6 days. Misclassifications occurred in 6 cases where patients with short hospitalizations were predicted as long, and 7 cases where long hospitalizations were incorrectly predicted as short. These results indicate that the model has a slightly better performance in identifying short hospital stays compared to long ones, as shown by the true positive counts along the diagonal of the matrix. The overall distribution suggests a moderate ability to distinguish between the two classes, which aligns with the ROC-AUC and MCC values previously reported.
Table 2 summarizes the evaluation metrics obtained for the model using a threshold of 6 days to distinguish between the two outcome groups. For the ≤6 days category, the model achieved a precision of 0.77, a recall of 0.79, and an F1-score of 0.78. In comparison, for the >6 days group, the precision, recall, and F1-score were slightly lower at 0.75, 0.72, and 0.73, respectively. Overall accuracy was 0.76, with sensitivity and specificity values of 0.79 and 0.72, respectively. These results indicate that the model performs slightly better in identifying outcomes that occur within the first 6 days.
Hospitalization Day Interval at Threshold 10 Days
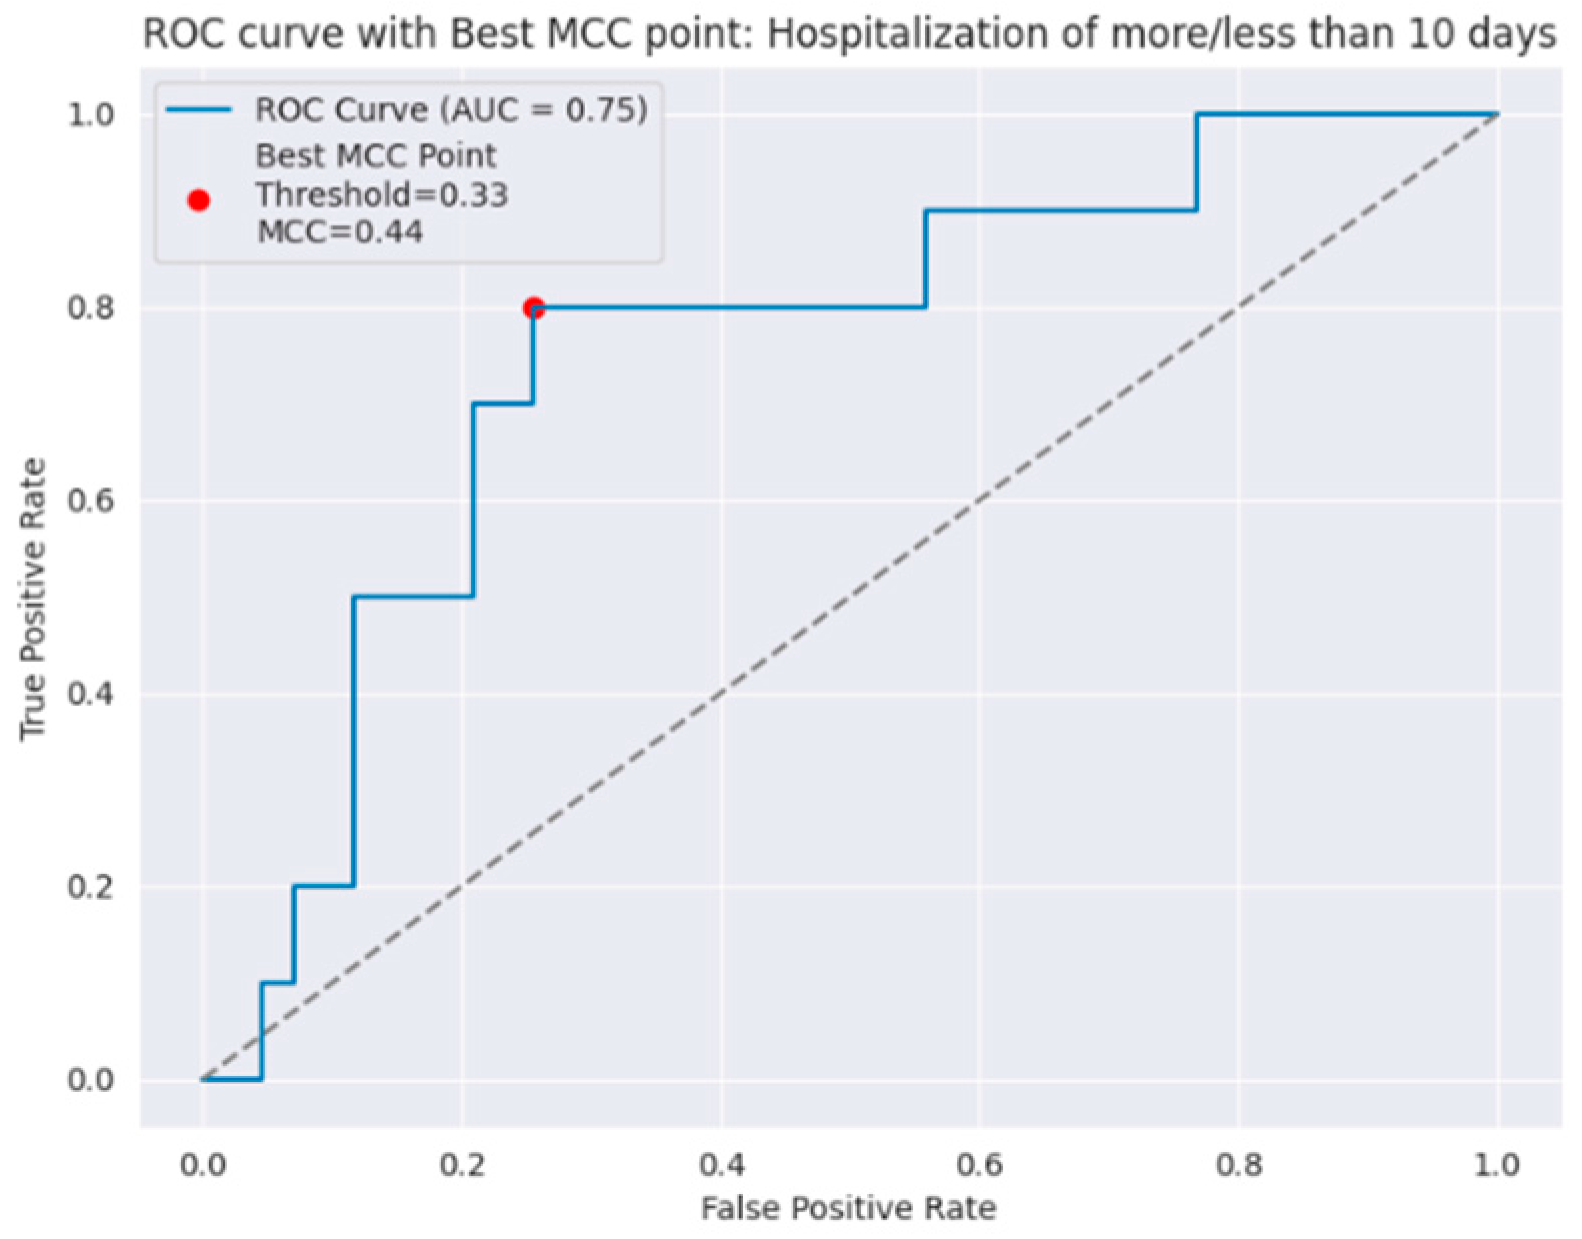
The performance of the classification model was evaluated on the test set using a ROC curve, as shown in Figure 7. The area under the ROC curve (AUC) was 0.75, indicating a satisfactory discriminatory performance. Using the matthews_corrcoef function from the sklearn library [33], the point on the curve (in red) corresponding to the highest MCC was highlighted to identify the optimal threshold for classification. At a threshold of 0.33, the model achieved a maximum MCC of 0.44, indicating a moderate correlation between predicted and actual outcomes.
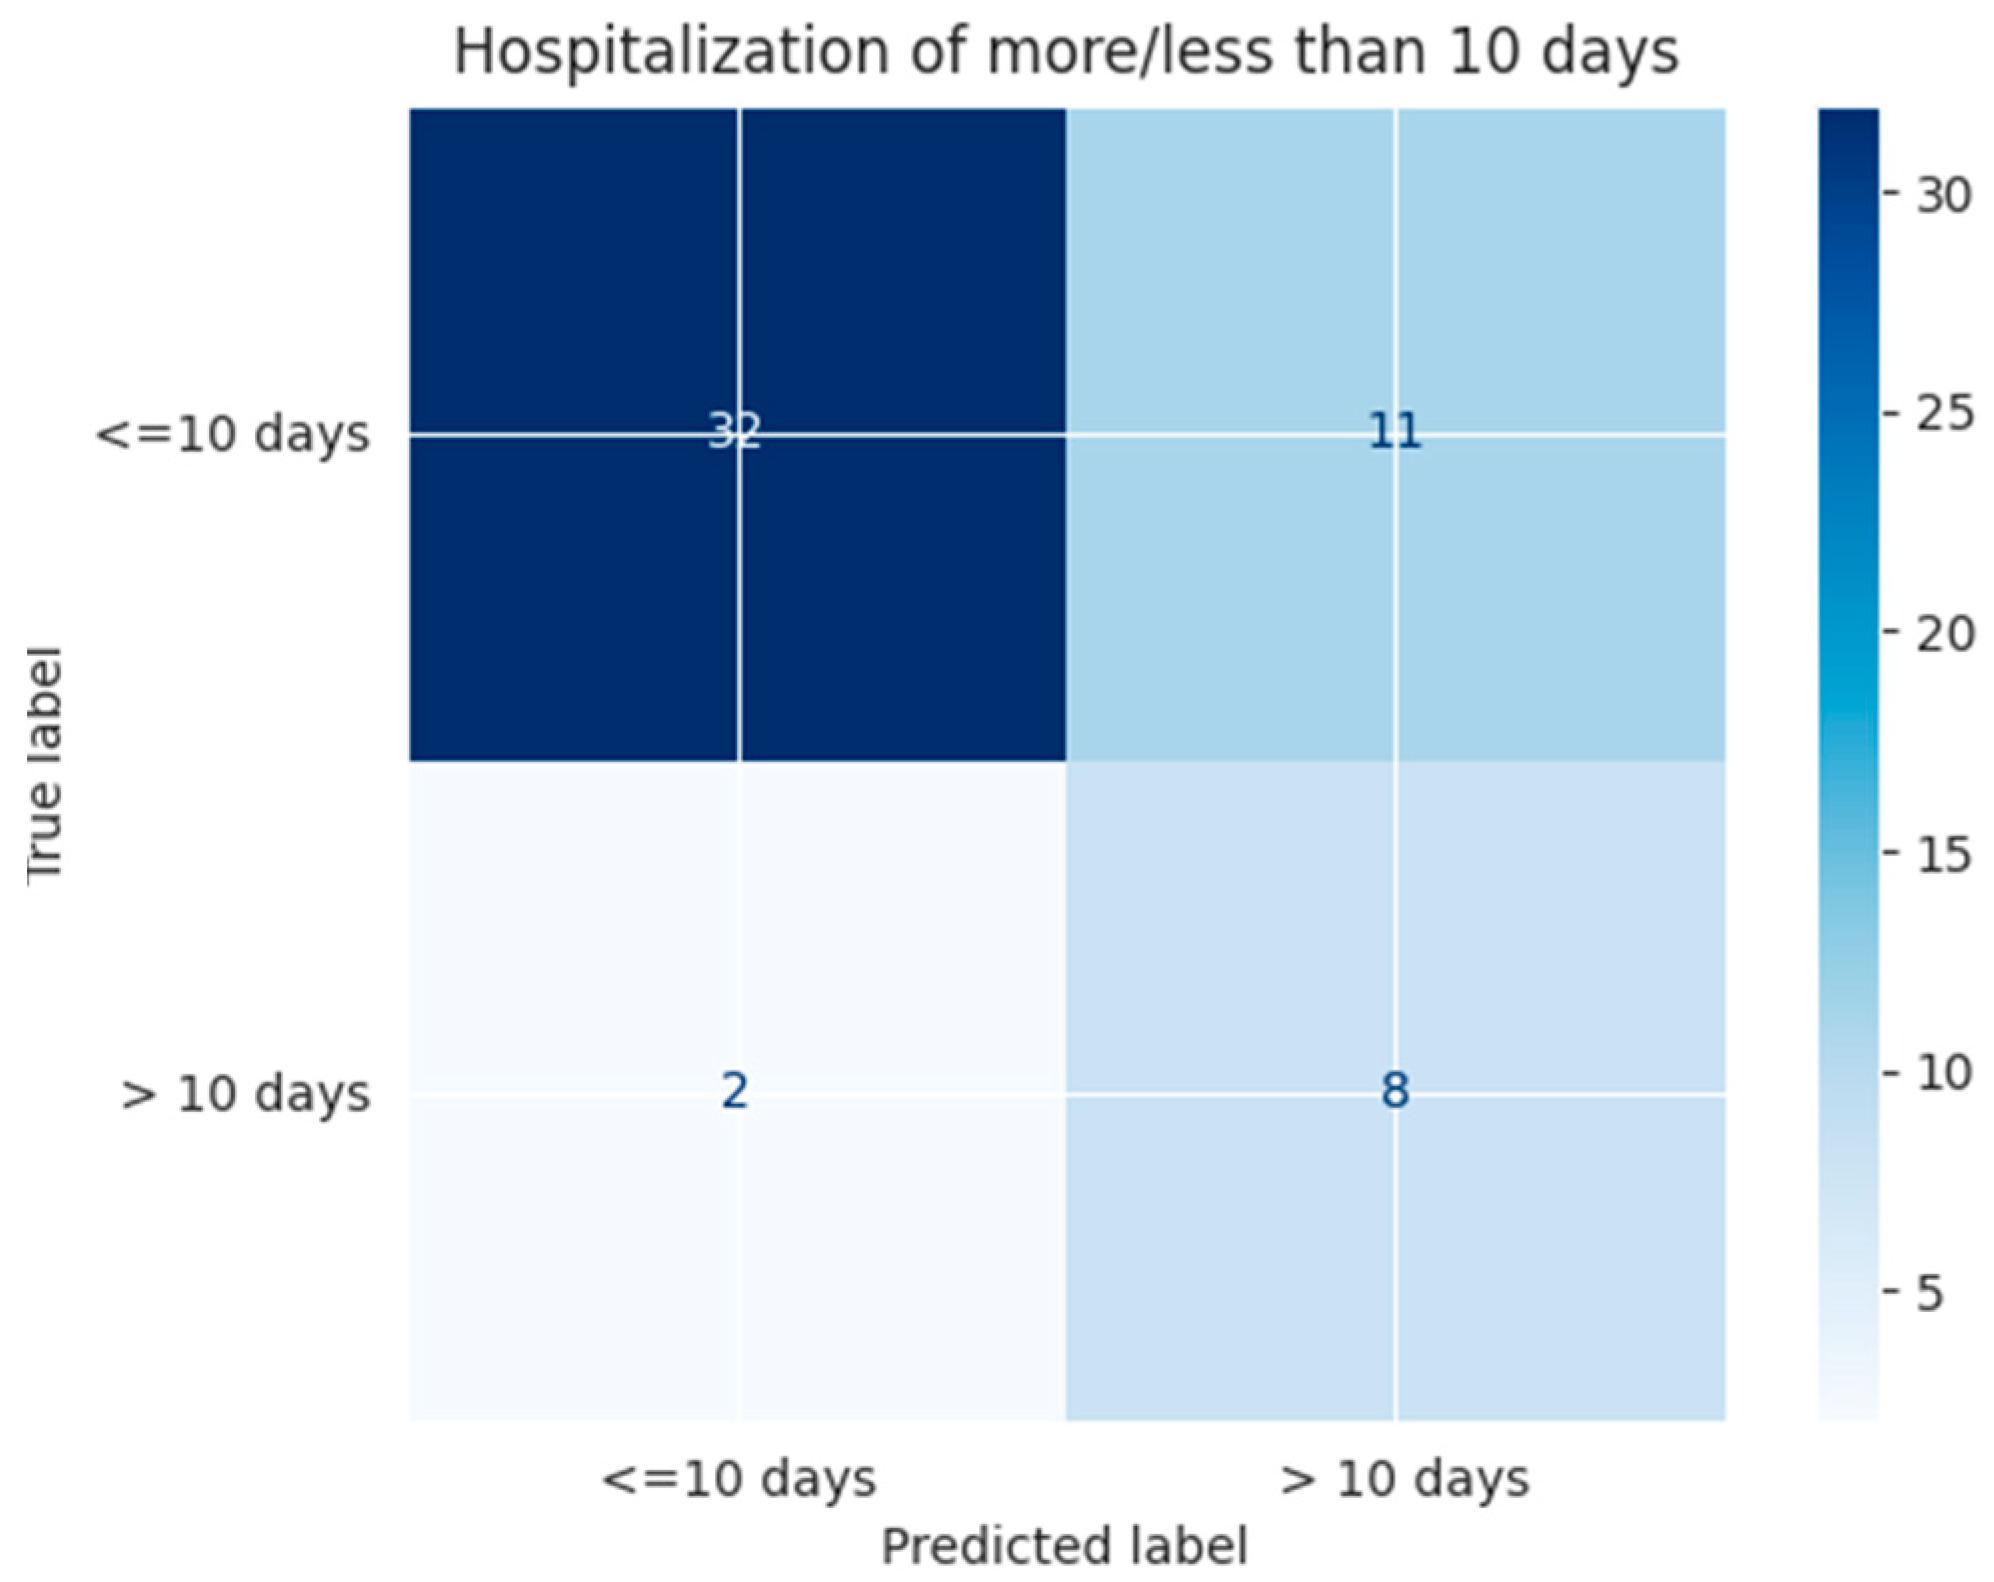
Figure 8 represents the obtained confusion matrix, where we can observe that the model correctly classified 32 out of the 43 patients who require less than 10 days of hospitalization, and 8 out of the 10 patients who require more than 10 days of hospitalization.
Table 3 summarizes the evaluation metrics obtained for the model using a threshold of 10 days to distinguish between the two outcome groups. For the ≤10 days category, the model achieved a precision of 0.94, a recall of 0.74, and an F1-score of 0.83. In comparison, for the >10 days group, the precision, recall, and F1-score are slightly lower at 0.42, 0.80, and 0.55, respectively. Overall accuracy was 0.75, with sensitivity and specificity values of 0.74 and 0.80, respectively. These results indicate that the model performs slightly better in identifying outcomes that occur within the first 10 days.
Comparison with Other Conventional Machine Learning Models
Although the primary goal of this study was the design and technical validation of an intelligent clinical decision support system based on image representations, it is important to assess how its performance compares to that of conventional machine learning algorithms commonly applied in clinical prediction tasks.
To this end, we conducted a complementary evaluation using the same dataset, and for consistency, restricted the input variables to those selected through the XGBoost-based feature importance analysis. This ensures that all models are trained on a shared subset of clinically and socially relevant predictors, allowing for a fair and coherent comparison.
Following standard practices in supervised classification, we implemented a range of representative algorithms, including decision trees, ensemble methods (Random Forest), support vector machines, K-Nearest Neighbors, Naïve Bayes classifiers, and a Multilayer Perceptron with two hidden layers: 100 ReLU-activated units for the first hidden layer and 50 ReLU-activated units for the second hidden layer. All models were developed in Python using the scikit-learn library, with default hyperparameters and a stratified 5-fold cross-validation strategy. An independent 20% test split was used for performance evaluation.
To align with the deep learning pipeline, numerical features were normalized to the [0, 1] range using min–max scaling, while categorical features were encoded via one-hot or label encoding as appropriate.
Table 4 and Table 5 summarize the Area Under the Curve (AUC) values obtained for both the 6-day and 10-day prediction thresholds. Among traditional models, the best results were achieved by the Random Forest and Decision Tree models, with AUCs around 0.62 and 0.63. In comparison, the proposed system outperformed all baseline models, suggesting that image-based representation may capture latent relationships that are more difficult to model with standard tabular approaches.
This comparative analysis supports the added value of the proposed methodology and provides further evidence of its potential as a complementary clinical tool, particularly in settings involving heterogeneous, structured data.

2.3.3. Alert Generation and Decision Making

After processing the patient’s data, the system generates a set of alerts.
Based on the system’s output, the clinical team can make more informed decisions regarding patient care, such as early planning for additional support services, closer inpatient monitoring, or specific diagnostic and treatment strategies.

3. Case Study

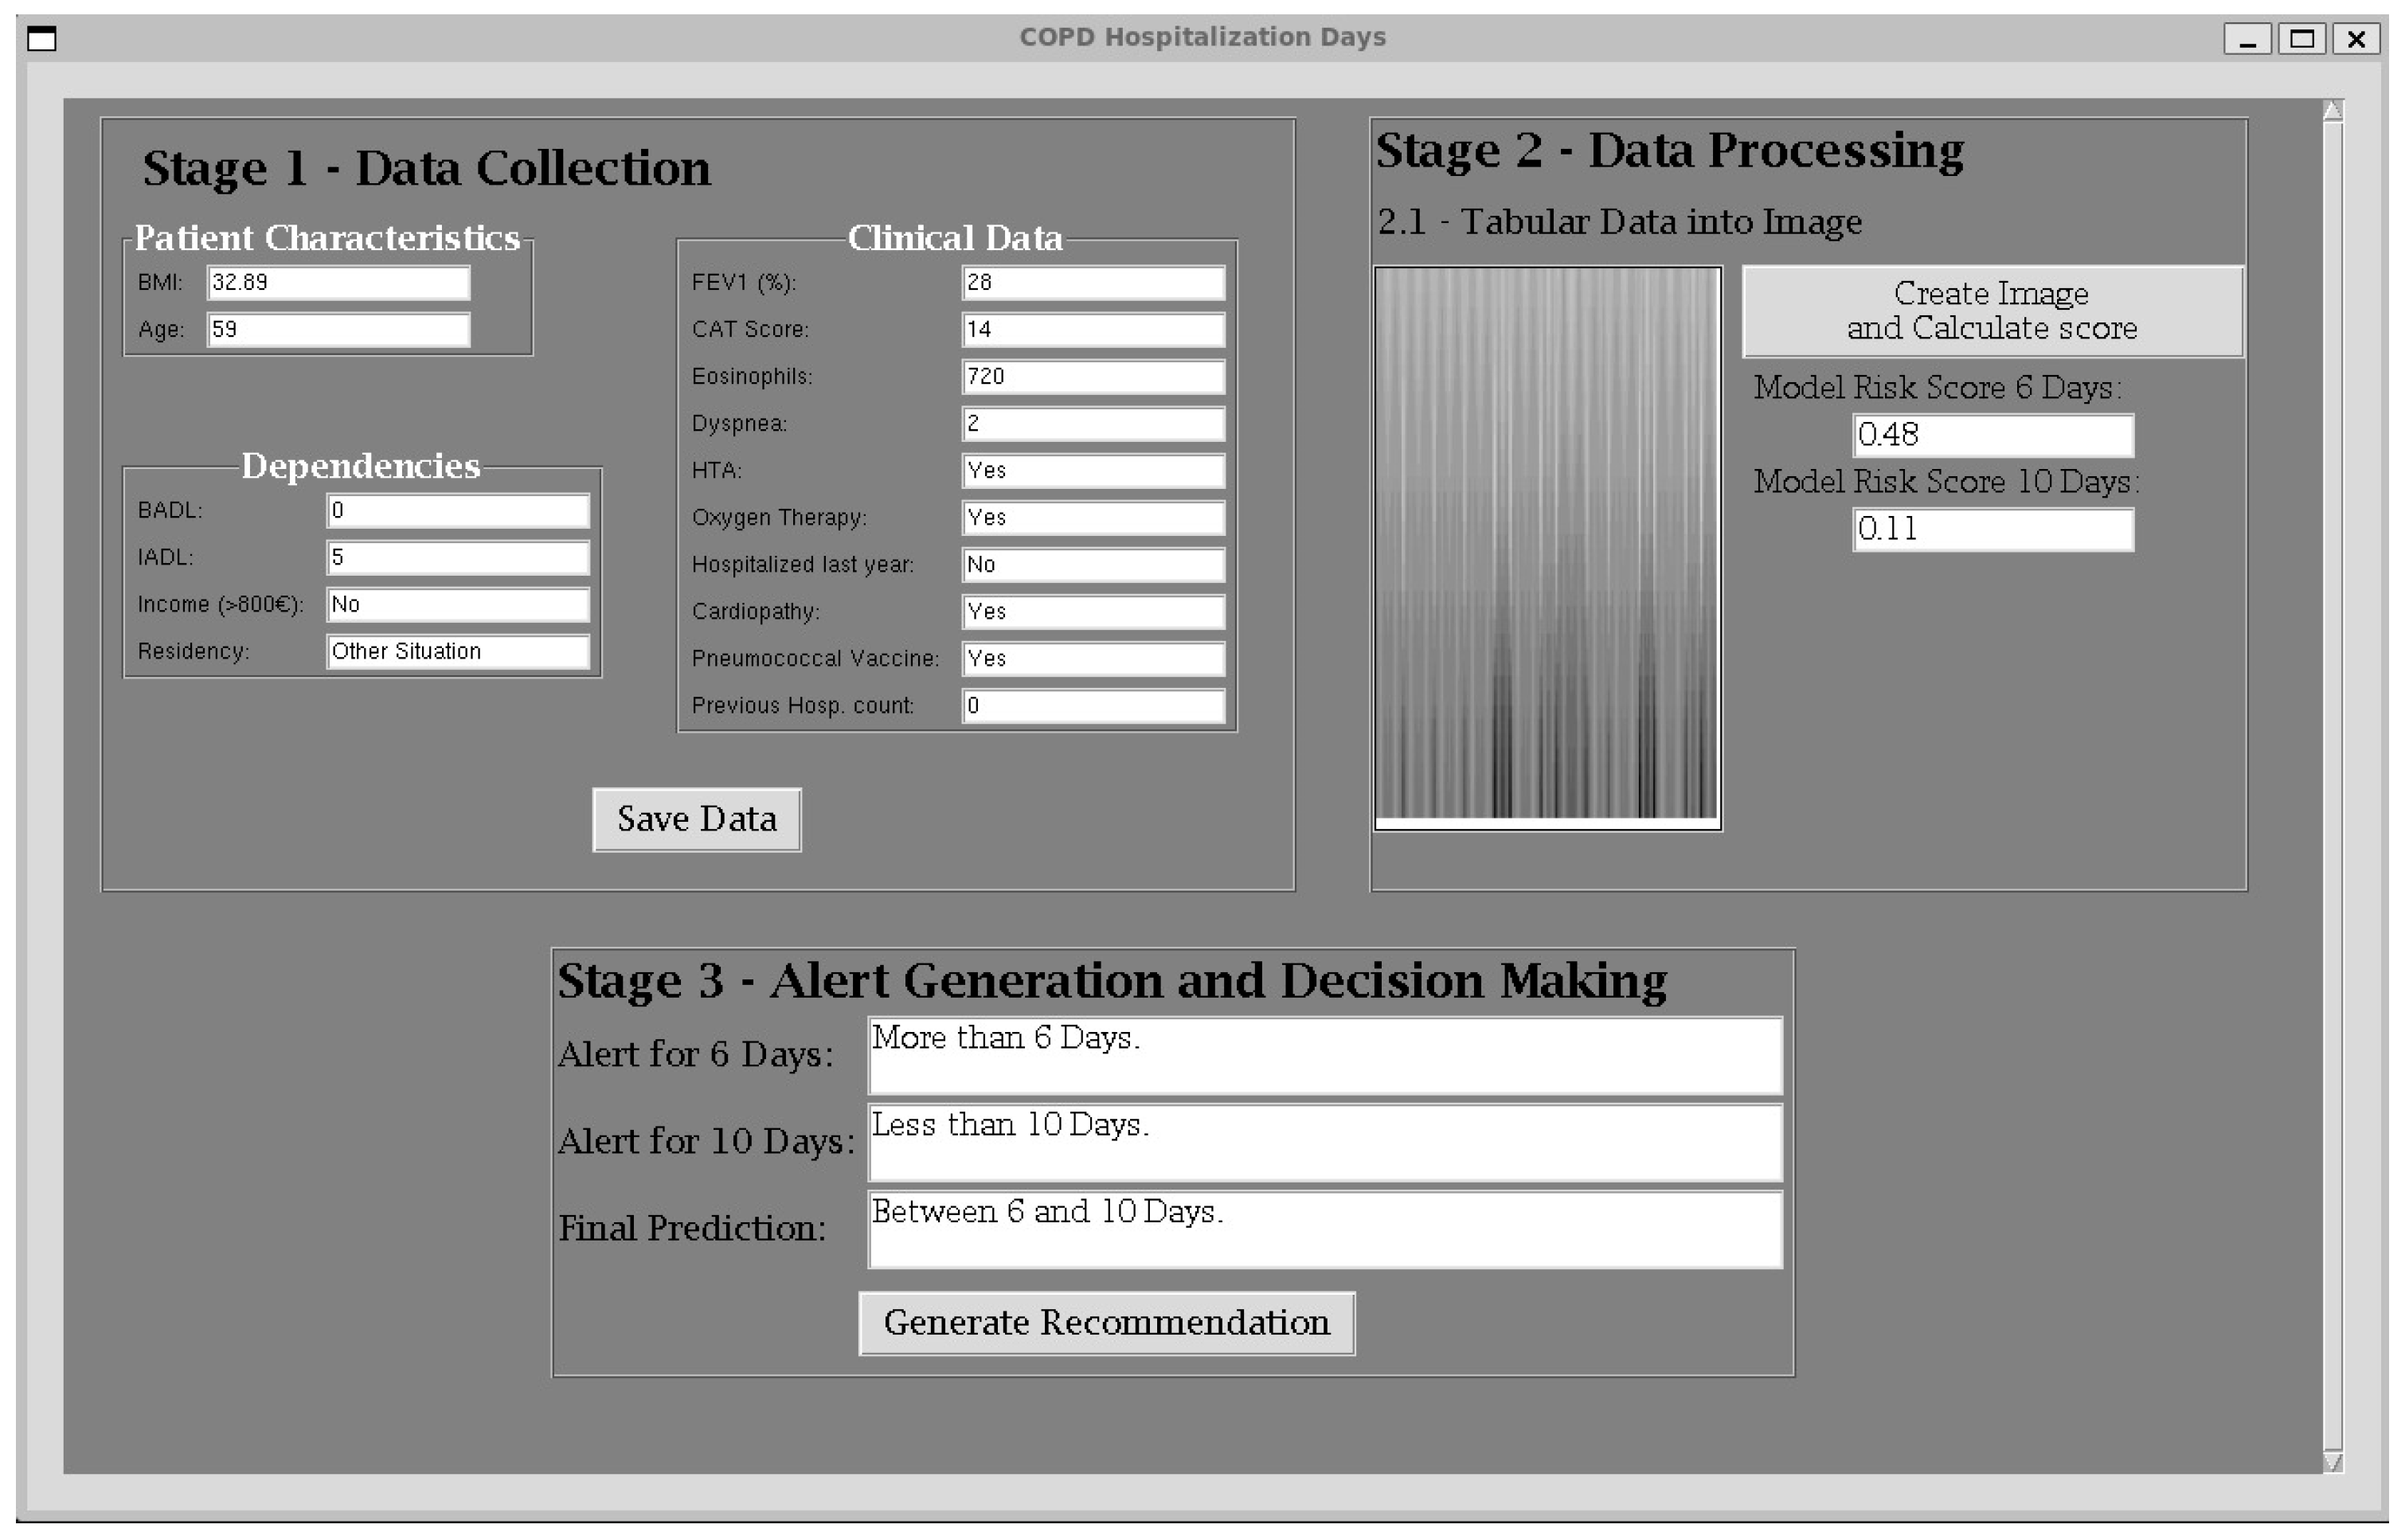
We present a case study of the proposed system to exemplify its operation with a simple case, which can be perceived as proof of concept. We used a patient who was not considered in the construction of the system and was reserved in the test set in both models. It is worthwhile noting that the system is in the early stages of development, and in the future, it will be required to address intensive clinical validation in real environments. Figure 9 represents the execution of the application.

3.1. Initial Data Collection

Table 6 presents the data of the patient used in this case study. The first patient is a 59-year-old female diagnosed with COPD who was admitted to AECOPD. She presents a BMI of 32.89 kg/m2, which is considered obese. She presents a FEV1 of 28% in the last spirometry, meaning that she has a very severe obstructive pattern. The total count of Eosinophils of 720 is above the normal range. She obtained a score of 14 points on the CAT questionnaire, indicating a medium impact of the disease. On the other hand, she obtained a score of 2 points on the mMRC dyspnea scale, which is associated with the mild presence of dyspnea. The patient was admitted for 8 days with no previous hospitalizations in the previous year.

3.2. Data Processing

Once the data has been entered into the application, as can be seen in Figure 9 it is processed by the system.
Based on the patient data, the risk score of more than 6 days of hospitalization is 0.48, and the risk score of more than 10 days of hospitalization is 0.11, as seen in Figure 9.

3.3. Alert Generation and Decision Making

Based on the risk score of more than 6 days of hospitalization, and considering the 6-day threshold (0.48), the label “More than 6 Days.” was determined, as can be seen in Figure 9. Based on the risk score of more than 10 days of hospitalization, and considering the 10-day threshold (0.39), the label “Less than 10 Days.” was determined, as can be seen also in Figure 9. This matches what actually happened with the patient, who was hospitalized for 8 days.

4. Discussion

This study presents a novel IDSS aimed at predicting the length of hospital stay in patients with COPD admitted due to acute exacerbations. The system introduces an innovative methodological approach that transforms heterogeneous clinical, demographic, and social tabular data into structured, image-like representations. These are then processed by a Convolutional Neural Network, leveraging its ability to detect spatial and hierarchical patterns within the data.
Rather than using this transformation merely for visualization, we adopt it as a deliberate formalization strategy. By applying sinusoidal encoding and Mel-frequency cepstral coefficients, the system generates spectrogram-like images that aim to preserve both the internal structure and inter-variable relationships present in the original dataset. This allows the model to capture complex associations between variables that may remain hidden in traditional tabular learning frameworks.
This approach aligns with recent trends in artificial intelligence that explore alternative data representations to overcome the limitations of conventional models when dealing with high-dimensional and multimodal clinical data. While further investigation is warranted, the transformation to image-based input may enhance the model’s ability to identify latent patterns and improve predictive accuracy, offering a promising complementary pathway for clinical decision support.

4.1. Model Performance and Clinical Utility

The proposed system demonstrates promising performance in predicting the length of hospital stay in patients admitted due to acute exacerbations of COPD. The model achieved an AUC of 0.75 for the 10-day threshold, reflecting solid discriminative capacity in identifying individuals at risk of prolonged hospitalization. Although the AUC was slightly higher for the 6-day threshold (0.77), the ability to anticipate hospitalizations exceeding 10 days may be of greater clinical relevance. Prolonged stays are often associated with increased care complexity and resource needs, and thus, early identification enables more effective intervention planning.
Beyond predictive accuracy, the integration of clinical, demographic, and social variables adds significant value. COPD is a multifactorial condition in which social determinants—such as dependency in daily activities, living arrangements, and the availability of support networks—have a direct impact on disease progression and outcomes. By including these non-clinical factors, the system advances toward a more holistic representation of the patient’s condition.
Equally important is the system’s usability in real-world practice. The final model relies on 16 variables selected for both their predictive relevance and their accessibility in typical clinical workflows. Most of these variables are already available in electronic health records or can be collected quickly through a brief interview. This practicality makes the system especially suitable for settings with limited resources, supporting its potential for broad implementation.
From a clinical management standpoint, the early identification of high-risk patients can assist in triage, treatment planning, and care coordination. Patients predicted to require extended hospitalizations could benefit from early involvement of rehabilitation services, social support, or even palliative care teams when appropriate. Conversely, patients expected to have shorter stays may be eligible for expedited diagnostic procedures or early discharge planning, optimizing resource use.
Finally, the incorporation of a standardized, intelligent decision support tool contributes to reducing variability in clinical practice. In complex cases such as COPD exacerbations, where clinical judgment often varies across professionals and institutions, providing consistent and data-driven support can promote more equitable and systematic care—especially in settings with high staff turnover or variable levels of training.

4.2. Ethical Considerations and Future Clinical Use

Although this work is presented as a proof of concept, its future application in clinical settings raises important ethical considerations. Predicting prolonged hospital stays can influence decisions on treatment intensity, discharge planning, or resource prioritization. Therefore, the system’s outputs should be understood as supportive elements—never as replacements for clinical judgment.
The integration of clinical, demographic, and social variables enhances predictive capacity but also requires safeguards to prevent unintended biases, particularly in vulnerable or underrepresented populations. Ensuring fairness and transparency in model development and validation is essential for responsible use.
Any future deployment should include clear protocols for communication, professional training in the interpretation of predictions, and mechanisms to support shared decision-making. Under these conditions, the system may contribute meaningfully to improving care organization and patient outcomes, while maintaining ethical and clinical rigor.

4.3. Comparison with Existing Models

The prediction of the length of hospital stay in patients with COPD remains an underexplored area, especially when compared to the abundance of models developed for readmission or mortality prediction. While some studies have addressed the length of hospital stay in broader chronic disease contexts, specific approaches focused on COPD are still limited.
Symum et al. [34], for example, applied a support vector machine model with wrapper-based feature selection to predict prolonged hospitalizations among patients with chronic conditions, including COPD, achieving an AUC of 0.79. Luo et al. [35] employed LASSO regression and Random Forest techniques on COPD cohorts, reporting moderate predictive performance with AUCs of 0.62 and 0.63, respectively. Zulkifli et al. [36] proposed a Zero-Truncated Negative Binomial regression model for respiratory patients, improving model fit by accounting for overdispersion in count data. Although these models provide valuable insights, they rely on conventional data representations and often require large numbers of variables.
Our approach introduces a methodological shift by transforming structured tabular data into image-like representations, enabling the use of Convolutional Neural Networks to detect spatial and hierarchical patterns. Rather than optimizing purely for performance on existing benchmarks, the system explores a novel formalization pathway that allows inter-variable dependencies to be captured visually—something rarely feasible with traditional methods.
Although our AUC scores are comparable to those reported in previous works, particularly for longer stays, the use of grayscale spectrogram-like images offers enhanced scalability and greater representational capacity. As datasets grow and image construction techniques are refined, this approach may yield further improvements, especially in complex, heterogeneous conditions such as COPD.

4.4. Added Value of Image-Based Representation and Feature Selection

One of the key contributions of the proposed system lies in its dual strategy: combining a clinically relevant and operationally feasible subset of features with a structured transformation of tabular data into image representations suitable for deep learning models.
The feature selection process, based on XGBoost’s importance analysis, identified 16 variables that integrate clinical, demographic, and social information. This curated subset not only simplifies model complexity but also ensures practical applicability, as the selected variables are generally available in electronic health records or easily obtained at the point of care. The inclusion of social determinants—such as functional dependency or home conditions—enriches the clinical profile and aligns with a more holistic approach to COPD management.
Beyond variable selection, the transformation of tabular data into images adds a novel layer of interpretability and modeling power. This is achieved through a multi-stage process. First, patient data are normalized and organized into pairs of variables, where one defines the amplitude and the other the frequency of a sinusoidal wave. The resulting signal segments are concatenated to form a unique waveform per patient. This waveform is then converted into a spectrogram using Mel-frequency cepstral coefficients, which capture both temporal and spectral characteristics of the signal. Finally, a custom post-processing pipeline enhances contrast, reduces noise, and segments each spectrogram into structured tiles before recombining them into a single, compact grayscale image.
Although the encoding process treats all variables uniformly, the consistent and structured layout of the resulting images enables the convolutional network to capture spatial regularities and potential inter-variable dependencies. This visual organization supports a richer data representation, overcoming the limitations of flat, unstructured tabular formats. Moreover, the square format and controlled resolution ensure compatibility with standard CNN architectures, facilitating future scalability through deeper or pre-trained networks.

4.5. Limitations and Future Directions

Despite the promising results obtained, several limitations must be acknowledged. As with many deep learning systems, one of the primary challenges lies in the size of the dataset. Although the current sample is sufficient for a proof-of-concept, Convolutional Neural Networks typically require large volumes of labeled data to generalize effectively. This limitation increases the risk of overfitting, particularly when working with high-capacity models or image-based representations. While internal validation yielded stable performance, external validation across multiple centers and diverse populations is essential to confirm the robustness of the approach.
Additionally, the process of transforming tabular data into spectrogram-like images, while novel, introduces design choices that currently rely on heuristics—such as variable pairing, frequency mapping, and spectral resolution. These choices directly influence the model’s capacity to capture relevant patterns and should be refined through systematic optimization strategies in future work.
Moreover, the CNN architecture used in this study was intentionally lightweight to ensure computational efficiency. However, this may limit its capacity to extract deeper or more abstract relationships. Exploring more sophisticated architectures, such as ResNet, GoogleNet [37], or ensemble approaches, may help improve performance, especially as more data becomes available.
Interpretability also remains a key challenge. While CNNs are effective in learning complex mappings, they are often perceived as “black boxes.” Enhancing explainability through saliency maps, Grad-CAM [38], or other interpretability techniques will be important to build clinician trust and improve understanding of how the model reaches its predictions.
To guide future development and research, we propose the following directions:
  • Data Expansion and Multicenter Validation: Collect larger and more diverse datasets to improve model generalizability and support external validation efforts.
  • Overfitting Mitigation Strategies: Employ regularization techniques, data augmentation, or transfer learning to reduce the risk of overfitting in low-data scenarios.
  • Optimization of the Image Generation Pipeline: Replace manual design steps with automated optimization methods (e.g., neural architecture search, differentiable signal-to-image encoding).
  • Exploration of Advanced Architectures: Evaluate deeper or pre-trained CNNs and hybrid models to enhance feature extraction without compromising interpretability.
  • Explainability Tools Integration: Incorporate visual explanation frameworks to identify which image regions contribute most to each prediction and relate them back to specific clinical variables.
  • Clinical Usability Studies: Conduct user-centered evaluations with healthcare professionals to assess real-world applicability, interpretability, and integration into clinical workflows.
These steps will be critical to transition from a proof-of-concept to a clinically viable decision support tool.

5. Conclusions

This work introduces an intelligent clinical decision support system designed to predict the average LOHS in patients hospitalized due to acute exacerbations of COPD. To our knowledge, this is the first system aimed at categorizing patients based on whether their LOHS is expected to be above or below predefined thresholds, thereby assisting clinicians in stratifying cases according to severity and optimizing care planning.
To reduce dimensionality and enhance clinical applicability, a feature selection process was implemented using the XGBoost algorithm, resulting in a final set of 16 variables. Notably, the model incorporates not only clinical features but also social variables, which contribute an additional layer of insight and support a more holistic view of the patient’s condition. This inclusion distinguishes our approach from prior models and underscores the relevance of social determinants in predicting hospitalization outcomes in COPD.
The system’s usability and potential for clinical integration were illustrated through a real case study. On the test subset, the model showed promising performance: for the 10-day threshold, it achieved an AUC close to 0.80, with a sensitivity and specificity of 0.81. For the 6-day threshold, it yielded an AUC of 0.72, sensitivity of 0.65, and specificity of 0.76. These preliminary results indicate that the system may serve as a valuable tool to support clinical decision-making.
However, this study presents several limitations. Most notably, the relatively small size of the dataset may restrict the generalizability of the findings and elevate the risk of overfitting. As a result, the proposed system should be considered a proof of concept still in its early development stage, and further validation—particularly through external and prospective studies—is required before it can be reliably implemented in clinical practice.
Future work should focus on conducting external and prospective clinical validation to assess the model’s performance in real-world settings. Additionally, expanding the dataset to include a larger and more diverse patient population will be essential for improving the system’s robustness and generalizability. These steps are critical for moving toward safe and effective integration of the system into routine clinical practice.

Author Contributions

The clinical team—A.F.-G., R.G., C.R.-R., M.T.-D. and A.F.-V.—was responsible for patient recruitment, clinical data collection, and database construction. They also provided essential clinical expertise throughout the development process, contributing to the contextualization of the disease and offering guidance on the tool’s design and applicability. The engineering team—A.P., M.C.-G., J.L.-C., J.C.-P. and A.C.-C.—led the design, development, and implementation of the intelligent system. The original draft was prepared by A.P. and M.C.-G. Review and editing were carried out by M.C.-G., A.C.-C. and A.F.-V. All authors have read and agreed to the published version of the manuscript.

Funding

This research received no external funding.

Institutional Review Board Statement

This study was reviewed and approved by the Galicia Ethics and Research Committee with the approval number 2016/524 (date: 17 December 2018). All patients provided signed, informed consent to participate.

Informed Consent Statement

Informed consent was obtained from all subjects involved in the study.

Data Availability Statement

No new data were created or analyzed in this study. Data sharing is not applicable to this article.

Acknowledgments

This paper is part of the research conducted in fulfillment of the requirements for the Ph.D. degree of Alberto Pinheira.

Conflicts of Interest

The authors declare no conflicts of interest.

References

  1. Agustí, A.; Celli, B.R.; Criner, G.J.; Halpin, D.; Anzueto, A.; Barnes, P.; Bourbeau, J.; Han, M.K.; Martinez, F.J.; de Oca, M.M.; et al. Global Initiative for Chronic Obstructive Lung Disease 2023 Report: GOLD Executive Summary. Arch. Bronconeumol. 2023, 59, 232–248. [Google Scholar] [CrossRef]
  2. Vogelmeier, C.F.; Román-Rodríguez, M.; Singh, D.; Han, M.L.K.; Rodríguez-Roisin, R.; Ferguson, G.T. Goals of COPD treatment: Focus on symptoms and exacerbations. Respir. Med. 2020, 166, 105938. [Google Scholar] [CrossRef]
  3. Wang, Y.; Stavem, K.; Dahl, F.A.; Humerfelt, S.; Haugen, T. Factors associated with a prolonged length of stay after acute exacerbation of chronic obstructive pulmonary disease (AECOPD). Int. J. COPD 2014, 9, 99–105. [Google Scholar] [CrossRef] [PubMed]
  4. Inabnit, L.S.; Blanchette, C.; Ruban, C. Comorbidities and length of stay in chronic obstructive pulmonary disease patients. COPD J. Chronic Obstr. Pulm. Dis. 2018, 15, 355–360. [Google Scholar] [CrossRef] [PubMed]
  5. Crisafulli, E.; Ielpo, A.; Barbeta, E.; Ceccato, A.; Huerta, A.; Gabarrús, A.; Soler, N.; Chetta, A.; Torres, A. Clinical variables predicting the risk of a hospital stay for longer than 7 days in patients with severe acute exacerbations of chronic obstructive pulmonary disease: A prospective study. Respir. Res. 2018, 19, 261. [Google Scholar] [CrossRef]
  6. Agboado, G.; Peters, J.; Donkin, L. Factors influencing the length of hospital stay among patients resident in Blackpool admitted with COPD: A cross-sectional study. BMJ Open 2012, 2, e000869. [Google Scholar] [CrossRef]
  7. Wong, A.W.M.; Gan, W.Q.; Burns, J.; Sin, D.D.; van Eeden, S.F. Exacerbation aiguë de la bronchopneumopathie obstructive chronique: Influence des facteurs sociaux sur la durée de l’hospitalisation et les taux de réadmission. Can. Respir. J. 2008, 15, 361–364. [Google Scholar] [CrossRef]
  8. Ko, F.W.S.; Chan, K.P.; Ngai, J.; Ng, S.S.; Yip, W.H.; Ip, A.; Chan, T.; Hui, D.S. Blood eosinophil count as a predictor of hospital length of stay in COPD exacerbations. Respirology 2020, 25, 259–266. [Google Scholar] [CrossRef]
  9. Pokharel, P.; Lamichhane, P.; Pant, P.; Shrestha, A.B. Factors affecting length of hospital stay in chronic obstructive pulmonary disease patients in a tertiary hospital of Nepal: A retrospective cross-sectional study. Ann. Med. Surg. 2022, 80, 104246. [Google Scholar] [CrossRef] [PubMed]
  10. Fernández-García, S.; Represas-Represas, C.; Ruano-Raviña, A.; Botana-Rial, M.; Mouronte-Roibas, C.; Ramos-Hernández, C.; Fernández-Villar, A. Predictores sociales y clínicos asociados con estancia hospitalaria prolongada en pacientes con agudización grave de EPOC. Rev. Clin. Esp. 2020, 220, 79–85. [Google Scholar] [CrossRef]
  11. Turgeman, L.; May, J.H.; Sciulli, R. Insights from a machine learning model for predicting the hospital Length of Stay (LOS) at the time of admission. Expert. Syst. Appl. 2017, 78, 376–385. [Google Scholar] [CrossRef]
  12. Lüthi-Corridori, G.; Boesing, M.; Ottensarendt, N.; Leuppi-Taegtmeyer, A.B.; Schuetz, P.; Leuppi, J.D. Predictors of Length of Stay, Mortality and Rehospitalization in COPD Patients: A Retrospective Cohort Study. J. Clin. Med. 2023, 12, 5322. [Google Scholar] [CrossRef] [PubMed]
  13. Rajula, H.S.R.; Verlato, G.; Manchia, M.; Antonucci, N.; Fanos, V. Comparison of conventional statistical methods with machine learning in medicine: Diagnosis, drug development, and treatment. Medicina 2020, 56, 455. [Google Scholar] [CrossRef] [PubMed]
  14. Casal-Guisande, M.; Represas-Represas, C.; Golpe, R.; Fernández-García, A.; González-Montaos, A.; Comesaña-Campos, A.; Ruano-Raviña, A.; Fernández-Villar, A. Clinical and Social Characterization of Patients Hospitalized for COPD Exacerbation Using Machine Learning Tools. Arch. Bronconeumol. 2025, 61, 264–273. [Google Scholar] [CrossRef]
  15. Wang, L.; Chen, X.; Zhang, L.; Li, L.; Huang, Y.; Sun, Y.; Yuan, X. Artificial intelligence in clinical decision support systems for oncology. Int. J. Med. Sci. 2023, 20, 79–86. [Google Scholar] [CrossRef]
  16. Niraula, D.; Sun, W.; Jin, J.; Dinov, I.D.; Cuneo, K.; Jamaluddin, J.; Matuszak, M.M.; Luo, Y.; Lawrence, T.S.; Jolly, S.; et al. A clinical decision support system for AI-assisted decision-making in response-adaptive radiotherapy (ARCliDS). Sci. Rep. 2023, 13, 5279. [Google Scholar] [CrossRef]
  17. Naiseh, M.; Al-Thani, D.; Jiang, N.; Ali, R. How the different explanation classes impact trust calibration: The case of clinical decision support systems. Int. J. Hum. Comput. Stud. 2023, 169, 102941. [Google Scholar] [CrossRef]
  18. Casal-Guisande, M.; Fernández-Villar, A.; Mosteiro-Añón, M.; Comesaña-Campos, A.; Cerqueiro-Pequeño, J.; Torres-Durán, M. Integrating tabular data through image conversion for enhanced diagnosis: A novel intelligent decision support system for stratifying obstructive sleep apnoea patients using convolutional neural networks. Digit. Health 2024, 10, 20552076241272630. [Google Scholar] [CrossRef]
  19. Ferreira, P.; Dutra, I.; Salvini, R.; Burnside, E. Interpretable models to predict Breast Cancer. In Proceedings of the 2016 IEEE International Conference on Bioinformatics and Biomedicine (BIBM), Shenzhen, China, 15–18 December 2016; pp. 1507–1511. [Google Scholar] [CrossRef]
  20. Zheng, L.; Eniola, E.; Wang, J. Machine Learning for Colorectal Cancer Risk Prediction. In Proceedings of the 2021 International Conference on Cyber-Physical Social Intelligence (ICCSI), Beijing, China, 18–20 December 2021; pp. 1–6. [Google Scholar] [CrossRef]
  21. Ghazal, S.; Sauthier, M.; Brossier, D.; Bouachir, W.; Jouvet, P.A.; Noumeir, R. Using machine learning models to predict oxygen saturation following ventilator support adjustment in critically ill children: A single center pilot study. PLoS ONE 2019, 14, e0198921. [Google Scholar] [CrossRef] [PubMed]
  22. Muñoz-Martínez, M.-J.; Casal-Guisande, M.; Torres-Durán, M.; Sopeña, B.; Fernández-Villar, A. Clinical Characterization of Patients with Syncope of Unclear Cause Using Unsupervised Machine-Learning Tools: A Pilot Study. Appl. Sci. 2025, 15, 7176. [Google Scholar] [CrossRef]
  23. Miotto, R.; Wang, F.; Wang, S.; Jiang, X.; Dudley, J.T. Deep learning for healthcare: Review, opportunities and challenges. Brief. Bioinform. 2018, 19, 1236–1246. [Google Scholar] [CrossRef]
  24. Dogu, E.; Albayrak, Y.E.; Tuncay, E. Length of hospital stay prediction with an integrated approach of statistical-based fuzzy cognitive maps and artificial neural networks. Med. Biol. Eng. Comput. 2021, 59, 483–496. [Google Scholar] [CrossRef]
  25. Zolbanin, H.M.; Davazdahemami, B.; Delen, D.; Zadeh, A.H. Data analytics for the sustainable use of resources in hospitals: Predicting the length of stay for patients with chronic diseases. Inf. Manag. 2022, 59, 103282. [Google Scholar] [CrossRef]
  26. López-Canay, J.; Casal-Guisande, M.; Pinheira, A.; Golpe, R.; Comesaña-Campos, A.; Fernández-García, A.; Represas-Represas, C.; Fernández-Villar, A. Predicting COPD Readmission: An Intelligent Clinical Decision Support System. Diagnostics 2025, 15, 318. [Google Scholar] [CrossRef]
  27. Alsahaf, A.; Petkov, N.; Shenoy, V.; Azzopardi, G. A framework for feature selection through boosting. Expert. Syst. Appl. 2022, 187, 115895. [Google Scholar] [CrossRef]
  28. Galli, S. Feature Selection in Machine Learning with Python; Leanpub: Victoria, BC, Canada, 2022. [Google Scholar]
  29. RAPIDS Development Team. RAPIDS: Libraries for End-to-End GPU Data Science. 2023. Available online: https://rapids.ai (accessed on 20 May 2025).
  30. Yu, L.; Li, B.; Jiao, B. Research and Implementation of CNN Based on TensorFlow. IOP Conf. Ser. Mater. Sci. Eng. 2019, 490, 042022. [Google Scholar] [CrossRef]
  31. McFee, B.; Raffel, C.; Liang, D.; Ellis, D.; McVicar, M.; Battenberg, E.; Nieto, O. librosa: Audio and Music Signal Analysis in Python. In Proceedings of the 14th Python in Science Conference, Austin, TX, USA, 6–12 July 2015; pp. 18–24. [Google Scholar] [CrossRef]
  32. Harris, C.R.; Millman, K.J.; van der Walt, S.J.; Gommers, R.; Virtanen, P.; Cournapeau, D.; Wieser, E.; Taylor, J.; Berg, S.; Smith, N.J.; et al. Array programming with NumPy. Nature 2020, 585, 357–362. [Google Scholar] [CrossRef]
  33. Pedregosa, F.; Michel, V.; Grisel, O.; Blondel, M.; Prettenhofer, P.; Weiss, R.; Varoquaux, G.; Gramfort, A.; Thirion, B.; Dubourg, V.; et al. Scikit-learn: Machine Learning in Python. J. Mach. Learn. Res. 2011, 12, 2825–2830. [Google Scholar]
  34. Symum, H.; Zayas-Castro, J.L. Prediction of chronic disease-related inpatient prolonged length of stay using machine learning algorithms. Healthc. Inform. Res. 2020, 26, 20–33. [Google Scholar] [CrossRef] [PubMed]
  35. Luo, L.; Lian, S.; Feng, C.; Huang, D.; Zhang, W. Data mining-based detection of rapid growth in length of stay on COPD patients. In Proceedings of the 2017 IEEE 2nd International Conference on Big Data Analysis (ICBDA), Beijing, China, 10–12 March 2017; pp. 254–258. [Google Scholar] [CrossRef]
  36. Mohd Zulkifli, S.W.H.; Samsudin, H.B.; Majid, N. Generalized Linear Model to Estimate Length of Stay in The Hospital due to Respiratory Diseases. Univers. J. Public Health 2023, 11, 177–184. [Google Scholar] [CrossRef]
  37. Zhang, X.; Han, N.; Zhang, J. Comparative analysis of VGG, ResNet, and GoogLeNet architectures evaluating performance, computational efficiency, and convergence rates. Appl. Comput. Eng. 2024, 44, 172–181. [Google Scholar] [CrossRef]
  38. Selvaraju, R.R.; Cogswell, M.; Das, A.; Vedantam, R.; Parikh, D.; Batra, D. Grad-CAM: Visual Explanations from Deep Networks via Gradient-Based Localization. In Proceedings of the 2017 IEEE International Conference on Computer Vision (ICCV), Venice, Italy, 22–29 October 2017; pp. 618–626. [Google Scholar] [CrossRef]
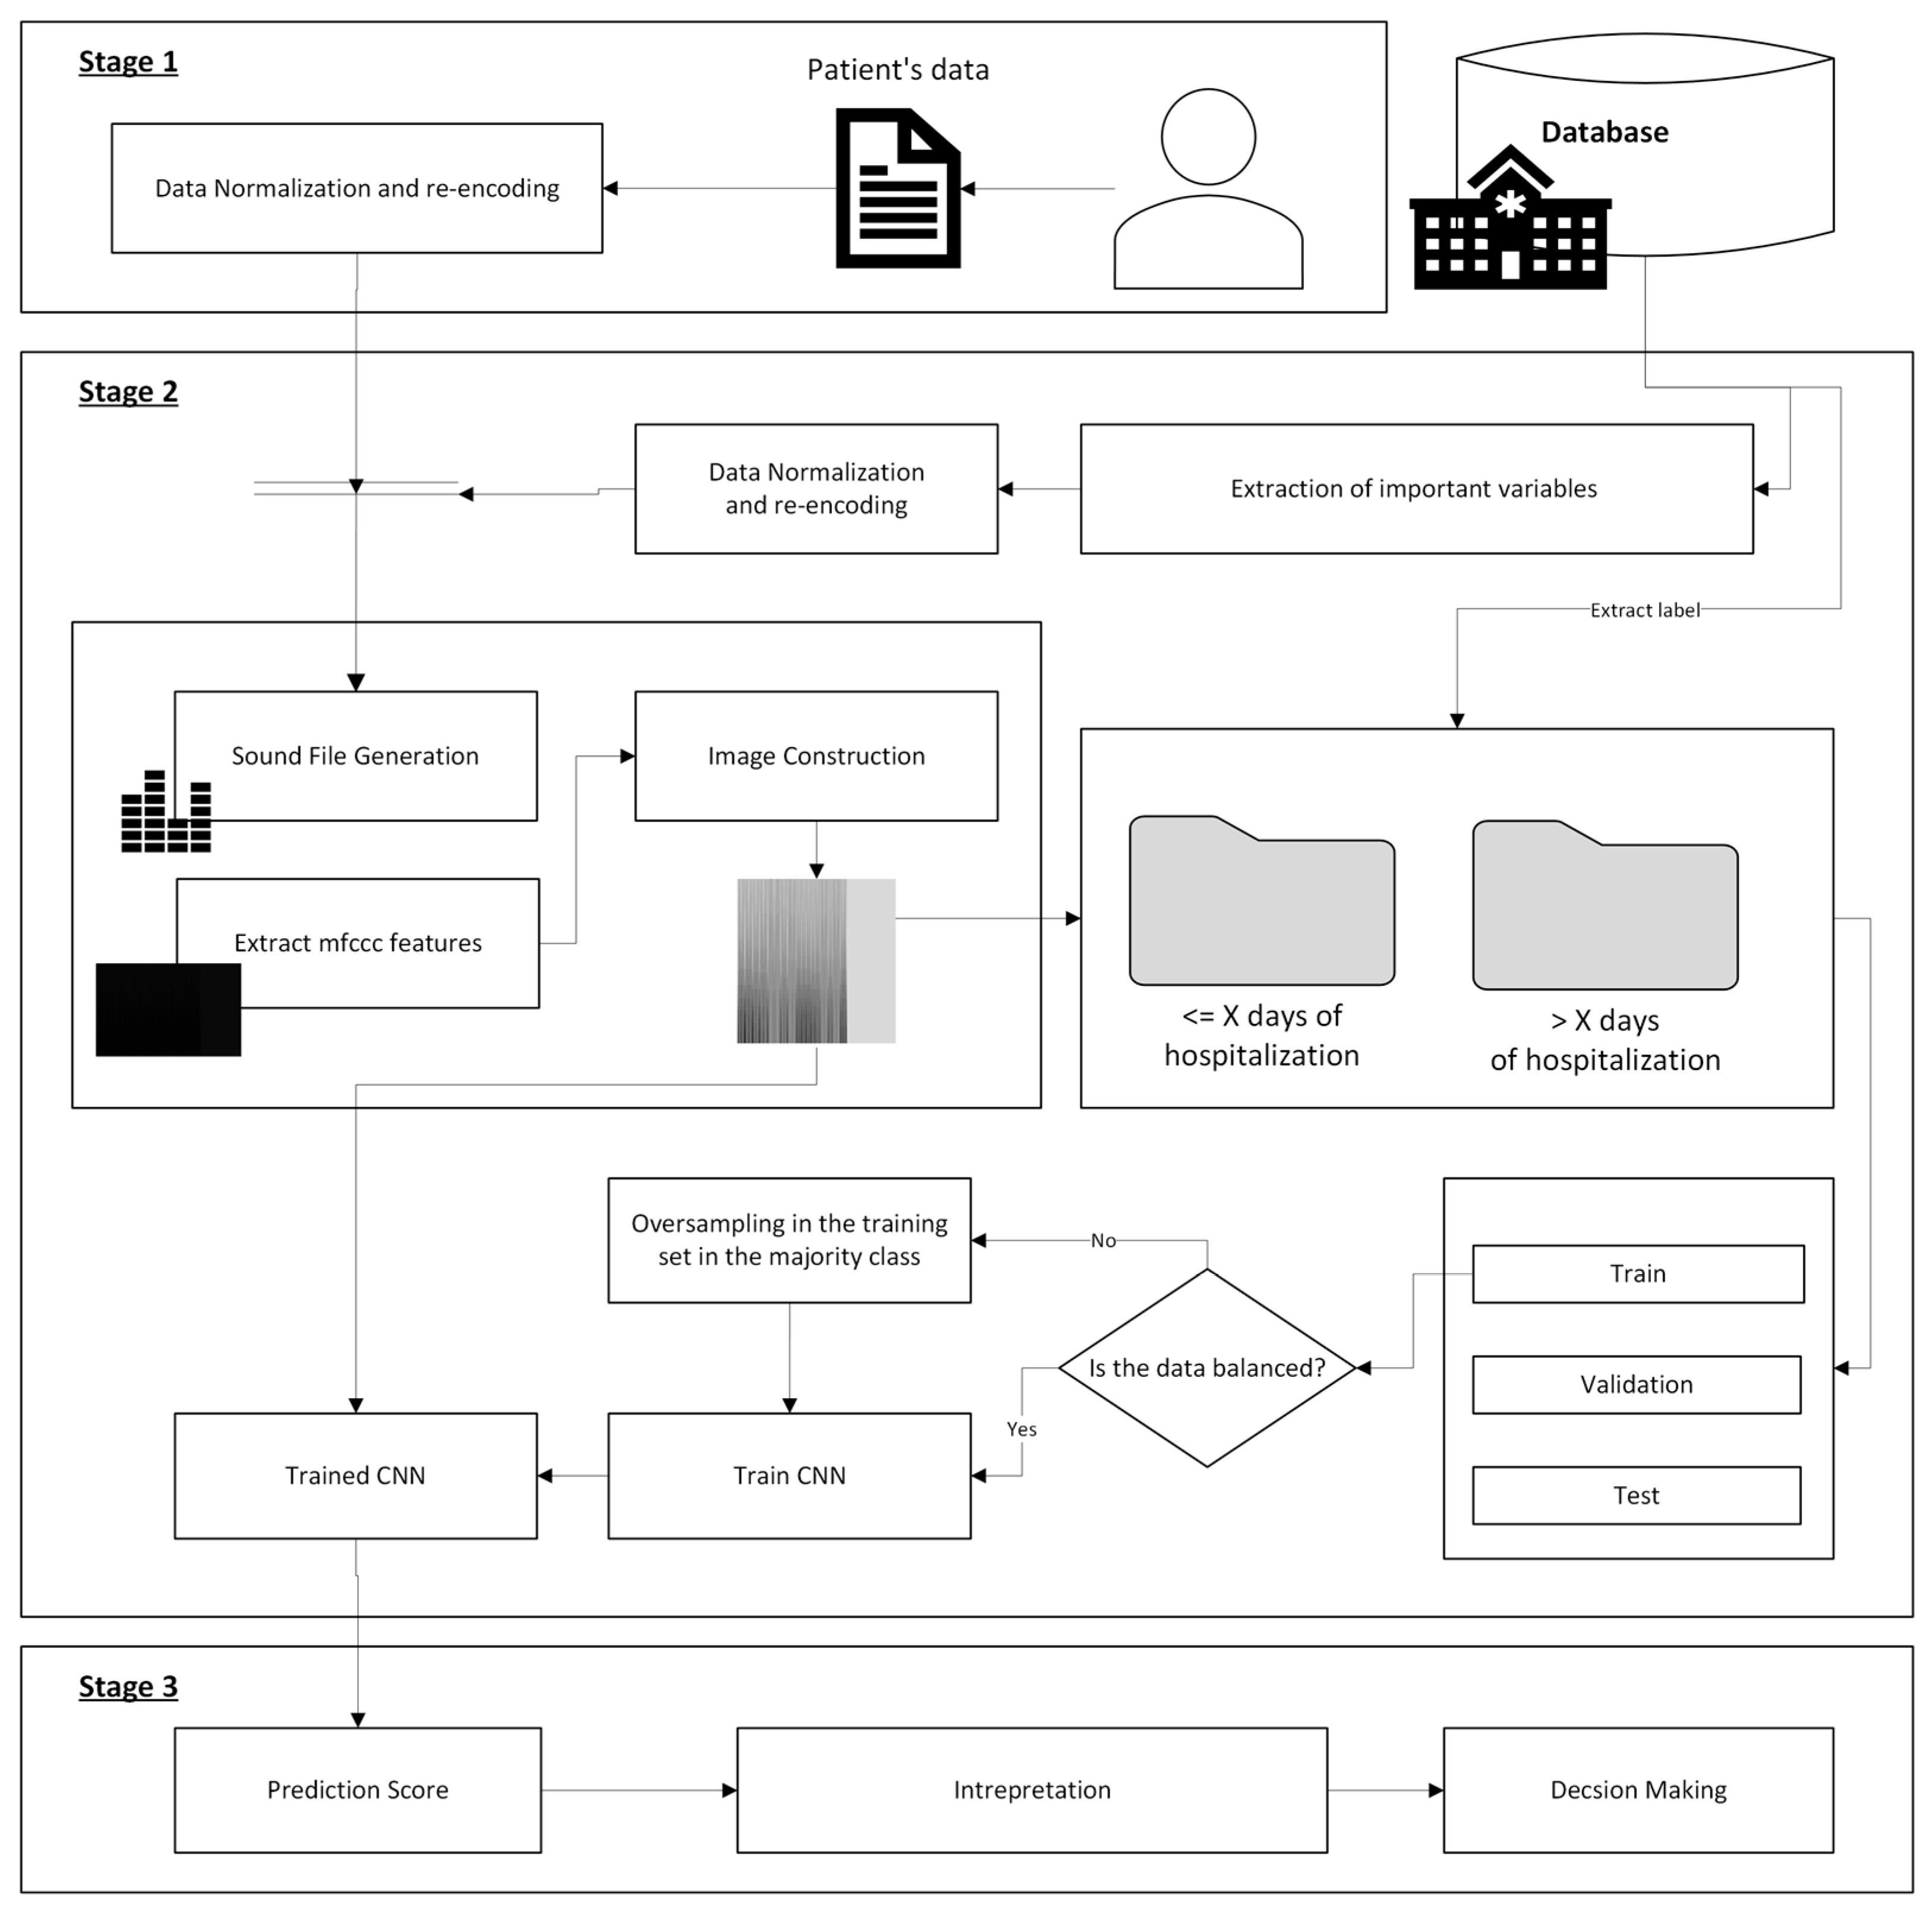
Figure 1. Flow diagram of the intelligent decision support system. It illustrates the progression of information through three stages. Stage 1 involves the collection of patient data and the extraction of relevant clinical variables. Stage 2 introduces a novel data formalization process, transforming inputs into image-based representations for inference using a Convolutional Neural Network. Stage 3 focuses on interpreting the results and generating clinical recommendations.
Asi 08 00128 g001
Figure 4. Architecture of the proposed CNN model.
Asi 08 00128 g004
Figure 5. ROC curve with calculated AUC value for hospitalization at 6 days.
Asi 08 00128 g005
Figure 6. Confusion matrix for the model with a threshold of 6 days.
Asi 08 00128 g006
Figure 7. ROC curve with calculated AUC value for hospitalization at 10 days.
Asi 08 00128 g007
Figure 8. Confusion matrix for the model with a threshold of 10 days.
Asi 08 00128 g008
Figure 9. Capture of the results obtained in the case study.
Asi 08 00128 g009
Table 1. Summary of the variables.
VariableTypeObservation
SexCategoricalMale (1)/Female (0)
AgeNumerical-
BMI (kg/m2)Numerical-
Active smokerCategoricalYes (1)/No (0)
High ingestion of alcoholCategoricalYes (1)/No (0)
Other drugsCategoricalYes (1)/No (0)
Previous year hospitalizationsCategoricalYes (1)/No (0)
Number of hospitalizations in
the previous year
Numerical-
Number of positive sputum culturesNumerical-
Pneumococcal vaccinationCategoricalYes (1)/No (0)
Eosinophils (total/uL)Numerical-
FEV1 (%)Numerical-
Dyspnea mMRC scoreNumerical-
CAT scoreNumerical-
AnemiaCategoricalYes (1)/No (0)
CardiopathyCategoricalYes (1)/No (0)
Obstructive sleep apneaCategoricalYes (1)/No (0)
Depression/AnxietyCategoricalYes (1)/No (0)
Arterial HypertensionCategoricalYes (1)/No (0)
ArteriopathyCategoricalYes (1)/No (0)
DiabetesCategoricalYes (1)/No (0)
CancerCategoricalYes (1)/No (0)
Continuous home oxygen therapyCategoricalYes (1)/No (0)
Home non-invasive ventilationCategoricalYes (1)/No (0)
Type of residenceCategoricalOwns Property (0)/Other situation (1)
Monthly income EUR > 800CategoricalYes (1)/No (0)
WorkingCategoricalActive (0)/Pensioner (1)
Living aloneCategoricalYes (1)/No (0)
CaretakerCategoricalYes (1)/No (0)
Uses social servicesCategoricalYes (1)/No (0)
Social RelationshipsCategoricalNobody or Family (0)/Friends and Neighbors (1)
Number of basic activities of daily living with dependency (BADL)NumericalThe number of basic activities for which the individual is dependent is recorded. There are 5 (eating, dressing, taking a bath, going to the toilet, moving), so they vary in a range from 0 to 5.
Number of instrumental activities of daily living with dependency (IADL)NumericalThe number of instrumental activities for which the individual is dependent is recorded. There are 8 (help with food preparation, house cleaning, laundry, telephone use, shopping, financial management, transport, and medication), so they vary in range from 0 to 8.
Table 2. Results of evaluation metrics for a threshold of 6 days.
PrecisionRecallF1-ScoreAccuracySensitivitySpecificity
≤6 days0.770.790.780.760.790.72
>6 days0.750.720.73
Table 3. Results of evaluation metrics for a threshold of 10 days.
PrecisionRecallF1-ScoreAccuracySensitivitySpecificity
≤10 days0.940.740.830.750.740.80
>10 days0.420.800.55
Table 4. Comparison with conventional machine learning models for a 6-day threshold.
ModelCommentAUC Value
Decision Trees-0.63
Random ForestNumber of estimators = 1000.65
Random ForestNumber of estimators = 2000.65
SVMC parameter (box constraint level) = 1; kernel scale mode = automatic; kernel = gaussian0.61
SVMC parameter (box constraint level) = 1; kernel scale mode = automatic; kernel = linear0.58
SVMC parameter (box constraint level) = 1; kernel scale mode = automatic; kernel = quadratic0.61
SVMC parameter (box constraint level) = 1; kernel scale mode = automatic; kernel = cubic0.62
K-Nearest NeighborsNumber of neighbors = 5; distance = Euclidean0.58
K-Nearest NeighborsNumber of neighbors = 100; distance = Euclidean0.62
Naïve Bayes--0.57
Multilayer PerceptronNumber of fully connected layers = 2; number of neurons = 100 for the 1st layer and 50 for the 2nd; activation function = ReLU; iteration limit = 3000.6
Table 5. Comparison with conventional machine learning models for a 10-day threshold.
ModelCommentAUC Value
Decision Trees-0.62
Random ForestNumber of estimators = 1000.55
Random ForestNumber of estimators = 2000.53
SVMC parameter (box constraint level) = 1; kernel scale mode = automatic; kernel = gaussian0.38
SVMC parameter (box constraint level) = 1; kernel scale mode = automatic; kernel = linear0.39
SVMC parameter (box constraint level) = 1; kernel scale mode = automatic; kernel = quadratic0.42
SVMC parameter (box constraint level) = 1; kernel scale mode = automatic; kernel = cubic0.50
K-Nearest NeighborsNumber of neighbors = 5; distance = Euclidean0.43
K-Nearest NeighborsNumber of neighbors = 100; distance = Euclidean0.47
Naïve Bayes--0.54
Multilayer PerceptronNumber of fully connected layers = 2; number of neurons = 100 for the 1st layer and 50 for the 2nd; activation function = ReLU; iteration limit = 3000.43
Table 6. Patient data.
VariablePatient
BMI32.89
FEV1 (%)28
Age59
CAT score14
Eosinophils (total)720
IADL modified5
BADL modified0
Dyspnea mMRC score2
Arterial HypertensionYes
Chronic home oxygen therapyYes
Income (EUR > 800)No
Type of residencyOther situation
Previous year hospitalizedNo
Cardiopathy Yes
Pneumococcal vaccinationYes
Number of previous hospitalizations in the previous year0
Disclaimer/Publisher’s Note: The statements, opinions and data contained in all publications are solely those of the individual author(s) and contributor(s) and not of MDPI and/or the editor(s). MDPI and/or the editor(s) disclaim responsibility for any injury to people or property resulting from any ideas, methods, instructions or products referred to in the content.