Abstract
This paper proposes an experimental design to publish online the measurements obtained from four sensors: one sensor inside a cistern measures the level of drinking water, another sensor in a water tank monitors its level, a third sensor measures water flow or pressure from the pipes, and a fourth sensor assesses water quality. Several tank filling and emptying tests were performed. Experimental results demonstrated that if the cistern perceived that there was no water in the tank, it turned on the water pump to fill the tank to 100% of its storage capacity; while this was happening, the water level in the cistern and tank, the flow of water from the piped water, and the quality of the water could be visualized on a dashboard. In short, this proposal monitors water levels and flows through the Internet of Things. Data collected by sensors are posted online and stored in a database.
1. Introduction
In neighborhoods of a city where drinking water is scarce during the dry season or due to the effect of the law of gravity in hills or high areas, it is necessary to know the water level in a cistern or a tank to optimize water consumption in the home. A problem lies in the need to open the cistern lid, visually check the water level in the tank, and corroborate the water pressure brought by the municipal water in charge of supplying and refilling the cistern. For this purpose, clearing the garage, opening and lifting the cistern lid, observing the water level, and replacing the cistern lid is necessary.
In drinking water shortages, this task may need to be performed daily to eliminate any uncertainty about the water level at a given time. Typically, this check might be required every three to four days. If the water level is not monitored, there is a risk of running out of water because of not knowing its levels. Many households need to remember to check their cisterns, and if they do not manage water effectively, they could run out of drinking water.
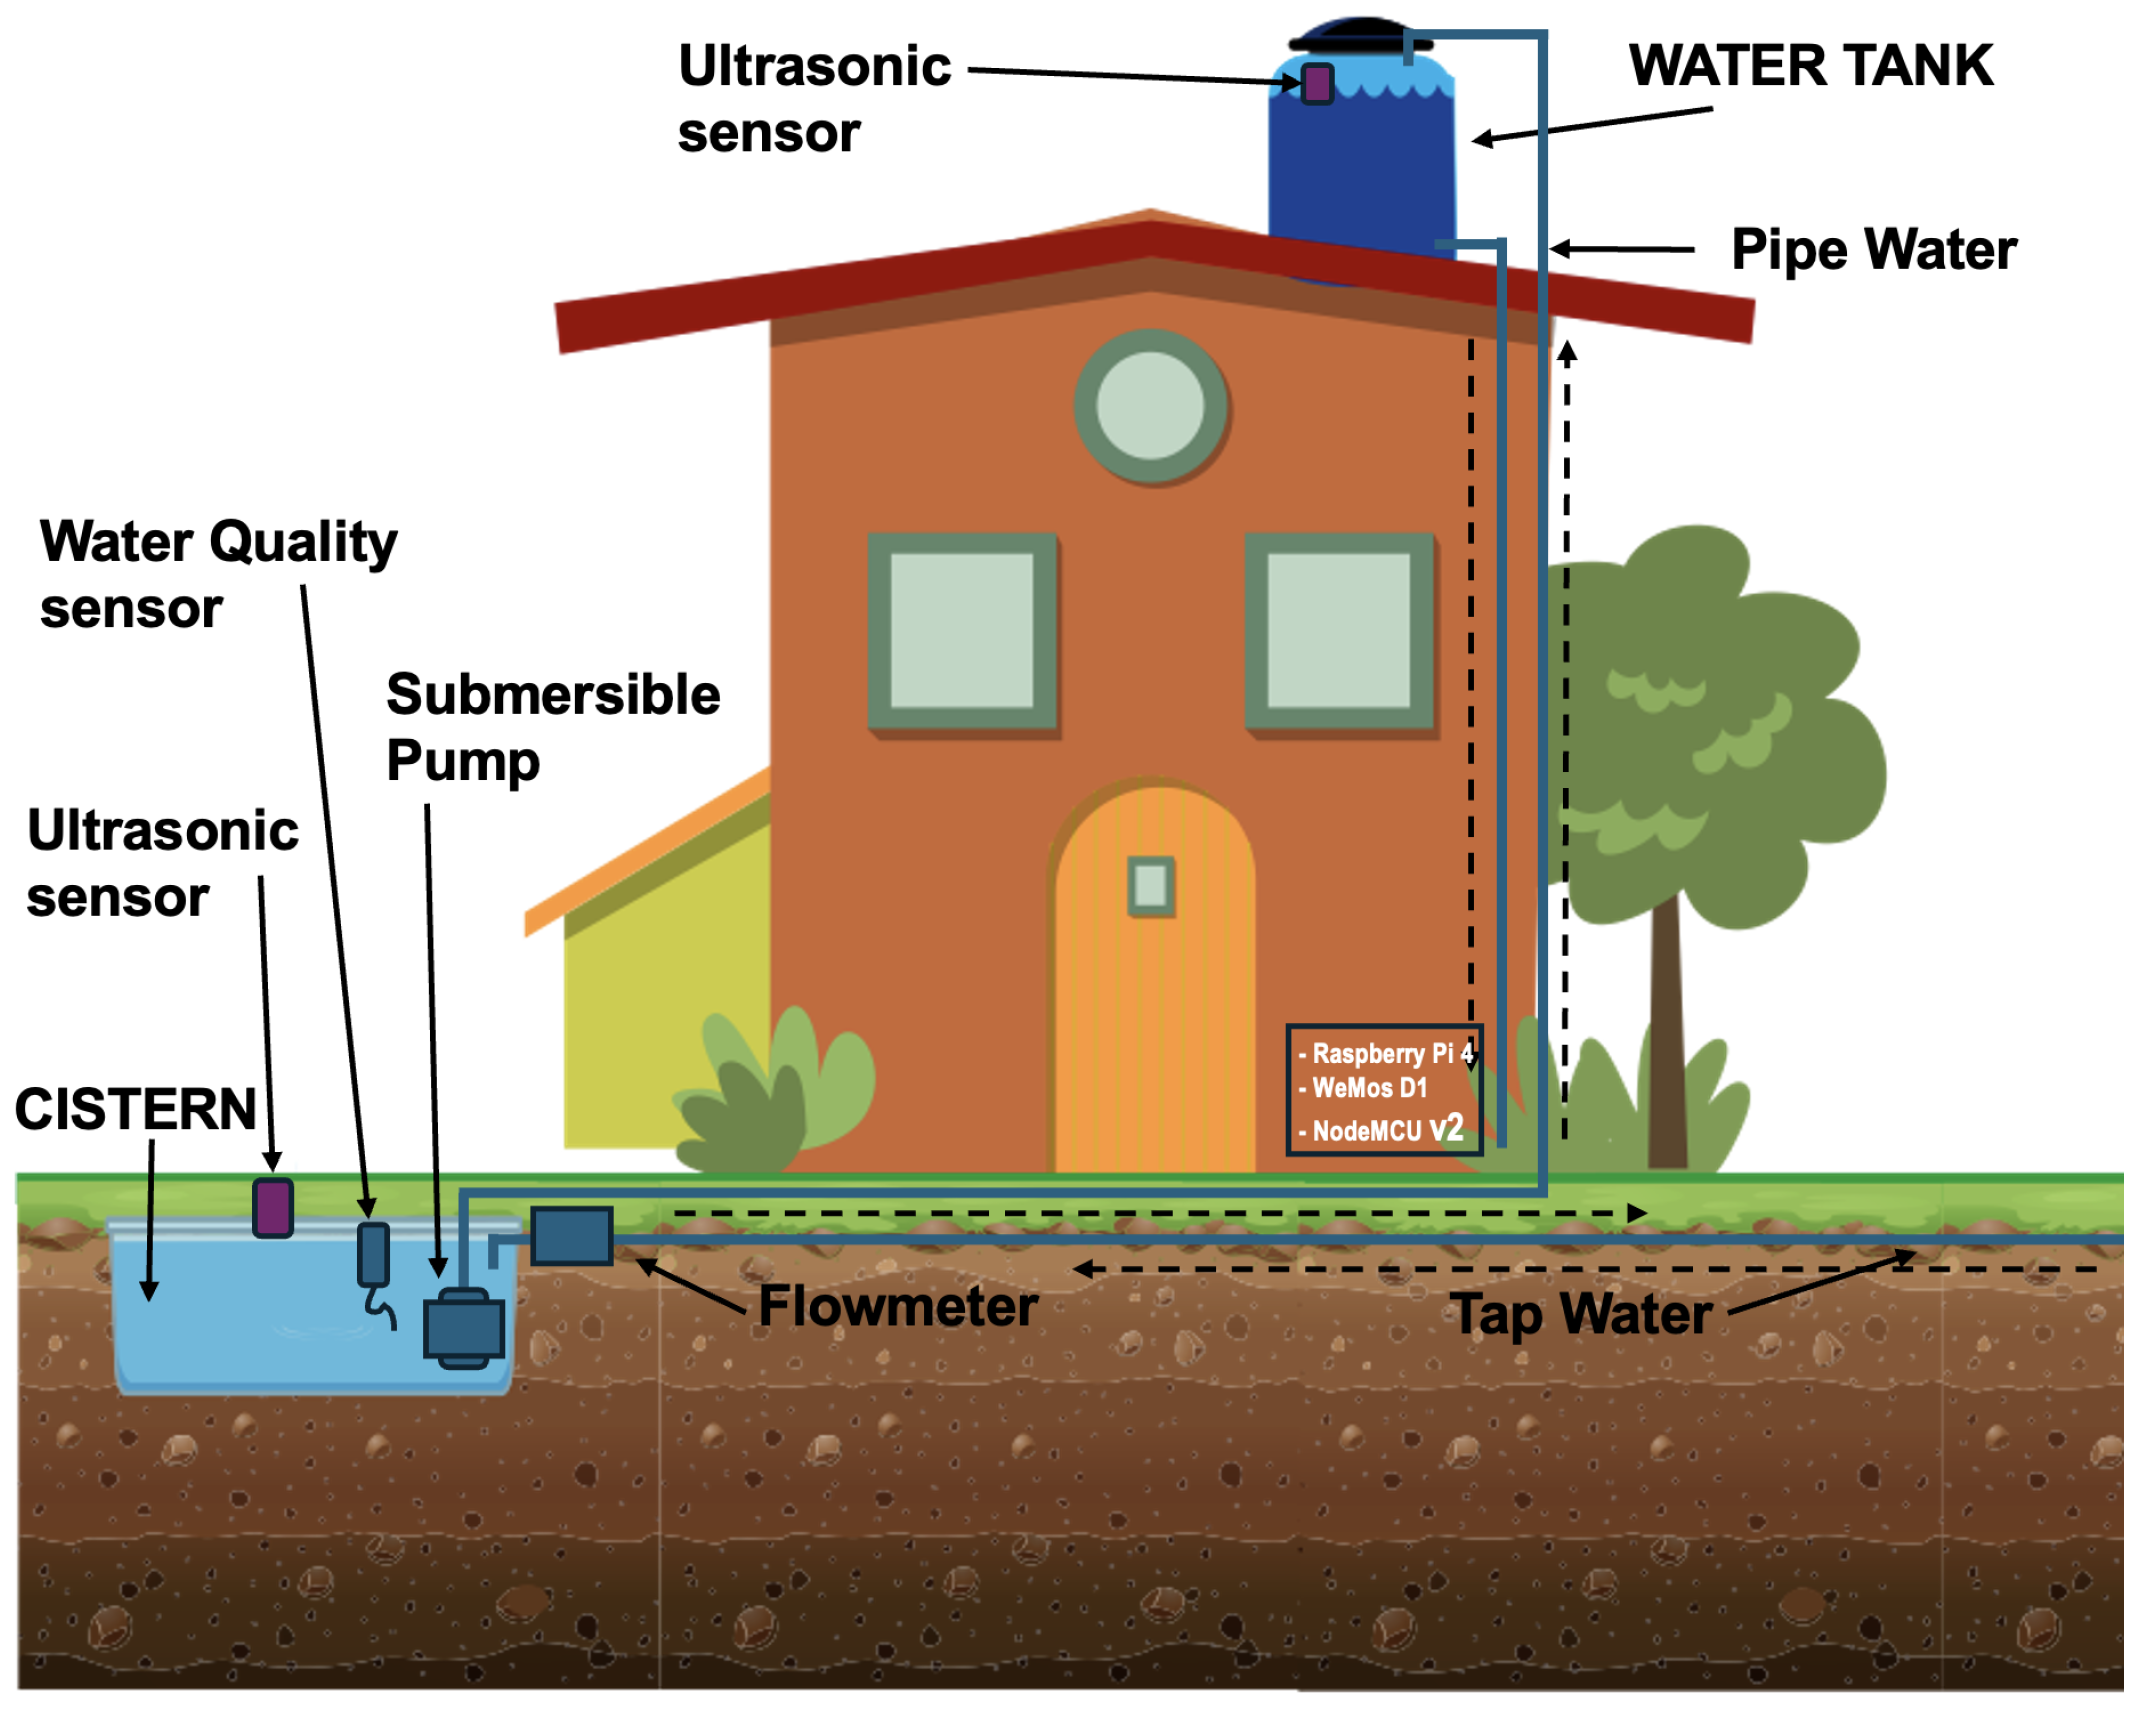
Considering the issues outlined earlier and utilizing the standard water tanks and cisterns shown in Figure 1, e.g., water tank capacity of 1100 L and cistern 5000 L, the research question targeted by this paper is as follows: How can an IoT system enhance efficiency in domestic water management by delivering precise data on water levels in cisterns and tanks, as well as on flow rates and water quality?

Figure 1.
General scheme of the water monitoring system.
Given the problems described above, we propose a method of knowing the water level in a tank in real time without looking at it. This monitoring can be observed through an Internet interface (Node-RED dashboard). We also intend this method to know the water pressure to calculate the tank’s time to refill. The quality of the drinking water, e.g., whether it is too cloudy or contains mud, rust, or other residues, can be monitored.
To achieve the above, we propose publishing four types of measurements on the Internet to be sensed from a drinking water cistern, thereby avoiding visually checking these variables. As mentioned, we propose measuring the following: 1. water level in the cistern, 2. water level in the water tank, 3. water flow or tap water pressure in the area, and 4. quality of the water that comes from a public drinking water pipeline. A water tank is filled when the water level is below 50% of its capacity. A submersible pump with a hose brings water from the cistern to the tank.
This paper is organized as follows: Section 2 reviews various solutions for automatic water level monitoring systems and related projects. Section 3 details our Monitoring of Water Architecture, including a description of the water tank and cistern system and the corresponding electronic circuit diagrams. Section 4 presents specific experimental results. Section 5 discusses results obtained in experiments. Finally, Section 6 concludes this study.
2. Related Work
IoT solutions have enabled advances in water monitoring and control systems, which address problems such as water scarcity, waste, and pollution. This paper briefly reviews the different approaches and technologies used in this field.
2.1. Automatic Water Level Monitoring Systems
Several studies have proposed systems to automatically monitor and control tank water levels using ultrasonic sensors and microcontrollers. For example, Jan et al. developed an IoT-based system to monitor water levels, detect leaks, and control motors in smart tanks, improving water use efficiency and reducing waste [1]. Malche and Maheshwary presented a water level monitoring system for smart villages in India, utilizing an IoT-based architecture that includes sensors connected to a network for real-time monitoring [2]. Another approach was presented by Durga et al., who proposed an autonomous water tank filling system using embedded sensors and GSM modules to improve water distribution efficiency [3]. Ali and Choi reviewed some existing methods for monitoring leakage in underground pipelines, the sinkholes caused by these leakages, and the viability of wireless sensor networking for monitoring leakages and sinkholes [4]. Kurniawan et al. [5] proposed a system for knowing the water level in real time using an ultrasonic sensor to transmit data to a microcontroller (Wemos) in the form of height data; the Wemos converts water level data into the volume of water in the tank. Jayalakshmi proposed a water monitoring system to solve water wastage problems using IoT and Android apps. This project intends to improve real-time data collection, analysis, and remote management, optimizing resource usage and mitigating environmental impact [6]. Singh et al. proposed a water level monitoring system using an ultrasonic sensor to monitor and control the water level in the water tank. The system is designed to help residents monitor the tank’s water level and turbidity to reduce water wastage [7]. Zhukovskyy et al. designed a system that improves the capabilities of the existing water-monitoring business using a web-based information system. IoT devices send the data through several channels: cellular, satellite, or Internet [8].
2.2. Energy Consumption Optimization in Water Systems
Studying the issue of energy efficiency is another key research area in the development of IoT-based water systems. Cheng et al. presented an IoT-based water-dispensing system to optimize energy consumption by adjusting configurable parameters such as the sterilization time and sleep mode duration, resulting in significant energy savings during low usage [9] Cheng. On the other hand, Gunde et al. proposed a Raspberry Pi-based system to control water flow to minimize energy consumption [10]. Monsef et al. proposed estimating the instantaneous water demand based on the recorded network pressures. Based on the estimated instantaneous water demand, another optimization code based on the DE algorithm is presented to control the pressure-reducing valve [11].
2.3. Water Quality Monitoring
Yauri et al., in their work, proposed an IoT-based water quality monitoring system; they used sensor nodes to monitor parameters such as pH, conductivity, and temperature. Cheng et al. also employ the IoT in water containers to monitor water quality by adjusting system parameters to optimize water and energy consumption [9]. Jan et al. surveyed the current status of IoT-based smart water quality monitoring systems for domestic applications. They searched for common water quality monitoring parameters, safety limits for drinking water, and smart sensors and conducted a critical review of IoT-WQMS through a proposed empirical metric [12].
2.4. Wireless Sensor Networks for Water Monitoring
Pujar et al. studied different water monitoring systems based on wireless sensor networks, analyzing water threats like physical, biological, and chemical pollution. The research identifies gaps, such as improved energy efficiency and underwater communication, that must be addressed to improve these monitoring systems [13]. Lambrou et al. performed holistic and low-cost work on the problem of water quality monitoring in drinking water distribution systems. The sensor node consists of several electrochemical and optical sensors installed in the pipes; low cost, lightweight implementation, and reliable long-term operation are highlighted [14].
2.5. IoT Solutions for Rural and Urban Environments
In addition to industrial and rural applications, some studies have focused on urban applications. Cheng et al. presented a solution that employs commercial water dispenser modules and clamp meters to collect consumption data and automatically adjust system parameters in urban environments such as universities [9]. Irianto et al. proposed a water consumption monitoring system for residential tanks using IoT technology, which measures household water consumption and sends the data to a cloud server for real-time analysis [15]. Zhukovskyy et al. proposed a solution for a remote water management device for agriculture. A Tank Toad automates the task of data collection and remote control, reducing workload and drive time. Livestock producers must check water storage levels and operate pumps to effectively care for livestock [16]. In the paper [17], the authors proposed a monitoring method for detecting critical levels of ozone concentrations. They used an automatic process of analyzing plant electrical signals for ozone critical level detection based on the fundamentals of correlation theory. The authors segmented time series measurements of the electrical activity of plants before, during, and after the stimulation. Finally, other work described an innovative monitoring technology used to detect ground-level ozone pollution by deploying a network of wireless devices connected to a collection of plants and used as biosensors. These devices collect and transmit the electrical activity signals generated within the plants and are used to monitor environmental conditions [18].
As we have seen in this brief literature review, there are many solutions for water management, with or without the IoT. Works include automatic water level monitoring systems, energy consumption optimization in water systems, water quality monitoring, wireless sensor networks for water monitoring, and IoT solutions for rural and urban environments.
Table 1 summarizes the main differences of the current proposal compared with other water monitoring solutions.

Table 1.
Comparison between existing solutions and proposed system.
3. Monitoring of Water Architecture
3.1. Brief System Description
Traditionally, house water is stored aboveground (in water tanks) or underground (in cisterns). A house has a water tank on the roof, which stores water that flows down by gravity when a faucet is opened in the kitchen, bathrooms, toilet, shower, garden, etc. A cistern is usually located underground at the front of the house. The cistern is supplied with drinking water by pipes installed throughout the city. The water stored in the cistern is pumped to the water tank by a water pump. The water pump operates automatically by floating inside the tank. When the float drops, a switch is turned on, which activates the water pump. The pump begins to raise water into the water tank and stops when the float rises to its maximum level.
Figure 1 depicts all the sensors, actuators, microcontrollers, etc., used to monitor water level in cistern and tank systems.
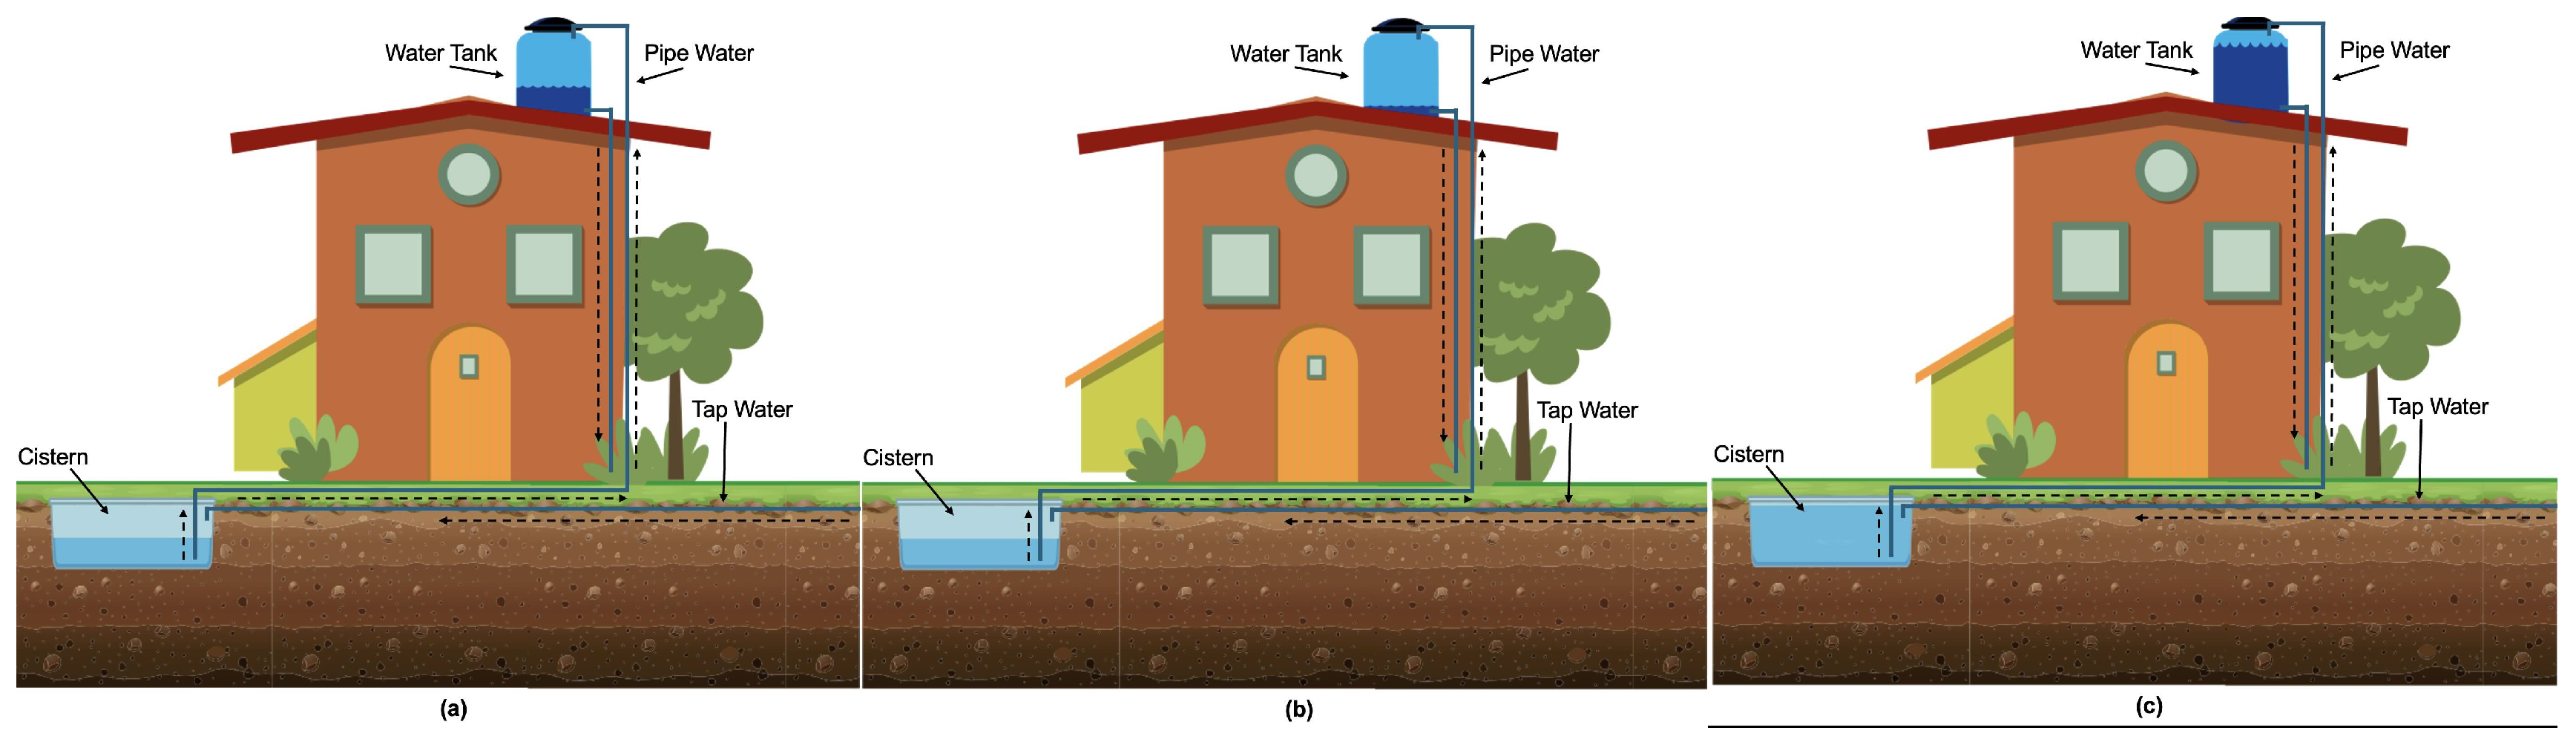
Usually, there can be several states concerning the water level in a water tank and a cistern. We illustrate in Figure 2 three possible scenarios: (a) half-full cistern level and half-full water tank level, (b) half-full cistern level and almost empty water tank level, and (c) full cistern level and whole water tank level. In the same way, the water pipe that arrives at the cistern, the tap water pipe (municipal) that comes out of the cistern and goes up to the water tank, and the water line that comes down from the water tank and enters the house for domestic consumption can be seen.
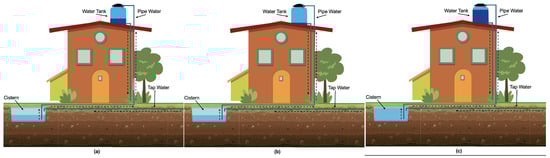
Figure 2.
Monitoring of Water Architecture. (a) Half-full cistern level and half-full water tank level, (b) half-full cistern level and almost empty water tank level, and (c) full cistern level and full water tank level.
After describing the traditional usage of water tanks, cisterns, and water pumps, we propose to monitor the drinking water level of a cistern and publish its status on the Internet. Furthermore, we propose to measure and publish on the Internet the cistern’s water level to decide on time how to save the maximum amount of water; measure and publish on the Internet the water pressure of the pipe that supplies liquid to the cistern; measure and publish on the Internet the water quality provided by the municipal drinking water; measure the water quality to determine whether the tap water brings in a lot of waste or other materials; provide information to make appropriate decisions regarding the sensed variables (water level, water flow, and water quality); and save drinking water as much as possible.
3.2. Devices
The devices described in Table 2 were used to carry out the proposal; we used open-source tools. All of them were required for this project. Furthermore, some programming code was used to connect all the devices.
Table 2.
Materials and equipment used in the proposal. Some elements are software, and others are hardware.
3.3. Components
Below are photographs of some of the main devices used in the proposed system.
Ultrasonic sensor: This sensor emits ultrasonic waves and changes the state of this reception. The time it takes between going and returning for these waves is obtained for a distance between the sensor and some object, in our case, the water surface. We use two sensors to measure the water level in both the cistern and the tank. See Figure 3a.
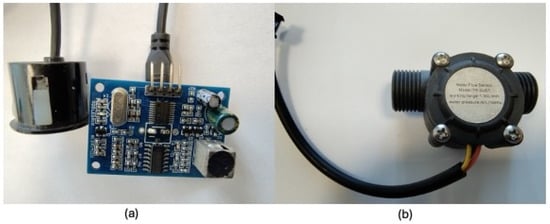
Figure 3.
(a) Water level sensors (Ultrasonic Sensor JSN-SR04T-2.0). (b) Water flow sensor (Flow meter YF-SF01 3/4″ Hall Effect).
Flow meter: The sensor measures the water flow from the tap water into the cistern. See Figure 3b.
Water quality sensor: It is used to determine the number of particles of solids per million (ppm); it can detect the amount of particles dispersed in the water. See Figure 4a.
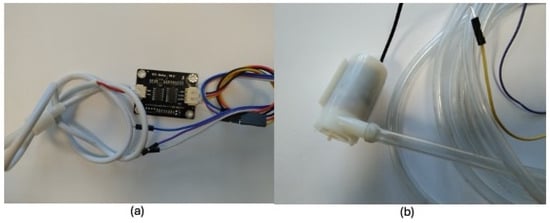
Figure 4.
(a) Water quality sensor (TDS Meter V1.0). (b) Submersible water pump 70-120L/H.
Submersible pump: It is used to raise water into the tank when the tank reaches 50% or less of its level, at which time the pump is activated and begins to suck water from the cistern; the pump stops when the tank is full (100%). See Figure 4b.
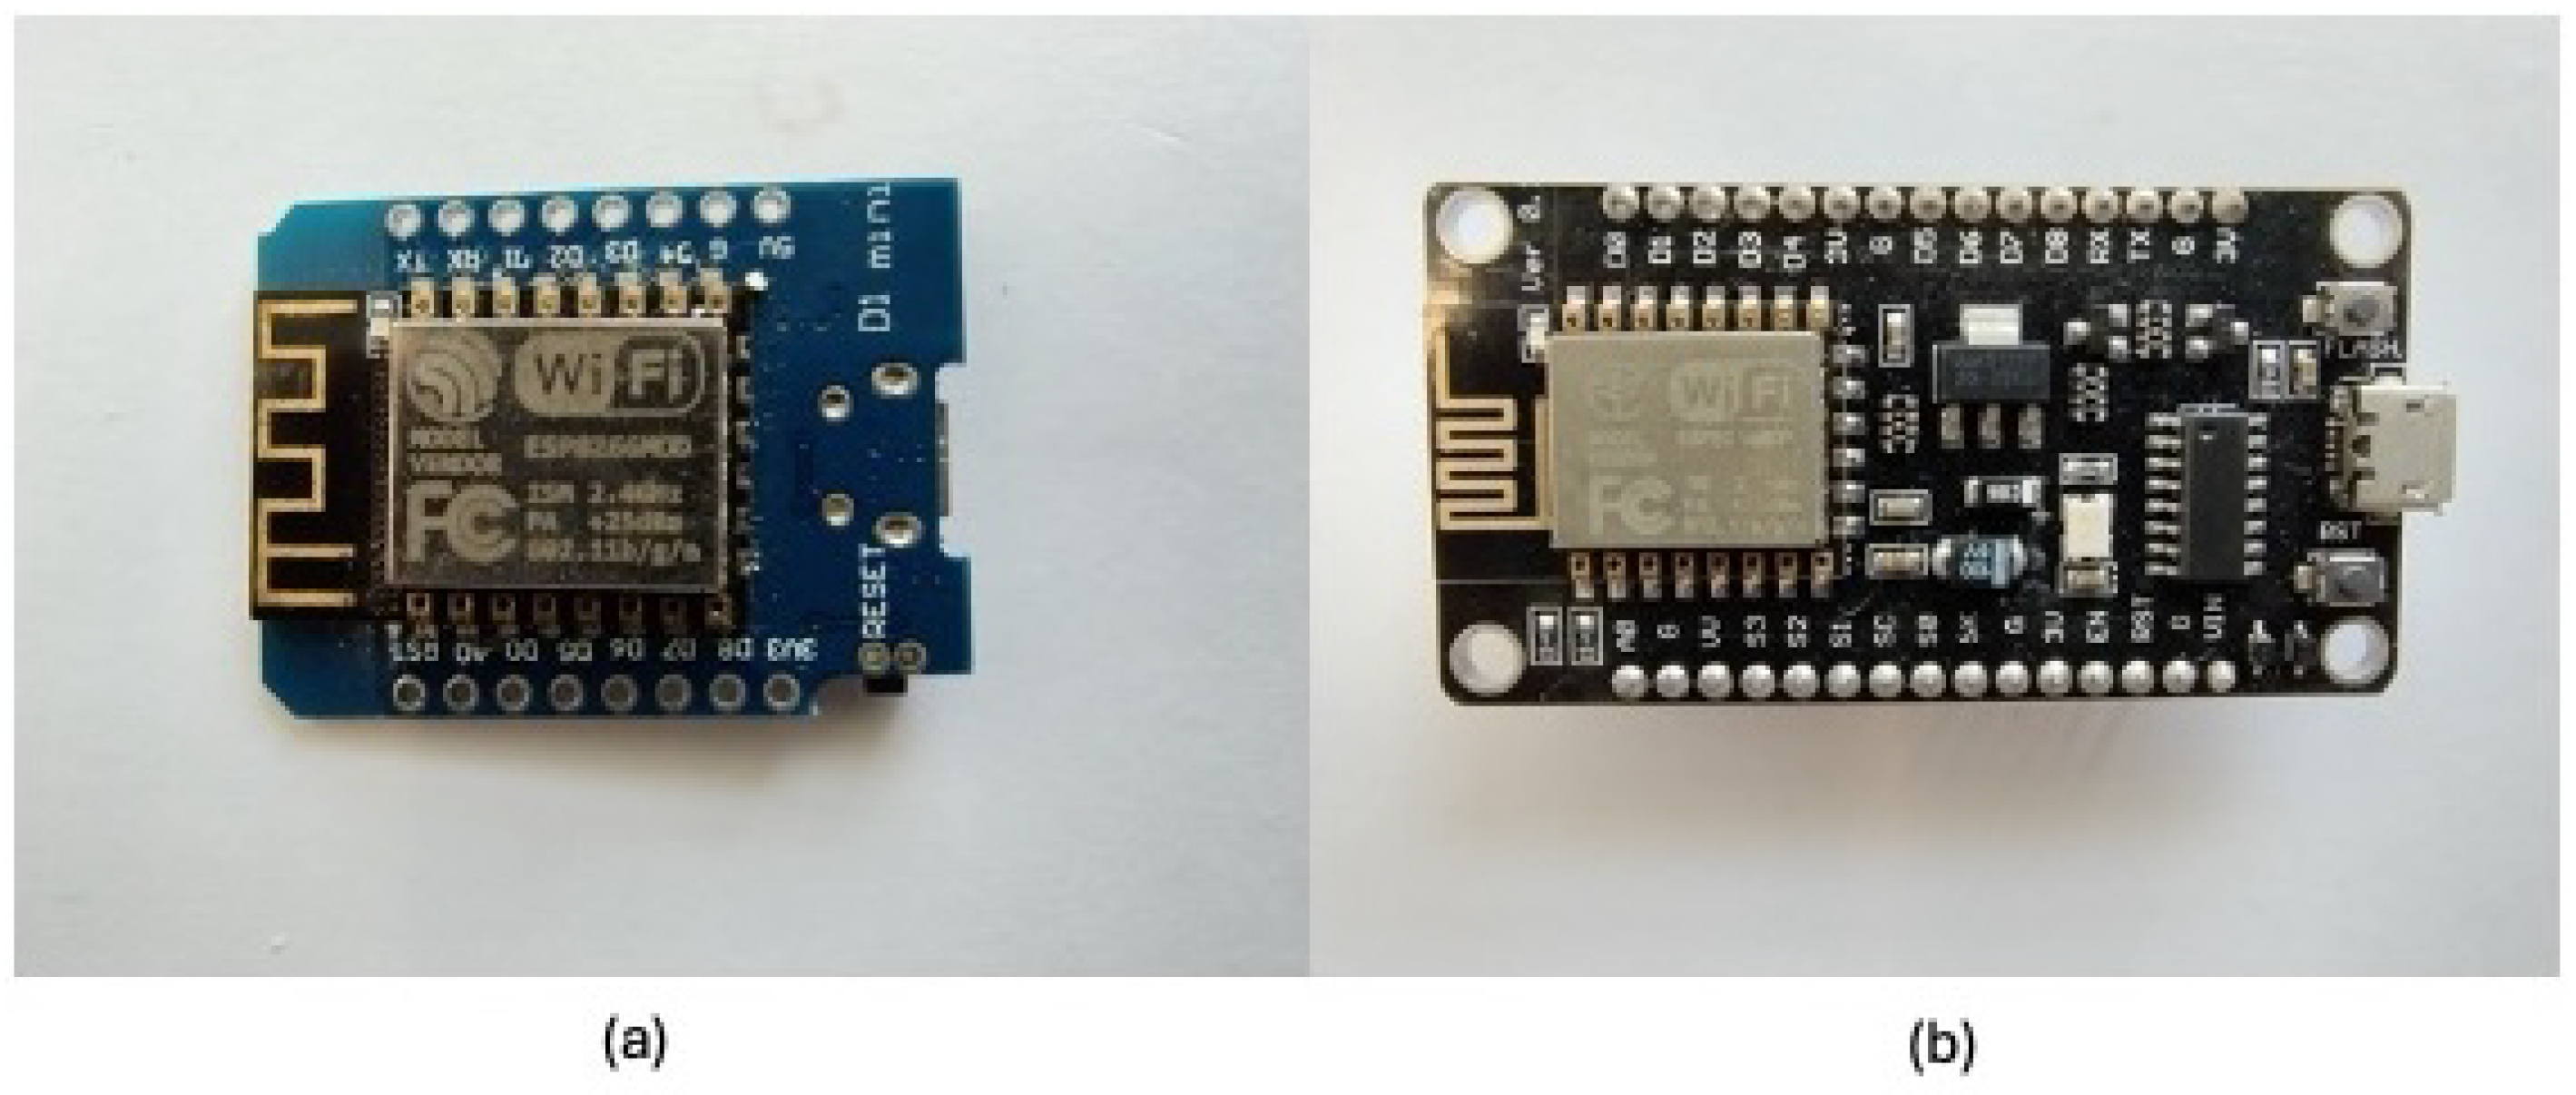
WeMos D1 mini ESP8266 WiFi is a microcontroller configuring a sensor node with an ultrasonic waterproof sensor using the Arduino programming environment. See Figure 5a. NodeMCU v2 ESP8266 WiFi is an open-source software and hardware development environment built around an inexpensive system-on-a-chip (SoC) called ESP8266. See Figure 5b.
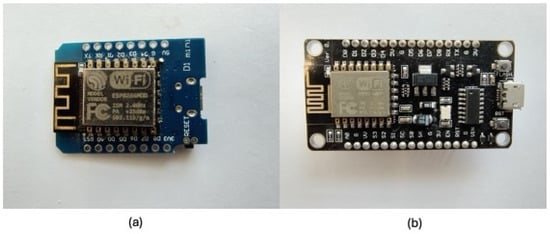
Figure 5.
(a) WeMos D1 mini ESP8266 WiFi. (b) NodeMCU v2 ESP8266 WiFi.
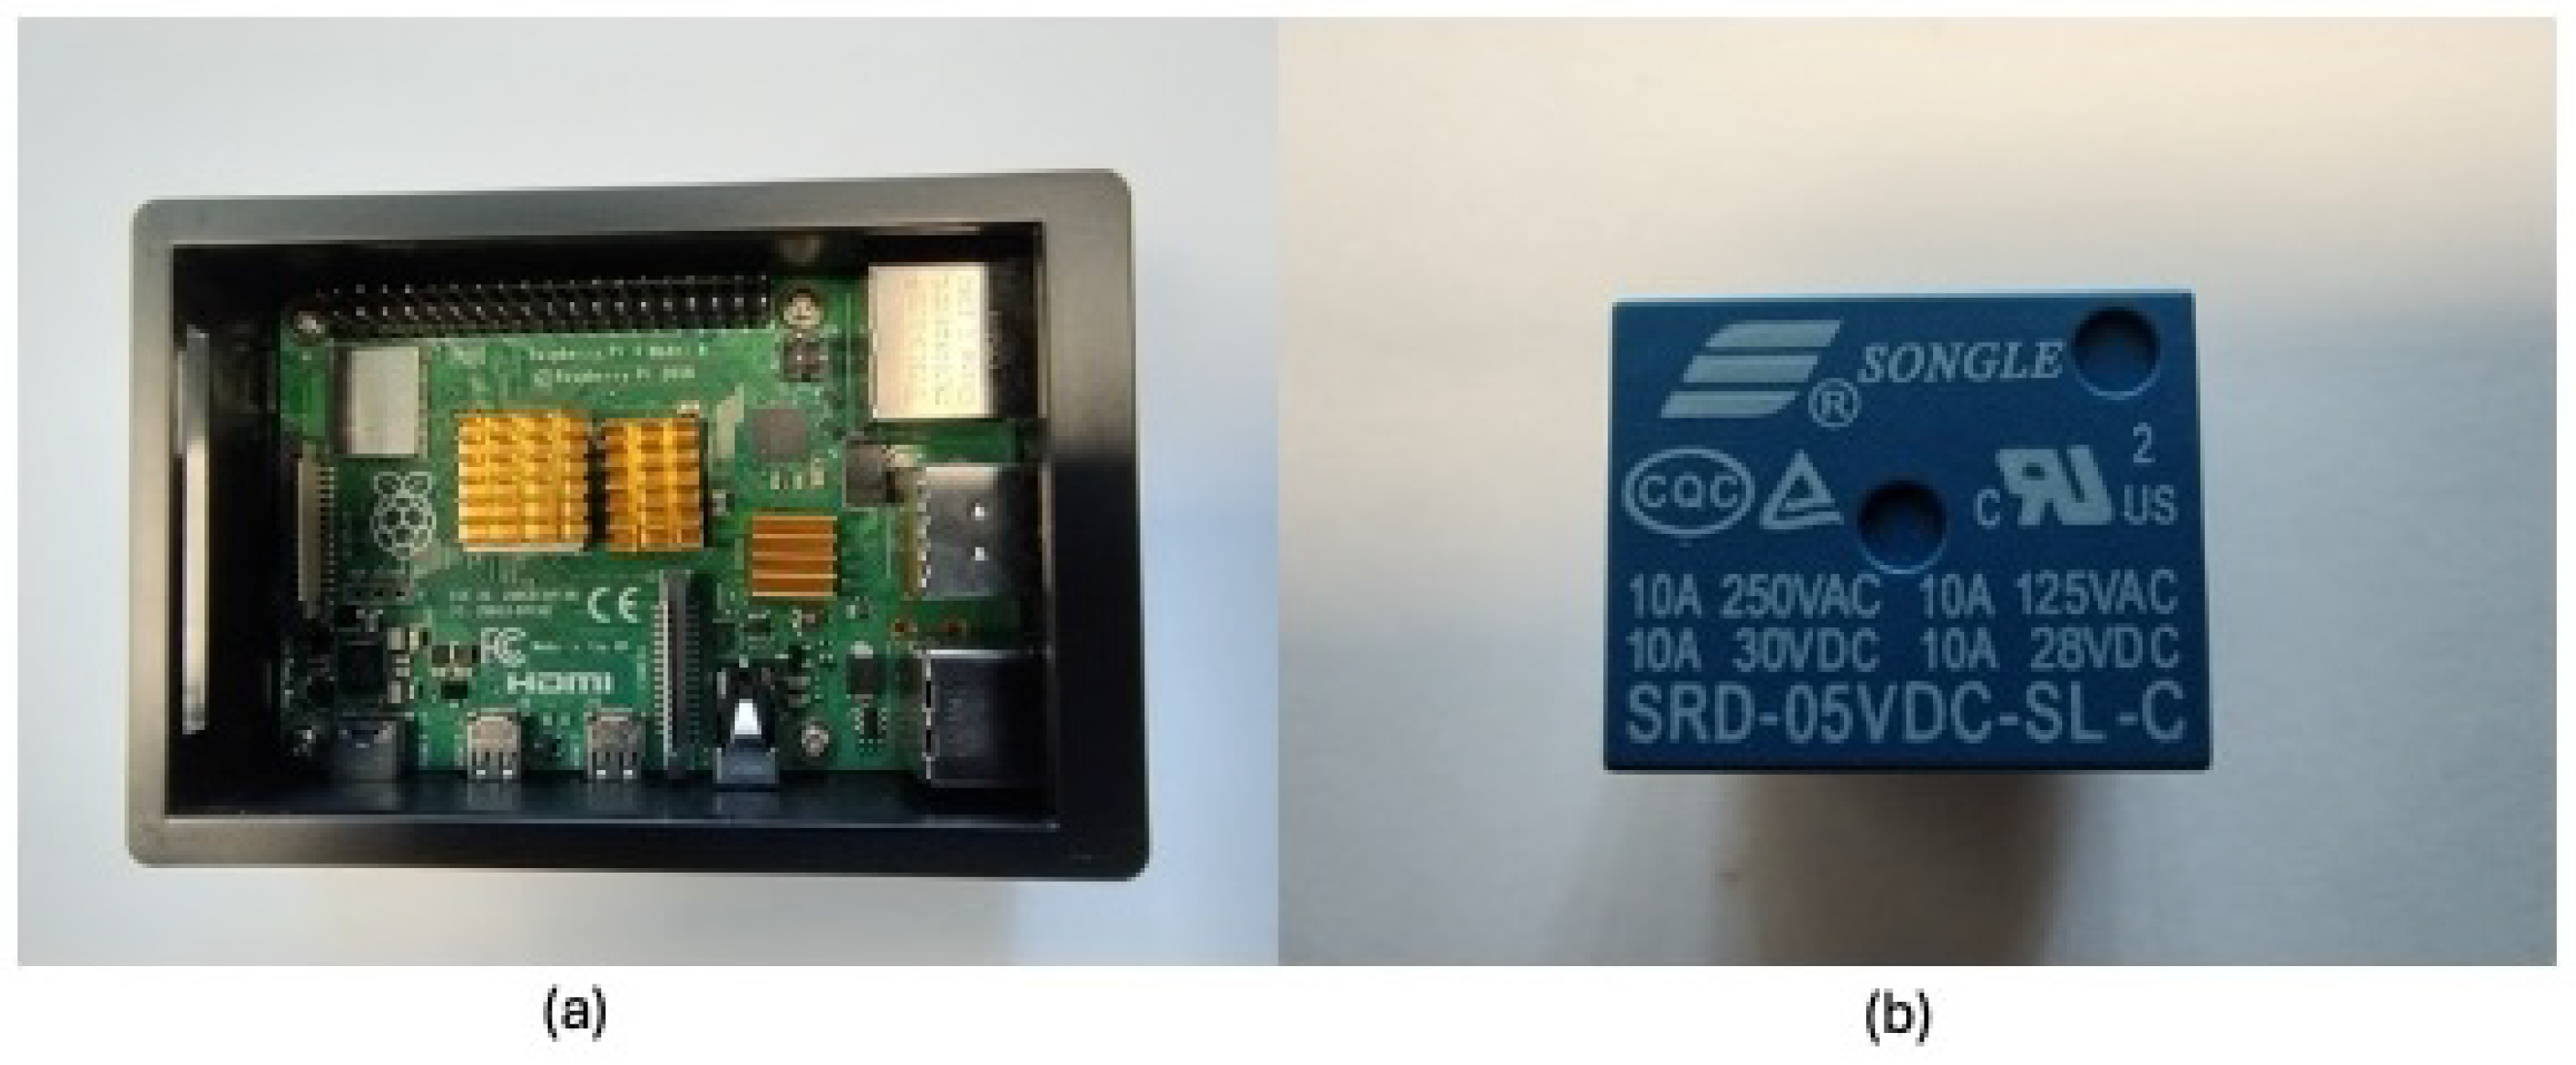
Raspberry Pi 4: The single board computer is used to configure it as an MQTT (MQTT stands for Message Queuing Telemetry Transport. It is a lightweight messaging protocol for use in cases where clients need a small code footprint, are connected to unreliable networks, or have limited bandwidth resources) broker for the database and display the dashboard showing the data obtained from the sensors. See Figure 6a. Relay Module: An actuator switches on/off the submersible water pump. See Figure 6b.

Figure 6.
(a) Raspberry Pi 4 Model-B 8GB RAM. (b) Relay module. 5V DC SRD-5VDC-SL-C.
3.4. Water Tank and Cistern System Description
We cannot control the water that enters a cistern. However, we can monitor and control the water that leaves the cistern and rises into the tank.
For this reason, we propose designing an experimental system or physical scale model to reproduce two water tanks (cistern and water tank) and an Internet interface that publishes the states or levels measured by these sensors placed inside each water tank.
Figure 7 includes the complete elements that integrate the proposal, including cistern, water tank, flow meter, water quality sensor, and others.
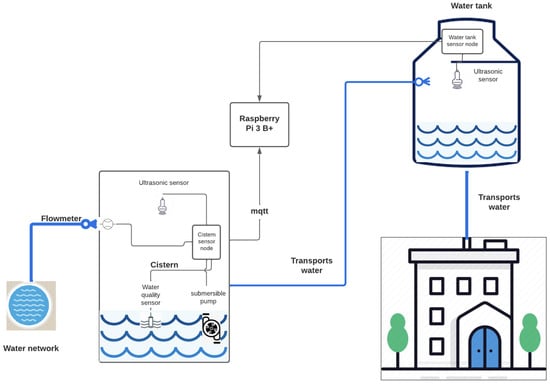
Figure 7.
Descriptive scheme of the proposal.
We are looking at the project from three points:
- Measure and publish the cistern and water tank’s water level on the Internet; with these data, we can promptly know if we should save water to the maximum or use the washing machine and other services.
- Measure and publish the flow or pressure of the pipe that fills the cistern on the Internet and calculate the cistern’s filling time.
- Measure and publish the water quality supplied by the piped water on the Internet. With these data, chlorination of the water is possible.
The ultrasonic sensor on top of the cistern measures the height between the sensor and the water. The water level is calculated from this; the smaller the distance between the sensor and the water, the greater the quantity or volume of water contained in the cistern.
Inside the cistern is a sensor that measures the water quality and a submersible water pump, which raises the tank’s water level when the water level sensor sends the message that the water level is below 50%. A sensor (flow meter) measures the water pressure at the tank’s inlet. This sensor measures the force the water brings to the tank from the municipal water. The higher the flow rate, the more water is expected to fill the tank quickly.
Another ultrasonic sensor is used for the water tank. This sensor is placed on top of the tank and measures the distance between it and the water. The smaller the distance between the sensor and the water, the greater the amount or volume of water in the tank.
3.5. Design of Sensors Monitoring Cistern and Water Tank—Electronic Circuit Diagrams
This section describes the electronic circuit diagram proposed, which consists of two sensor nodes:
- Cistern sensor node.
- Tank sensor node.
These nodes communicate with a single-board computer (Raspberry Pi 4) through the MQTT protocol and a home Internet network configuration.
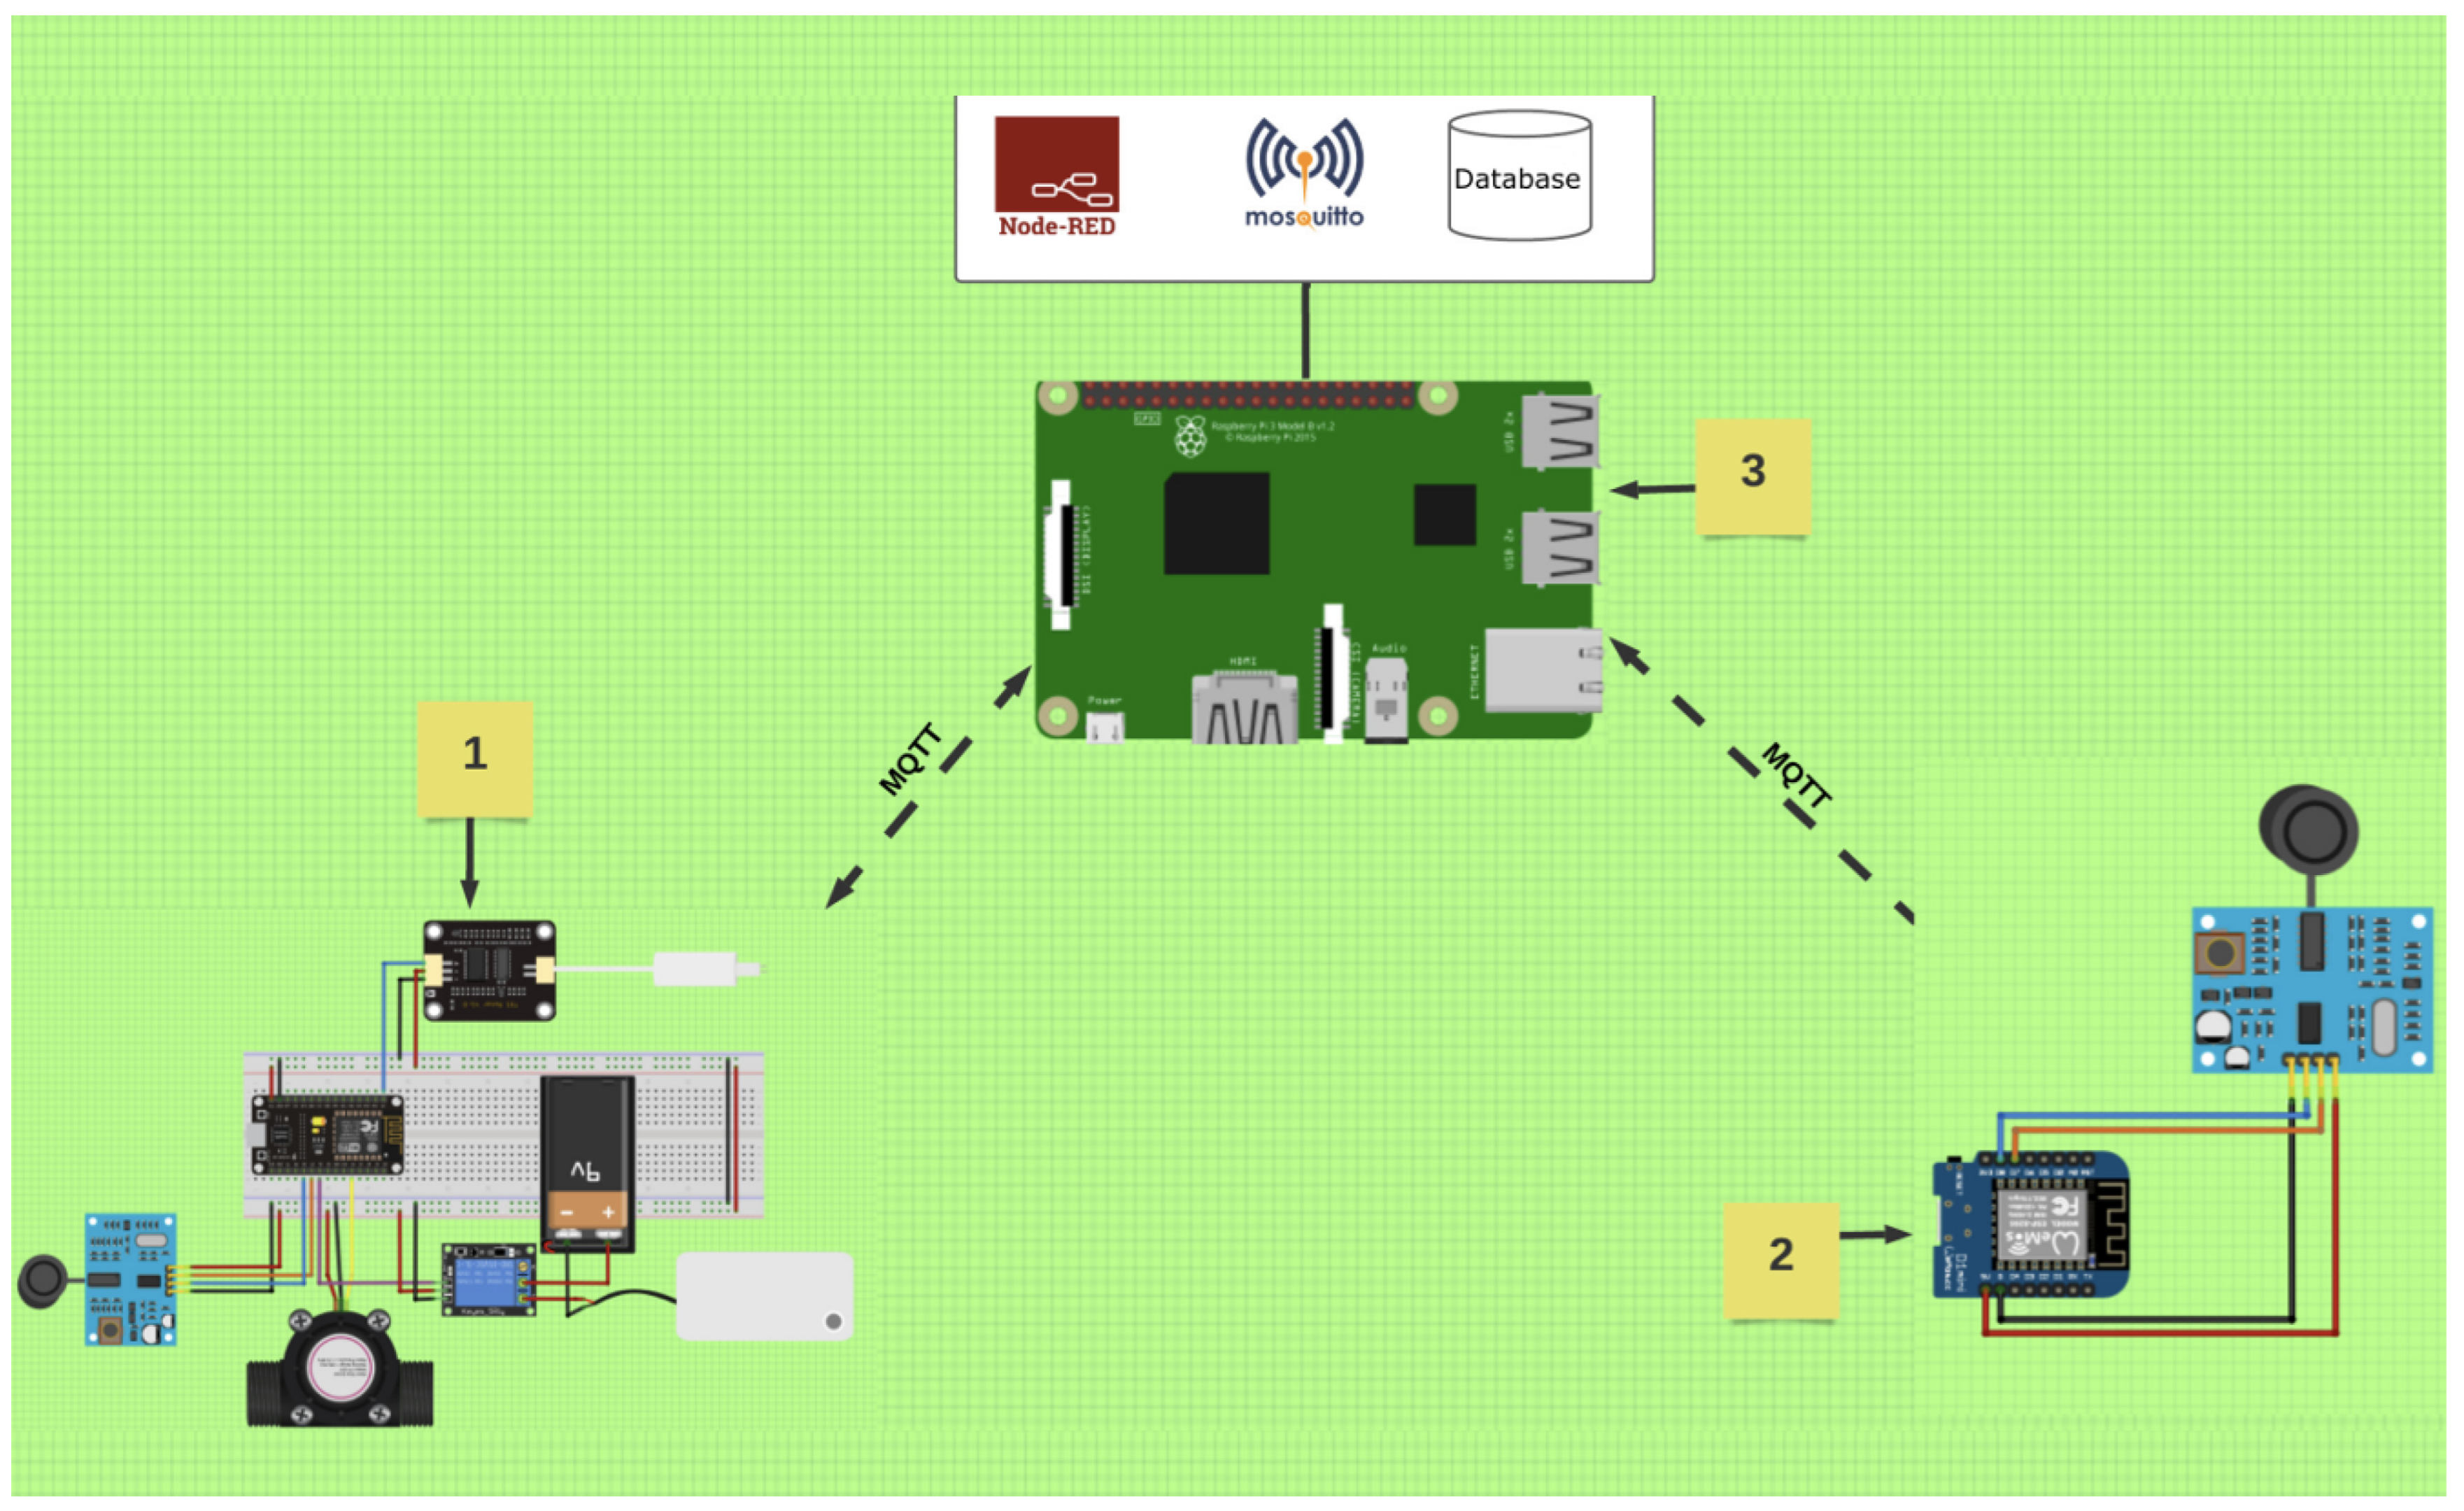
Figure 8 describes the complete architecture of the project: the monitoring of a water tank and cistern using IoT. In Figure 8, numerical labels are placed to identify each sub-circuit and are described as follows:

Figure 8.
General architecture.
- Cistern sensor node: This diagram shows that communication via MQTT is bidirectional since this node publishes and subscribes to the corresponding topics.
- Tank sensor node: This diagram shows that the communication through MQTT is unidirectional because this node publishes in the corresponding topic.
- Raspberry Pi 4: This single-board computer was configured to be implemented as an MQTT broker using mosquitto; it was also programmed using Node-RED, where the topics were configured to receive and send data through MQTT, and a dashboard was configured to display the data. Similarly, using Node-RED, a dashboard was programmed to display the time of use of the Raspberry Pi 4 and the amount of available memory, and finally, a database was configured to show the data transmitted with the option to download the data in a tabular file format to be viewed in a spreadsheet.
3.5.1. Cistern Sensor Node Electronic Circuit Diagram
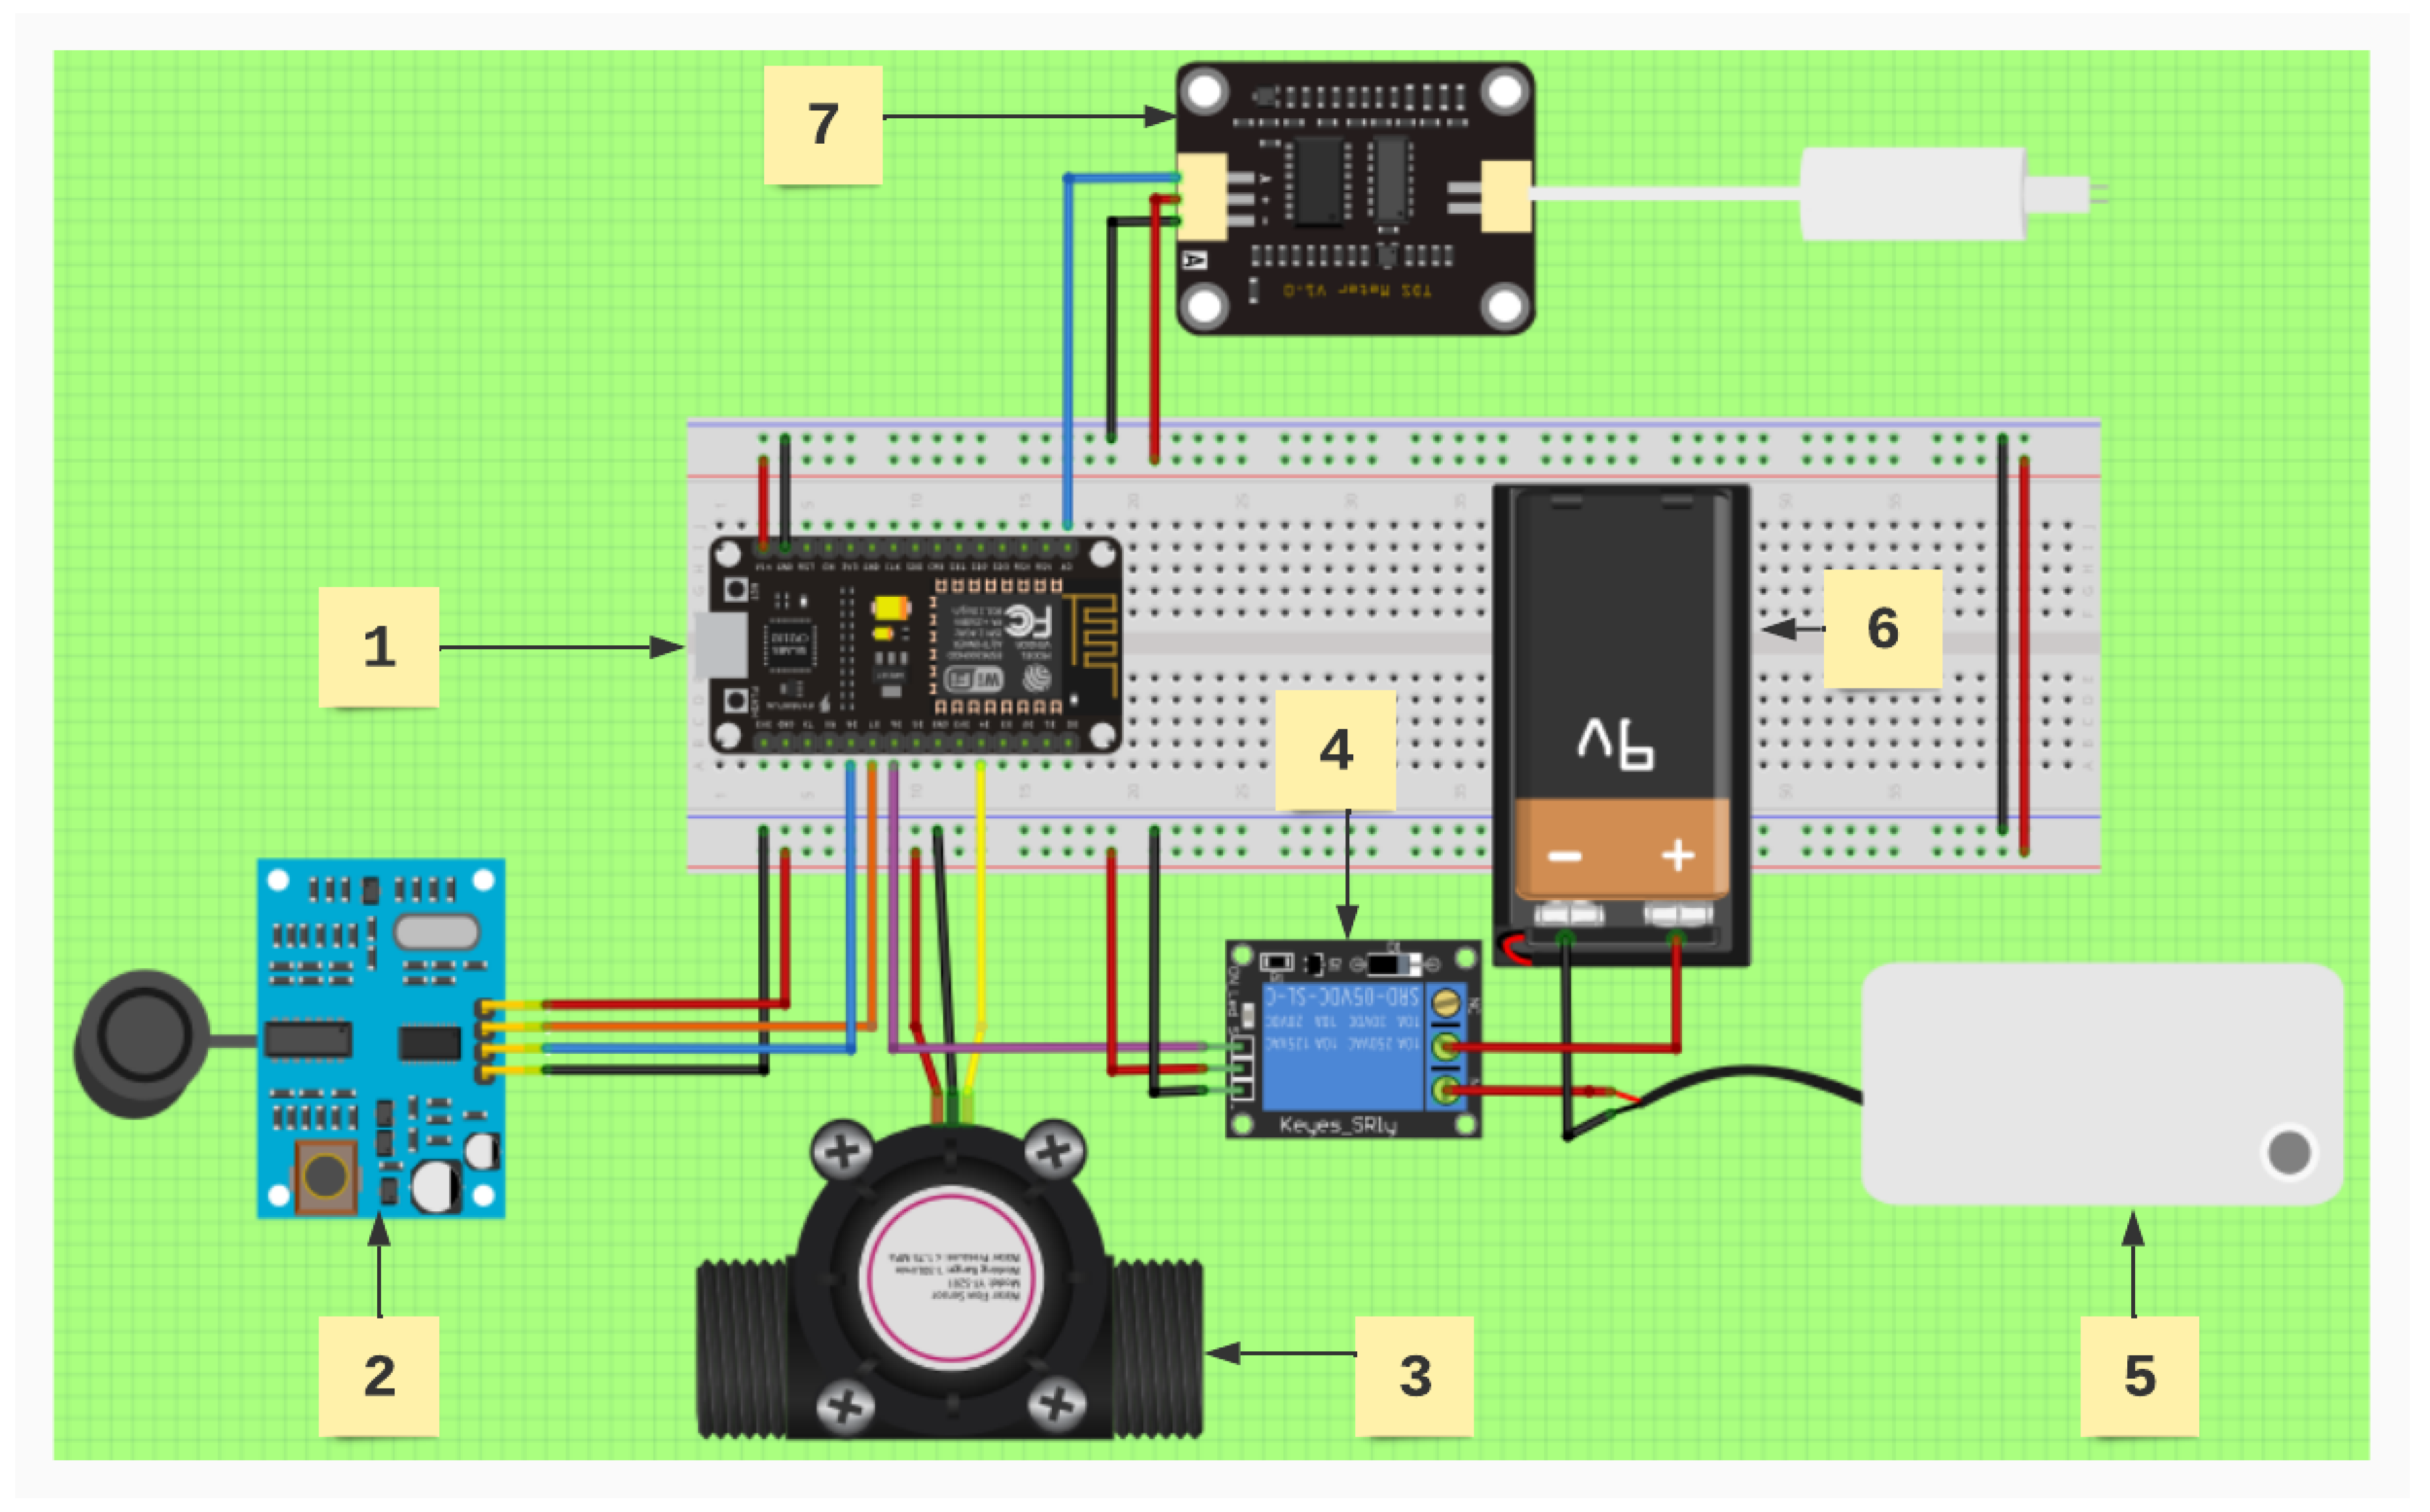
The following diagram (Figure 9) shows graphically the connections needed to operate the cistern sensor node. In this diagram, each component is indicated by a numerical label as an identifier.

Figure 9.
Node-RED programming code for the dashboard, where all sensors and actuators are connected for visualizing on the Internet.
- Microcontroller (NodeMCU V1.0) (for writing purposes, this is referred to as the microcontroller): It controls all sensors and actuators in the system. Its input and output pins were configured through the Arduino IDE programming environment. The MQTT protocol over the local network establishes communication with the sensors and actuators.
- Ultrasonic waterproof sensor (JSN-SR04T-2.0): This is used to measure the water level in the water tank. This sensor sends a signal that bounces off the water’s surface, allowing it to calculate the distance and, therefore, the volume of water. The connection of this sensor to the NodeMCU includes the following:
- 5V pin to the 5V pin of the microcontroller.
- Ground pin (GND) to GND of the microcontroller.
- Trigger pin (Trig) to the D7 pin of the microcontroller.
- Echo pin to pin D8 of the microcontroller.
- Water flow sensor (YF-S201) (this sensor requires a PULL-UP resistor to be set since it generates interruptions): It measures the pressure of the water entering the tank from the main supply. The pressure measurement is crucial for estimating the filling time of the cistern. The connection to the microcontroller includes the following:
- 5V pin to the 5V pin of the microcontroller.
- Ground (GND) pin to the microcontroller’s GND.
- Signal pin to the D4 pin of the microcontroller.
- Relay module: It activates or deactivates the submersible pump, depending on the water levels in the cistern and tank. The pump turns on when the tank level is below 50% and turns off when it is full. The relay connections are as follows:
- 5V pin to the 5V pin of the microcontroller.
- Ground (GND) pin to GND of the microcontroller.
- Signal pin to pin D6 of the microcontroller.
- Submersible water pump: It transfers water from the cistern to the upper tank. The relay module controls the activation of the pump. The connections are as follows:
- Positive wire to the NO terminal of the relay.
- Negative wire to the negative terminal of the 9V battery.
- Battery (9v): This battery helps us close the circuit of the submersible water pump since it changes state from on to off and vice versa. A commercial battery was used, and a battery clip was adapted.
- Sensor TDS meter v1.0: It measures the amount of dissolved solids in the water, expressed in parts per million (ppm), which estimates water quality. The sensor configuration includes the following:
- 5V pin to the 5V pin of the microcontroller.
- Ground (GND) pin to the microcontroller’s GND.
- Signal pin to the A0 pin of the microcontroller.
The electronic circuit diagram of the cistern node is designed to continuously send collected data to the Raspberry Pi 4 server via the MQTT protocol. This architecture allows the pump to be activated and deactivated as needed, optimizing water use in the home.
3.5.2. Tank Sensor Node Electronic Circuit Diagram
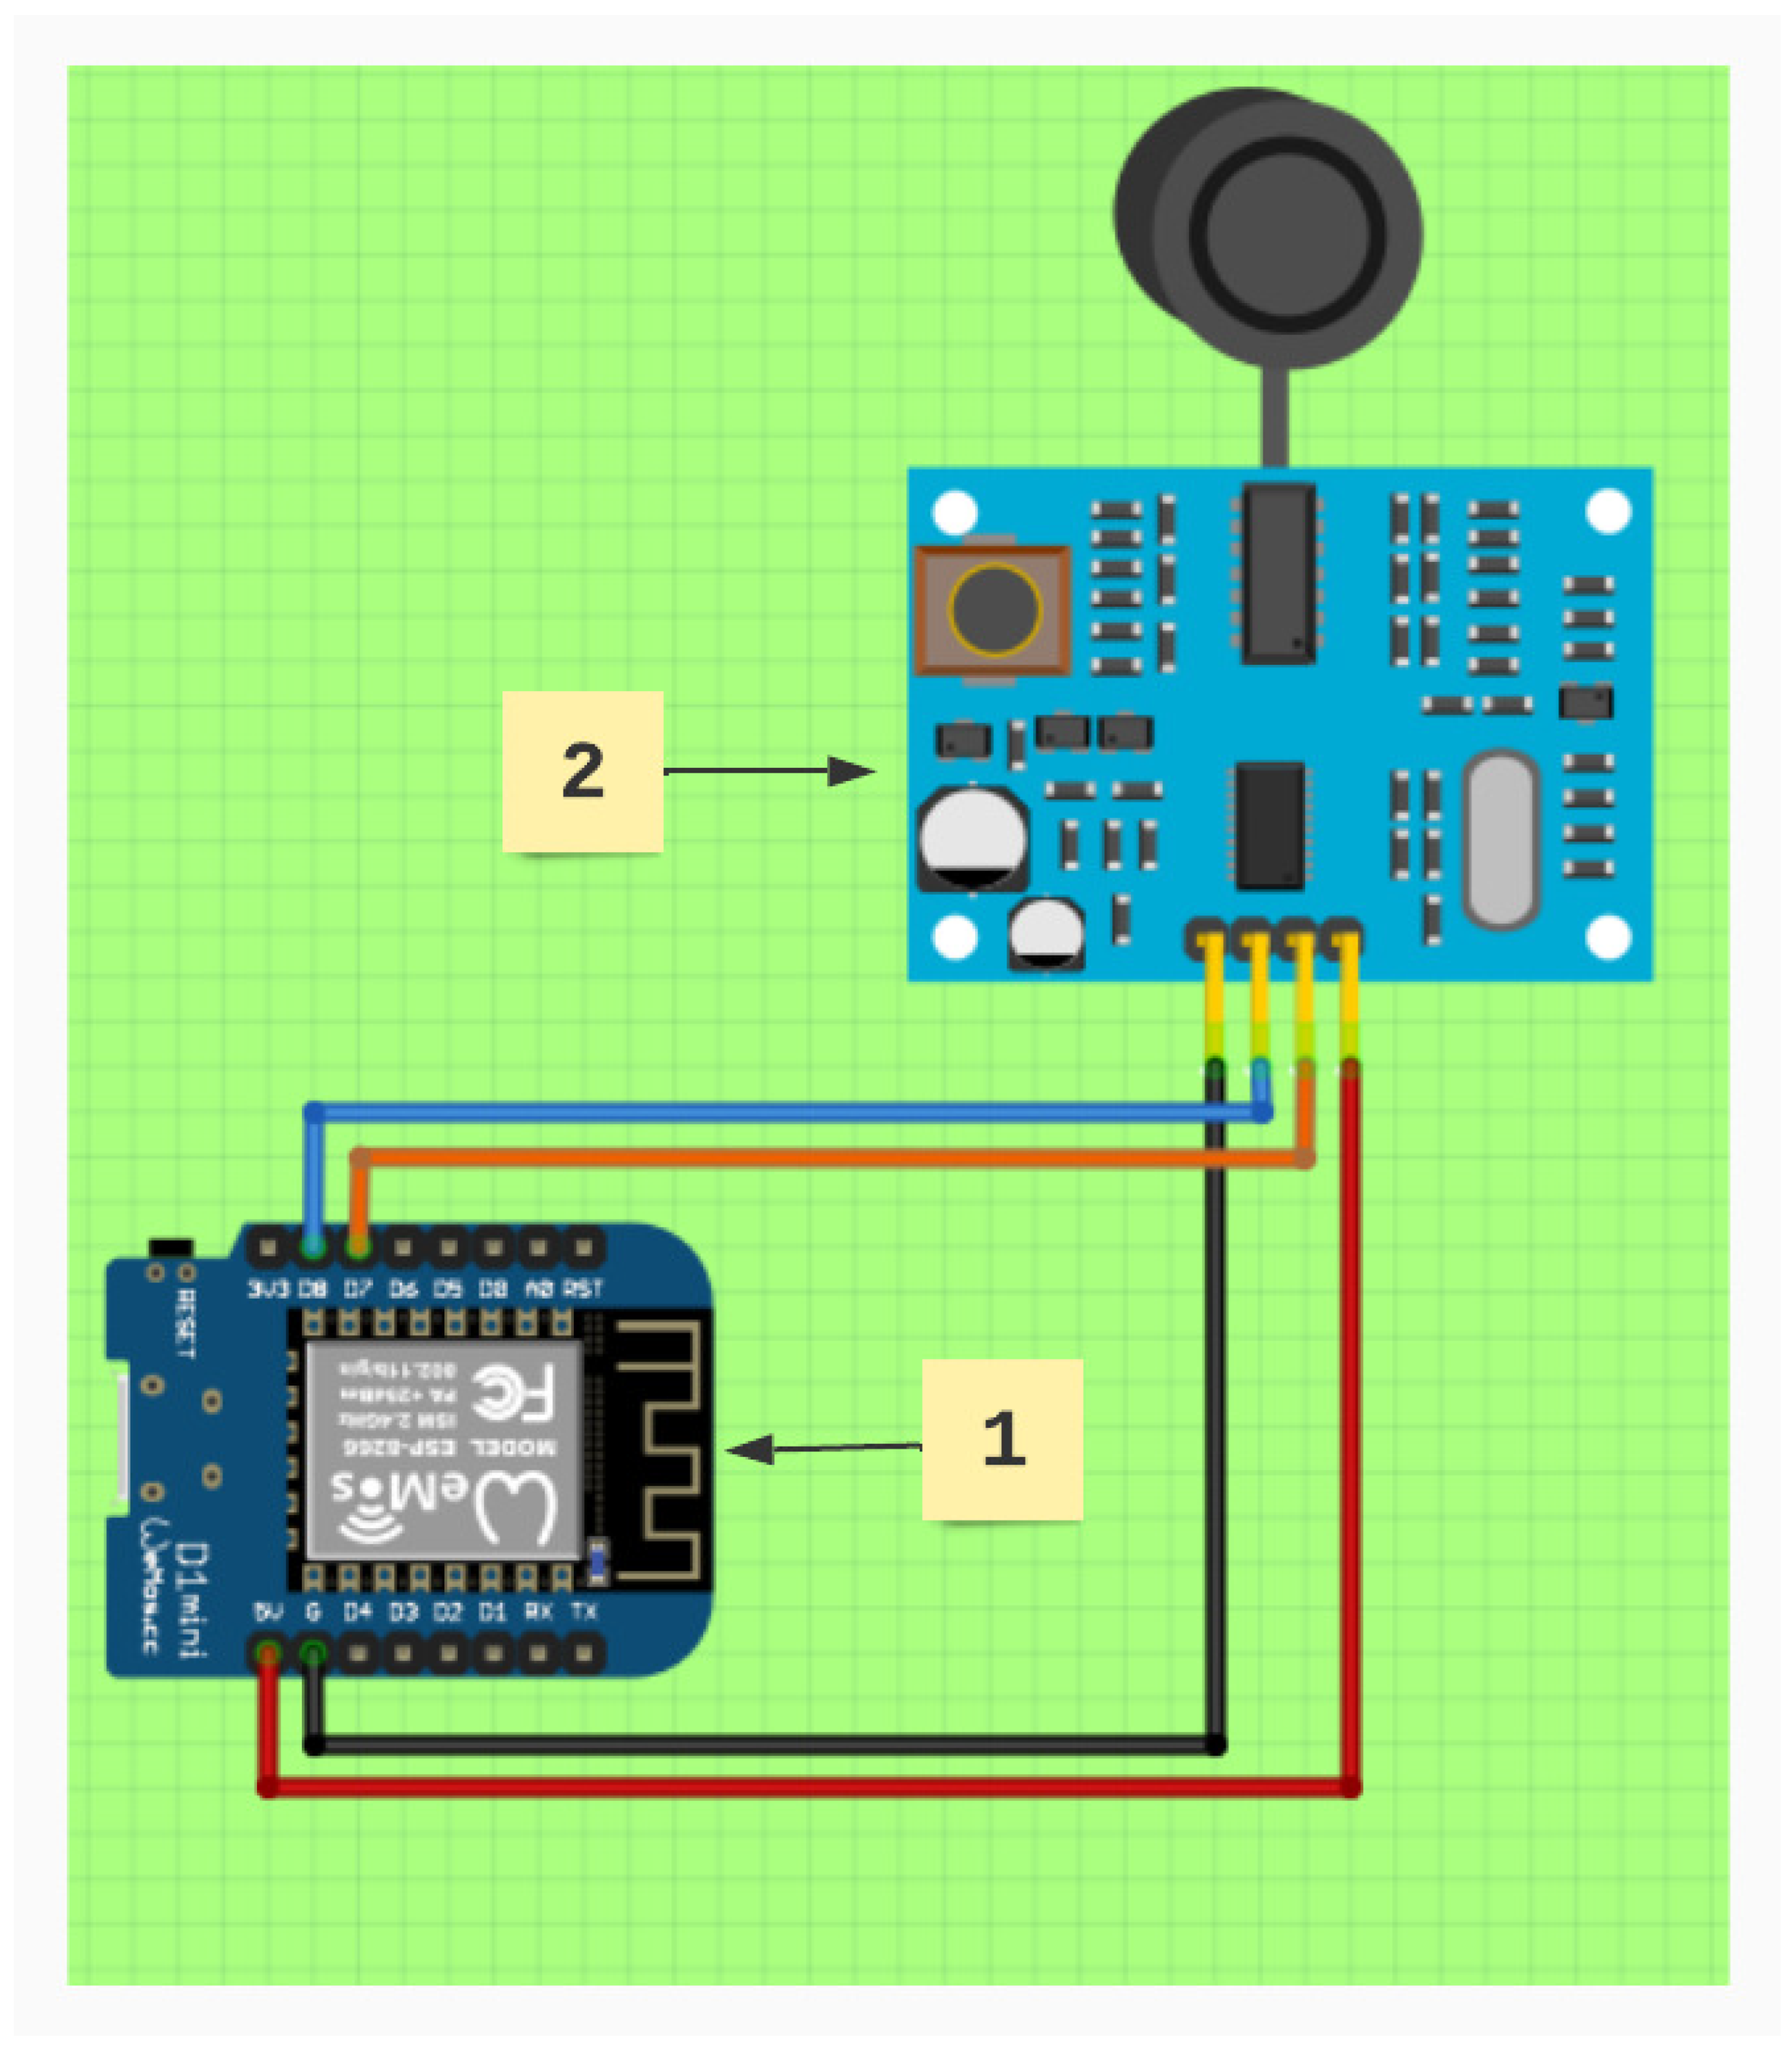
The following diagram (Figure 10) shows the connections of the tank sensor node, which are as follows:

Figure 10.
Tank sensor node electronic circuit diagram.
- Wemos D1 mini: This device acts as the main controller of the tank node. This component is responsible for receiving and processing the data from the connected sensors, sending this information to a Raspberry Pi4 server through the MQTT protocol. The programming environment used to configure the microcontroller was Arduino IDE, where the necessary input and output pins were assigned for each component.
- Ultrasonic waterproof sensor (JSN-SR04T-2.0): This ultrasonic sensor measures the water level in the tank. It sends ultrasonic waves that bounce off the water’s surface, allowing it to calculate the distance between the sensor and the water. The sensor connections to the microcontroller include the following:
- 5V pin connected to the 5V pin of the microcontroller.
- Ground pin (GND) connected to the microcontroller’s GND.
- Trigger pin (Trig) connected to the D7 pin of the microcontroller.
- Echo pin (Echo) connected to the D8 pin of the microcontroller.
3.5.3. Flows and Dashboard in Node-RED
Figure 11 shows the Node-RED programming code used for the dashboard. In this program, all elements are integrated. These include the following:
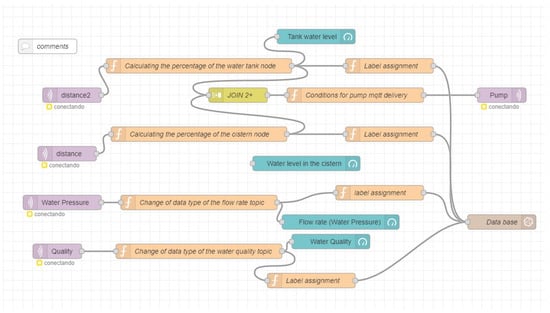
Figure 11.
Node-RED programming code for the dashboard, where all sensors and actuators are connected for visualizing on the Internet.
- Distance or water level in the water tank.
- Distance or water level in the cistern.
- Flow rate or water pressure coming from the tap water.
- Water quality.
- Submersible water pump.
Appendix A includes more programming code used in the system.
3.5.4. Mathematical Models of the Water Level, Flow, and Quality
We use the following Formulas (1), (2), and (3) to calculate the water level in the cistern and tank, the water flow rate, and the water quality.
Ultrasonic sensors measure the distance to the water in the cistern and water tank, which allows the calculation of the water level using the following formula:
where
- h is the height of water in the tank,
- H is the total height of the tank,
- d is the distance the sensor measures from the top of the tank to the water surface.
This model provides a direct relationship between the detected distance and the water level, allowing an accurate and continuous conversion of the ultrasonic signal into water volume.
The flow sensor measures the flow rate (Q) in liters per minute (L/min) by the generated pulse frequency. This flow rate is calculated through
where
- Q is the instantaneous flow rate,
- f denotes the frequency of the pulses generated by the water flow,
- k is a sensor constant given in the sensor manual.
This model directly converts the signal frequency into a volumetric flow rate, which can calculate the amount of water entering and leaving the system over time.
For the TDS (Total Dissolved Solids) sensor, a standard conversion formula can be used that measures electrical conductivity (C) and converts it to dissolved solids concentration:
where
- TDS is the dissolved solids concentration in parts per million (ppm),
- C is the conductivity measured in S/cm,
- k is a conversion constant.
We can quantify water quality regarding dissolved solids concentration; thus, we continuously assess the potability.
4. Experimental Results
4.1. Physical Scale Model
To demonstrate the feasibility of monitoring water tanks and cisterns using the IoT, we will describe with pictures the installation of the water level monitoring system for the cistern, water tank, water flow, water quality, and water pump. We used a physical scale model to prove the proposed system’s operation.
In Figure 12a, we see a circuit connected to a water level sensor (ultrasonic sensor JSN-SR04T-2.0), which is responsible for measuring the water level in the tank. A WeMos D1 mini ESP8266 WiFi controls this sensor. Figure 12b shows a second circuit; we see another water level sensor (ultrasonic sensor JSN-SR04T-2.0), which measures the water level in the tank. The ultrasonic sensor is controlled by a NodeMCU v2 ESP8266 WiFi.
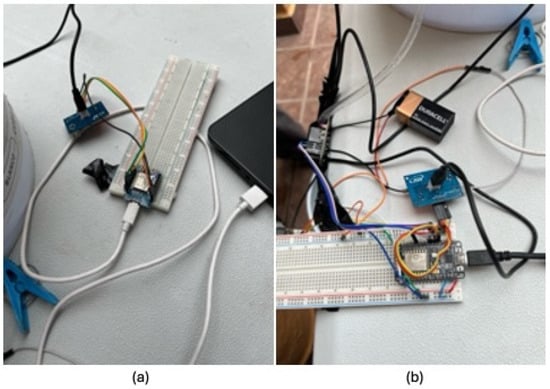
Figure 12.
(a) Water tank level sensor circuit. (b) Cistern level sensor, water quality, and submersible pump circuit.
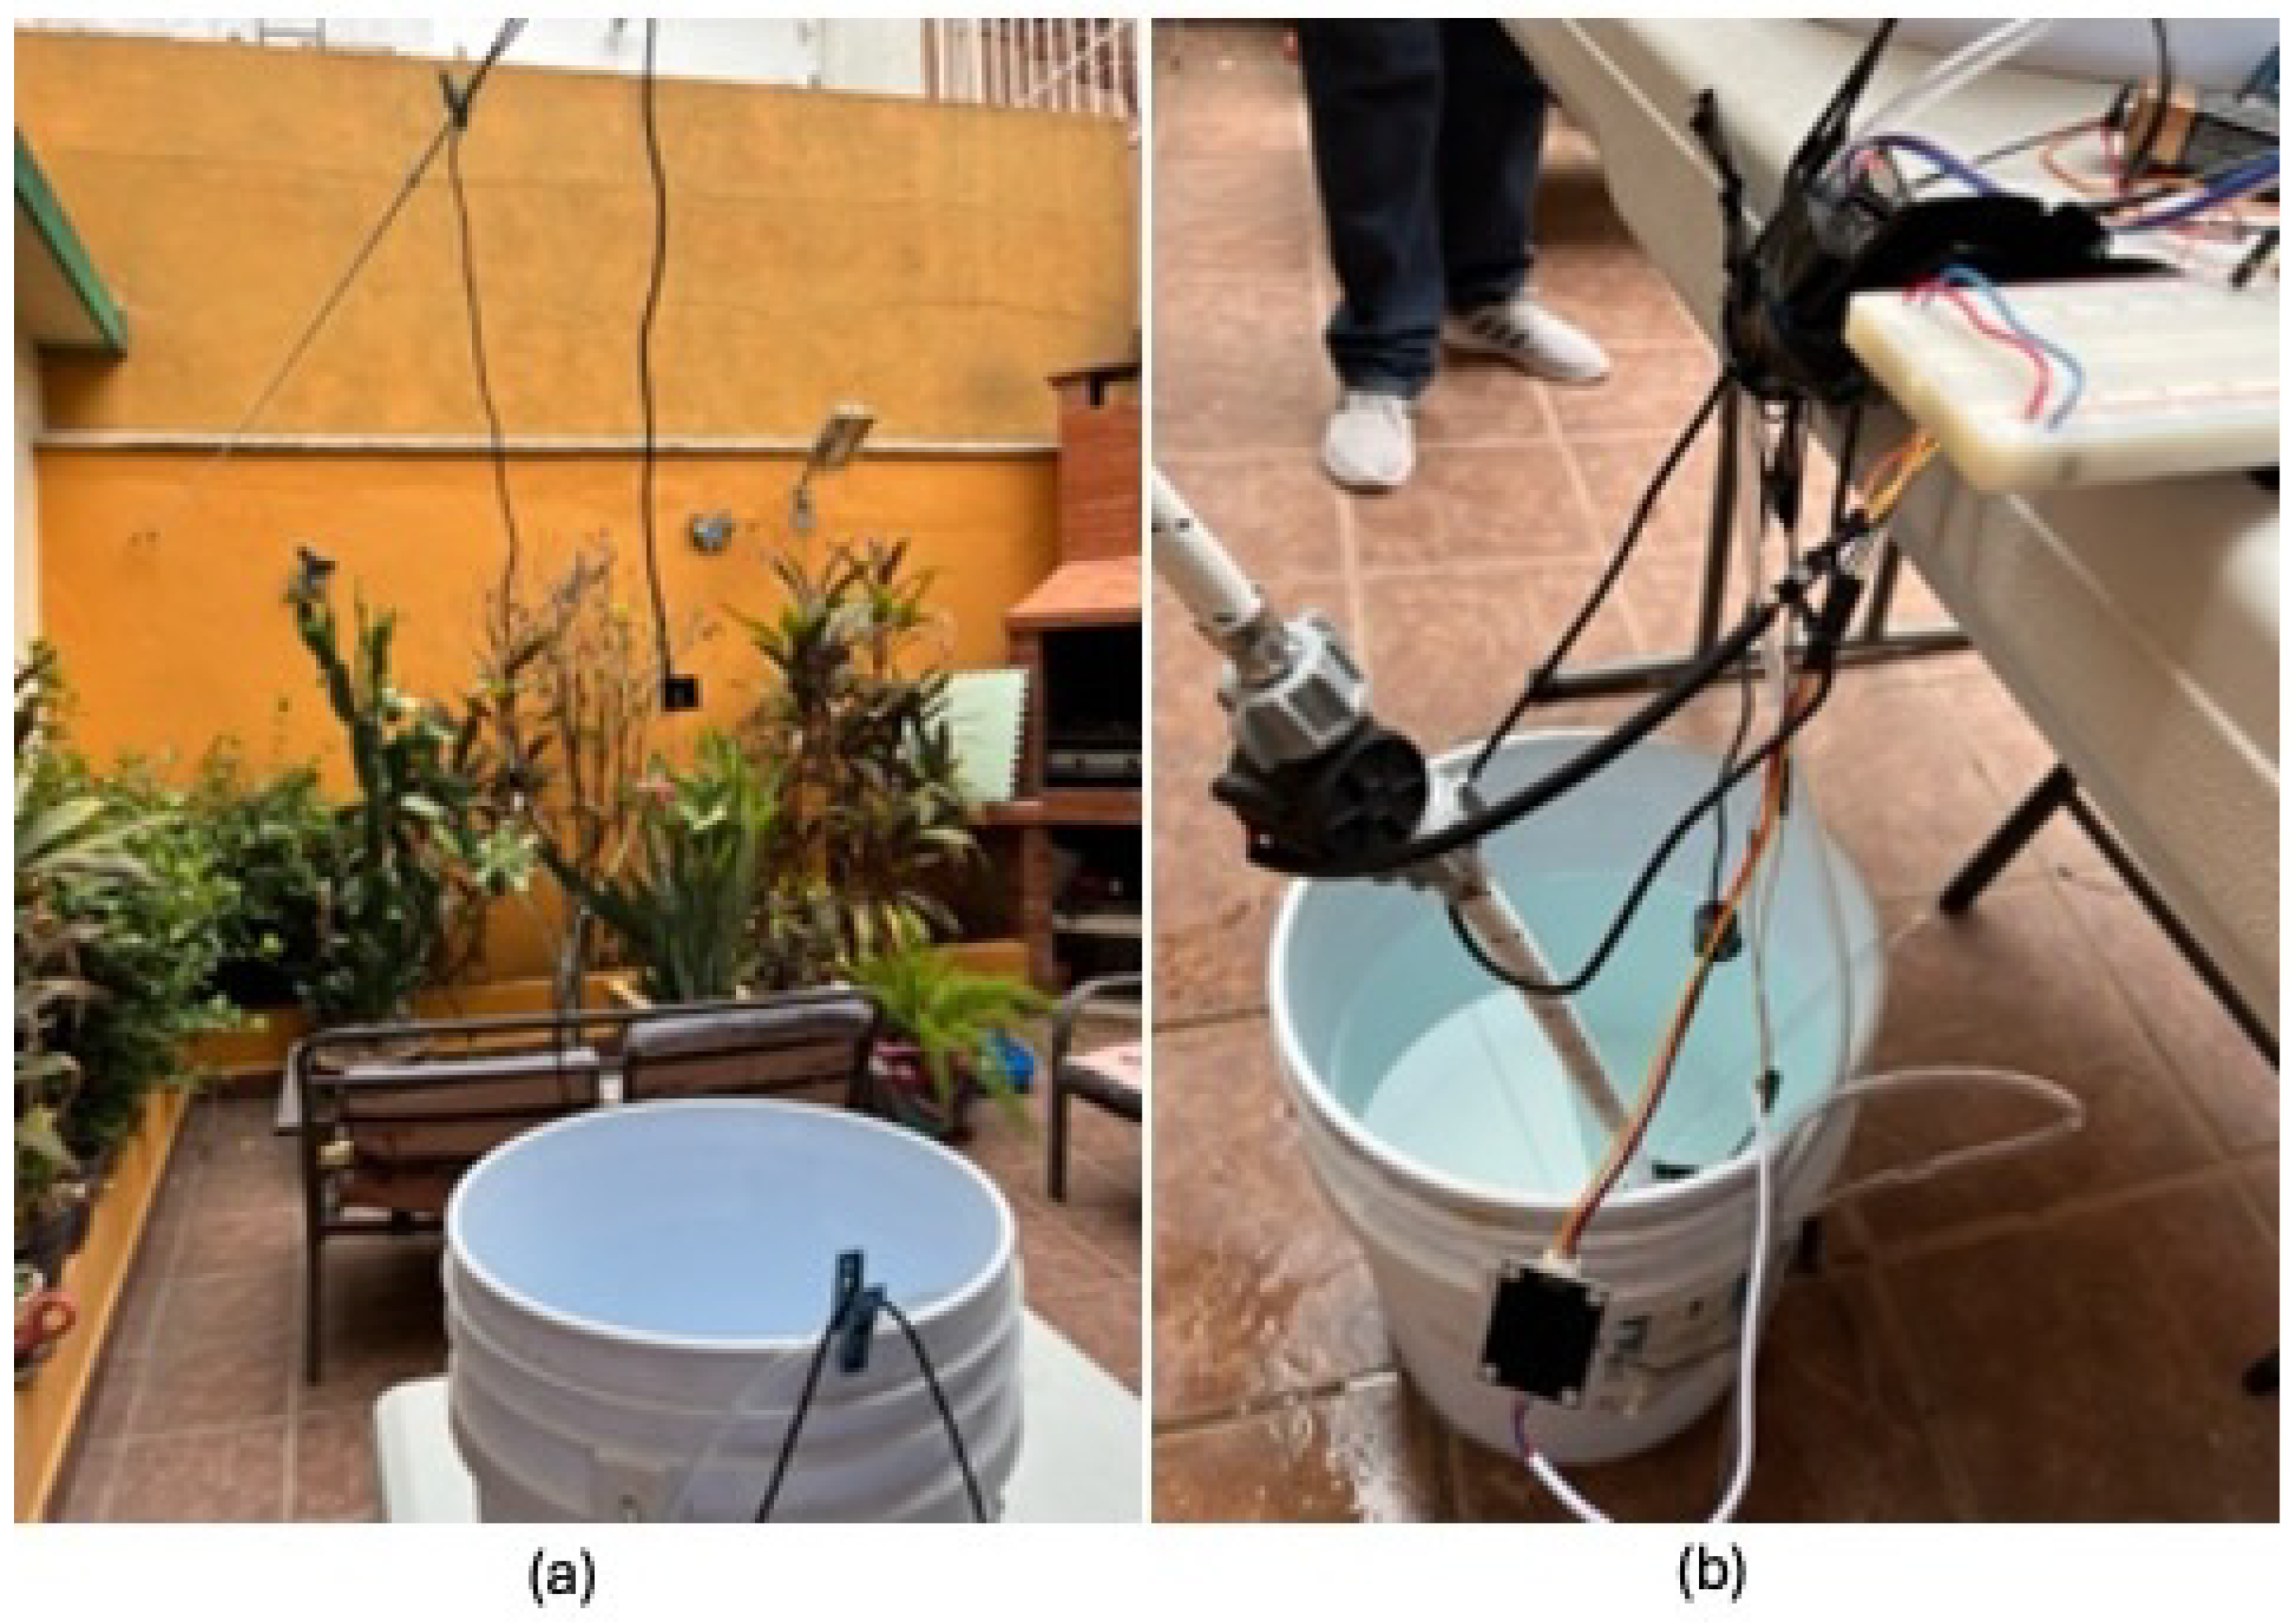
We placed a bucket on top of a table to emulate a water tank because this tank should go on top. Above it hangs the ultrasonic sensor measuring the water level in the tank. See Figure 13a. Similar to the water tank, we placed a bucket below the ground level since this water container must be placed below. Above it hangs the ultrasonic sensor for measuring the cistern’s water level. Furthermore, inside that bucket is the hose that supplies tap water along with the flow sensor; the pump to bring water up to the tank is also submerged in the water, and the sensor that measures the water quality is placed right there. See Figure 13b.

Figure 13.
(a) Scale model water tank. (b) Scale model cistern.
4.2. Dashboard and Meters/Gauges
4.2.1. Dashboard Showing Values
According to the circuit diagrams, the software was installed and tested on the microcontrollers, i.e., everything that was installed, including sensors, microcontrollers, actuators, wires, water pump, etc., was physically connected. We proceeded to open the water faucet to start circulating water through the system. To obtain water quality measurements, we added a little soil to the water to model that it was dirty, which gave us ppm values.
For the test results, it is time to visualize our system’s behavior on the Internet. We programmed in the programming tool Node-RED (Flows and Java Script) and C for the WeMos D1, the NodeMCU v2 ESP8266, and the Raspberry Pi 4.
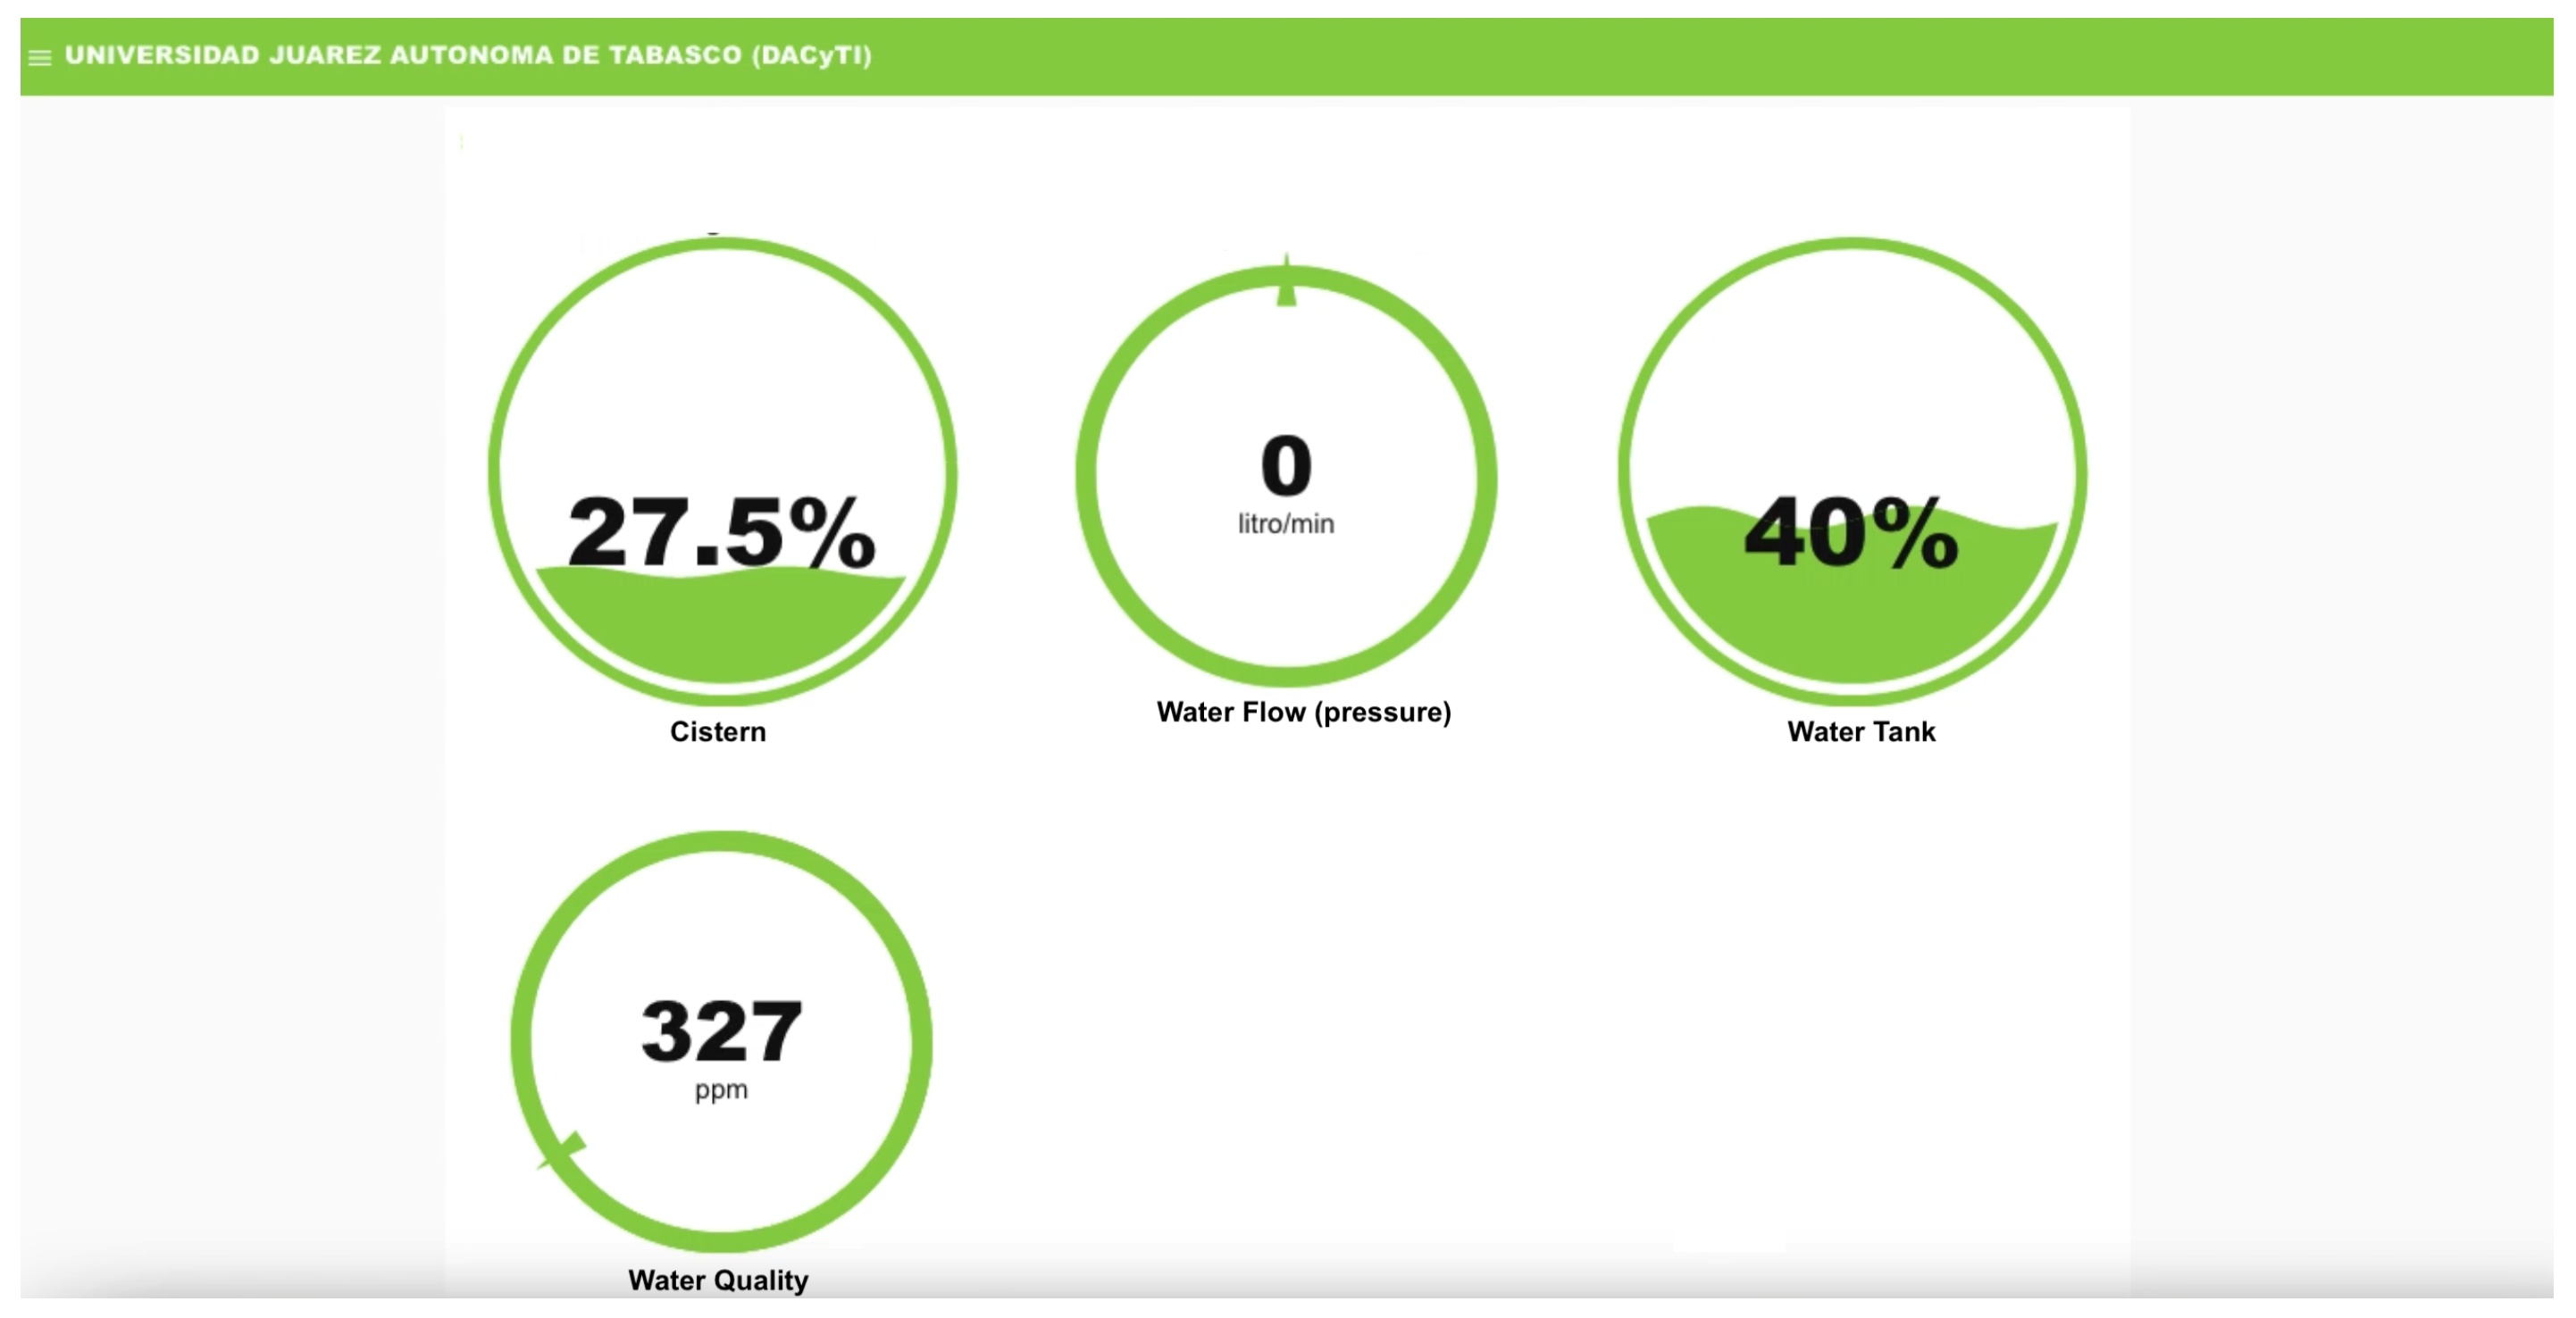
As mentioned earlier, to visualize such behavior on the Internet, the monitoring or result can be displayed on a Node-RED output screen; we used a dashboard during the prototype test. This dashboard displays four gauges: the first one shows the water level in the cistern, the second one shows the flow rate or water flow that reaches the water hose, the third one displays the water level in the tank, and finally, the last gauge indicates the water quality.
Figure 14 shows a dashboard with four gauges when the water pressure is zero L/min, i.e., low pressure or no municipal water supply, when the cistern is at 27.5% capacity, the water tank is 40% full, and the water quality is 327 ppm. This measurement is made with the water flow sensor (YF-S201); this value varies over time as the municipal water flow has high, medium, low, or no pressure. When the user sees that the gauge is zero, they can decide to lower water consumption. Although there may be water in the cistern and the water tank, the user can choose to measure their water use.

Figure 14.
Dashboard shows when the water pressure is zero L/min.
Continuing with the scale model test, we open the water faucet a quarter turn, a half turn, a complete turn, two turns, or closed completely, thus obtaining water flow or pressure values. The following figures show changes that occurred, and we describe them briefly because they are situations that hypothetically happen in reality.
As shown in Figure 15, a dashboard with four gauges describes when the water flow is at 15.99 L/min, the cistern is at 67.5% capacity, the water tank is 47.5% full, and the water quality is 334 ppm.
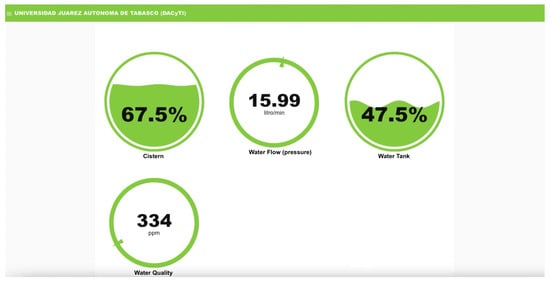
Figure 15.
System indicating when the water pressure is 15.99 L/min.
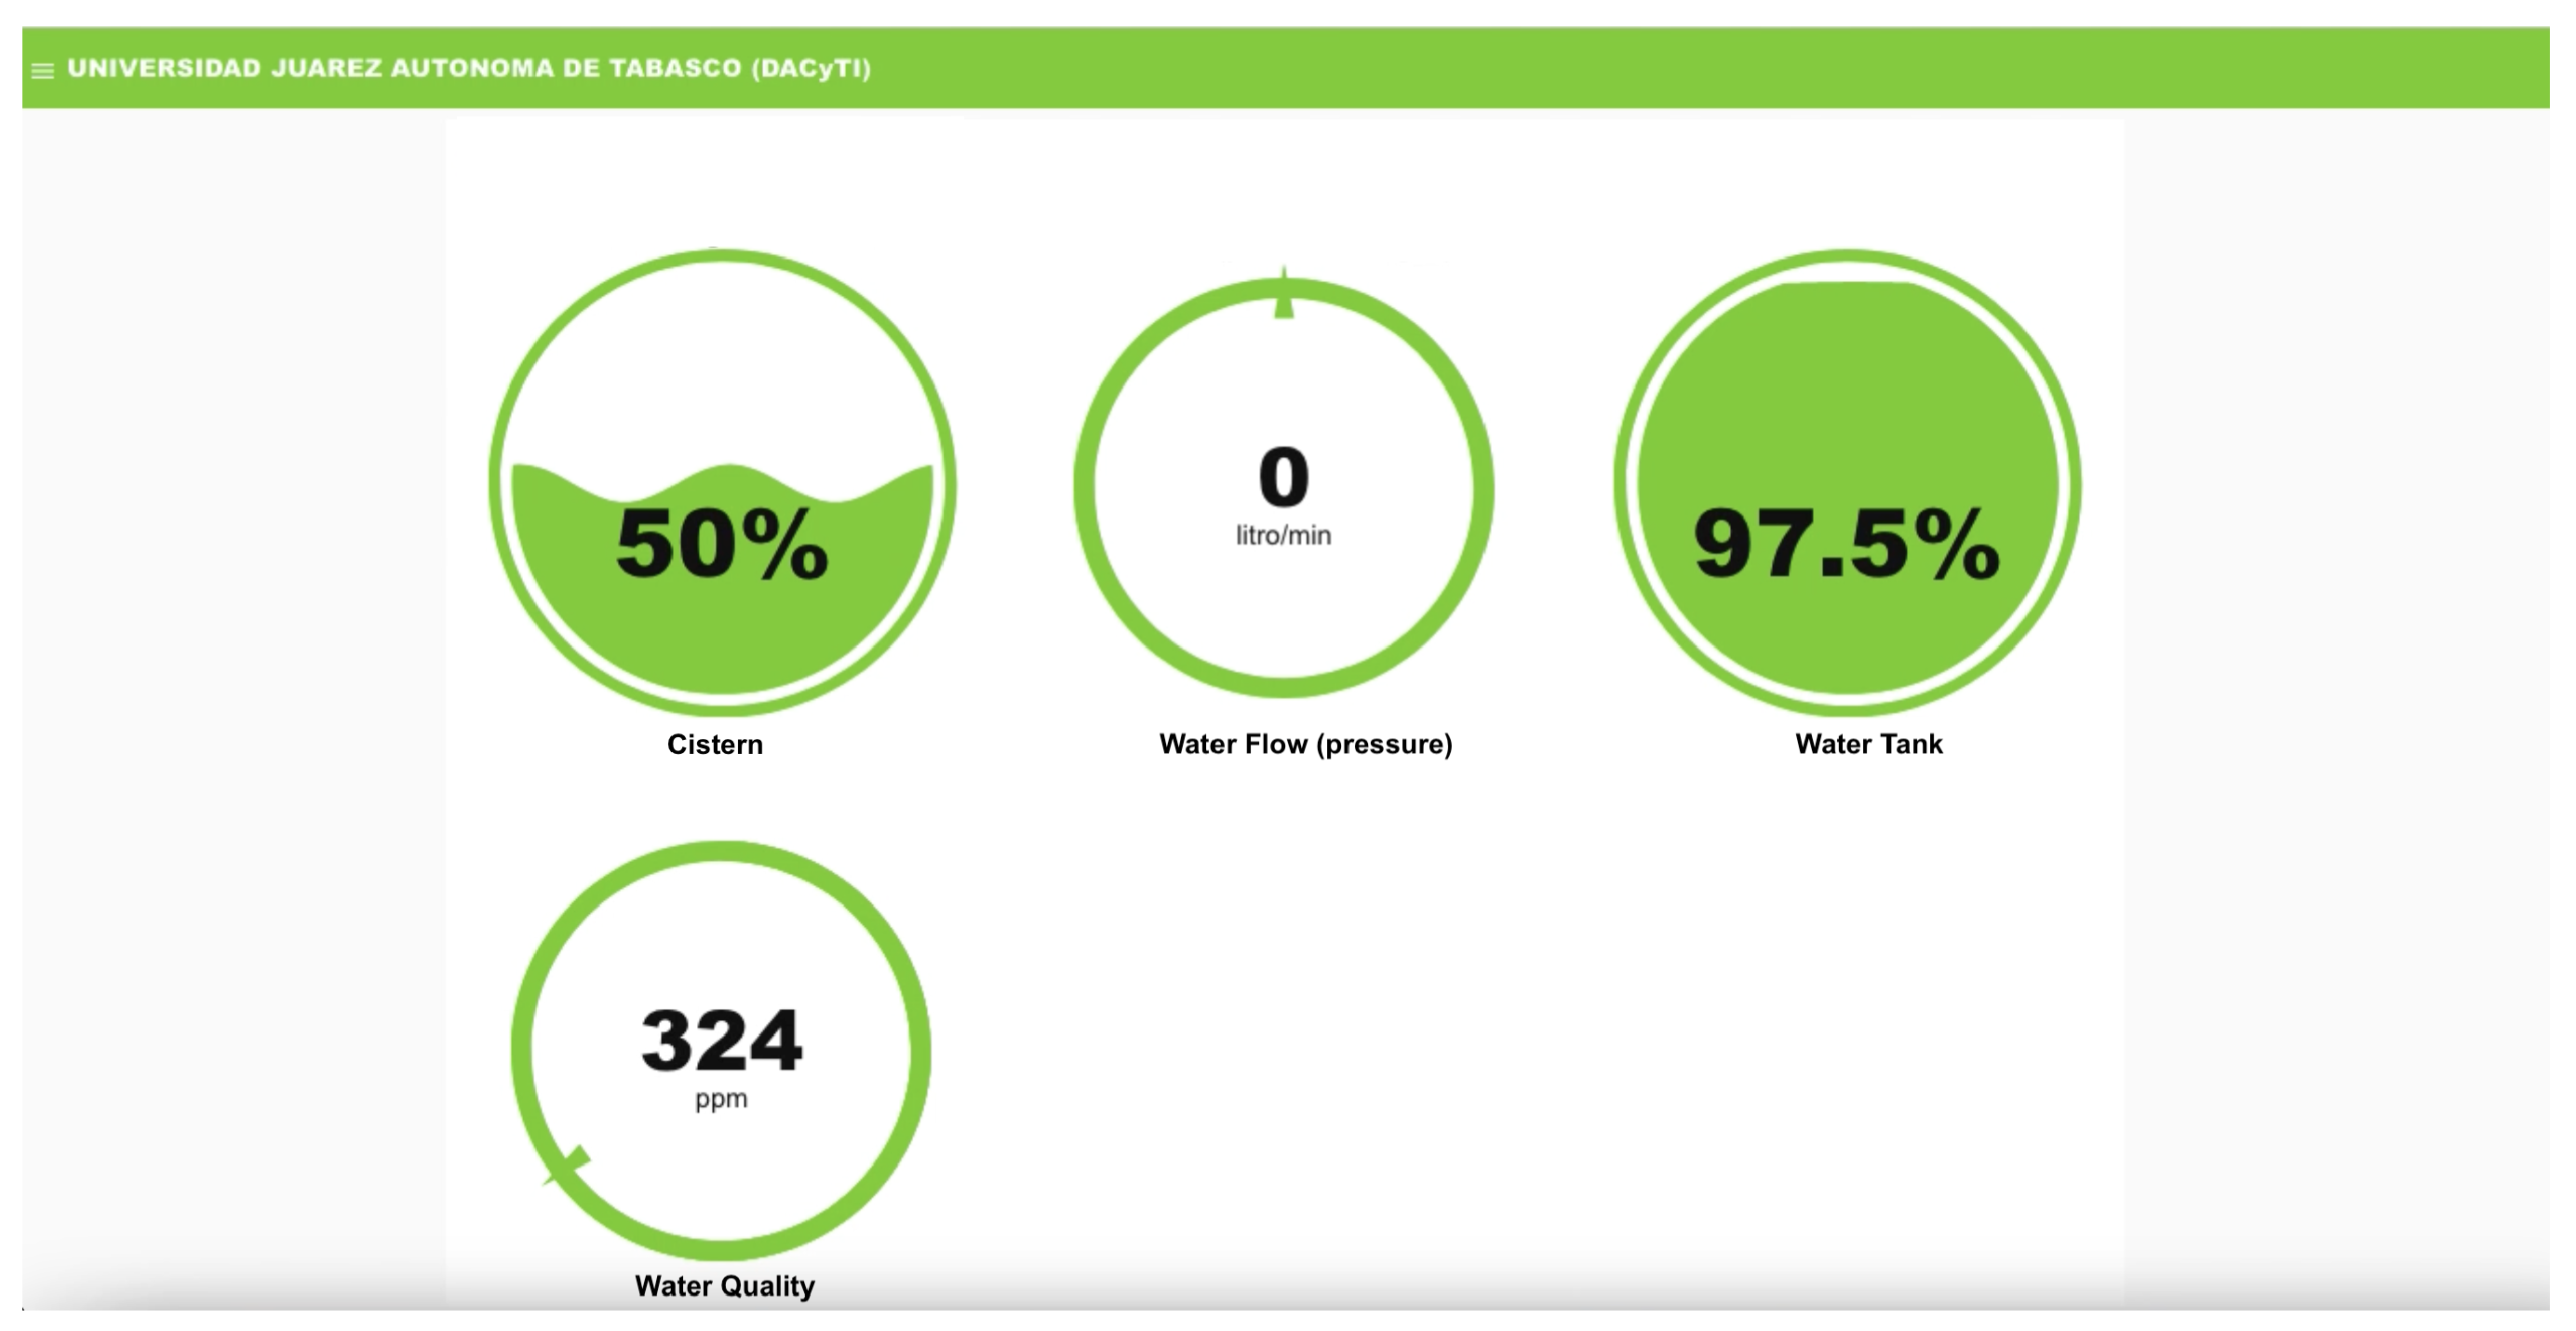
Figure 16 shows the dashboard at another point in the tests; the water flow is at 0 L/min, the cistern is at 50% percent capacity, the water tank is 97.5% full, and the water quality is 324 ppm. In this case, the faucet was closed completely. Therefore, the water flow is at 0 L/min.
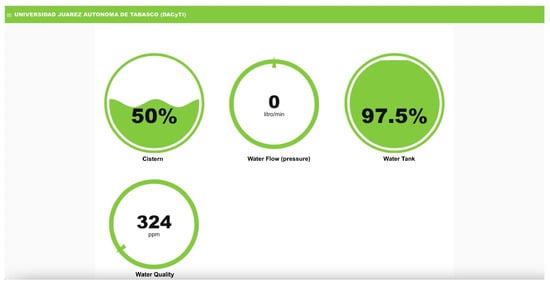
Figure 16.
System indicates when the tank is 97% full.
Figure 17 presents the dashboard with four gauges describing a scenario when the water flow is 9.12 L/min, the cistern is at 85% capacity, the water tank is 42.5% full, and the water quality is 318 ppm.
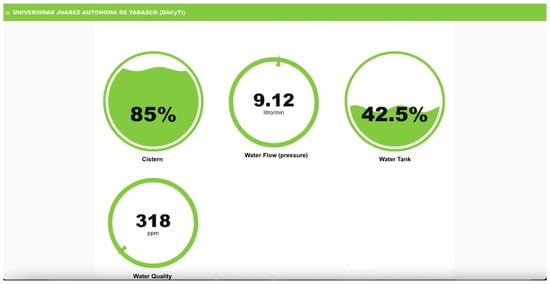
Figure 17.
System indicates the cistern is 85% full.
Another dashboard is shown in Figure 18, where the water pressure is zero L/min, the cistern is at 65% capacity, the water tank is 42.5% full, and the water quality is 258 ppm.
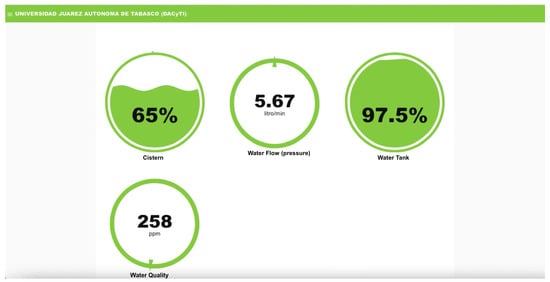
Figure 18.
System indicates when the water quality is 258 ppm.
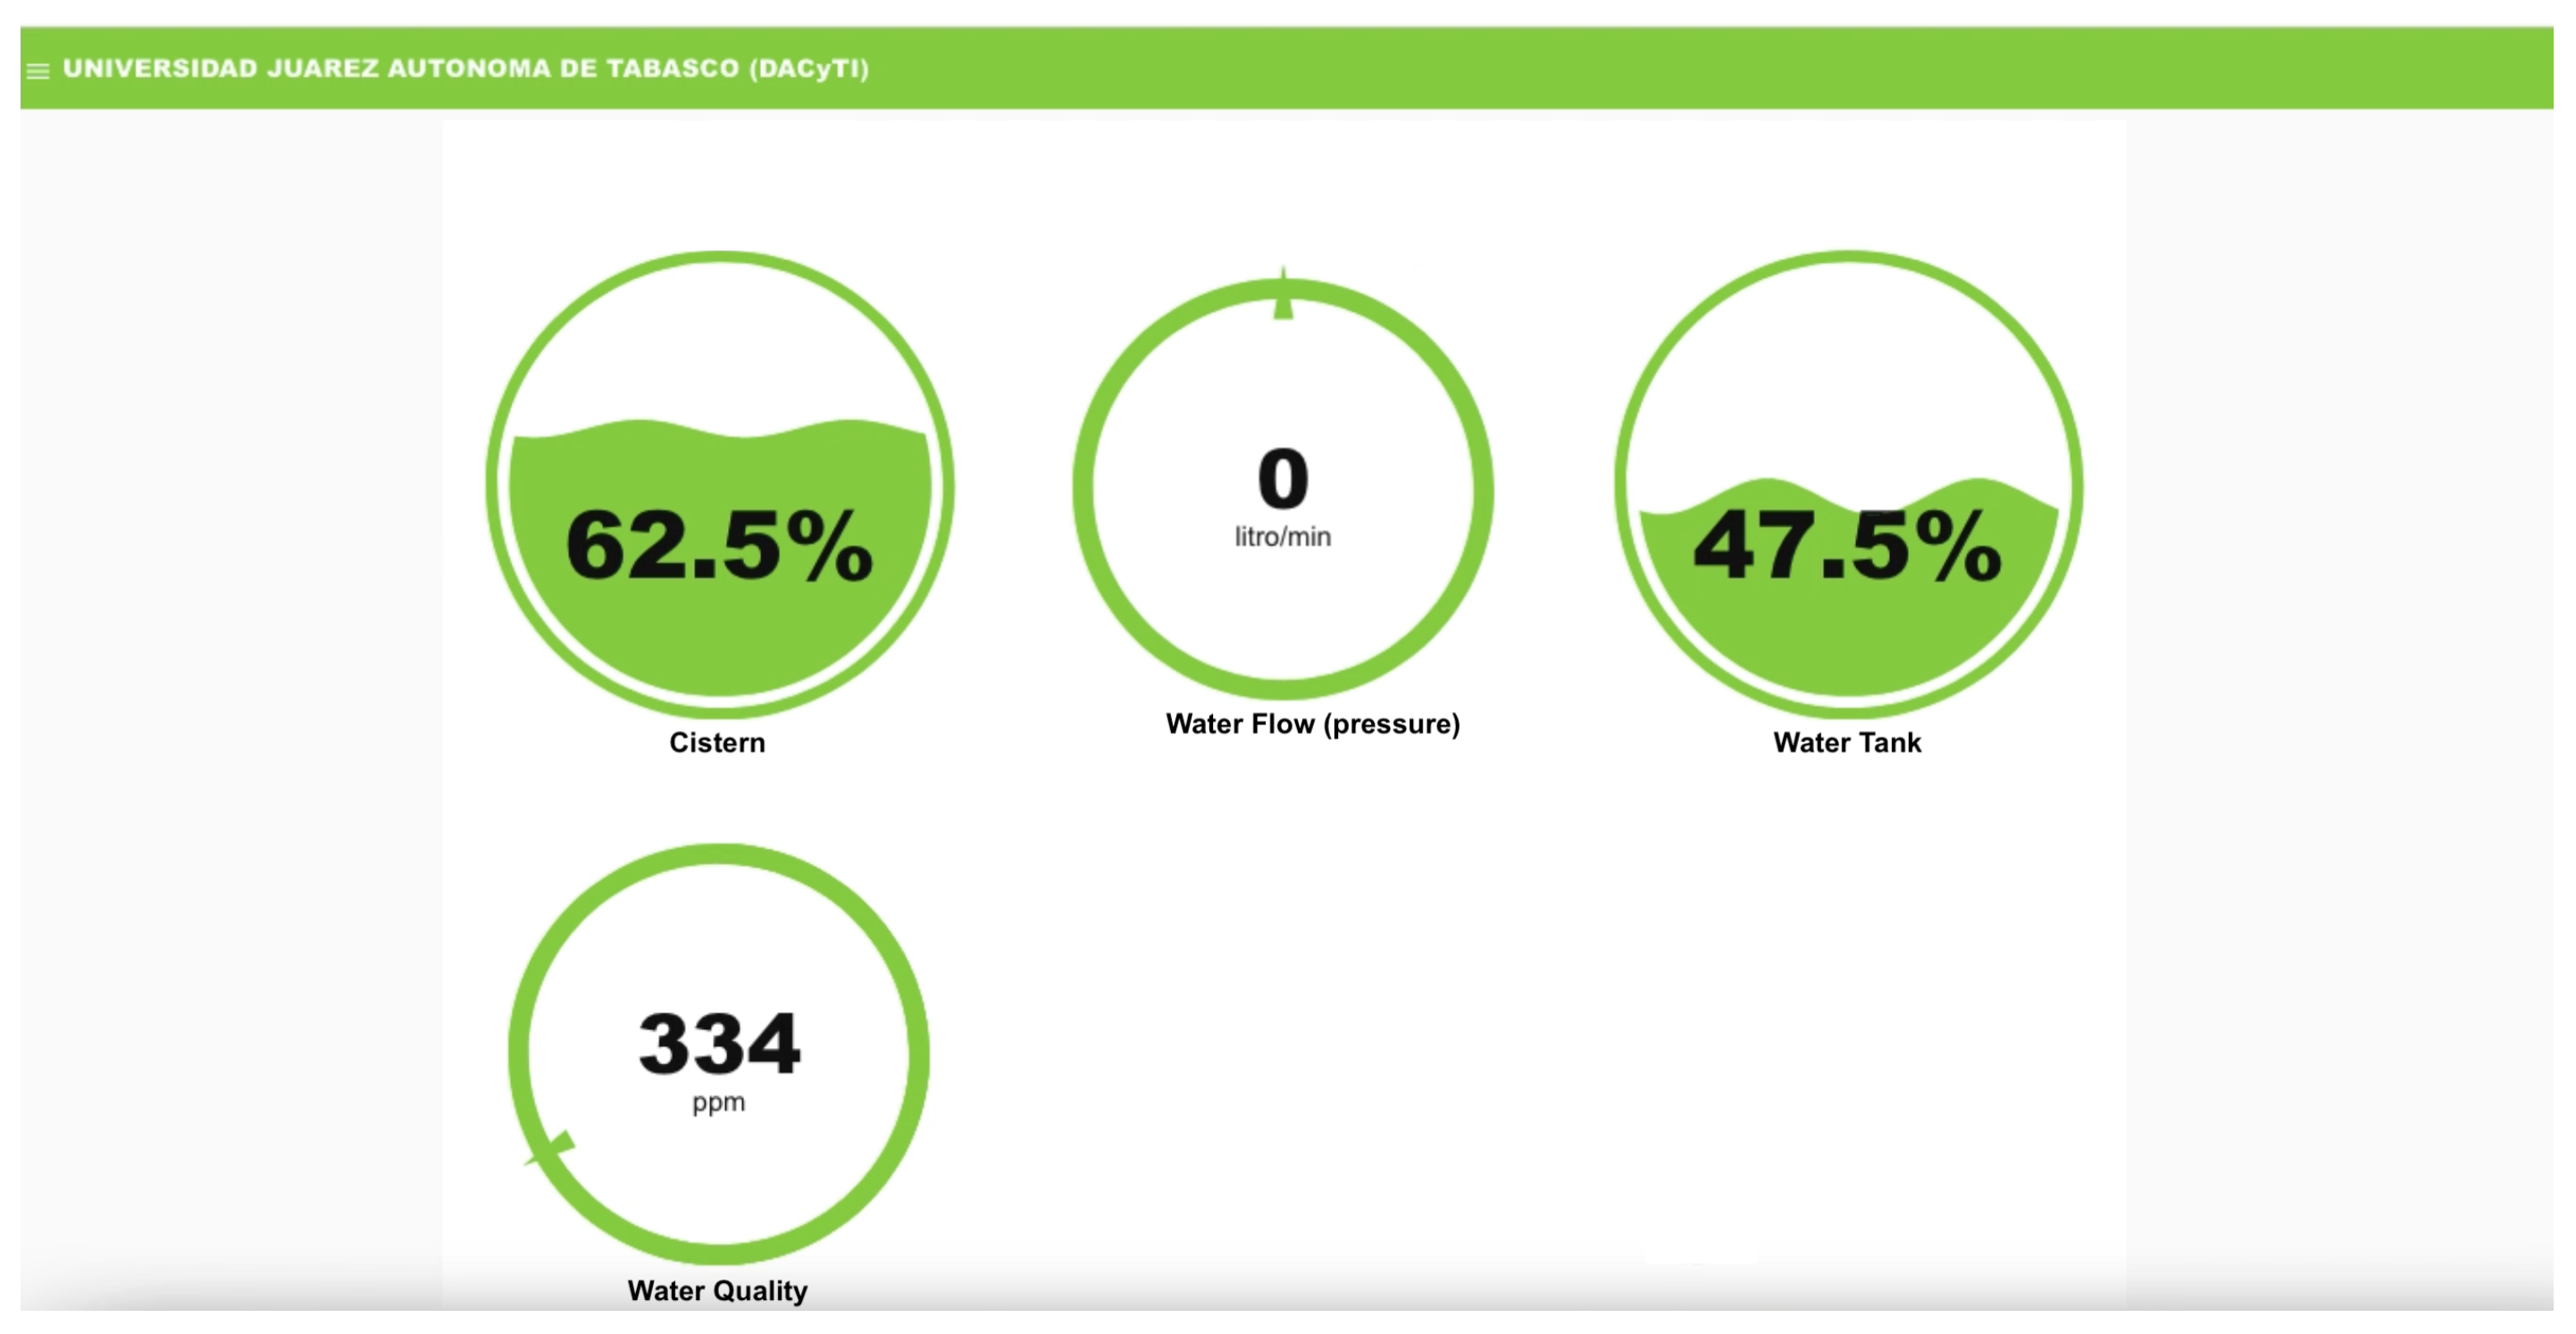
The last dashboard, in Figure 19, depicts a gauge when the water pressure is zero L/min, the cistern is at 62.5% capacity, the water tank is 47.5% full, and the water quality is 334 ppm.
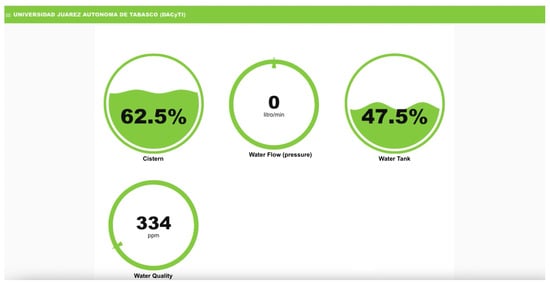
Figure 19.
System indicates when the water quality is 334 ppm.
4.2.2. Usability Study
After displaying the water status outputs through the dashboard, we want to know if any homeowner user can understand the views provided by the dashboard.
The dashboard on a web page is straightforward: it shows the status of water levels, water quality, and water flow. However, a usability study could identify whether users need help understanding the graphs, interpreting the metrics, or interacting with the system controls. So, we asked a small group of homeowner users what they think about what they look at the dashboard.
We adapted some usability study models from [19] to test the user-friendliness of the interface that displays the dashboard of this system. Some relevant papers regarding similar studies are [20,21], which talk about usability as well as UX terms and several tests.
To review the user-friendliness of our system, we designed a small survey with 18 questions, which was applied to 30 participants. The study aimed to obtain feedback and opinions about the dashboard when it was published on a web page.
Categories and Questions
The next aspects or categories were used for the usability study, each containing only two questions.
- Features and Functionality
- 1.
- Are the main monitoring functions (water level, flow, and quality) easy to understand and use?
- 2.
- Do you consider that all the necessary functionalities are present in the dashboards? Is any crucial information missing?
- Homepage/Starting Page
- 3.
- When accessing the page, can you identify the four main metrics (cistern level, tank level, water flow, and water quality)?
- 4.
- Is it intuitive to understand the purpose of each dashboard from a first glance?
- Navigation
- 5.
- Is it easy to navigate between the different dashboards (if necessary) or understand how to view them together?
- 6.
- Can you quickly access the information for each metric without getting confused or lost?
- Search
- 7.
- Would you like to be able to filter or search for historical data in the dashboards (e.g., time intervals or critical events)?
- 8.
- If you used a search function, was it easy to find the specific data you need?
- Control and Feedback
- 9.
- Does the system respond clearly when interacting with graphs or dashboard settings?
- 10.
- Do you receive sufficient visual feedback when you act, such as updating data or changing the display?
- Errors
- 11.
- If an error occurs (such as a data connection failure), does the system inform you and tell you how to resolve it?
- 12.
- Have you experienced loading problems or data display failures? If so, does the system respond appropriately?
- Content and Text
- 13.
- Are the data presented on each dashboard straightforward and easy to interpret?
- 14.
- Are the text and labels on the graphs descriptive enough to understand water levels, flow, and quality without additional help?
- Help
- 15.
- Can you easily find the help you need if you have questions about interpreting a graph or data?
- 16.
- Would you like additional explanations or guidance on how to use the dashboards effectively?
- Performance
- 17.
- Does the page load quickly for all four dashboards simultaneously?
- 18.
- Are there any delays or performance problems when refreshing data or switching views?
The survey results are summarized in Table 3. We placed them in percentage values for better understanding.
Table 3.
Usability survey results.
Most of the questions received positive responses, with many users rating the experience as “Excellent” or “Good”.
In features and functionality, over 80% of users found the main functions (water level, flow, and quality monitoring) easy to understand and use. The above indicates that the system achieves its goal of providing clear and accessible information. Questions related to the ease of identifying metrics and navigating the home page also elicited very positive responses. Some 70–80% of users found the interface intuitive and functional.
In short, these results mean high overall satisfaction with the system, mainly regarding usability and functionality, although opportunities exist to improve error handling and loading speed.
4.3. Database and Graphs
While the water levels in the cistern and tank are measured and monitored on the Internet, water flow is sensed, water quality is measured, and water is delivered by the submersible pump from the cistern to the tank. Everything that happens is also recorded in a database.
The output produced while monitoring water levels, water flow, water quality, and tank filling from the cistern is displayed on the dashboard and gauges, stored in a database, and plotted on graphs.
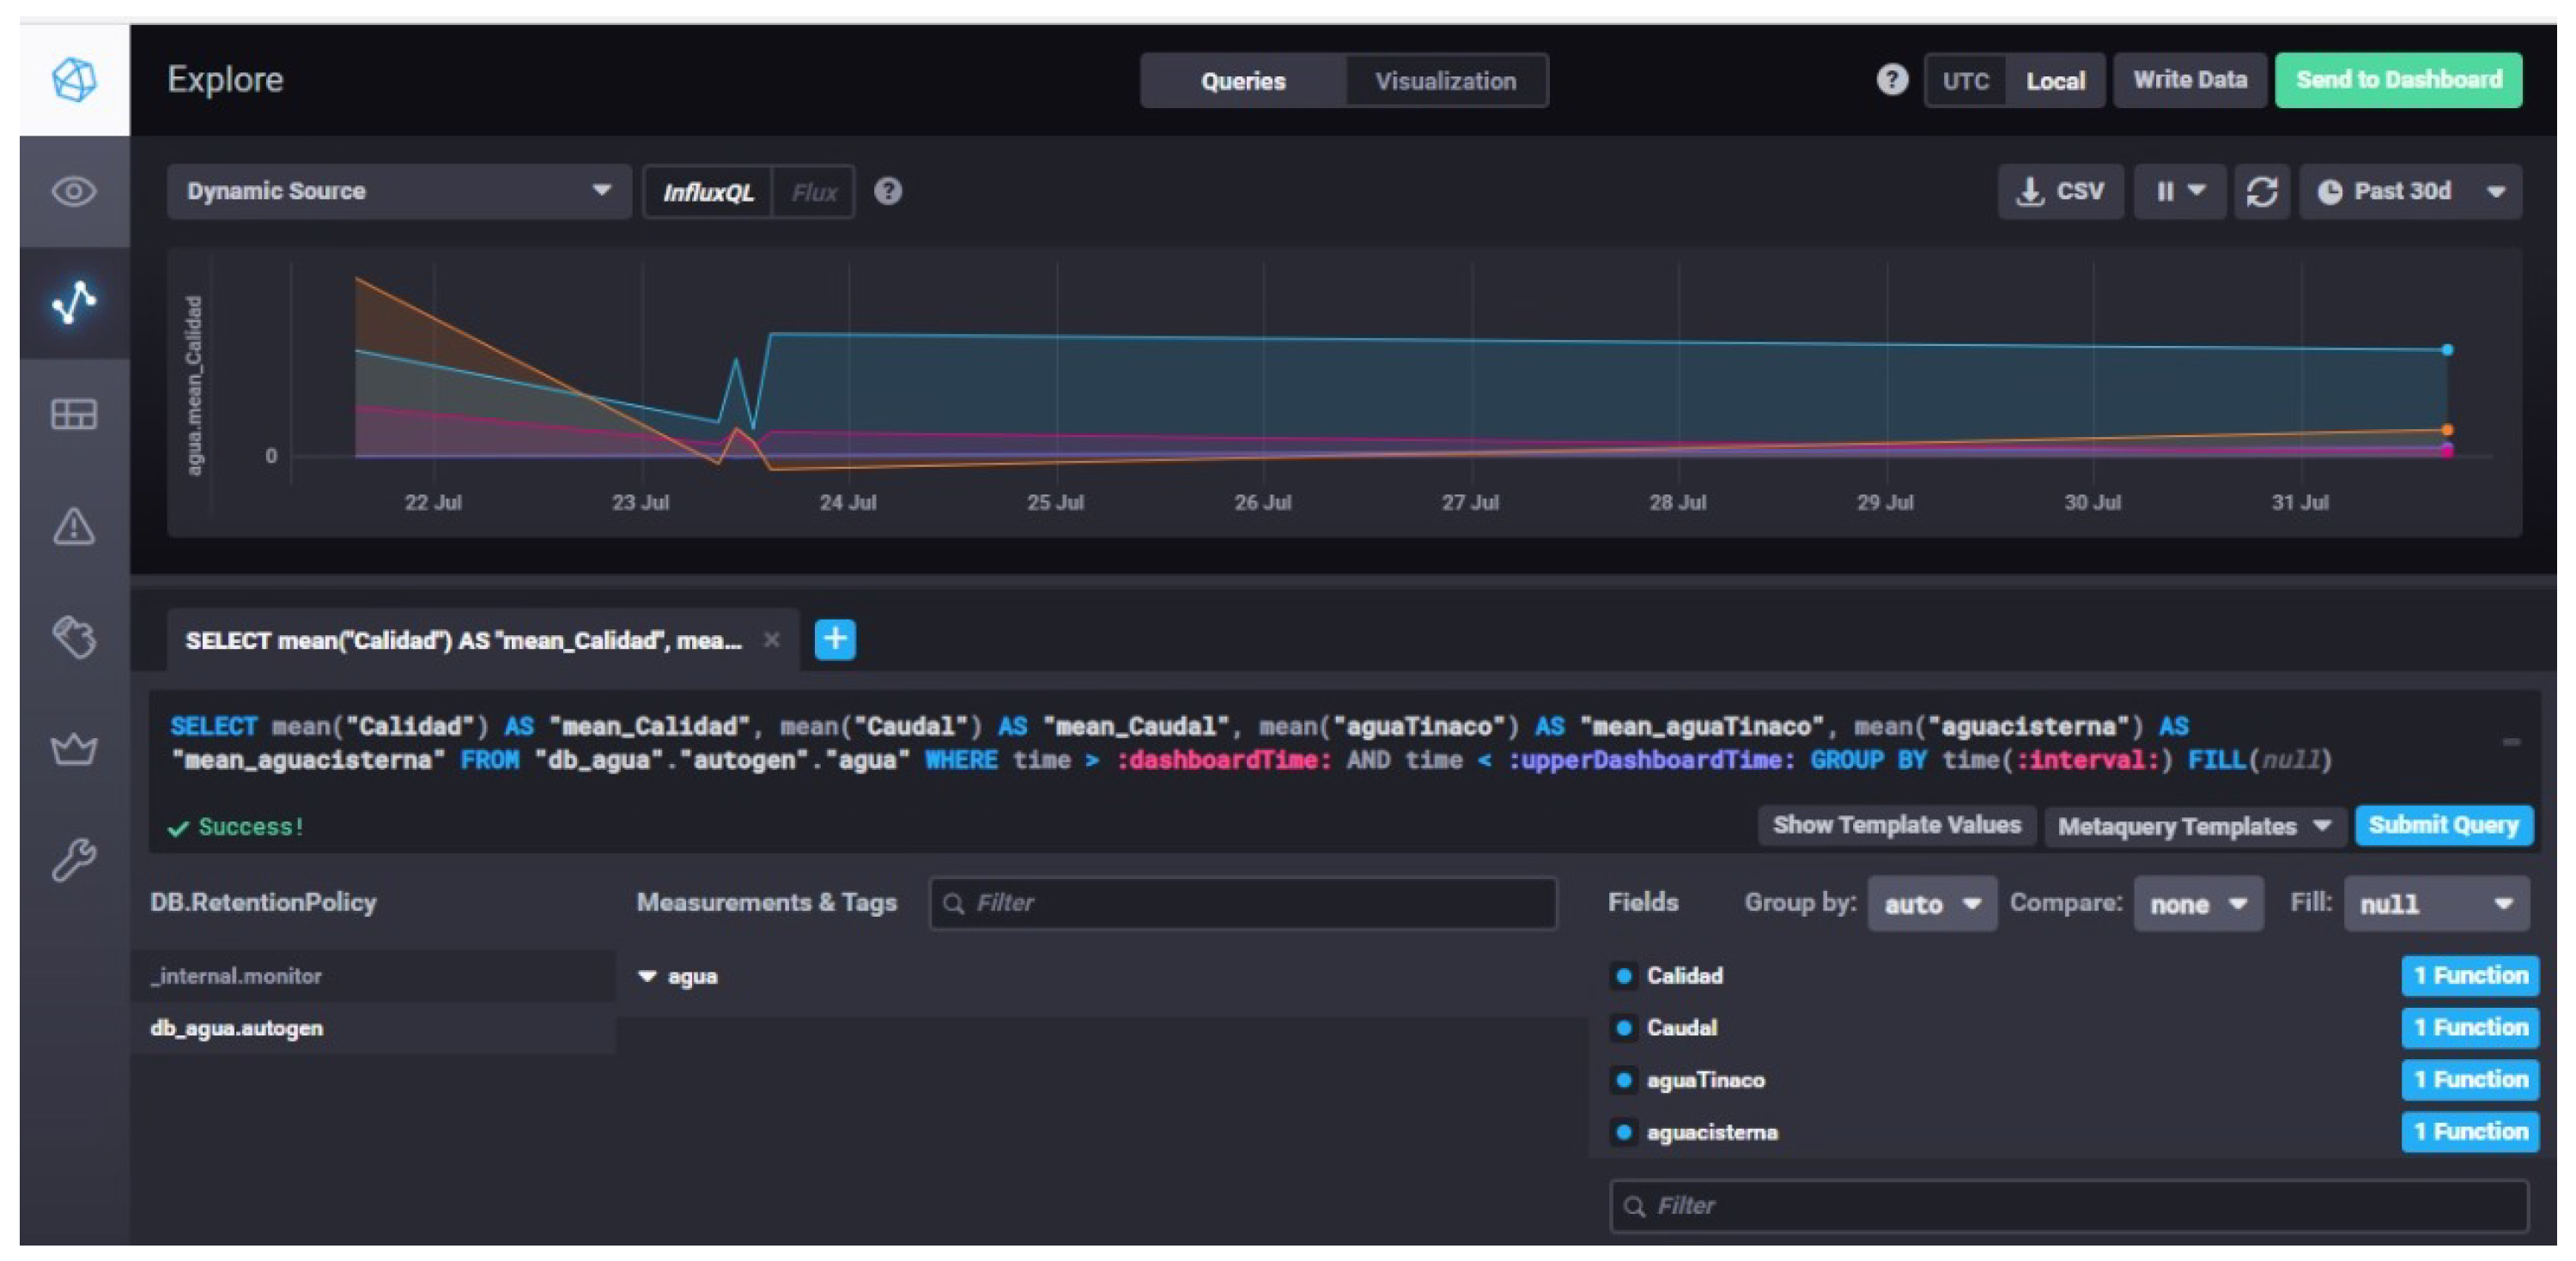
We used the InfluxDB database (InfluxDB is an open-source time series database developed by the company InfluxData. InfluxDB manages all types of time series data in a single, purpose-built database (https://www.influxdata.com/, accessed on 17 September 2024)) to record data, which stores the data generated by sensors and storage and the time series data retrieved in fields such as Internet of Things sensor data, application metrics, operations monitoring, and so on. This database stores open-source time series. Here are some graphical output views of the database generated during testing.
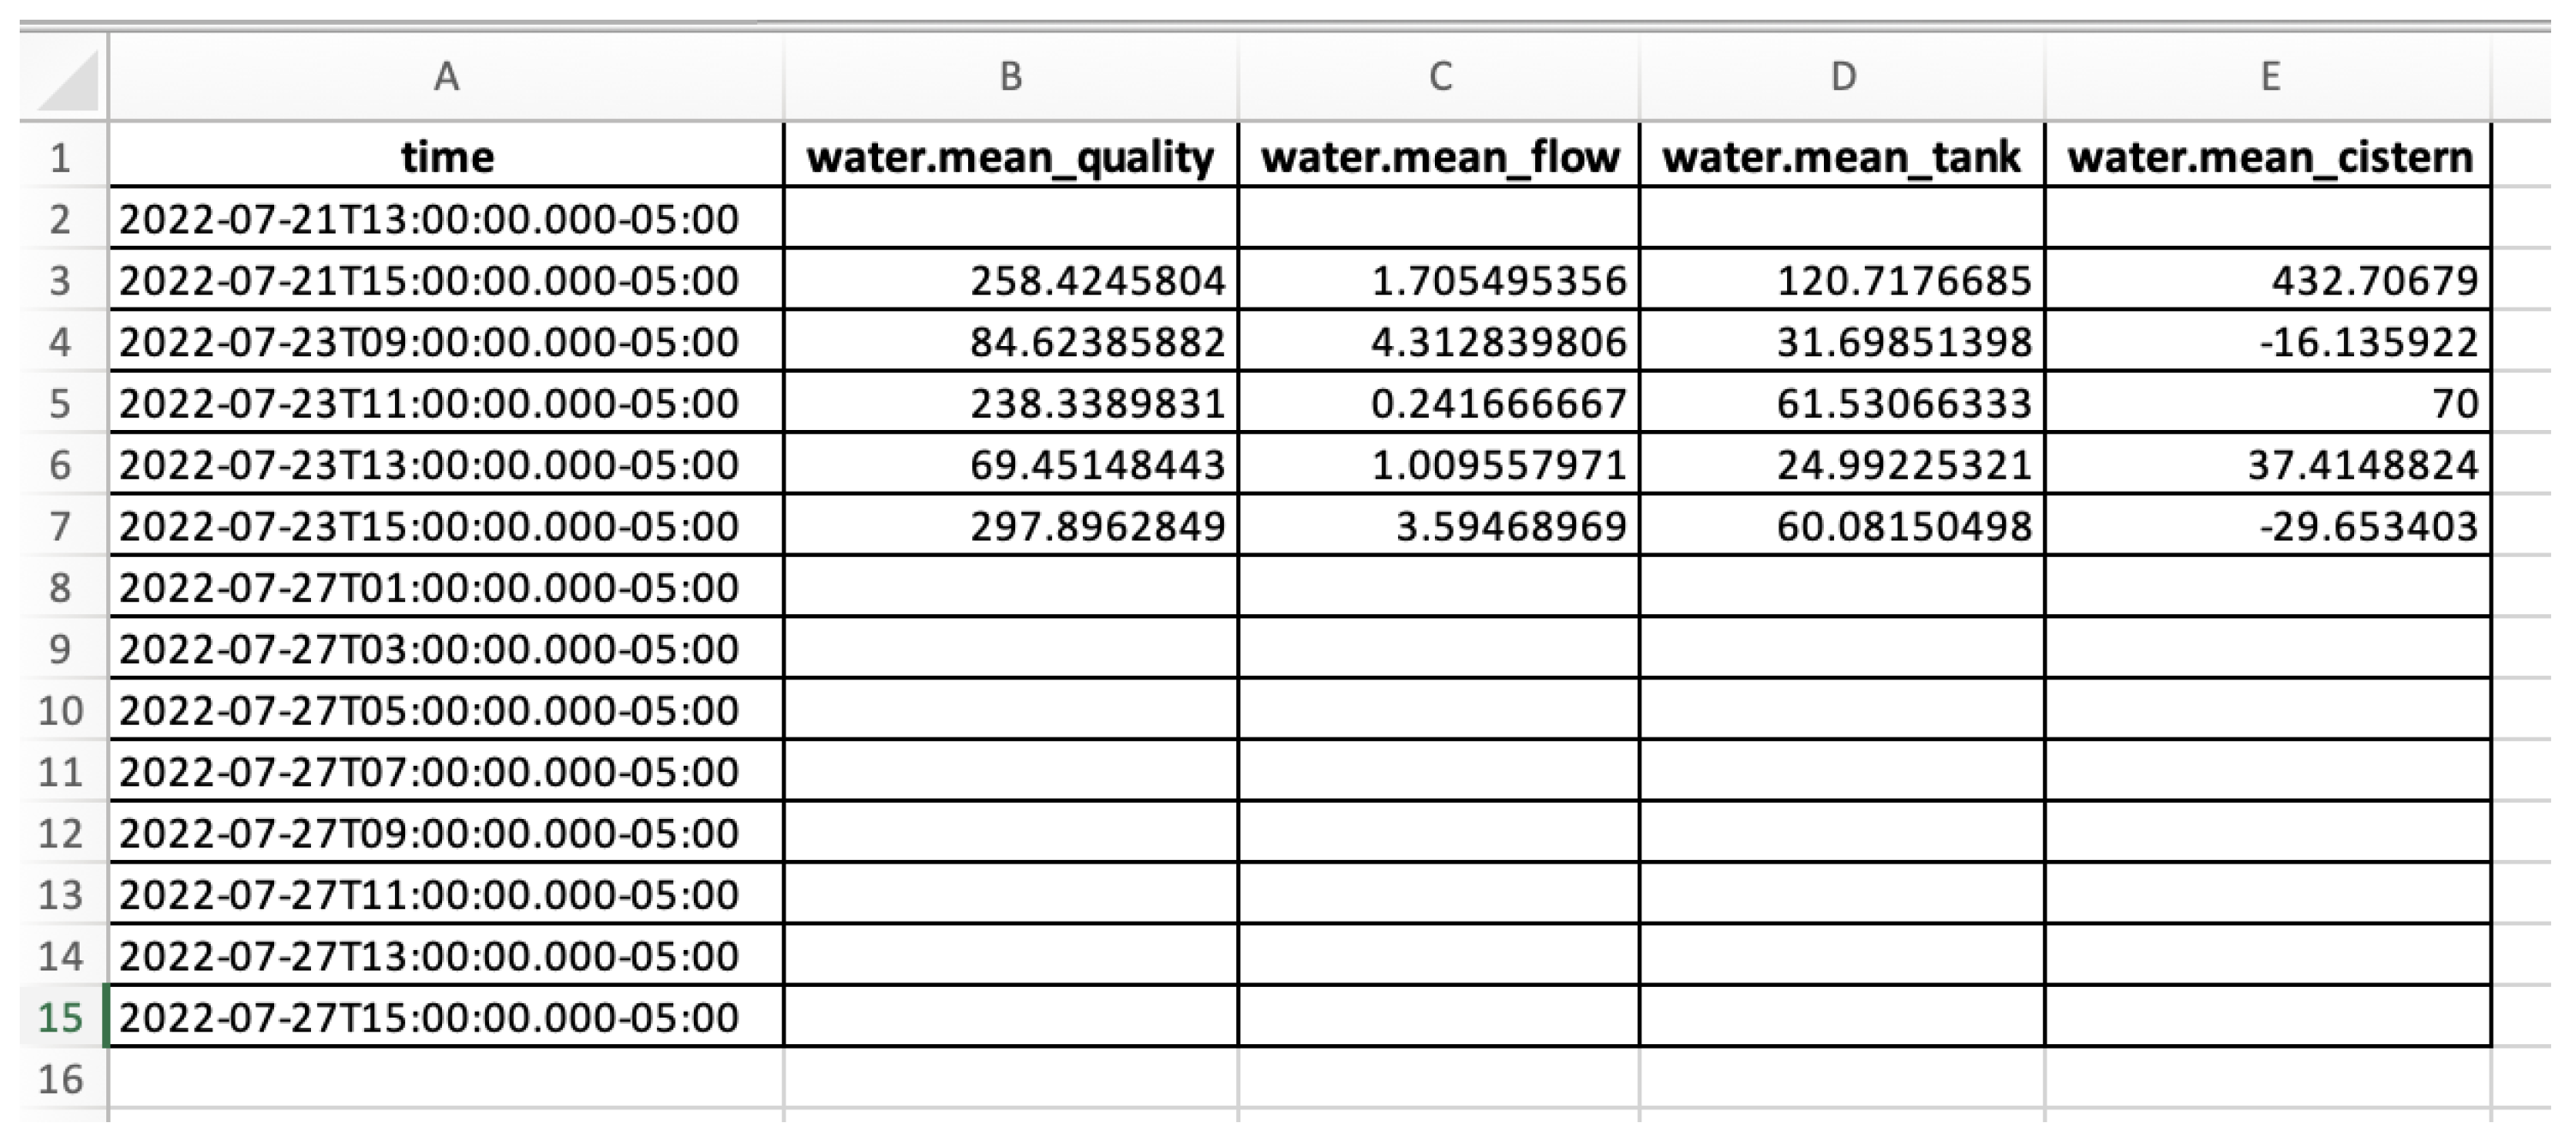
We have a database table that includes the four data variables recorded in the database generated during the run.
Below, we include an example of this table, in which the four variables we recorded are stored in the database: water quality, flow rate, water level in the tank, and water level in the cistern (see example in Figure 20).

Figure 20.
Database output. Values about water quality, flow rate, and water levels in the tank and cistern.
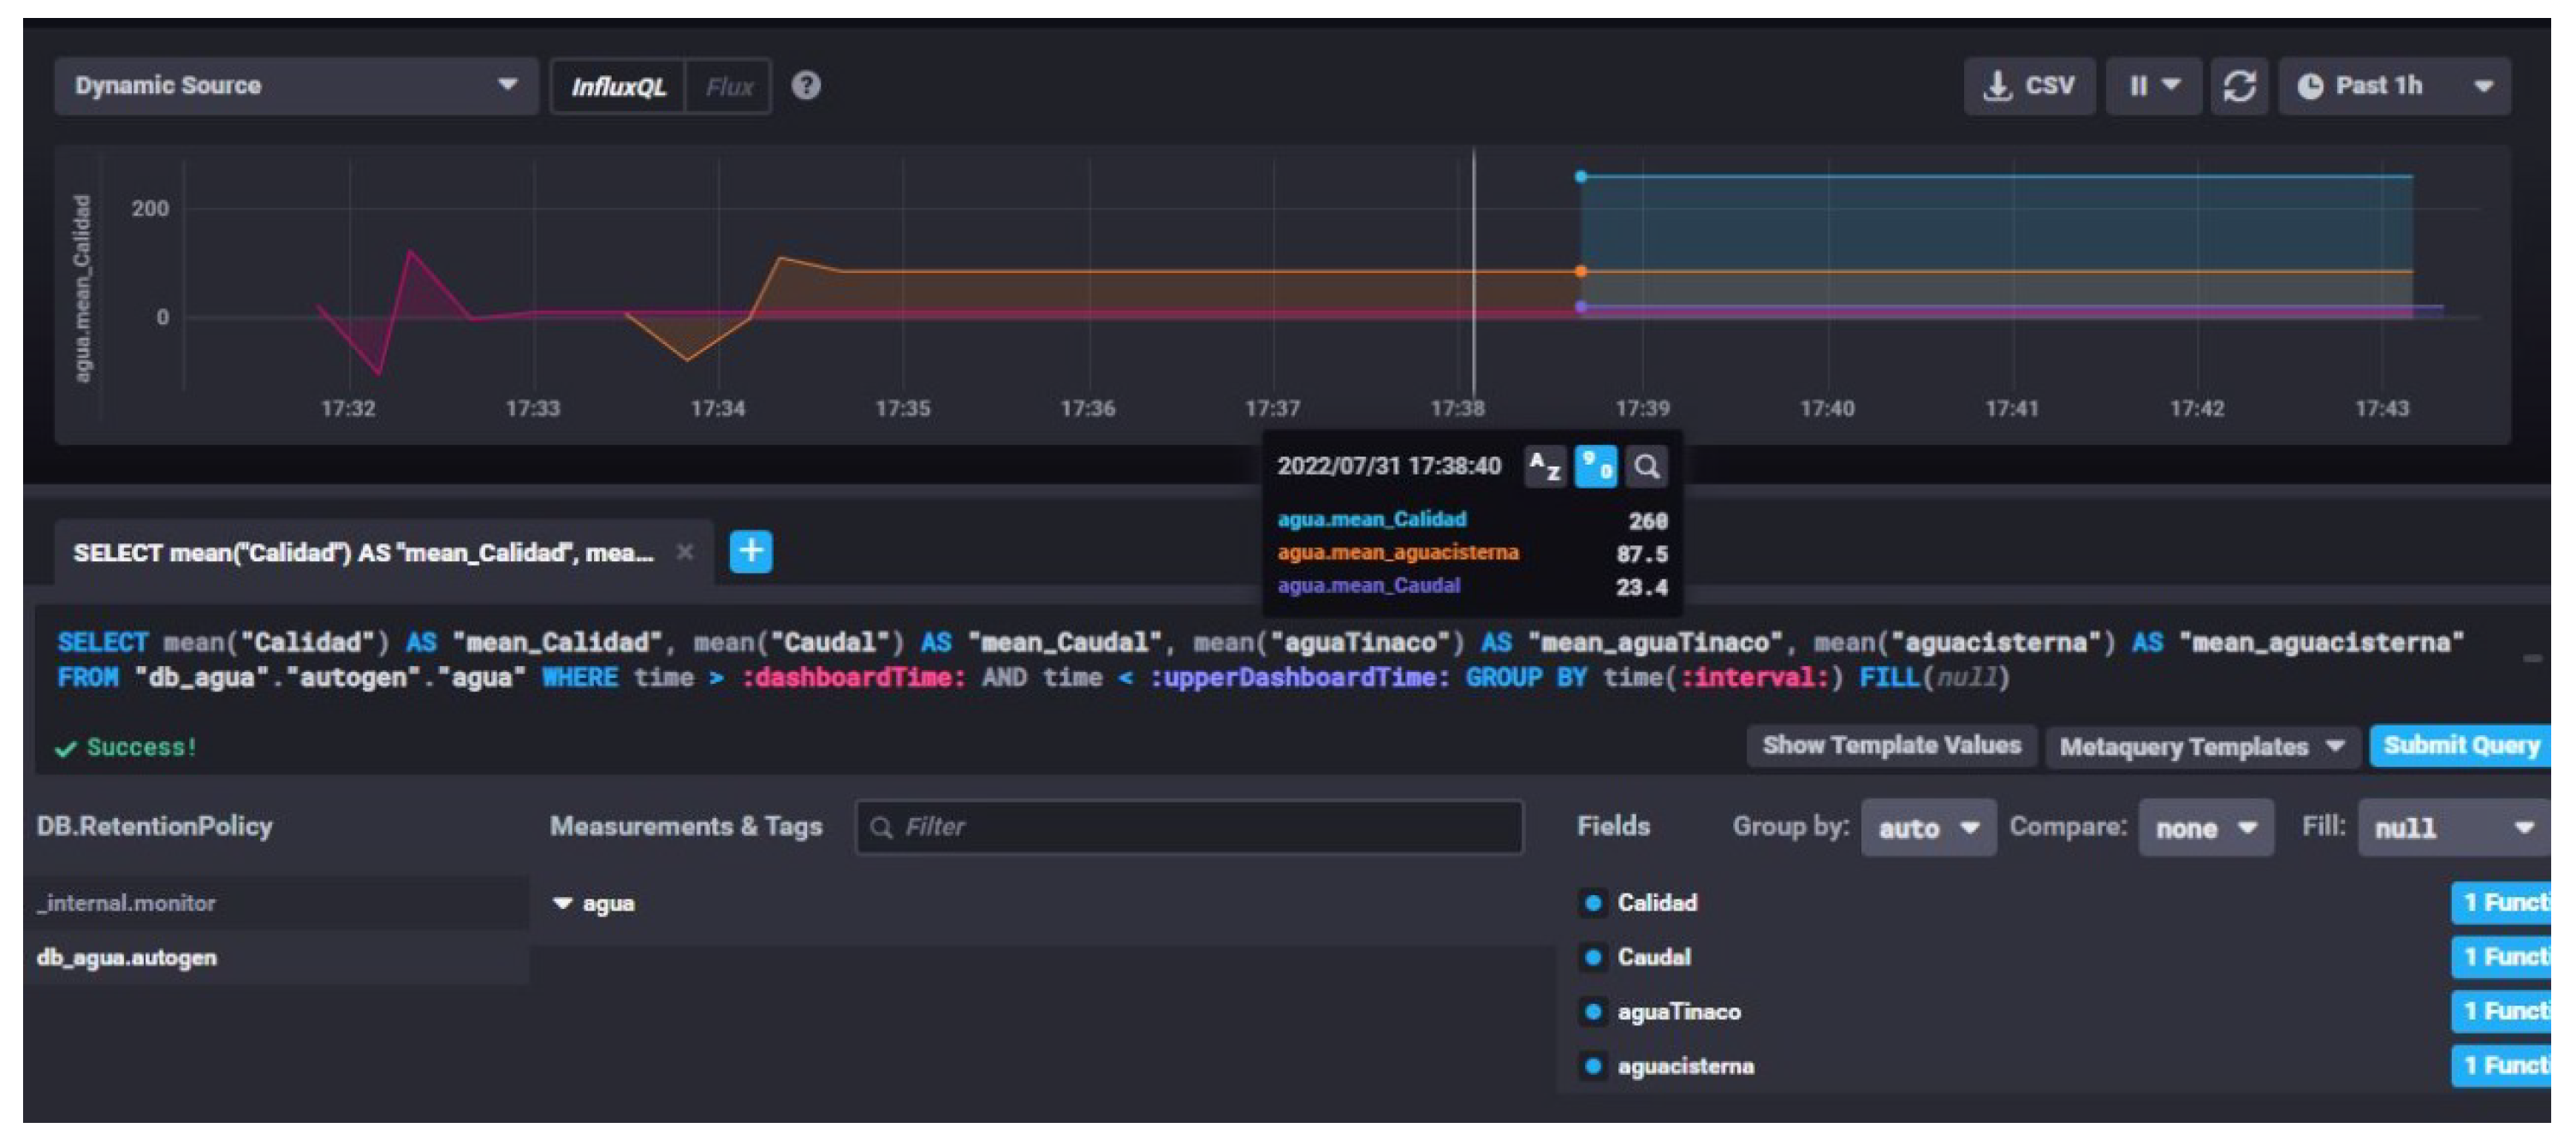
In the same way, we recorded graphs of four variables: water quality, flow rate, tank water level, and cistern water level.
We plotted the data from the database and include the plot of some of the data recorded in the database; see Figure 21 and Figure 22.

Figure 21.
Graphing the database. Here, values about water quality, flow rate, water level in the tank, and water level in the cistern are depicted.

Figure 22.
Graphing the database. This table depicts values about water quality, flow rate, the water level in the tank, and the water level in the cistern.
While the usage of data processing for using machine learning tools, with more extensive and more extended data collection, is outside the scope of this work, it is possible to perform data analysis to identify trends and patterns that reveal essential clues and increase water use efficiency at the household level, which can be scaled up to a neighborhood or city.
5. Discussion
It should be noted that our current proposal uses open-source tools and low-cost sensors. This implementation was tested on a physical scale model that does not include testing of sensor accuracy, latency, response time, sensor update speed concerning water status, security, and Internet access speed, among others. Therefore, we can point out that it is a low-cost solution that is functional for home use and possibly scalable for neighborhoods.
A significant difference to highlight in our proposal is that it stores data in a database to allow analysis; for the moment, it only stores them in a database.
We have seen some proposals in related work. Unlike these works, our proposed system improves solutions in several key respects: while other proposals only monitor water levels, our system meters water flow and measures water quality, providing critical information on water potability.
Regarding energy efficiency, MQTT improves power consumption by reducing communication overhead and facilitating efficient data transmission in low-power networks. The low-power components mentioned above, e.g., NodeMCU, make our system more efficient than other approaches that do not use it.
With respect to cost, our proposal uses affordable components and open-source software, making it economical and viable for deployment in various environments, including homes and neighborhoods.
Our system is potentially scalable. Due to standard IoT technologies and the MQTT protocol, it can quickly adapt to different needs, making expansion easy.
IoT data security is a pending subject that poses many risks. We know that IoT devices generally have limited capabilities, making them easy targets for hacking and malware and challenging to implement robust security measures.
Finally, regarding hardware and cloud infrastructure adjustments for scalability, it is necessary to upgrade the microcontrollers to ones with more processing power and memory in order to manage multiple sensors and improve connectivity. Regarding cloud infrastructure, scalable storage services such as Google Cloud IoT or other solutions that manage large volumes of data generated by distributed sensors are required.
To summarize, this system provides more complete and accurate monitoring and does so efficiently and cost-effectively, with the ability to scale as needed.
6. Conclusions
This proposal outlines the use of IoT devices to create a sensor network for monitoring the flow of drinking water to a house’s cistern, the water pumped to a tank by a submersible pump, and the quality of that water. We employ ultrasonic sensors to measure water levels in both the cistern and the tank.
As mentioned, we addressed experiments using a physical scale model, using buckets to simulate a cistern and a tank. We connected various devices, including microcontrollers, sensors, actuators, software, and a computer. We initiated the water flow during these tests while monitoring the system online. After finishing all tests, all data about the water’s behavior were recorded in a database.
We conclude that the system monitors water levels in the cistern and tank. It can measure water quality, sense water flow, and raise water from the cistern to the tank.
We suggest introducing machine learning to analyze a household’s water consumption for future research and directions. Eventually, we could know if a house will run out of water due to lack of efficient use.
Author Contributions
Conceptualization: M.A.W., E.L. and A.A.-C.; methodology: M.A.W., E.L. and A.A.-C.; hardware and programming: M.A.W. and E.L.; writing—original draft preparation: M.A.W. and A.A.-C.; writing—review and editing, M.A.W., E.L., A.A.-C., P.P. and J.A.H.-N. visualization, P.P. and J.A.H.-N.; supervision, P.P. and J.A.H.-N. All authors have read and agreed to the published version of the manuscript.
Funding
This research received no external funding.
Data Availability Statement
The original contributions presented in the study are included in the article, further inquiries can be directed to the corresponding author.
Acknowledgments
The authors would like to thank Marycruz Valenzuela for her valuable help in drawing some figures.
Conflicts of Interest
The author declares no conflicts of interest.
Abbreviations
The following abbreviations are used in this manuscript:
| IoT | Internet of Things |
| MQTT | Message Queuing Telemetry Transport |
| ppm | Parts per million |
| TDS | Total Dissolved Solids |
| WSN | Wireless Sensor Networks |
Appendix A
The codes developed in this work can be found at the following addresses (accessed on 18 September 2024).
Source code for the ultrasonic sensor in the tank
This is the program for the configuration of the ultrasonic sensor used to measure the distance of the water surface in the tank concerning the sensor, the flow meter (water pressure) used to determine the flow of water entering the tank, the TDS sensor used to obtain values of the quality of the water stored in the tank, and the configuration of the submersible water pump together with the WiFi network and MQTT communication protocol configurations.
(watertankcode.ino) https://github.com/miguelwister/water (accessed on 18 September 2024).
Cistern sensor source code
In this code, the configuration of the ultrasonic sensor used to measure the distance of the water surface in the tank concerning the sensor is programmed, as well as the network configurations and the MQTT protocol.
(watercisterncode.ino) https://github.com/miguelwister/water (accessed on 18 September 2024).
References
- Jan, F.; Min-Allah, N.; Saeed, S.; Iqbal, S.Z.; Ahmed, R. IoT-based solutions to monitor water level, leakage, and motor control for smart water tanks. Water 2022, 14, 309. [Google Scholar] [CrossRef]
- Malche, T.; Maheshwary, P. Internet of things (IoT) based water level monitoring system for smart village. In Proceedings of the International Conference on Communication and Networks (ComNet 2016), Thiruvananthapuram, India, 21–23 July 2016; Springer: Singapore, 2017; pp. 305–312. [Google Scholar]
- Durga, S.N.; Ramakrishna, M.; Dayanandam, G. Autonomous water tank filling system using IoT. Int. J. Comput. Sci. Eng. 2018, 6, 123–141. [Google Scholar] [CrossRef]
- Ali, H.; Choi, J.H. A Review of Underground Pipeline Leakage and Sinkhole Monitoring Methods Based on Wireless Sensor Networking. Sustainability 2019, 11, 4007. [Google Scholar] [CrossRef]
- Kurniawan, E.; Sularno, H.; SW, A.A.I. Monitoring Water Levels in Fresh Water Tank Using The Concept of IoT (Internet of Think). Pros. Politek. Ilmu Pelayaran Makassar 2020, 1, 120–126. [Google Scholar] [CrossRef]
- Jayalakshmi, S. IoT-enabled smart water tank monitoring system with android application control. i-Manag. J. Instrum. Control. Eng. 2023, 11, 37. [Google Scholar] [CrossRef]
- Singh, H.K.H.; Kamaludin, H.; Hamid, I.R.A.; Safar, N.Z.M.; Abdullah, N. IoT-Based water tank level monitoring system using ultrasonic sensor. AIP Conf. Proc. 2023, 2608, 020009. [Google Scholar] [CrossRef]
- Zhukovskyy, V.; Printz, D.; Zhukovska, N.; Hubach, M.; Rajab, H. IoT based Intelligent Information-Analytical System Architecture for Water Tank Monitoring. In Proceedings of the 2021 International Conference on Information Technology (ICIT), Amman, Jordan, 14–15 July 2021; pp. 924–928. [Google Scholar] [CrossRef]
- Cheng, W.Z.; Cheng, R.G.; Chou, S.Y. Power-saving for IoT-enabled water dispenser system. In Proceedings of the IEEE 2019 42nd International Conference on Telecommunications and Signal Processing (TSP), Budapest, Hungary, 1–3 July 2019; pp. 736–739. [Google Scholar]
- Gunde, S.; Chikaraddi, A.; Baligar, V. IoT based flow control system using Raspberry PI. In Proceedings of the IEEE 2017 International Conference on Energy, Communication, Data Analytics and Soft Computing (ICECDS), Chennai, India, 1–2 August 2017; pp. 1386–1390. [Google Scholar]
- Monsef, H.; Naghashzadegan, M.; Farmani, R.; Jamali, A. Pressure management in water distribution systems in order to reduce energy consumption and background leakage. J. Water Supply Res. Technol. AQUA 2018, 67, 397–403. [Google Scholar] [CrossRef]
- Jan, F.; Min-Allah, N.; Düştegör, D. Iot based smart water quality monitoring: Recent techniques, trends and challenges for domestic applications. Water 2021, 13, 1729. [Google Scholar] [CrossRef]
- Pujar, P.M.; Kenchannavar, H.H.; Kulkarni, U. Wireless sensor network based water monitoring systems: A survey. In Proceedings of the IEEE 2016 2nd International Conference on Applied and Theoretical Computing and Communication Technology (iCATccT), Bengaluru, India, 21–23 July 2016; pp. 155–159. [Google Scholar]
- Lambrou, T.P.; Anastasiou, C.C.; Panayiotou, C.G.; Polycarpou, M.M. A Low-Cost Sensor Network for Real-Time Monitoring and Contamination Detection in Drinking Water Distribution Systems. IEEE Sens. J. 2014, 14, 2765–2772. [Google Scholar] [CrossRef]
- Irianto, K.D. Residential Water Tanks with IoT: A Solution for Household Water Consumption Monitoring. Asian J. Res. Comput. Sci. 2022, 14, 238–247. [Google Scholar] [CrossRef]
- Zhukovskyy, V.; Printz, D.; Zhukovska, N. Human-Computer Interaction in IoT System for Water Tank Monitoring and Controlling. In Proceedings of the 2023 IEEE 18th International Conference on Computer Science and Information Technologies (CSIT), Lviv, Ukraine, 19–21 October 2023; pp. 1–5. [Google Scholar] [CrossRef]
- Dolfi, M.; Colzi, I.; Morosi, S.; Masi, E.; Mancuso, S.; Del Re, E.; Francini, F.; Magliacani, R. Plant electrical activity analysis for ozone pollution critical level detection. In Proceedings of the 2015 23rd European Signal Processing Conference (EUSIPCO), Nice, France, 31 August–4 September 2015; pp. 2431–2435. [Google Scholar] [CrossRef]
- Morosi, S.; Dolfi, M.; Del Re, E.; Masi, E.; Colzi, I.; Mancuso, S.; Francini, F.; Magliacani, R.; Valgimigli, A.; Masini, L. A WSN for ground-level ozone monitoring based on plant electrical activity analysis. In Proceedings of the 2015 International Wireless Communications and Mobile Computing Conference (IWCMC), Dubrovnik, Croatia, 24–28 August 2015; pp. 715–720. [Google Scholar] [CrossRef]
- UXM; Turner, N. A Guide to Carrying Out Usability Reviews. 2011. Available online: https://www.uxforthemasses.com/usability-reviews/ (accessed on 19 August 2024).
- Nielsen, J.; Landauer, T.K. A mathematical model of the finding of usability problems. In Proceedings of the the INTERACT ’93 and CHI ’93 Conference on Human Factors in Computing Systems, Amsterdam The Netherlands, 24–29 April 1993; pp. 206–213. [Google Scholar] [CrossRef]
- Moran, K. Qualitative Usability Testing: Study Guide. 2013. Available online: https://www.nngroup.com/articles/qual-usability-testing-study-guide/ (accessed on 19 August 2024).


Disclaimer/Publisher’s Note: The statements, opinions and data contained in all publications are solely those of the individual author(s) and contributor(s) and not of MDPI and/or the editor(s). MDPI and/or the editor(s) disclaim responsibility for any injury to people or property resulting from any ideas, methods, instructions or products referred to in the content. |
© 2024 by the authors. Published by MDPI on behalf of the International Institute of Knowledge Innovation and Invention. Licensee MDPI, Basel, Switzerland. This article is an open access article distributed under the terms and conditions of the Creative Commons Attribution (CC BY) license (https://creativecommons.org/licenses/by/4.0/).