Abstract
Nondestructive tests, commonly employed in rock mechanics, estimate mechanical parameters without affecting the rocks in situ properties. This study evaluates non-destructive tests (ultrasonic pulse velocity and Schmidt hammer) for forecasting the strength and physical properties of commonly used rocks. Weathering grades and moisture content are provided as variables that produce variances in both non-destructive tests. The coefficient of determination (R²) and subsequent empirical equations for the best-fit trend line are calculated using a simple regression method. The ultrasonic pulse velocity is found to be more efficient in estimating most of the physical properties (specific gravity, porosity, water absorption, and dry density) of granite, marble, and sandstone, with high correlation coefficients. Whereas the Schmidt hammer is found to be more reproducible in determining the strength (compressive and tensile) of granite, marble, and sandstone. The student’s t-test proved the sensitivity and correctness of the acquired equations from the suggested correlations, and agreement was established between measured and estimated plots of strength and physical properties. Although the student’s t-test confirms that the performance of all empirical models established in this study are significant, any non-destructive test with a low R² value should be used with caution when estimating the studied properties.
1. Introduction
Destructive and non-destructive tests are used to measure the strength and physical characteristics of rocks, which are critical factors in engineering design [1,2,3]. Non-destructive testing (NDT) does not include any intrusion of the rock specimen for specimen preparation, while destructive testing (DT) does [4]. For physico-mechanical characteristics, direct destructive testing is expensive, time-consuming, and requires a significant understanding of specimen preparation and high-tech equipment. These drawbacks have been addressed by the scientific community through the introduction of inexpensive, fast, reliable, and indirect non-destructive techniques that require little or no sample preparation and only minimal operating expertise [2,5,6]. UPV (ultrasonic pulse velocity) and SH (Schmidt hammer) are two examples that may be utilized in the field or laboratory [7,8,9,10]. Table 1 shows a description of the abbreviations and acronyms used.

Table 1.
List of abbreviations and acronyms used in this article.
When determining an object’s ultrasonic pulse velocity, P-waves of various pulse durations are sent, propagated, and received in the medium [11,12,13,14,15,16]. The sample length divided by the time it takes for the P-wave (primary wave measurement) to go through the rock sample gives the velocity. Whereas the spring-loaded mass and electronic or sliding pointer and plunger make up the Schmidt hammer. The rock rebound (R-value) is recorded when the hammer hits the rocks surface [17,18]. Rock texture (grain size and form), weathering grade, moisture content, density, porosity, anisotropy, confining pressure, and bedding planes all impact the UPV and R-value fluctuation. A positive correlation exists between the P-wave velocity and R-value and the strength and dry density, and the opposite is true for porosity and water absorption. Higher UPV and R-values are typically obtained in stronger materials, making them more desirable in engineering applications. Several studies have found a reasonable correlation between the strength and physical properties of various rocks and NTDs [19,20,21,22]. As density and moisture content rise, so do porosity and microfracture, and vice versa [7,23,24,25]. However, even when the weathering grade is high, this technique may have opposite results for rocks with water-filled pores; thus, it must be used with caution. According to Karaman and Kesimal [26] uniaxial compressive strength (UCS) and UPV have a non-linear connection. The UPV decreases with increasing fracture roughness and vice versa, according to statistical models constructed by Aşcı et al. [27]. Shear strength, indirect tensile strength, compressive strength, modulus of elasticity, Poisson’s ratio, and density of rock specimens comprising coal-bearing strata were all studied by Khandelwal [28] using regression analysis to produce empirical equations. There was a substantial correlation and coefficient of determination in the developed equations. Regression analysis was used on 64 sedimentary rock samples to get the best-fit equation by Moradian and Behnia [29]. To estimate the specified parameter, the resulting equation was both accurate and usable. A similar approach has been used to estimate the unconfined compressive strength, Young’s modulus, and dry density of Schmidt hammers by comparing the R-values of the Schmidt hammer [18,30]. The efficiency of R-values in predicting the strength of different rock types has also been examined in several studies [30]. The equations that were generated could predict a wide range of mechanical characteristics. Based on statistical analyses, equations are also established between the physical and strength characteristics of rocks to estimate the abrasion wear resistance. The findings demonstrate that these equations can be used to predict the abrasion wear resistance of natural building stone [31,32,33].
Preliminary investigations on the geotechnical properties of North-Pakistani rocks concentrated on the relation between strength and petrographic features; however, their association with NDT was missing, demanding more study. Similarly, elsewhere, the NDTs have been studied extensively, but little attention has been dedicated to comparing them. In this study, non-destructive testing (NDT) techniques such as ultrasonic pulse velocity and Schmidt hammer testing are used to determine the strength and physical properties of the selected rocks. Granite, marble, and sandstone were studied as examples of common rock types. The investigation also improved our knowledge of the NDTs’ dependability. Following a petrographic analysis, the strength and physical properties of the material are assessed. Additionally, the effect of moisture content on NDTs is examined. Results are then linked with strength and physical attributes to define an efficient NDT.
2. Geology of the Study Area
In the research area, located in the Peshawar Plain Alkaline Igneous Provence (PPAIP) and the Peshawar basin, a range of igneous, metamorphic, and sedimentary rocks are well exposed [34,35] (Figure 1). This study focuses on granite (Igneous rock) from Malakand and Utla, marble (Metamorphic rock) from Nowshera Formation, and sandstone (Sedimentary rock) from Murree Formation to establish their physical and strength characteristics using NDTs. A brief description of the selected rock units is given in this section.
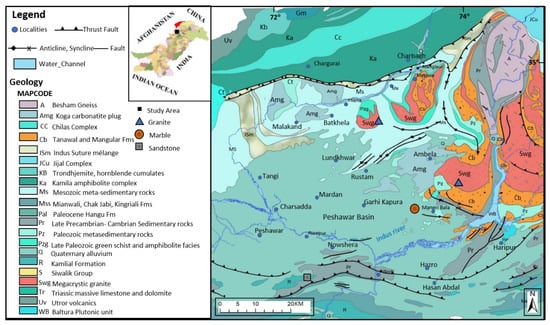
Figure 1.
Geological map of the study area showing the locations of the selected samples.
2.1. Malakand Granite
According to Chaudhry et al. [36], it is still debatable whether Malakand granite is a component of PPAIP, despite being chemically identical to Ambela, Shewa-Shahbazgarhi, and Warsak granite. Malakand granite is a small, oval-shaped pluton covering about 40 km2 with fine-grained chill zones at its contact and a cross-cut interaction with the country rocks [37,38]. According to Khattak et al. [39] and Le Bas et al. [40], alkaline magmatism occurred in two phases: (i) Permian and (ii) Paleogene (Oligocene). The emplacement of Malakand granite is attributed to the second phase.
2.2. Utla Granite
Khan and Hammad [41] investigated the petrography of Utla granite and concluded that it is related to the Ambela granitic complex (AGC), which encompasses 900 km2 and is the primary associate of the PPAIP. The Utla granites to the east of the Ambela granitic complex appear to be in spatial continuity and hence may constitute the AGC’s eastward expansion [42]. Later studies, on the other hand, grouped the Utla granites with the Mansehra and Swat granites [43,44,45,46]. Sajid et al. [47] attributed an early palaeozoic emplacement date to the Utla granite, which is statistically synchronous to the Mansehra granites based on U-Pb zircon geochronological analysis.
2.3. Nowshera Formation
Stauffer [48] gives the fossiliferous carbonates under Misri Banda Quartzite the name Nowshera Formation. Pogue and Hussain [49] later added calcareous and dolomitic quartzite, labelled Misri Banda Quartzite by Stauffer [48], to the Nowshera Formation. The type locality is along the Nowshera-Risalpur road to the north of Nowshera and is classified as a reef complex due to its extremely fossiliferous nature [50,51]. It is comprised of dolomitic and calcareous quartzite, sandy dolomite, fossiliferous limestone, and subordinate argillite. It includes calcite-rich marble near Maneri village in the district of Swabi. According to Talent and Mawson [52], the formation dates from the Early to Late Devonian.
2.4. Murree Formation
The stratigraphic committee of Pakistan named the Murree Formation after the Murree Hills in Rawalpindi District. The type locality is in Attock District, to the north of Dhok Maiki [53,54,55]. It stretches from Darra Adamkhel in the southwest to the southernmost point of the Peshawar Basin, where it spreads on the northwestern edge of the Attock-Cherat ranges [56]. Sandstone, siltstone, and shale make up the formation. The sandstone content is significant, and its colour ranges from greyish brown to greenish grey and purple in parts [57]. The Murree Formation is Early Miocene in age and has lower confirmable contact with the Patala Formation [58].
3. Materials and Methods
Table 2 shows the three granite samples (MG, UGA, and UGB), two marble samples (NFA and NFB), and three sandstone samples obtained in the field (MFA, MFB, and MFC). Selected samples were homogeneous in terms of their fundamental properties, such as texture and weathering grade. Weathering grades (WG) were assigned following the study of Borrelli et al. (2007). Figure 2 shows the flow chart of the research methodology. For NDT, strength, and physical testing, samples were taken to the Geotechnical Engineering Laboratory at the National Centre for Excellence in Geology (NCEG) in Pakistan. Three NX-size (54.75 mm) core specimens were obtained from each sample. A polarized microscope (Microscope Model Eclipse LV100ND of Nikon, Tokyo, Japan) was used for petrographic investigation. To get an idea of what minerals were present in the sample, the mineral composition and grain size were visually analyzed according to BS EN 12407 (British National Standards) [59].
Table 2.
List of abbreviations and acronyms used in this article.
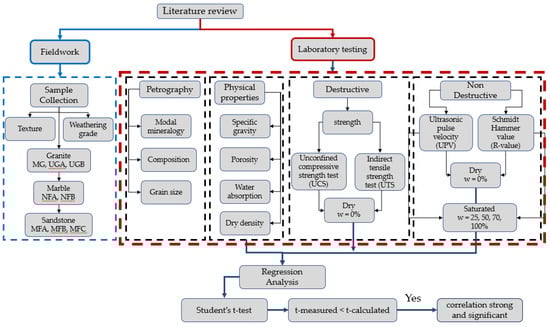
Figure 2.
Flow chart of the research methodology.
By producing core samples at different moisture levels, including 0, 25, 50, 75, and 100%, the impact of moisture content on both NDTs was investigated, as proposed by Bozkurt and Yazicioglu [60] and Chen et al. [61]. The moisture content was regulated to the required percentage by adjusting the mass of pores and water in the specimen by periodic weighing while drying in air at room temperature.
where,
Mpw = Mass of the specimen with pore water
Msat = Mass of saturated specimen
Mod = Oven dry mass
A UPV tester was used to evaluate the ultrasonic pulse velocity (UPV) of dry and saturated samples (i.e., 0, 25, 50, 75, and 100%) (Model 58-E4800 UPV MS Controls Italy). The researchers employed a pitch-catch technique, which uses a pair of transducers (transmitter and receiver) [62]. With a pulse rate of 2 s−1 and a natural resonance frequency of 54 kHz, piezoelectric transducers (probes) were used. Both probes were positioned on opposite sides of the cylindrical specimen in a direct-transmission manner. To reduce the impact of pores and improve the signal-to-noise ratio between the probes and the specimen, a coupling agent was used. An average of three transit time values was collected for each specimen in the dry condition. After measuring the length of the route, Equation (2) calculated the ultrasonic pulse velocities.
where,
L = length of the path
t = transit time
The rebound hardness test was performed according to ASTM D 5873–14 using an N-type Schmidt hammer with an impact energy of 2.207 Nm (MS Controls Italy Model D5873-14). To show the effect on rebound values, the approach was applied to dry and saturated samples (i.e., 0, 25, 50, 75, and 100%) (Rdry-value and Rsat-value).
The ASTM C 170M-17 (C170M-17) and ASTM D 3967-16 (D3967-16) standards were used to measure unconfined compressive strength (using core samples with 110 mm length and 55 mm diameter) and indirect tensile strength (using disc samples with 55 mm diameter and 28 mm thickness). The ASTM (C97M-18) was used to assess physical parameters such as specific gravity and water absorption, while the saturation and buoyancy technique was used to estimate porosity and dry density [63].
Regression Analysis
Simple regression analysis was used to develop prediction models for dependent variables, such as physical parameters (specific gravity, porosity, water absorption, and dry density), strength parameters (unconfined compressive strength and indirect tensile strength), and independent variables, i.e., NDTs (UPV and Schmidt Hammer). The XY scatter chart in the Microsoft Excel software suite was used to depict the data from the responder and regressor/predictor variables. Several trend line functions, including both linear and nonlinear functions, were used to examine the relationships (exponential, logarithmic, polynomial, and power) based on the lowest fit of errors criteria. Each of these functions produces a correlation coefficient and an equation (R²). The R² calculates the variability of one variable by dividing it by the variability (deviation) of the other [64]. During the regression analysis, the response variables were estimated using the equation with the best R² value.
A student’s t-test with a 95% confidence level was used to investigate the significance of the R² values produced from the established associations (i.e., NDTdry versus UCS and UTS) (3).
where,
= Actual difference between the means of two variables
= the variation or dispersion in the data
The calculated and tabulated t-values are compared in this test. The value of the t-tabulated, also known as the t-critical, must be smaller than the calculated t-value derived from the regression to declare a strong and significant correlation [65].
4. Results
4.1. Petrographic Observation
This section gives a quick overview of the rocks that were studied. The modal mineralogy and mean grain size are reported in Table 3, and selected microphotographs of the rock samples are shown in Figure 3.
Table 3.
Modal mineralogy and mean grain size of the investigated rocks.
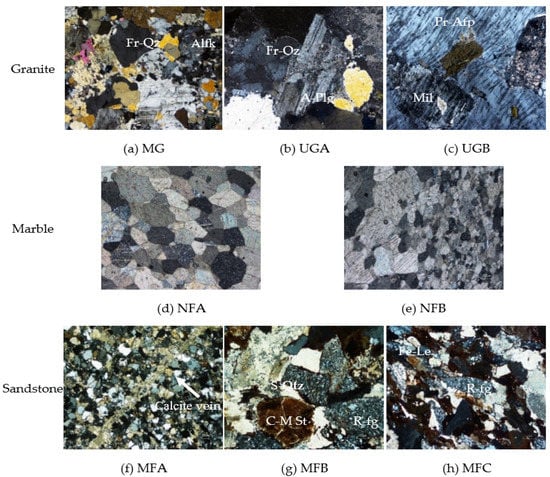
Figure 3.
Photomicrographs of investigated granite, marble, and sandstone (a–c) One set of cleavages are observed in UGA and UGB samples, Fr-Qz: fractured quartz, Alfk: alkali feldspar, A-Plg: altered plagioclase, Pr-Afp: perthite alkali feldspar, Mil: microcline (d,e) calcite-rich marble in NFA and NF B (f–h) fractures are seen in MFA and MFC samples, C-M St: clay rich mudstone, R-fg: volcanic rock fragments, Fe-Le: iron leaching.
4.1.1. Granite
The key minerals in MG were anhedral alkali feldspar, plagioclase, and quartz. MG was medium- to fine-grained. With the addition of apatite, zircon, and clinozoisite, quartz displayed undulose extinction and intra-granular fractures. Muscovite, biotite, tourmaline, opaque minerals, epidote, microcline, and monazite were among the other accessory minerals found.
UGA was composed of subhedral to anhedral alkali feldspar, quartz, and plagioclase and was coarse- to medium-grained. At the boundaries, both alkali feldspar and plagioclase displayed strong sericitization and dissolution. In the quartz grains, there was an intense intra-granular discontinuity as well as the presence of andalusite, apatite, and zircon. Biotite, muscovite, tourmaline, epidote, and opaque minerals are examples of accessory minerals.
UGB had a porphyritic texture and was fine-grained. Subhedral to anhedral alkali feldspar, plagioclase, quartz, and microcline made up the phenocryst. Because sericite is the alteration result of feldspar and plagioclase, the alteration process is largely sericitization. Perthite grains were found in abundance in all the types studied. Quartz, feldspar, plagioclase, microcline, biotite, muscovite, tourmaline, and opaque minerals made up the groundmass.
4.1.2. Marble
NFA ranged from fine-grained to very fine-grained. Calcite had a sub-idioblastic to xenoblastic shape and was undeformed. The grain boundaries were predominantly granoblastic interlobate, although the triple junction also had a granoblastic polygonal shape. Quartz and opaque minerals were also present in trace concentrations.
NFB is fine-grained homoblastic marble. Calcite is the primary component of these variations with idioblastic to subidioblastic shapes, according to the modal composition. With a triple junction, calcite grains have flawless orthorhombic twining and polygonal boundaries. There was no intra-granular fracture, and the contact between the calcite grains was longitudinal. A small quantity of quartz and opaque minerals were also investigated.
4.1.3. Sandstone
MFA included calcite cement and was exceedingly fine-grained (carbonate cement). Quartz was primarily monocrystalline and included monazite and apatite inclusions among the framework grains. Partially sericitized orthoclase feldspar. The rock fragments were sedimentary in nature (chert and shale). Calcite veins were found among iron oxides (magnetite and hematite). Muscovite, chlorite, and rutile were among the accessory minerals.
Carbonaceous cement and ferruginous matrix were found in MFB, which was medium- to fine-grained. Apatite, monazite, and zircon were found as inclusions in quartz (which was largely monocrystalline). Polysynthetic twinning was seen in plagioclase. Shale, sandstone, chert, quartzite, clay-rich mudstone, schistose quartz, and some igneous fragments were among the rock fragments found. Muscovite and chlorite are two more trace minerals.
Compared to the other two varieties, MFC was medium-grained and had a higher amount of rock fragments (chert, shale, clay-rich mudstone, and volcanic rocks). The size of the clay matrix (ferruginous) was restricted. The calcitic cementing material filled the pore spaces. The second most common framework grain was quartz (rarely polycrystalline). The bigger monocrystalline grains were shattered, and calcite cement was used to fill them. Orthoclase feldspar saw a lot of changes. Small calcite veins and iron leaching were also found.
4.2. Physical and Strength Properties
The weathering grades and average findings of the physical and strength attributes of the studied rocks are shown in Table 4. The specific gravity of the samples varied from 2.65 (sample MG) to 2.76 (sample MFC), while porosity and water absorption were 0.23 to 2.45% and 0.09 and 0.91%, respectively. Similarly, the strength values of the investigated samples fall into three groups, according to the international association of engineering geologists: moderately strong (15–50 MPa, samples NFA, NFB, and UGB); strong (50–120 MPa, sample MFC); and very strong (>120 MPa, samples MG, UGB, MFA, and MFB) [66]. The findings reveal that samples with relatively high strength and weathering grade have low porosity and water absorption values, and vice versa, for each rock type. The previous study on granite [67], marble [68], and sandstone [67] showed similar results.
Table 4.
Weathering grades and calculated average values of strength and physical properties of the studied rocks.
5. Discussion
5.1. Factors Affecting NDTs
5.1.1. Weathering Grade
The relationship between NDTs in dry states (UPVdry and Rdry-value) and weathering grades is shown in Figure 4. Both NDTs dropped as weathering grades increased for all the rocks studied. Weathering weakens rock-forming minerals and stiffens grain boundaries, as well as causing dissolution and leaching of mineral phases, resulting in high porosity. The propagation of UPVdry is slowed when there are more pores and micro-fissures [67]. Similarly, increasing porosity affects the rock’s hardness and strength, resulting in lower R-dry values [69]. Granite, basalt, and quartzite all have equivalent UPV and R-values, according to Gupta and Rao [70] and Gupta et al. [5].
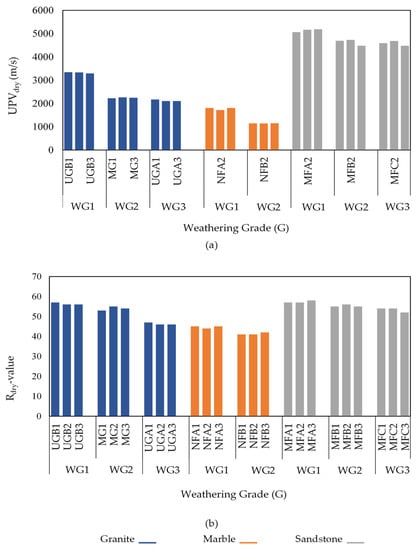
Figure 4.
Variation of weathering grade (a) with UPVdry (b) with Rdry-value.
5.1.2. Moisture Content and Porosity
The influence of moisture content on NDTs is seen in Figure 5. The average values of the NDTs are shown in Figure 5a,b at different moisture levels (i.e., 0, 25, 50, 75, and 100%), ranging from dry to saturated specimens. As the moisture content varies, the data demonstrate a steady shift in NDTs [71]. In general, UPV propagation increased when moisture content rose in all the rocks investigated; however, this shift was less pronounced in sandstone (MFA, MFB, and MFC in Figure 5a).
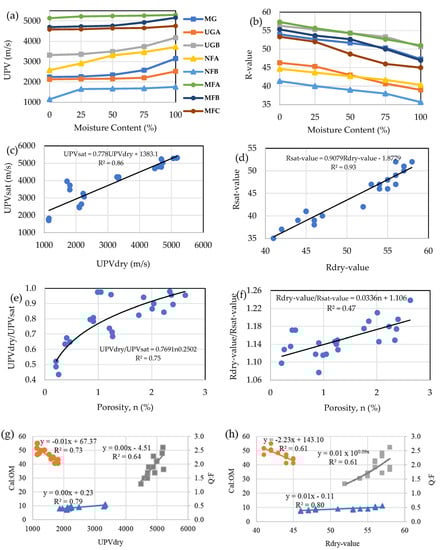
Figure 5.
Variation of UPVdry and Rdry (a,b) with moisture content (c) UPVsat vs. UPVdry (d) Rsat-value vs. Rdry-value (e) UPVdry/UPVsat vs. Porosity (f) Rdry-value/Rsat-value vs. Porosity. (g) Cal:OM vs. UPVdry (h) Cal:OM vs. Rdry-value.
The R-values (Figure 5b) show a consistent negative trend with moisture content, with a decrease of 10 to 15% from dry to completely saturated. Grain softening and skeletal connections decrease when water content rises, resulting in inter-grain sliding and a decline in R-value [14,69,72]. Figure 5c,d show the NDT values in dry and saturated conditions, demonstrating that the UPV sat and R-sat-values can be estimated with excellent accuracy from the values obtained in a dry specimen (R2 = 0.86 and 0.93, respectively). The dry to saturated ratio of NDTs vs. porosity is shown in Figure 5e,f to highlight how porosity affects NDTs. The UPV rises with porosity, and above 1%, the UPVdry varies from 0.70 to 0.98% of the UPV sat, with only the marble sample having lower values. This is in contrast to the results of Vasconcelos et al. [67], who reported similar ranges for low-porosity granite samples (0.6%). The difference in R-value between the two moisture conditions (Figure 5f) demonstrates a considerable scatter with no relation to porosity. Figure 5g,h plots the relationship between mineralogy (quartz to feldspar ratio, Q:F for granite and sandstone; and calcite to opaque mineral ratio, Cal:OM for marble) and NDTs (UPVdry and Rdry). With the increase in the quartz-to-feldspar ratio in granite and sandstone, NDTs increased. Compared to sandstone, the NDTs of granite are more sensitive to changes in quartz content. Sousa [73] and Yusof and Zabidi [74] have reported similar relationships for the quartz-rich rocks. Likewise, with an increase in the calcite to opaque mineral ratio in marble, both NDTs decreased. These results suggest that ultrasonic pulse velocity and rebound values are higher in physically strong minerals such as quartz and opaque minerals.
5.1.3. Correlation between NDTS and Physical Properties
Figure 6 and Figure 7 and Table 5 show the results of NDTs (dry) based on experimental data derived from the physical properties of the analyzed rock type studied by simple regression. Physical factors such as specific gravity, porosity, water absorption, and dry density were evaluated. The statistical connections between UPV and R-value in dry specimens with physical parameters are shown in Table 5. Figure 6a illustrates the UPVdry and specific gravity of granite and sandstone with logarithmic connections that are quite substantial (R2 = 0.67 and 0.71, respectively). Marble, on the other hand, showed no correlation since the specific gravity remained constant while the UPVdry fluctuated. Figure 6b shows that power relations exist for granite and marble (R² = 0.75 and 0.96, respectively), whereas a polynomial exists for sandstone (R² = 0.95). UPVdry has a significant power connection for granite, an exponential relationship for marble, and a logarithmic relationship for sandstone when it comes to water absorption (Figure 6c) (0.76, 0.95, and 0.94, respectively). Finally, logarithmic connections exist between dry density and UPVdry (Figure 6d) for granite and marble (R² = 0.98 and 0.51, respectively), but not for sandstone.
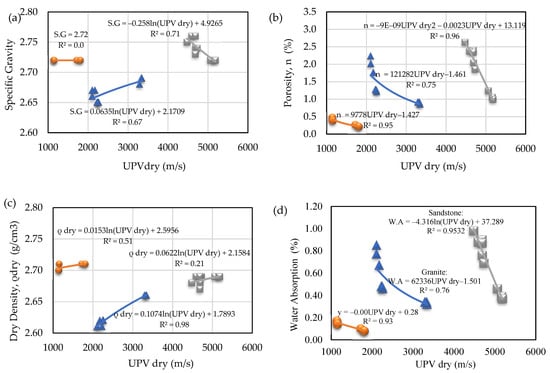
Figure 6.
Correlation of UPVdry against (a) specific gravity, (b) porosity, (c), dry density and (d) water absorption for granite, marble, and sandstone. Granite –– Marble –– Sandstone ––.
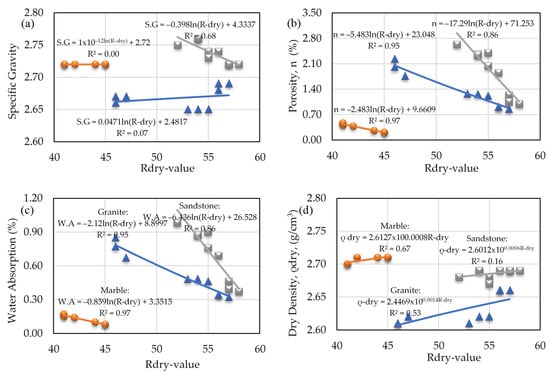
Figure 7.
Correlation of Rdry-value against (a) Specific gravity, (b) Porosity, (c) Water absorption and (d) dry density for granite, marble and sandstone.
Table 5.
Statistical relations of NDTs-dry with physical properties.
Except for dry density, which exhibits an exponential best fit curve, the scatter plots of Rdry-value vs. physical characteristics in Figure 7 show logarithmic correlations. Since specific gravity remained constant with Rdry-value, there was no link between Rdry-value and specific gravity (Figure 7a). The R² value is strong in all other associations except for granite (R² = 0.07) in the Rdry-value vs. specific gravity plot and sandstone (R² = 0.16) in the Rdry-value vs. dry density chart.
Similar correlations have been suggested for calculating various physical characteristics in a range of rock types using the UPV [27,28,75] and R-values in previous research. The computed physical parameters were obtained using the equations given in each of the correlative charts (Table 6 and Table 7). The zero-intercept slope lines in Figure 8 and Figure 9 demonstrate the magnitude of inaccuracy in estimated and observed physical parameters. The data points that are far from the zero-intercept slope line indicate an error, while those that are above it indicate correctness. Because the computed t-values are bigger than the crucial t-values, the student’s t-test at the 95% confidence level is significant for all associations between the UPV-dry and R-dry versus physical characteristics, as shown in Table 6.
Table 6.
Measured and calculated values of physical properties.
Table 7.
Results of the t-test for the correlation of UPV (dry) and R-(dry) against the physical properties of the studied rocks.
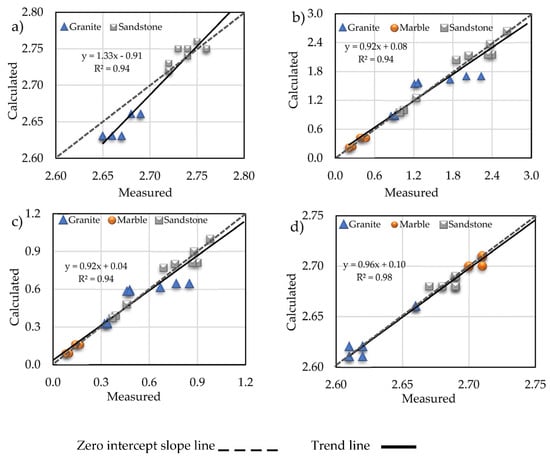
Figure 8.
Measured and calculated values of physical properties of the studied rocks obtained from UPVdry (a) specific gravity, (b) porosity, (c) water absorption, and (d) dry density.
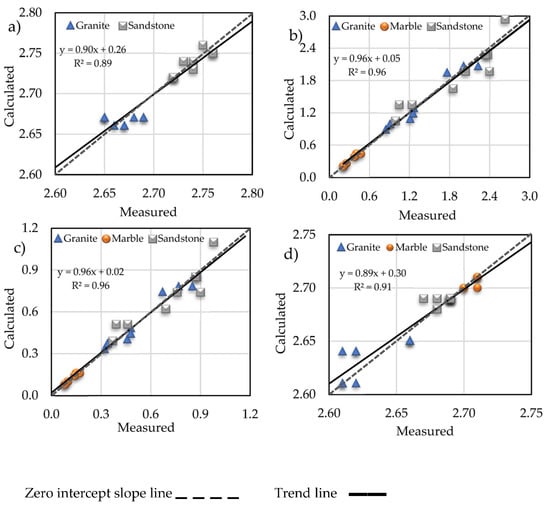
Figure 9.
Measured and calculated values of physical properties of the studied rocks obtained from Rdr-value (a) specific gravity, (b) porosity, (c) water absorption, and (d) dry density.
5.1.4. Correlation between NDTS and Strength Properties
For different rocks, many studies have provided various curve fits for calculating UCS using UPV and R-values [67,76,77]. This research also looks at UTS’s ties to NDTs, in addition to UCS. Using a simple regression analysis, the findings of the dry-state NDTs (UPVdry and Rdry-value) were linked against UCS and UTS in Figure 10. The correlation coefficient (R²) and statistical connections of NDT with strength attributes are also shown (Table 8).
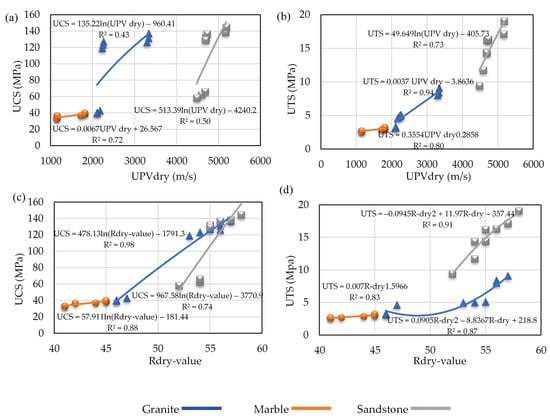
Figure 10.
Correlation of NDT against UCS and UTS for granite, marble, and sandstone (a) USC vs. UPVdry (b) UTS vs. UPVdry (c) UCS vs. Rdry-value. (d) UTS vs. Rdry-value.
Table 8.
Statistical relations of dry-state NDTs with strength properties.
Figure 10a shows a linear best-fit curve (R2 = 0.72) for marble and weak logarithmic connections (R2 = 0.43 and 0.50, respectively) for granite and sandstone. Similarly, for granite (R2 = 0.80), marble (R2 = 0.94), and sandstone (R2 = 0.73), the plot of UPVdry vs. UTS (Figure 10b) indicates significant positive, linear, power, and logarithmic connections. Plotting R-dry-values against corresponding UCS (Figure 10c) reveals logarithmic curves for granite, marble, and sandstone (R2 = 0.98, 0.88, and 0.74, respectively), and plotting R-dry-values against UTS (Figure 10d) shows a polynomial for granite and sandstone (R2 = 0.87 and 0.91, respectively) and a power relation for marble (R2 = 0.83).
Using NDT’s equations, the computed values of UCS and UTS are displayed against the observed values in Figure 11 (Table 9).
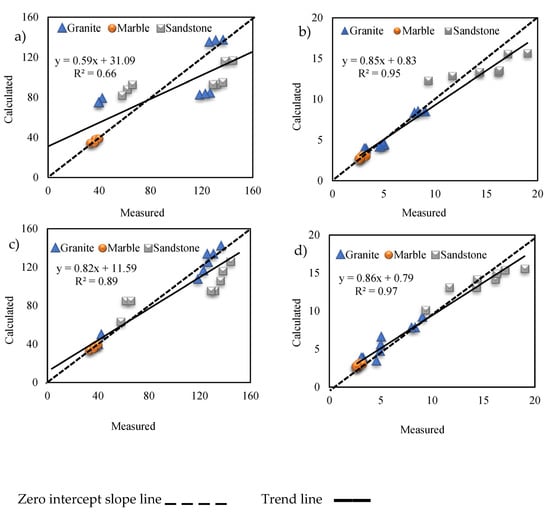
Figure 11.
Measured and calculated values of strength properties of the studied rocks obtained from UPV dry (a) UCS MPa from UPVdry (b) UTS MPA from UPVdry (c) UCS MPa from R-value (d) UTS MPA from R-value.
Table 9.
Measured and calculated values of the strength properties of the studied rocks.
The zero-intercept slope line was used to indicate the degree of inaccuracy in the estimated numbers. Correctness is represented by data points that sit on the zero-intercept slope line, while a departure from the line denotes an error. When comparing the measured and calculated strength values derived from the R-values to those obtained using UPV (R2 = 0.66 and 0.98), the plots reveal that the measured and calculated strength values derived from the R-values are near the zero-intercept line with high R2 (0.89 and 0.97) when compared to those obtained using UPV (R2 = 0.66 and 0.98). This shows that R-values are more accurate than other NDTs for assessing rock strength. Table 10 indicates that the t-critical is smaller than the t-calculated in all the relationships, showing that they are valid and useful correlations for practical applications.
Table 10.
Results of the t-test for the correlation of NDTs-dry against the strength properties of the studied rocks.
The estimation of the physical and strength properties of the investigated rocks was made on samples in a dry state. A similar approach can be followed to estimate these properties on samples at different saturation states. Likewise, the combined use of both NDTs, such as the SonReb method, was not investigated. Future studies combining the ultrasonic pulse velocity with Schmidt hammer and Lab hardness methods could improve the reliability of NDTs for UCS estimations [78].
6. Conclusions
The purpose of this research was to see whether efficient non-destructive testing (NDTs) such as ultrasonic pulse velocity and Schmidt hammer (R-value) testing can be used to determine the physical and strength properties of granite, marble, and sandstone from North Pakistan. The emphasis of the discussion was on (a) variables that influence NDTs, (b) correlation analysis between physical and strength characteristics, and (c) statistical correlations between NDTs and physical and strength attributes using basic regression analysis. The following findings have been derived from this research:
Weathering and moisture content affect the values of both NDTs. The porosity, density, and grain size of rock are all affected by weathering. The levels of both NDTs in the examined rocks decreased significantly as the weathering grade increased. The UPV has a direct connection with moisture content, but the R-value has an inverse relationship with moisture content.
Both NDTs were shown to be successful in estimating most of the physical parameters of the examined rocks, with a good correlation value (R2). Except for granite and marble porosity and water absorption, and marble dry density, the UPV was more accurate in assessing other physical properties. Furthermore, the marble’s specific gravity did not correlate with either NDT.
Schmidt hammer R-values for determining strength were more consistent, with R2 values of 0.98, 0.88, and 0.74 for the UCS of granite, marble, and sandstone, respectively, and 0.83 and 0.91 for the UTS of marble and sandstone, respectively. The Schmidt hammer R-values are around the zero-intercept line (with higher R2 = 0.89 and 0.97) when compared to those obtained for UPV (R2 = 0.66 and 0.95), showing that the Schmidt hammer method provided improved accuracy for estimating rock strength.
The correlation equations established from NDT reveal that the strength and physical properties of regularly used rocks may be predicted rather accurately. Although the performance of all empirical models produced in this research was significant as determined by the student’s t-test, any non-destructive test with a low R2 value should be used with caution when predicting the attributes. The resulting equations are accurate, simple, and straightforward to use and may be used in the field to provide early predictions of mechanical and physical properties, serving as a crucial reference for masonry structure strengthening and rehabilitation.
Author Contributions
Conceptualization, W.A.; methodology, W.A. and N.A.; software, W.A.; validation, W.A., N.A., I.I. and M.S.; formal analysis, N.A.; investigation, W.A., N.A., I.I., M.S. and G.K.; resources, W.A.; data curation, W.A. and N.A.; writing—original draft preparation, W.A.; writing—review and editing, W.A., I.I., M.S., H.T.J. and G.K.; visualization, W.A., I.I., H.T.J. and G.K.; supervision, W.A.; funding acquisition, G.K. All authors have read and agreed to the published version of the manuscript.
Funding
This research received no external funding.
Data Availability Statement
Not applicable.
Acknowledgments
The authors would like to acknowledge the National Centre of Excellence in Geology at the University of Peshawar (Pakistan) for providing laboratory facilities and field logistics.
Conflicts of Interest
The authors declare no conflict of interest.
References
- Li, D.; Armaghani, D.J.; Zhou, J.; Lai, S.H.; Hasanipanah, M. A GMDH predictive model to predict rock material strength using three non-destructive tests. J. Nondestruct. Eval. 2020, 39, 1–14. [Google Scholar] [CrossRef]
- Parsajoo, M.; Armaghani, D.J.; Mohammed, A.S.; Khari, M.; Jahandari, S. Tensile strength prediction of rock material using non-destructive tests: A comparative intelligent study. Transp. Geotech. 2021, 31, 100652. [Google Scholar] [CrossRef]
- Pereira, M.L.; da Silva, P.F.; Fernandes, I.; Chastre, C. Characterization and correlation of engineering properties of basalts. Bull. Eng. Geol. Environ. 2021, 80, 2889–2910. [Google Scholar] [CrossRef]
- Malek, J.; Kaouther, M. Destructive and non-destructive testing of concrete structures. Jordan J. Civ. Eng. 2014, 159, 1–10. [Google Scholar]
- Gupta, M.; Khan, M.A.; Butola, R.; Singari, R.M. Advances in applications of Non-Destructive Testing (NDT): A review. Adv. Mater. Process. Technol. 2021, 8, 2286–2307. [Google Scholar] [CrossRef]
- Özdemir, E. A New Predictive Model for Uniaxial Compressive Strength of Rock Using Machine Learning Method: Artificial Intelligence-Based Age-Layered Population Structure Genetic Programming (ALPS-GP). Arab. J. Sci. Eng. 2022, 47, 629–639. [Google Scholar] [CrossRef]
- Aldeeky, H.; Al Hattamleh, O. Prediction of engineering properties of basalt rock in Jordan using ultrasonic pulse velocity test. Geotech. Geol. Eng. 2018, 36, 3511–3525. [Google Scholar] [CrossRef]
- Barham, W.S.; Rabab’ah, S.R.; Aldeeky, H.H.; Al Hattamleh, O.H. Mechanical and physical based artificial neural network models for the prediction of the unconfined compressive strength of rock. Geotech. Geol. Eng. 2020, 38, 4779–4792. [Google Scholar] [CrossRef]
- Hayat, M.; Ur Rehman, A.; Ali, D.; Saleem, A.; Mustafa, N. Developing Empirical Models for Uniaxial Compressive Strength Prediction by Using Non-Destructive Test Results. J. Min. Sci. 2019, 55, 883–892. [Google Scholar] [CrossRef]
- Martín-del-Rio, J.J.; Canivell, J.; Falcon, R.M. The use of non-destructive testing to evaluate the compressive strength of a lime-stabilised rammed-earth wall: Rebound index and ultrasonic pulse velocity. Constr. Build. Mater. 2020, 242, 118060. [Google Scholar] [CrossRef]
- Arman, H.; Paramban, S. Dimensional Effects on Dynamic Properties and the Relationships between Ultrasonic Pulse Velocity and Physical Properties of Rock Under Various Environmental Conditions. Geotech. Geol. Eng. 2021, 39, 3947–3957. [Google Scholar] [CrossRef]
- Aydin, T.Y.; Kucukkose, A. Ultrasonic testing and evaluation of moisture-dependent elastic properties of fir wood. Mater. Test. 2020, 62, 1059–1064. [Google Scholar] [CrossRef]
- Fioretti, G.; Andriani, G.F. Ultrasonic wave velocity measurements for detecting decay in carbonate rocks. Q. J. Eng. Geol. Hydrogeol. 2018, 51, 179–186. [Google Scholar] [CrossRef]
- Kahraman, S. The correlations between the saturated and dry P-wave velocity of rocks. Ultrasonics 2007, 46, 341–348. [Google Scholar] [CrossRef]
- Janjuhah, H.T.; Alansari, A.; Vintaned, J.A.G. Quantification of microporosity and its effect on permeability and acoustic velocity in Miocene carbonates, Central Luconia, offshore Sarawak, Malaysia. J. Pet. Sci. Eng. 2019, 175, 108–119. [Google Scholar] [CrossRef]
- Yasir, M.; Ahmed, W.; Islam, I.; Sajid, M.; Janjuhah, H.T.; Kontakiotis, G. Composition, Texture, and Weathering Controls on the Physical and Strength Properties of Selected Intrusive Igneous Rocks from Northern Pakistan. Geosciences 2022, 12, 273. [Google Scholar] [CrossRef]
- Asteris, P.G.; Mamou, A.; Hajihassani, M.; Hasanipanah, M.; Koopialipoor, M.; Le, T.-T.; Kardani, N.; Armaghani, D. Soft computing based closed form equations correlating L and N-type Schmidt hammer rebound numbers of rocks. Transp. Geotech. 2021, 29, 100588. [Google Scholar] [CrossRef]
- Wang, M.; Wan, W. A new empirical formula for evaluating uniaxial compressive strength using the Schmidt hammer test. Int. J. Rock Mech. Min. Sci. 2019, 123, 104094. [Google Scholar] [CrossRef]
- Fereidooni, D.; Khajevand, R. Determining the geotechnical characteristics of some sedimentary rocks from Iran with an emphasis on the correlations between physical, index, and mechanical properties. Geotech. Test. J. 2018, 41, 555–573. [Google Scholar] [CrossRef]
- Jamshidi, A.; Nikudel, M.R.; Khamehchiyan, M.; Sahamieh, R.Z.; Abdi, Y. A correlation between P-wave velocity and Schmidt hardness with mechanical properties of travertine building stones. Arab. J. Geosci. 2016, 9, 568. [Google Scholar] [CrossRef]
- Jobli, A.F.; Hampden, A.Z.; Tawie, R. The role of ultrasonic velocity and Schmidt hammer hardness-The simple and economical non-destructive test for the evaluation of mechanical properties of weathered granite. AIP Conf. Proc. 2017, 1875, 030005. [Google Scholar]
- Vasanelli, E.; Colangiuli, D.; Calia, A.; Sileo, M.; Aiello, M.A. Ultrasonic pulse velocity for the evaluation of physical and mechanical properties of a highly porous building limestone. Ultrasonics 2015, 60, 33–40. [Google Scholar] [CrossRef] [PubMed]
- Borrelli, L.; Greco, R.; Gullà, G. Weathering grade of rock masses as a predisposing factor to slope instabilities: Reconnaissance and control procedures. Geomorphology 2007, 87, 158–175. [Google Scholar] [CrossRef]
- Pan, X.-P.; Zhang, G.-Z.; Chen, J.-J. The construction of shale rock physics model and brittleness prediction for high-porosity shale gas-bearing reservoir. Pet. Sci. 2020, 17, 658–670. [Google Scholar] [CrossRef]
- Islam, I.; Ahmed, W.; Rashid, M.U.; Orakzai, A.U.; Ditta, A. Geophysical and geotechnical characterization of shallow subsurface soil: A case study of University of Peshawar and surrounding areas. Arab. J. Geosci. 2020, 13, 949. [Google Scholar] [CrossRef]
- Karaman, K.; Kesimal, A. Evaluation of the influence of porosity on the engineering properties of volcanic rocks from the Eastern Black Sea Region: NE Turkey. Arab. J. Geosci. 2015, 8, 557–564. [Google Scholar] [CrossRef]
- Aşcı, M.; Kaplanvural, İ.; Karakaş, A.; Şahin, Ö.; Kurtuluş, C. Correlation of physical and mechanical properties with ultrasonic pulse velocities of sandstones in Çenedağ, Kocaeli-Turkey. Int. J. Adv. Geosci. 2017, 5, 109–115. [Google Scholar] [CrossRef][Green Version]
- Khandelwal, M. Correlating P-wave Velocity with the Physico-Mechanical Properties of Different Rocks. Pure Appl. Geophys. 2012, 170, 507–514. [Google Scholar] [CrossRef]
- Moradian, Z.; Behnia, M. Predicting the uniaxial compressive strength and static Young’s modulus of intact sedimentary rocks using the ultrasonic test. Int. J. Geomech. 2009, 9, 14–19. [Google Scholar] [CrossRef]
- Mishra, D.; Basu, A. Estimation of uniaxial compressive strength of rock materials by index tests using regression analysis and fuzzy inference system. Eng. Geol. 2013, 160, 54–68. [Google Scholar] [CrossRef]
- Kılıç, A.; Teymen, A. Determination of mechanical properties of rocks using simple methods. Bull. Eng. Geol. Environ. 2008, 67, 237–244. [Google Scholar] [CrossRef]
- Strzałkowski, P.; Köken, E. Assessment of Böhme Abrasion Value of Natural Stones through Artificial Neural Networks (ANN). Materials 2022, 15, 2533. [Google Scholar] [CrossRef] [PubMed]
- Adam Mohammed, A.A.; Fener, M.; Comakli, R.; İnce, İ.; Balci, M.C.; Kayabalı, K. Investigation of the relationships between basic physical and mechanical properties and abrasion wear resistance of several natural building stones used in Turkey. J. Build. Eng. 2021, 42, 103084. [Google Scholar] [CrossRef]
- Asif, A.R.; Islam, I.; Ahmed, W.; Sajid, M.; Qadir, A.; Ditta, A. Exploring the potential of Eocene carbonates through petrographic, geochemical, and geotechnical analyses for their utilization as aggregates for engineering structures. Arab. J. Geosci. 2022, 15, 1–19. [Google Scholar] [CrossRef]
- Islam, F.; Ahmad, M.N.; Janjuhah, H.T.; Ullah, M.; Islam, I.U.; Kontakiotis, G.; Skilodimou, H.D.; Bathrellos, G.D. Modelling and Mapping of Soil Erosion Susceptibility of Murree, Sub-Himalayas Using GIS and RS-Based Models. Appl. Sci. 2022, 12, 12211. [Google Scholar] [CrossRef]
- Chaudhry, M.; Ashraf, M.; Hussain, S.; Iqbal, M. Geology and petrology of Malakand and a part of Dir (Toposheet 38 N/14). Geol. Bull. Univ. Punjab 1976, 12, 17–40. [Google Scholar]
- Chaudhry, M.; Jafferi, S.; Saleemi, B. Geology and petrology of the Malakand granite and its environs. Geol. Bull. Univ. Punjab 1974, 10, 43–58. [Google Scholar]
- Hamidullah, S.; Jabeen, N.; Bilqees, R.; Jamil, K. Geology and petrology of the Malakand granite, gneiss and metasedimentary complex. Geol. Bull. Univ. Peshawar 1986, 19, 61–76. [Google Scholar]
- Khattak, N.; Akram, M.; Khan, M.; Khan, H. Emplacement time of the Loe–Shilman carbonatite from NW Pakistan: Constraints from fission-track dating. Radiat. Meas. 2008, 43, S313–S318. [Google Scholar] [CrossRef]
- Le Bas, M.; Mian, I.; Rex, D. Age and nature of carbonatite emplacement in North Pakistan. Geol. Rundsch. 1987, 76, 317–323. [Google Scholar] [CrossRef]
- Khan, M.; Hammad, M. Petrology of Utla Granite, Gadoon Area; University of Peshawar: Pakhtunkhwa, Pakistan, 1978. [Google Scholar]
- Rafiq, M.; Jan, M.Q. Petrography of Ambela granitic complex, NW Pakistan. Geol. Bull. Univ. Peshawar 1988, 21, 27–48. [Google Scholar]
- DiPietro, J.A.; Pogue, K.R. Geologic map of the Indus syntaxis and surrounding area. Himalaya Tibet. Mt. Roots Mt. Tops 1999, 328, 159. [Google Scholar]
- Hussain, A.; Dipietro, J.; Pogue, K.; Ahmad, I. Geological Map of the 43B Degree Sheet, NWFP, Pakistan. Degree Sheet Map Series, Geological Map 2004. Available online: https://www.researchgate.net/publication/291046437 (accessed on 21 December 2021).
- Sajid, M.; Arif, M. Field features and petrography of igneous rocks from Utla (Gadoon), NW Pakistan: Preliminary investigation. J. Himal. Earth Sci. 2010, 43, 75–76. [Google Scholar]
- Sajid, M.; Arif, M.; Shah, M.T. Petrogenesis of granites from the Utla area of Gadoon, north-west Pakistan: Implications from petrography and geochemistry. J. Earth Sci. 2014, 25, 445–459. [Google Scholar] [CrossRef]
- Sajid, M.; Andersen, J.; Rocholl, A.; Wiedenbeck, M. U-Pb geochronology and petrogenesis of peraluminous granitoids from northern Indian plate in NW Pakistan: Andean type orogenic signatures from the early Paleozoic along the northern Gondwana. Lithos 2018, 318–319, 340–356. [Google Scholar] [CrossRef]
- Stauffer, K.W. Silurian-devonian reef complex near Nowshera, west Pakistan. Geol. Soc. Am. Bull. 1968, 79, 1331–1350. [Google Scholar] [CrossRef]
- Pogue, K.; Hussain, A. New light on stratigraphy of Nowshera area and the discovery of early to middle Ordovician trace fossils in NWFP Pakistan. Geol. Surv. Pak. Inf. Release 1986, 135, 15. [Google Scholar]
- Teichert, C.; Stauffer, K.W. Paleozoic Reef Discovery in Pakistan. Geol. Survry Pak. Rec. 1965, 3, 2–19. [Google Scholar]
- Bilal, A.; Yang, R.; Mughal, M.S.; Janjuhah, H.T.; Zaheer, M.; Kontakiotis, G. Sedimentology and Diagenesis of the Early–Middle Eocene Carbonate Deposits of the Ceno-Tethys Ocean. J. Mar. Sci. Eng. 2022, 10, 1794. [Google Scholar] [CrossRef]
- Talent, J.A.; Mawson, R. Paleozoic-Mesozoic biostratigraphy of Pakistan in relation to biogeography and the coalescence of Asia. Geodyn. Pak. 1979, 104, 81–102. [Google Scholar]
- Shah, S. Stratigraphy of Pakistan, Geological Survey of Pakistan Memoirs 12. Islamabad Pak. Geol. Surv. Pak Memoir. 1977, 12, 138. [Google Scholar]
- Rahim, H.-U.; Qamar, S.; Shah, M.M.; Corbella, M.; Martín-Martín, J.D.; Janjuhah, H.T.; Navarro-Ciurana, D.; Lianou, V.; Kontakiotis, G. Processes Associated with Multiphase Dolomitization and Other Related Diagenetic Events in the Jurassic Samana Suk Formation, Himalayan Foreland Basin, NW Pakistan. Minerals 2022, 12, 1320. [Google Scholar] [CrossRef]
- Zaheer, M.; Khan, M.R.; Mughal, M.S.; Janjuhah, H.T.; Makri, P.; Kontakiotis, G. Petrography and Lithofacies of the Siwalik Group in the Core of Hazara-Kashmir Syntaxis: Implications for Middle Stage Himalayan Orogeny and Paleoclimatic Conditions. Minerals 2022, 12, 1055. [Google Scholar] [CrossRef]
- Tahirkheli, R.A.K. Major tectonic scars of Peshawar Vale and adjoining areas, and associated magmatism. Geol. Bull. Uni. Peshawar 1980, 39–46. [Google Scholar]
- Meissner, C.R., Jr.; Master, J.; Rashid, M.; Hussain, M. Stratigraphy of the Kohat Quadrangle, Pakistan; U.S. Government Publishing Office: Washington, DC, USA, 1974; pp. 2330–7102.
- Hussain, A. Stratography and structural events around the southern margin of Peshawar Basin, Pakistan. J. Himal. Earth Sci. 1989, 22, 58–79. [Google Scholar]
- Feniak, M.W. Grain sizes and shapes of various minerals in igneous rocks. J. Earth Planet. Mater. 1944, 29, 415–421. [Google Scholar]
- Bozkurt, N.; Yazicioglu, S. Strength and capillary water absorption of lightweight concrete under different curing conditions. Indian J. Eng. Mater. Sci. 2010, 17, 145–151. [Google Scholar]
- Chen, X.; Huang, W.; Zhou, J. Effect of moisture content on compressive and split tensile strength of concrete. Indian J. Eng. Mater. Sci. 2012, 19, 427–435. [Google Scholar]
- Aydin, A. Upgraded ISRM suggested method for determining sound velocity by ultrasonic pulse transmission technique. In The ISRM Suggested Methods for Rock Characterization, Testing and Monitoring: 2007–2014; Springer: Cham, Switzerland, 2013; pp. 95–99. [Google Scholar]
- Franklin, J.A. Suggest methods for determining water content, porosity, density, absorption and related properties and swelling and slake-durability index properties. Int. J. Rock Mech. Min. Sci. Geomech. 1979, 16, 141–156. [Google Scholar]
- Sheskin, D.J. Handbook of Parametric and Nonparametric Statistical Procedures, 3rd ed.; Chapman and Hall: New York, NY, USA; CRC: New York, NY, USA, 2003. [Google Scholar] [CrossRef]
- Khandelwal, M.; Singh, T. Correlating static properties of coal measures rocks with P-wave velocity. Int. J. Coal Geol. 2009, 79, 55–60. [Google Scholar] [CrossRef]
- Anon, O. Classification of rocks and soils for engineering geological mapping. Part 1: Rock and soil materials. Bull. Int. Assoc. Eng. Geol. 1979, 19, 355–371. [Google Scholar]
- Vasconcelos, G.; Lourenço, P.B.; Alves, C.; Pamplona, J. Ultrasonic evaluation of the physical and mechanical properties of granites. Ultrasonics 2008, 48, 453–466. [Google Scholar] [CrossRef]
- Yavuz, H.; Demirdag, S.; Caran, S. Thermal effect on the physical properties of carbonate rocks. Int. J. Rock Mech. Min. Sci. 2010, 47, 94–103. [Google Scholar] [CrossRef]
- Aydin, A. ISRM suggested method for determination of the Schmidt hammer rebound hardness: Revised version. In The ISRM Suggested Methods for Rock Characterization, Testing and Monitoring: 2007–2014; Springer: Cham, Switzerland, 2008; pp. 25–33. [Google Scholar]
- Gupta, A.; Rao, K.S. Index properties of weathered rocks: Inter-relationships and applicability. Bull. Eng. Geol. Environ. 1998, 57, 161–172. [Google Scholar] [CrossRef]
- Majeed, Y.; Bakar, M.A. Water saturation influences on engineering properties of selected sedimentary rocks of Pakistan. J. Min. Sci. 2018, 54, 914–930. [Google Scholar] [CrossRef]
- Wang, Z.; Batzle, M.; Nur, A. Effect of different pore fluids on seismic velocities in rocks. Can. J. Explor. Geophys. 1990, 26, 104–112. [Google Scholar]
- Sousa, L.M.O. The influence of the characteristics of quartz and mineral deterioration on the strength of granitic dimensional stones. Environ. Earth Sci. 2013, 69, 1333–1346. [Google Scholar] [CrossRef]
- Yusof, N.Q.A.M.; Zabidi, H. Correlation of Mineralogical and Textural Characteristics with Engineering Properties of Granitic Rock from Hulu Langat, Selangor. Procedia Chem. 2016, 19, 975–980. [Google Scholar] [CrossRef]
- Pappalardo, G. Correlation between P-wave velocity and physical–mechanical properties of intensely jointed dolostones, Peloritani mounts, NE Sicily. Rock Mech. Rock Eng. 2015, 48, 1711–1721. [Google Scholar] [CrossRef]
- Concu, G.; De Nicolo, B.; Valdes, M. Prediction of building limestone physical and mechanical properties by means of ultrasonic P-wave velocity. Sci. World J. 2014, 2014, 508073. [Google Scholar] [CrossRef]
- Yasar, E.; Erdogan, Y. Correlating sound velocity with the density, compressive strength and Young’s modulus of carbonate rocks. Int. J. Rock Mech. Min. Sci. 2004, 41, 871–875. [Google Scholar] [CrossRef]
- Gomez-Heras, M.; Benavente, D.; Pla, C.; Martinez-Martinez, J.; Fort, R.; Brotons, V. Ultrasonic pulse velocity as a way of improving uniaxial compressive strength estimations from Leeb hardness measurements. Constr. Build. Mater. 2020, 261, 119996. [Google Scholar] [CrossRef]
Disclaimer/Publisher’s Note: The statements, opinions and data contained in all publications are solely those of the individual author(s) and contributor(s) and not of MDPI and/or the editor(s). MDPI and/or the editor(s) disclaim responsibility for any injury to people or property resulting from any ideas, methods, instructions or products referred to in the content. |
© 2023 by the authors. Licensee MDPI, Basel, Switzerland. This article is an open access article distributed under the terms and conditions of the Creative Commons Attribution (CC BY) license (https://creativecommons.org/licenses/by/4.0/).