Abstract
A number of evolutionary algorithms such as genetic algorithms, simulated annealing, particle swarm optimization, etc., have been used by researchers in order to optimize different manufacturing processes. In many cases these algorithms are either incapable of reaching global minimum or the time and computational effort (function evaluations) required makes the application of these algorithms impractical. However, if the Nelder Mead optimization method is applied to approximate solutions cheaply obtained from these algorithms, the solution can be further refined to obtain near global minimum of a given error function within only a few additional function evaluations. The initial solutions (vertices) required for the application of Nelder-Mead optimization can be obtained through multiple evolutionary algorithms. The results obtained using this hybrid method are better than that obtained from individual algorithms and also show a significant reduction in the computation effort.
1. Introduction
In recent years, optimization of various manufacturing processes using machine learning and evolutionary algorithms are becoming a key requirement for various industries. This is because these algorithms can save a significant amount of time, effort and material wastage within the industry by eliminating unnecessary testing. A number of researchers have developed computational models that can be used to predict and optimize the outputs of commonly used manufacturing processes. In most of the research, prediction models were developed for the process under consideration based on experimental data using techniques such as regression analysis, artificial neural networks, etc. After developing the prediction models, evolutionary algorithms can be effectively used in order to optimize the input parameters of that particular process. Welding processes are no exception to the application of such algorithms in order to predict and optimize the geometrical, microstructural and mechanical properties of the weldment even before welding commences on components.
Xiong, et al. [1] applied an artificial neural network (ANN) and a second-order regression analysis for predicting the weld bead geometry using the robotic gas metal arc welding process. They found that the ANN performed better than the second-order regression model since it has greater capacity for approximating non-linear processes. Similar results were obtained by Lakshminarayan and Balasubramanian [2], when they compared response surface methodology (RSM) with ANNs to predict the tensile strength of friction-stir welded aluminium joints. Many other researchers including [3,4,5,6] have also demonstrated an improvement in the accuracy of predicting the weld properties using ANNs. This demonstrates that ANNs are extremely efficient in predicting the geometrical as well as mechanical features of a weldment. Microstructural features have also been predicted with improved accuracy using ANNs. Vitek, et al. [7] used an ANN to predict the ferrite number of austenitic stainless steel welds by considering the chemical composition and the cooling rate of the weld pool. This model had outperformed all the other internationally accepted methods for predicting the ferrite number at that time.
Evolutionary algorithms have been effectively used by many researchers to optimize the input parameters of various manufacturing processes. These evolutionary algorithms include genetic algorithms (GA), simulated annealing (SA), particle swarm optimization (PSO), firefly optimization (FO), ant colony optimization (ACO), etc. All these algorithms search for a solution within a given solution space by moving towards a better solution in every iteration in most of the cases.
Hu, et al. [8] applied the PSO algorithm to various engineering problems. They slightly modified the original algorithm such that only feasible solutions are retained in the memory of the algorithm in order to constrain the solution space. They concluded that PSO is an efficient and general approach to solve most nonlinear optimization problems with inequality constraints. Katherasan, et al. [9] also developed optimization models for a flux core arc welding process using PSO and ANNs in order to maximize the depth of penetration, minimize the bead width and reinforcement, which gave good results.
SA was used by Roshan, et al. [10] to optimize a friction stir welding process in order to achieve desired mechanical properties of AA7075 welds. They found that the SA algorithm is capable of optimizing the welding process parameters to obtain the desired properties. A SA algorithm was also used by Tarng, et al. [11] to optimize the process parameters to obtain the desired bead geometry. They further classified the welds based on bead geometry quality using a fuzzy clustering technique. Similarly, other researchers [12,13] have also used SA to optimize the welding process and found it to be very effective in predicting process parameters for the weld bead geometry.
Similarly to SA and PSO, GA has also been extensively used for optimization of parameters. Sathiya, et al. [14] applied various optimization algorithms (GA, SA and PSO) in order to optimize friction-stir welding process parameters to obtain desired tensile strength and minimize metal loss. They found that among the algorithms they used, GA outperformed all the other algorithms and the results obtained from GA had a good agreement with the experimental data. Correia, et al. [15] compared GA and RSM in order to optimize the welding process based on four quality responses (deposition efficiency, bead width, depth of penetration and reinforcement). They also found that GA can perform better than RSM; however optimization using GA requires a good setting of its internal parameters. GA was also used by Pashazadeh, et al., [16] in order to optimize the electrode tip dressing operation for a resistance spot welding process, and found that it can be effectively used for optimizing the parameters.
All the algorithms mentioned above are capable of optimizing the welding process, but the methodology used by these algorithms, the computation effort (function evaluations) and time required to obtain a feasible solution vary significantly. Although these algorithms can reach the global minimum of an error function, the amount of computation effort and time required by them can be significant. This paper demonstrates a reduction in this effort and time by initially finding approximate solutions using any of the above mentioned algorithms and then applying the Nelder-Mead optimization (NMO) method to further refine them. NMO is an optimization method that is most effective when it is unconstrained, and hence cannot be applied directly to the optimization problem in many of the cases as it can lead to an infeasible solution.
2. Methodology
2.1. Experiments
The experimental data required for developing the prediction and optimization models for the weld bead geometry was obtained by welding 304L stainless steel sheets of thickness 1.5 mm. A tungsten inert gas (TIG) welding process was used for joining the sheets together. The experimental data included six variable input parameters and three output parameters. Welding was done heterogeneously using a 308LSi filler wire having a diameter of either 0.8 mm or 1 mm. A pulsed welding waveform was used for all the experiments in which the background current was fixed at 30% of the peak current. The duty cycle and the arc length were also kept constant at 50% and 2.5 mm respectively. No root gap was allowed between the plates. Various concentrations of nitrogen gas were added to pure argon and used as a shielding gas, making the composition of the gas one of the input variables to the process. Irrespective of the composition of shielding gas, the gas flow rate was maintained at 8 L/min. High purity argon (99.995%) was used as backing gas with a flow rate of 5 L/min. The input variables included peak welding current (PC), torch travel speed (TS), pulsing frequency (PF), filler wire feed rate (WFR), filler wire diameter (WD) and the concentration of nitrogen (N) in the shielding gas. The outputs were the geometrical features that included crown height (CH), crown width (CW) and the weld penetration (WP). The chemical composition of both the sheet and wire materials is detailed in Table 1.

Table 1.
Chemical composition of the stainless steel materials used for experiments.
A central composite design (CCD) of experiments scheme was used to obtain the data. Out of the six variables mentioned above, only PC, TS, PF and WFR are continuous parameters. Due to the limitations on the material and equipment available, WD and N were treated as discrete parameters in the experiment design. The minimum and maximum values of the parameters used are mentioned in Table 2. This parameter range demanded that the entire experiment be divided into two sets since the combination at extreme values of some of these parameters would have resulted in either incomplete penetration or burn-through of the weld. For example, it was found from initial experiments that if a current of 60 A is used at a travel speed of 4 mm/s, the heat input is too low to obtain complete penetration through the joint. On the other hand, if a current of 120 A is used along with a travel speed of 1 mm/s, the heat input is too high causing burn-through of the joint. All the conventional design of experiments would have included the above mentioned combinations if the parameter ranges mentioned in Table 2 were used directly without splitting them into smaller sets. Weld joints that have incomplete penetration or those that are burnt-through produce no useful results for developing computational models. Consequently, the experiment was split into two sets as shown in Table 3, which are based on only the peak welding current and travel speed, since the other parameters do not have any direct influence on the heat input. With four continuous variables, a total of 31 experiments were designed using the standard CCD for a single combination of the discrete parameters (WD = 1 and N = 0). Only 12 experiments from this were repeated at other levels of N (2.5%, 5% and 10%) each in every set in order to reduce the total number of experiments. Some additional random experiments were performed using a WD of 0.8 mm. Another 20 random experiments were also performed, the data from which was reserved for testing the obtained computational models. Consequently, a total of 180 experiments were performed in order to generate the training and test data. Metallographic samples were cut and prepared from all the welds mentioned above. The bead geometry was measured using a Leica S65D stereo optical microscope. The measured output parameters are shown in Figure 1.

Table 2.
Parameter ranges used for experiments.

Table 3.
Split parameter set used for designing the experiment.
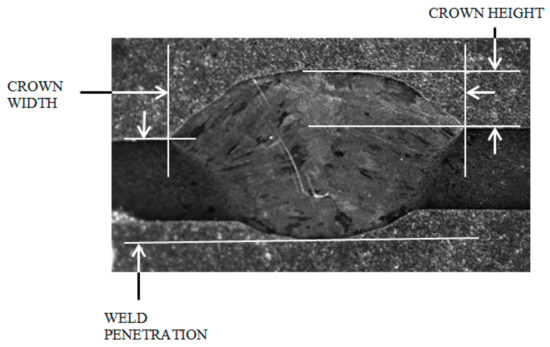
Figure 1.
Output parameters considered to quantify bead geometry.
2.2. Development of Prediction Models
Before developing the optimization algorithms, it is necessary to develop computational models that can predict the bead geometry for a given set of input parameters. An artificial neural network (ANN) was developed to compute the required bead geometry parameters, Crown Height, Crown Width and Weld Penetration (CH, CW and WP). This ANN contains six input neurons, six hidden nodes and three output nodes. All the data available for developing the prediction as well as optimization models was normalised between 0 and 1 and all the error values mentioned in the entire paper are based on the normalised data. There was one bias node in the input and hidden layer each. The details of this ANN development is discussed in [17]. However, it is important to note that the overall root mean square (RMS) error of the network for the training data is 0.0021 and for the test data is 0.0037. This level of error in predicting the bead geometry was considered to be acceptable. The ANN used for predicting bead geometry is shown in Figure 2.
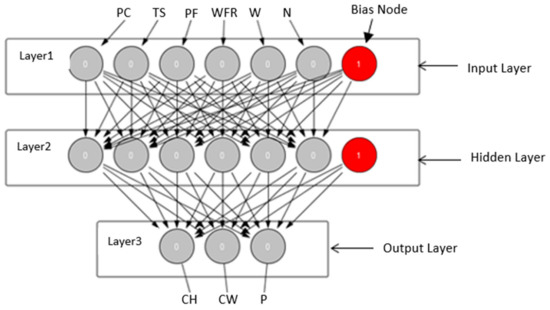
Figure 2.
Neural Network used for the prediction of bead geometry.
2.3. Development of Optimization Models
Optimization of weld bead geometry can be done using a number of algorithms that have been mentioned earlier. Some of the most commonly used algorithms include genetic algorithm (GA), simulated annealing (SA) and particle swarm optimization (PSO). These algorithms have the capability to find a solution within a solution space, but may require large number of function evaluations depending on the targeted maximum error in optimization. If the targeted maximum error is sufficiently high, the computation can be done within a few iterations, consequently requiring a small number of function evaluations and computation time. On the other hand, if the targeted maximum error is very small, an extremely large number of iterations may be required by all of these algorithms to obtain an acceptable solution. This large number of required iterations can make the application of that algorithm impractical. It is important to note that the optimization algorithms can only be used to find the parameters that can be used for obtaining the desired outputs, but not to predict the outputs from the inputs.
The computational effort required to obtain low levels of error can be significantly reduced by applying NMO method on the approximate solutions obtained from the above-mentioned algorithms. NMO is also commonly known as the simplex method. This research demonstrates the use of this simplex method to reduce the number of iterations and consequently the computation effort and time required to obtain low error levels. The steps followed for applying NMO alongside other algorithms to optimize the weld bead geometry are shown in Figure 3 and explained in detail in the following section.
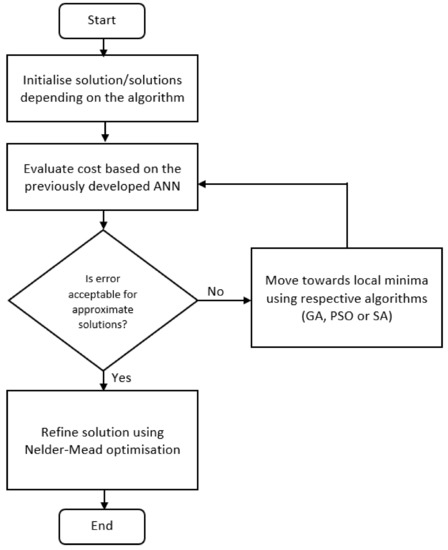
Figure 3.
Flowchart of steps followed to optimize welding process using Nelder-Mead optimization (NMO).
Error Function
The aim of the algorithm demonstrated in this research is to optimize the six welding input parameters in order to obtain the desired bead geometry measured considering the three outputs mentioned previously. First, the already developed ANN is used to predict the three outputs of the process. These outputs are then used to evaluate the error function shown in Equation (1). It is important to note here that all the outputs in this case have been given equal weight. Consequently, the Error function for optimization was defined as the square root of the sum of squares of individual errors.
where,
All the algorithms mentioned in this paper try to minimize this error function to obtain a set of optimized input parameters. In order to be able to compare different algorithms, the number of function evaluations (ANN in this case) required by individual algorithms to obtain the solution are considered. Every time the ANN is triggered, it is counted as one evaluation, even if the evaluation is a part of the same iteration for any particular algorithm. This helped in comparing the algorithms using a common scale, since GA and PSO are calculation intensive requiring multiple function evaluations per iteration whereas SA requires only one evaluation per iteration.
3. Application of Algorithms and Results
3.1. Genetic Algorithm
Genetic algorithms were first developed by John Holland in 1975 inspired from principles of genetics and natural selection. These algorithms have been successfully applied by researchers to a variety of optimization problems. The general steps involved in the optimization process are shown in Figure 4.
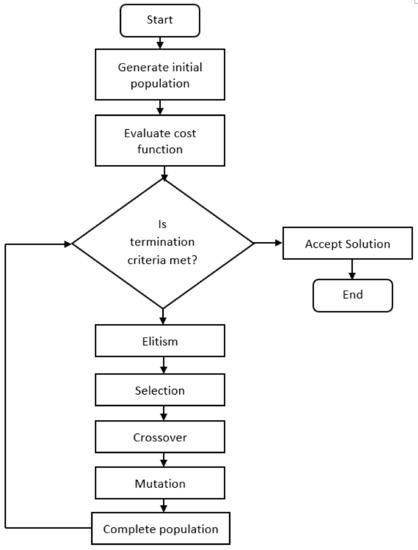
Figure 4.
General Flowchart for Genetic Algorithm (GA).
The genetic algorithms start with initializing a number of chromosomes (random solutions) collectively known as the initial population. The number of chromosomes in the population can have a significant impact on the results obtained as well as on the time and computational effort required to obtain the optimized solution. In this case after a few trial and error runs, the number of chromosomes was set to 10 since increasing them beyond this value only increased the computation effort without significantly reducing the final error level. Once the initial population is obtained, the error function for every chromosome is evaluated and the chromosomes are ranked according to their fitness based on the error (chromosomes with least error are the fittest). Elitism is a process of always selecting the best chromosome for next generation. In this case, out of the 10 chromosomes required in the next generation, the elite chromosome from the parent population was directly absorbed. The next six spaces were filled using a rank based selection method, whereas the last three spaces were filled by randomly generated chromosomes. From the six selected chromosomes, three pairs were formed for crossover operation with a crossover rate of 0.8. After crossover, some elements of these chromosomes were replaced (mutation) with a mutation rate of 0.3. All the operations including elitism, crossover and mutation, were repeated until the stopping criteria were met. Two stopping criteria were used to terminate the computation:
- Error in the elite chromosome falls below 0.1.
- Total number of generations (iterations) is more than 1000.
The computation is terminated when either of these criteria is met. These termination criteria were used only for the production runs i.e., the solutions obtained from which were fed in Nelder Mead optimization algorithm as discussed later in this section. They were removed from the algorithm during the trial runs done to understand the increase in number of function evaluations required on reducing the targeted maximum error, as illustrated in Figure 5. The algorithm parameters used for GA optimization are mentioned in Table 4.
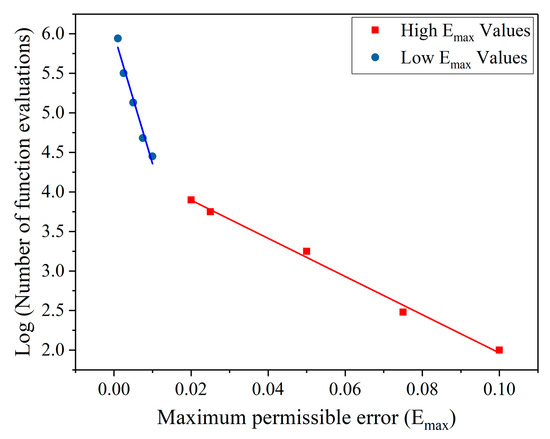
Figure 5.
Number of artificial neural network (ANN) evaluations required by GA to obtain a certain maximum permissible error.

Table 4.
GA parameters used for optimization.
Although GAs could have been used to further reduce the error mentioned above, the computation effort and time required would have significantly increased making its implementation impractical. The plot in Figure 5 shows the number of ANN evaluations required to obtain a certain minimum error on a logarithmic scale. Every data point on the plot is taken as an average of 50 individual observations. This is because the number of ANN evaluations required by GA to reach an acceptable solution can vary significantly depending on the chromosomes obtained after crossover and mutation. It can be seen in Figure 5 that the number of ANN evaluations required increase following a power law for errors down to roughly 0.01. Below this error level, the power law index jumps, dramatically increasing the number of function evaluations required. Below a certain targeted error level, the high number of function evaluations required to obtain the solution can make the implementation of this algorithm impractical. To overcome this problem, approximate solutions (targeted maximum error = 0.1) that require very few generations have been fed into NMO method which can reduce the error significantly with only a few additional ANN evaluations as shown in later sections.
3.2. Simulated Annealing
Simulated annealing is a probabilistic search algorithm inspired from the process of annealing of metals in order to obtain the desired properties and microstructure. General steps followed for optimization of parameters using SA algorithm are shown in Figure 6.
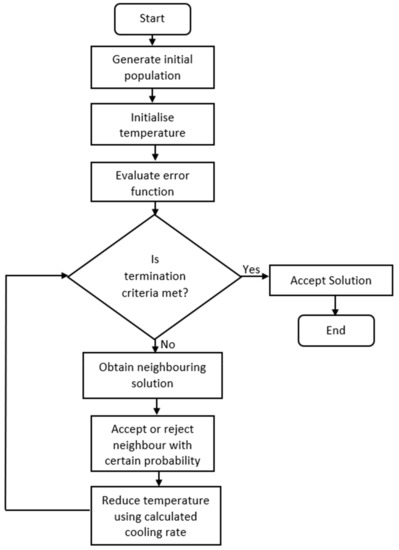
Figure 6.
General Flowchart for Simulated Annealing (SA) algorithm.
Simulated annealing only considers one solution at a time unlike the genetic algorithm method, which considers a number of chromosomes simultaneously. The fitness of this solution is compared to the fitness of a neighbouring solution. If the fitness of the neighbouring solution is better than that of the current solution, the neighbouring solution is always accepted. However, if the fitness of the neighbouring solution is worse than the current solution, the neighbour may still be accepted with a certain probability. This probability of acceptance of the worse solution depends on the difference in error between the two solutions and the current temperature. The annealing schedule, which is the rate at which the “temperature”, that is stepsize, is reduced in the SA algorithm, plays a critical role in obtaining a global minimum since it has a direct impact on the probability of acceptance of worse solution. A logarithmic cooling scheme, introduced by Geman and Geman, uses the cooling schedule as shown in Equation (2) [18].
where T(t) is temperature at time t, c and d are constants.
It has been proven that if c is greater than or equal to the largest energy barrier of the system, this cooling schedule can lead to the global minimum. However, this may require extremely large number of function evaluations, making its application impractical. Some other cooling schedules that are commonly used in order to overcome this problem are the linear schedule and exponential schedule as shown in Equations (3) and (4) respectively.
where T is the temperature at time t, T0 is temperature at time (t−1), η, α are constants.
For the SA algorithm in this case, the exponential cooling schedule was applied since it gave good results within acceptable computation time. The initial temperature used for the algorithm was 1 °C and was reduced using the cooling schedule to 0.01, after which the computation was terminated. This range of temperatures varied the probability of selection of worse solution roughly between 0.99 at high temperatures and 0.01 at low temperatures (depending on the error in the output). Another termination criteria used was that the error evaluated using the error function mentioned in Equation (1) falls below 0.1. When either of the two stopping criteria was met, the best solution obtained till that point was accepted as the solution from SA algorithm. These stopping criteria were used only for the production runs and were removed from the algorithm for trial runs. The stopping criteria on error could be reduced for the production runs, but the computation effort and time significantly increase with reduction in targeted maximum error as shown on a logarithmic scale in Figure 7. In this case also, every data point on the plot is taken as an average of 50 observations. The SA parameters used for the optimization in this case are mentioned in Table 5.
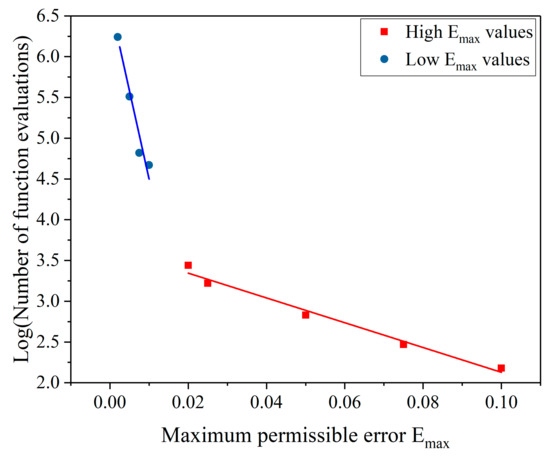
Figure 7.
Number of ANN evaluations required for SA to obtain certain maximum permissible error.

Table 5.
Parameters used in SA algorithm.
Similar to GA, reduction in maximum permissible error increases the number of ANN evaluations following a power law for errors down to 0.02, below which the power law index jumps. Consequently, further error reduction requires greater computational expenditure as seen from the line having steeper slope on the top left in Figure 7. In order to avoid this high computation effort to optimize, the maximum permissible error for the production runs was limited to 0.1 as mentioned earlier and the solutions obtained from SA were fed into the Nelder-Mead optimization algorithm to further reduce the error to 0.001 within only a few additional ANN evaluations.
3.3. Particle Swarm Optimization
Particle swarm optimization has similar characteristic to genetic algorithms, in that both of them start with assuming a number of solutions within the solution space. However, the methodologies these algorithms use to move towards the optimum solution vary significantly. PSO works primarily on two parameters, particle (solution) position and velocity. During every iteration, a particle is accelerated towards that particle’s best and global best solution obtained till that point. This is done by first updating the particle velocity using Equation (5).
where Vij(t+1) is the velocity of particle i at dimension j at time t+1, Vij(t) is the velocity of particle i at dimension j at time t, α, β are constants having a value of 2, r is a random number, gbest is the global best solution, pbest is the particle best solution, pij is the position of particle i at dimension j at time t.
On calculating the updated velocities, the particle positions are updated using the Equation (6).
where, pij is the position of particle i at dimension j, vij is the velocity of particle i dimension j.
The flowchart of the steps followed in PSO is shown in Figure 8. Similar to all the other algorithms mentioned above, this algorithm also used two different criteria for termination for the production runs. The first criterion was based on the maximum number of iterations, which was limited to 1000 at every temperature for this case, and the other was based on the error function, which was set to 0.1. When either of the two criteria is met, the algorithm terminates and the global best till that point is taken as the solution from PSO. The solutions from this algorithm can also be fed to the NMO method in order to further reduce the error which has been explained in detail later. Both these criteria were removed from the algorithm for the trial runs in order to understand the increase in computation effort required by PSO on lowering the targeted maximum error.
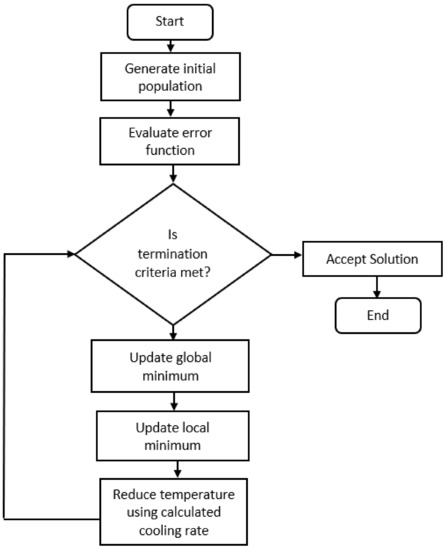
Figure 8.
General Flowchart for particle swarm optimization (PSO) Algorithm.
Figure 9 demonstrates the number of function evaluations required by PSO in order to obtain certain minimum error in the output on a logarithmic scale. As seen from the figure, it becomes impractical to reduce the error below a certain point as the computation effort and time increase significantly for no perceivable processing benefit. Similarly to the previous two algorithms, the data points in Figure 9 are taken as an average of 50 runs each.
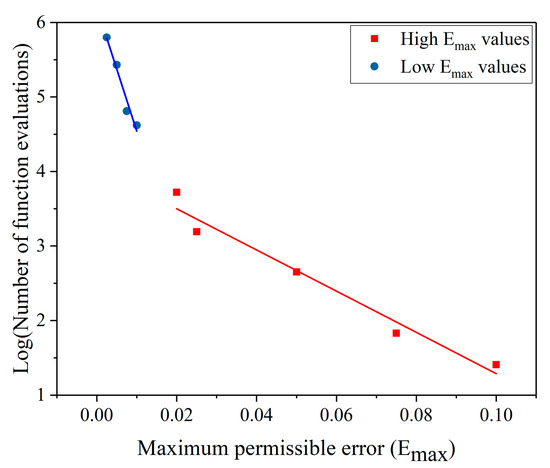
Figure 9.
Number of ANN evaluations required for PSO to obtain certain maximum permissible error.
On comparing the three algorithms mentioned so far, it was found that at a relatively high targeted error levels, GA required the highest number of ANN evaluations, whereas PSO required minimum evaluations. However, when the targeted maximum error is reduced, GA starts performing better than SA and PSO. In fact, in this case, a targeted maximum error of 0.001 could only be obtained using a GA, although it required close to one million ANN evaluations. This low error level could not be obtained using SA or PSO. This indicates that GA outperforms SA and PSO, which is in agreement to the results obtained by Sathiya, et. al. [14]. However, if function to optimize is costly to evaluate, one million evaluations to reach near the global minimum can be unacceptable.
3.4. Nelder-Mead Optimization Method
The Nelder-Mead optimization (simplex) method was first developed by John Nelder and Roger Mead in 1965. A simplex consists of n + 1 vertices in an n-dimensional space, each of which represents a potential solution to the optimization problem. The worst solution in every iteration is replaced by a better solution obtained through some operations on the vertices. The steps followed in the application of NMO in this case are shown below:
- Initialize the simplex using (n+1) potential solutions, where n is the number of parameters to be optimized.
- Define the error function
- For each simplex vertex, calculate the error using the error function. Consider that the best solution is vertex B, the worst solution is vertex W and the next worst solution is N with errors EB, EW, EN, respectively.
- If EB is less than the desired error, terminate; else follow the next steps
- Find the centroid, C, of the best n vertices of the simplex.
- Reflect point W through the centroid obtained and calculate the error for the reflected point R.
- Further steps depend on the error obtained at the reflected point as follows:Case 1 ER < EW:
- If ER < EB, extend point R to point E by an equivalent distance between C and R. Calculate EE.
- If EE < EB, replace W by E, else replace W by R. This extension process can develop skinny simplices which can restrict the ability of NMO to find good search directions. See below for the way the simplex can be re-fattened. Repeat the process from step 4Case 2 ER >= EW
- Calculate EC, the error value at the centroid. If EC < EB, construct a fat simplex about half the size about the centroid. Repeat the process from step 3.
- If EC < EN, find the midpoint, M, between C and R and find EM. If EM < EC, replace W by M otherwise replace W by C. Repeat the process from step 4.
- If EC > EN, construct a fat simplex about half the size about B. Repeat the process from step 3.
The NMO algorithm has been summarized in the flowchart shown in Figure 10. In order to simplify the understanding of the algorithm, a schematic with two variables (three vertices) is shown in the Figure 11.
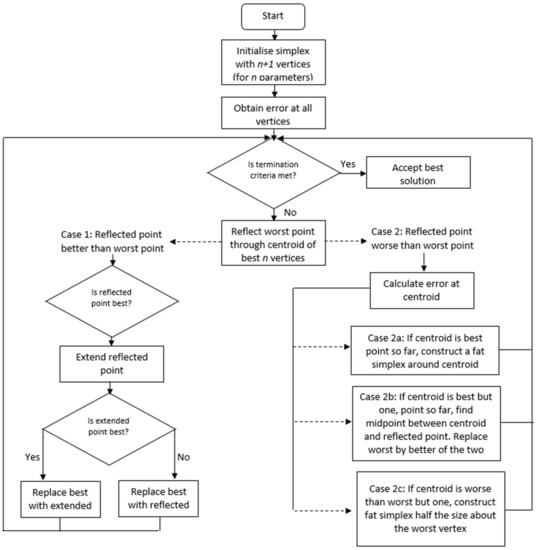
Figure 10.
Flowchart for the Nelder-Mead optimization algorithm.
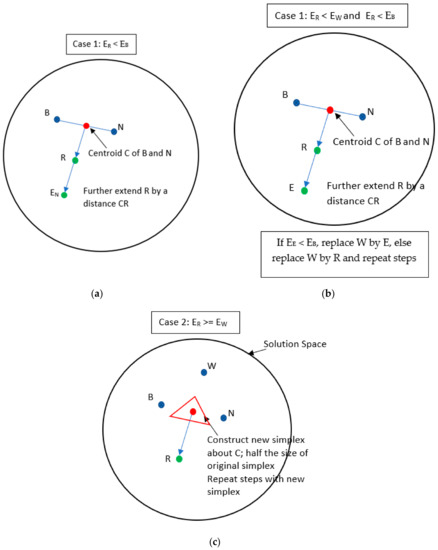
Figure 11.
Schematic representation of the Nelder-Mead simplex search in a 2-dimensional space. Different cases are represented in three different sub-figures (a,b) and (c). (a) To begin reflect the worst vertex (W) through the centroid of the other vertices. Following steps as demonstrated in Figure 11b or Figure 11c depend of the outcomes of point R. (b) If the error at R is lower than B, extend R in the same direction to point E; else repeat previous steps with new simplex B-N-R. (c) If the error at R is more than W, calculate error at C; if error at C is less than B, construct a fat simplex about half the size about the centroid. Repeat the process till the final solution is obtained.
NMO can be implemented to include constraints, but the process of taking the constraints into account usually makes the algorithm inefficient. Thus, NMO is almost invariably implemented as an unconstrained optimization algorithm, meaning that there is no control over the search space of the solution. If applied directly to optimize welding parameters, using an initial simplex that spans the feasible regime, the solution search would normally go into infeasible region.
Consequently, the above mentioned three algorithms (GA, SA and PSO) are first applied to find approximate solutions, with targeted maximum error of 0.1, following which the Nelder-Mead algorithm is used to further refine the solution. This in almost all the cases can guarantee that the solution obtained is inside the solution space. Finding an approximate solution initially also reduces the number of iterations within NMO required for obtaining significantly low errors.
The vertices (solutions) required to start the algorithm can be obtained through any of the above mentioned algorithms. Figure 12 shows the reduction in error on application of Nelder-Mead optimization to vertices obtained from GA. Since the stopping criteria error used for this GA optimization was relatively high (~0.1), only a few GA iterations were required to generate these initial vertices. This led to a very small computation effort and time. The number of ANN evaluations required by the GA to form a simplex of 7 vertices for 6 different trials is shown in Table 6. On an average 119 ANN evaluations were required for obtaining of each vertex. For the Simplex method, the stopping criterion was that the error at the best vertex falls below 0.001, which on an average required another 51 evaluations over and above the ones required by GA. The average number of total ANN evaluations required by the combined GA and NMO algorithm was 884 as seen in Table 6. If only GA was used to obtain this level of error, the number of evaluations required would be close to one million as mentioned previously. Thus, application of Nelder-Mead optimization in combination with GA can significantly reduce the computation effort and time.
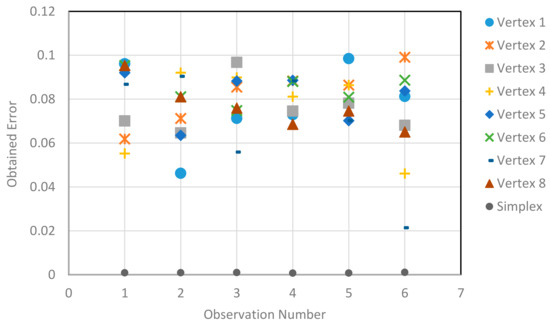
Figure 12.
Reduction in error on applying simplex optimization on solutions obtained from GA.

Table 6.
Number of iterations required by GA to obtain maximum targeted error for further application of Simplex method.
For every trial in Figure 12, each vertex was obtained by running the GA once to obtain an error below 0.1 and taking the elite chromosome (solution) as one of the vertices. Consequently, for every trial, the GA has been run 7 times.
It can be similarly shown that the number of ANN evaluations for optimization can also be significantly reduced by applying NMO method on the approximate solutions obtained from SA. Figure 13 shows the reduction in the error in outputs when the same NMO algorithm was applied to the approximate solutions obtained from SA. In this case also, each vertex for every trial is obtained by evaluating the SA algorithm once. On an average 151 ANN evaluations were required by SA to reduce the error to 0.1 and form each vertex of the simplex. Additionally, NMO required another 48 ANN evaluations in order to reduce the error below 0.001 as shown in Table 7. As mentioned earlier, this low level of error could not be obtained if only SA was used with the existing parameters such as the cooling schedule and decay rate. The average total number of ANN evaluations required for the combined SA and NMO to obtain the error below 0.001 is 1105; consequently, proving the efficiency of NMO.
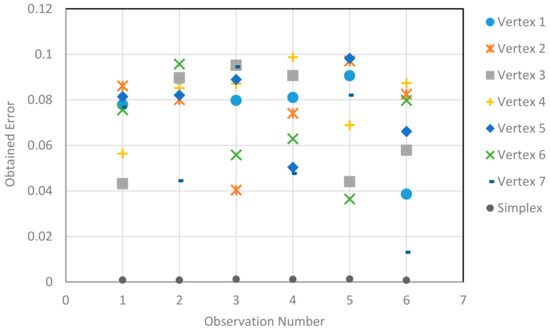
Figure 13.
Reduction in error on applying simplex optimization on solutions obtained from SA.

Table 7.
Number of iterations required by SA to obtain maximum targeted error for further application of Simplex method.
Nelder-Mead optimization is equally effective on the approximate solutions obtained from PSO as shown in Figure 14. The average number of total ANN evaluations required by the combined PSO and NMO algorithm to reduce the error below 0.001 was 317 as shown in Table 8. This value is lower than that required by the GA+NMO and SA+NMO mainly due to the fact that PSO requires fewer ANN evaluations to develop the initial simplex compared to GA and SA. This low level of error could not be obtained on using only PSO as previously mentioned.
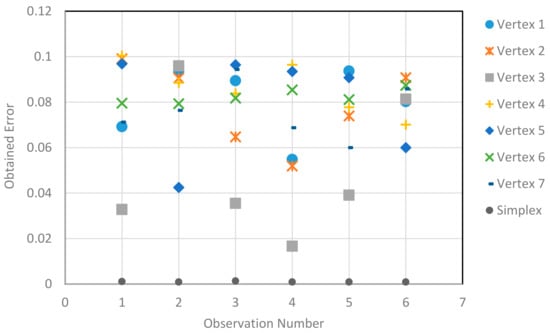
Figure 14.
Reduction in error on applying simplex optimization on solutions obtained from PSO.

Table 8.
Number of iterations required by PSO to obtain maximum targeted error for further application of Simplex method.
Figure 15 shows the number of ANN evaluations required to obtain certain levels of maximum error using different algorithms for a randomly chosen desired outputs of the welding process. The significant drop in the number of evaluations required when NMO is used along with any other algorithm makes the application of such a combined system extremely practical and easily applicable in solving optimization problems.
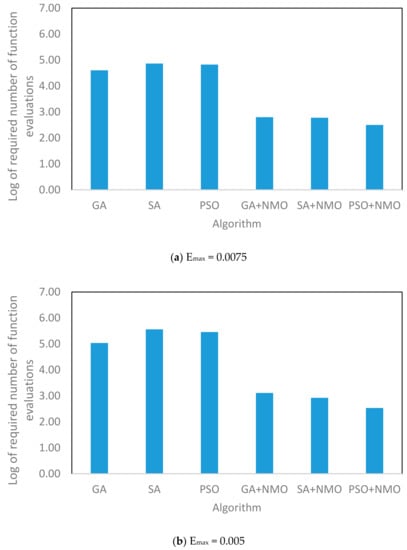
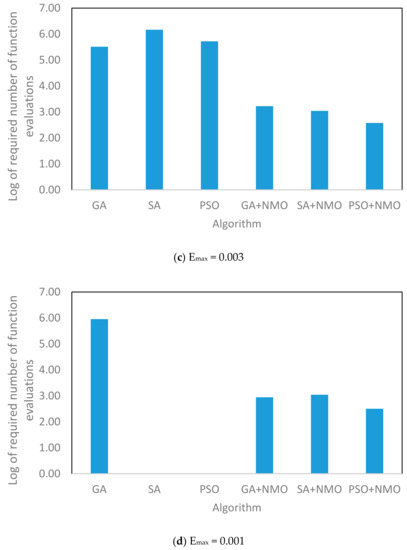
Figure 15.
Comparison of number of ANN evaluations required to obtain different error levels by different algorithms.
4. Conclusions
From the experimental data obtained and the computational models developed, the following can be concluded:
- A number of evolutionary algorithms can be used for optimization of weld bead geometry of a TIG welding process using a filler material. However, the computation effort and time required by these algorithms to achieve the desired error can make the use of these algorithms impractical.
- When GA, SA and PSO are compared at a sufficiently high targeted maximum error, the number of function evaluations required by PSO to find a solution is minimum. However, when the targeted error is reduced, GA proves to be more efficient, requiring fewer ANN evaluations as compared to the other two algorithms.
- In all the algorithms mentioned above, as the targeted error is reduced, the number of function evaluations required increases following a power law initially until a certain error is reached, after which the power law index jumps increasing the number of function evaluations to increase dramatically.
- On cheaply obtaining approximate solutions that don’t violate constraints from any of the above-mentioned algorithms, the Nelder-Mead (Simplex) optimization method can be applied to the solutions to further reduce the error significantly within a very few additional evaluations.
Thus, this hybrid optimisation method, using algorithms that can easily take account of constraints, and which, because of their nature, are effective at finding the general region in parameter space wherein the global optimum resides relatively cheaply, and using the remarkably efficient Nelder-Mead algorithm to home in on the precise global optimum, without violating physical parameter constraints, shows a high level of robustness, combined with great efficiency.
Author Contributions
Conceptualization, R.K. and S.J.; methodology, R.K. and S.J.; software, J.T.; validation, J.L. and J.T.; formal analysis, R.K. and S.J.; data curation, R.K. and J.T.; writing—original draft preparation, R.K.; writing—review and editing, J.L.; visualization. All authors have read and agreed to the published version of the manuscript.
Funding
This research received no external funding.
Acknowledgments
The authors would like to thank Coventry University for all the financial support provided to make this research possible.
Conflicts of Interest
The authors declare no conflict of interest.
References
- Xiong, J.; Zhang, G.; Hu, J.; Wu, L. Bead geometry prediction for robotic GMAW-based rapid manufacturing through a neural network and a second-order regression analysis. J. Intellect. Manuf. 2014, 25, 157–163. [Google Scholar] [CrossRef]
- Lakshminarayanan, A.K.; Balasubramanian, V. Comparison of RSM with ANN in predicting tensile strength of friction stir welded AA7039 aluminium alloy joints. Trans. Nonferrous Met. Soc. China 2009, 19, 9–18. [Google Scholar] [CrossRef]
- Nagesh, D.S.; Datta, G.L. Genetic algorithm for optimization of welding variables for height to width ratio and application of ANN for prediction of bead geometry for TIG welding process. Appl. Soft Comput. 2010, 10, 897–907. [Google Scholar] [CrossRef]
- Acherjee, B.; Mondal, S.; Tudu, B.; Misra, D. Application of artificial neural network for predicting weld quality in laser transmission welding of thermoplastics. Appl. Soft Comput. 2011, 11, 2548–2555. [Google Scholar] [CrossRef]
- Okuyucu, H.; Kurt, A.; Arcaklioglu, E. Artificial neural network application to the friction stir welding of aluminum plates. Mater. Des. 2007, 28, 78–84. [Google Scholar] [CrossRef]
- Karsai, G.; Andersen, K.; Cook, G.E.; Barnett, R.J. Neural network methods for the modeling and control of welding processes. J. Intell. Manuf. 1992, 3, 229–235. [Google Scholar] [CrossRef]
- Vitek, J.M.; David, S.A.; Hinman, C.R. Improved Ferrite Number Prediction Model that Accounts for Cooling Rate Effects Part 1: Model Development. Weld. J. 2003, 82, 43-S. [Google Scholar]
- Hu, X.; Eberhart, R.C.; Shi, Y. Engineering optimization with particle swarm. In Proceedings of the 2003 IEEE Swarm Intelligence Symposium. SIS’03, Indianapolis, IN, USA, 26–26 April 2003. [Google Scholar]
- Katherasan, D.; Elias, J.V.; Sathiya, P.; Haq, A.N. Simulation and parameter optimization of flux cored arc welding using artificial neural network and particle swarm optimization algorithm. J. Intell. Manuf. 2014, 25, 67–76. [Google Scholar] [CrossRef]
- Roshan, S.B.; Jooibari, M.B.; Teimouri, R.; Asgharzadeh-Ahmadi, G.; Falahati-Naghibi, M.; Sohrabpoor, H. Optimization of friction stir welding process of AA7075 aluminum alloy to achieve desirable mechanical properties using ANFIS models and simulated annealing algorithm. Int. J. Adv. Manuf. Technol. 2013, 69, 1803–1818. [Google Scholar] [CrossRef]
- Tarng, Y.S.; Tsai, H.L.; Yeh, S.S. Modeling, optimization and classification of weld quality in tungsten inert gas welding. Int. J. Mach. Tools Manuf. 1999, 39, 1427–1438. [Google Scholar] [CrossRef]
- Czyzżak, P.; Jaszkiewicz, A. Pareto simulated annealing—A metaheuristic technique for multiple-objective combinatorial optimization. J. Mult-Criteria Decis. Anal. 1998, 7, 34–47. [Google Scholar] [CrossRef]
- Kolahan, F.; Heidari, M. Modeling and optimization of MAG welding for gas pipelines using regression analysis and simulated annealing algorithm. JSIR 2010, 69, 259–265. [Google Scholar]
- Sathiya, P.; Aravindan, S.; Haq, A.N.; Paneerselvam, K. Optimization of friction welding parameters using evolutionary computational techniques. J. Mater. Process. Technol. 2009, 209, 2576–2584. [Google Scholar] [CrossRef]
- Correia, D.S.; Gonçalves, C.V.; da Cunha, S., Jr.; Ferraresi, V.A. Comparison between genetic algorithms and response surface methodology in GMAW welding optimization. J. Mater. Process. Technol. 2005, 160, 70–76. [Google Scholar] [CrossRef]
- Pashazadeh, H.; Gheisari, Y.; Hamedi, M. Statistical modeling and optimization of resistance spot welding process parameters using neural networks and multi-objective genetic algorithm. J. Intell. Manuf. 2016, 27, 549–559. [Google Scholar] [CrossRef]
- Kshirsagar, R.; Jones, S.; Lawrence, J.; Tabor, J. Prediction of Bead Geometry Using a Two-Stage SVM–ANN Algorithm for Automated Tungsten Inert Gas (TIG) Welds. J. Manuf. Mater. Process. 2019, 3, 39. [Google Scholar] [CrossRef]
- Szu, H.; Hartley, R. Fast simulated annealing. Phys. Lett. A 1987, 122, 157–162. [Google Scholar] [CrossRef]
© 2020 by the authors. Licensee MDPI, Basel, Switzerland. This article is an open access article distributed under the terms and conditions of the Creative Commons Attribution (CC BY) license (http://creativecommons.org/licenses/by/4.0/).