Highlights
What are the main findings?
- Developed a safety-aware pre-flight trajectory planner that incorporates contingency plans for mechanical failures, GPS denial/spoofing, and communication loss.
- Demonstrated that modest increases in trajectory length can significantly improve safety by ensuring feasible emergency landings and robust operations in urban environments.
What is the implication of the main finding?
- Enhances the reliability of UAV operations under real-world failure scenarios, supporting safe integration of drones into urban airspace.
- Provides a framework aligned with regulatory safety guidelines (FAA, EASA, CASA) that can inform the design of future Unmanned Traffic Management (UTM) systems.
Abstract
Urban drone operations are exposed to unpredictable risks, including engine failure and deliberate signal interference. A recent and ongoing disruption in Jeddah, Saudi Arabia, has seen widespread GPS spoofing that misleads devices by hundreds of kilometers, illustrating how fragile unmanned aerial vehicle (UAV) operations can become when over-reliant on GNSS-based navigation. Such disruptions highlight the urgent need for contingency planning in drone traffic management systems. This study introduces a safety-aware pre-flight path planning framework that proactively integrates emergency landing and GPS fallback options into UAV trajectory pre-flight planning. The planner considers proximity to predesignated emergency landing zones, communication coverage, and airspace restrictions, enabling UAVs to safely complete their operations. The approach is evaluated across realistic mission profiles such as delivery, inspection, and surveillance. Results show that the planner successfully maintains mission feasibility while embedding emergency readiness throughout each flight. This work contributes toward safer, failure-resilient drone integration in urban airspace, ensuring that contingency plans are proactively incorporated into path planning before the failure even occurs.
1. Introduction
Safety is one of the central challenges facing the future of unmanned traffic management (UTM). As drone operations scale up both in volume and complexity [,], there is a need to ensure that the resulting increase in air traffic density is matched by equally robust safety mechanisms and contingency planning. Unlike commercial aviation, where systems are mature and redundant, drones are more prone to failure modes [], such as engine failure [], loss of communication [], and loss of GPS signal [].
Recently, GPS spoofing has become a common issue for residents of Jeddah, KSA, by the Red Sea []. While driving through the city and checking the GPS, the navigation app often shows the location in Port Sudan, approximately 300 km away, as shown in Figure A1 in Appendix A. This situation has persisted for several months since it was first noticed on 9 May. Such a situation would have jeopardized any GPS-reliant drone delivery system, making its operations unsafe. Therefore, loss of GPS signal must be proactively planned for as a failure mode that the drone may encounter. To strive for a robust and safe UTM system, it is imperative to plan ahead and establish contingency strategies (Plan B) to mitigate this risk.
Global aviation authorities, such as the FAA and EASA, are working to put in place safety requirements for drone operations, which include the need for real-time risk mitigation, emergency procedures, and minimum performance thresholds under failure scenarios [,]. However, many of these regulations are still evolving, particularly in urban and mixed-use airspace. For drones to safely share the skies with manned aircraft and operate over populated areas, the UTM system must include built-in safety mechanisms capable of handling both anticipated and unforeseen disruptions [,].
To address these challenges, we introduce a safety-aware path planner designed to generate flight trajectories that proactively minimize exposure to high-risk zones and ensure accessibility to emergency landing areas in the event of failure. This planner integrates safety considerations into the route selection process, enhancing the resilience of drone operations in urban environments. To this end, we developed a simulator that can put our project to the test in an environment familiar to the authors, namely the King Abdullah University of Science and Technology (KAUST) community and campus.
The main contributions of this paper are summarized as follows:
- A safety-aware pre-flight path planner that explicitly integrates proximity to emergency landing zones and GPS fallback options into drone trajectory optimization.
- Contingency planning for failure modes, especially GPS spoofing or signal loss, by planning trajectories within proximity of at least three GSM towers.
- Geospatial integration of urban airspace data, including 3D building models, points of interest (POIs), communication tower locations, and no-fly zones (NFZs), for realistic and constrained path planning.
- A multi-mission simulation framework to model and evaluate various drone operational profiles, including food delivery, security patrol, and environmental monitoring within a controlled urban environment.
This work has the potential to significantly influence the operations of already existing drone delivery solutions, such as Zipline [], Wing [], Meituan [], and UPS Flight Forward []. Zipline has established itself in medical drone deliveries, completing over a million deliveries of blood, vaccines, and pharmaceuticals across Africa, Asia, and the United States. More recently, their operations have expanded into retail partnerships with companies like Walmart []. On the other hand, Meituan has demonstrated large-scale operations of urban drone delivery in China, where its drones complete thousands of food and beverage deliveries per day in cities such as Shenzhen and Beijing []. Integrating a safety-aware pre-flight planning framework, such as the one presented in this work, could further enhance these systems by providing robust contingency strategies against failures like GPS loss or communication outages, thereby improving operational safety and reliability without requiring major changes to their existing infrastructure.
Our safety-aware pre-flight planning environment offers a public-domain formalization of how these systems may function under strong safety constraints.
In the following sections, we first provide an outline of the system (Section 3). Next, Section 4 provides a comprehensive description of the simulation environment, including the environmental setup, drone missions, emergencies, off-nominal events, and drone dynamics with their interaction within the environment. Section 5 details the safety-aware path planner, describing its underlying algorithms, its integration of safety constraints, and its role in optimizing drone trajectories to mitigate risks while maintaining operational efficiency. We then integrate these elements by explaining the simulation loop and detailing the simulation runs (Section 6), concluding with a discussion of the results (Section 7 and Section 8) and the conclusion of our work (Section 9).
2. Literature Review
UTM systems are still under active development, with agencies such as the FAA and EASA each taking their own approaches [,]. Despite regional differences, safety remains the central objective, typically defined by a failure threshold of per flight hour for general aviation [,]. This emphasis is especially critical as drone usage rapidly scales up. In the U.S. alone, the FAA forecasts daily drone deliveries to exceed 50 million, up from 8 million today [], with over 2.8 million recreational and commercial drones expected by 2029 []. Compared to commercial aircraft, drones operate in less structured, more failure-prone environments [], especially in urban areas.
Regulatory frameworks are evolving to mitigate risks. In the U.S., Title 14 CFR Part 107 and Section 44809 outline operational rules such as maximum altitude (120 m), visual line-of-sight, and mandatory registration for drones heavier than 250 g. The FAA also introduced categories for operations over people, defining impact energy limits and requiring features like propeller guards or parachutes. Similarly, EASA divides small unmanned aerial vehicle (sUAV) operations into Open, Specific, and Certified categories, with most urban flights falling under the first two. Open Category rules restrict proximity to people and buildings based on drone weight classes, while Specific Category operations, which are beyond visual line of sight (BVLOS) or urban flights, require a Specific Operational Risk Assessment (SORA), including emergency recovery plans, redundancy, and demonstration that no single failure can lead to a fatality [].
Across all jurisdictions, failure mode mitigation is a regulatory cornerstone. Standard safety mechanisms include return-to-home (RTH), parachute recovery systems, and autonomous landing capabilities in the event of lost link, GPS spoofing, or system failure. Both FAA and EASA allow deviation from standard rules during emergencies to prioritize safety, and mandate the integration of fail-safe features like geofencing, flight termination systems, and redundant control units. These measures aim to prevent fly-aways and ensure that even in failure scenarios, drones can be recovered or safely terminated without endangering people or property [].
2.1. Related Work
Ensuring the safe operation of drones in urban and suburban environments under failure scenarios has become a pressing concern. Various studies have proposed approaches to address three key failure modes: power or propulsion failure (necessitating emergency landings), GPS denial or spoofing, and loss of communication. These failures are addressed using both pre-flight planning and real-time onboard sensing strategies.
Pre-Flight Contingency Planning
Pre-flight contingency planning has been explored for fixed-wing drones. Ayhan et al. [] present a wind-aware trajectory planner that guarantees reachability to preselected emergency landing strips in case of engine failure or communication loss. The planner generates gliding paths around no-fly zones (NFZs), ensuring that from any point on the flight path, a safe landing is always achievable. However, their framework assumes a primary flight path is already given, and contingency trajectories are then generated from each waypoint to the nearest safe site. This structure differs fundamentally from ours. Rather than treating contingency planning as an afterthought, our planner generates the primary path itself in a safety-aware manner, ensuring proximity to emergency landing areas throughout the mission. In doing so, our approach directly integrates contingency considerations into the nominal trajectory, addressing a shortcoming of existing methods by making the baseline flight plan itself inherently safer. This shift is particularly critical in dense urban airspaces, where precomputing contingency routes from every waypoint is infeasible and real-time deviations may not be possible.
In [], Lin et al. present a failure analysis framework for UAVs that integrates safe path planning into the mission design process. They model multiple failure scenarios, including system degradation and sudden loss of thrust, and identify failure-prone zones in the environment. Using a grid-based planner, the study evaluates flight trajectories based on the severity of potential failures along the path, with their key contribution being the integration of crash-probability density into the planning process. Populated areas are treated as strict no-fly zones (NFZs), effectively steering the UAV away from regions of high consequence. While this is effective in some scenarios, it assumes that populated areas can be excluded outright, which does not hold in dense urban environments. If this assumption is relaxed, the framework primarily avoids NFZs without proactively placing UAVs near safe landing areas. Moreover, their method does not explicitly address communication or GPS loss scenarios, nor does it leverage urban-specific spatial constraints, such as designated emergency landing sites or known communication infrastructure. In contrast, our work incorporates these operational realities directly into the path planning process, ensuring that contingency preparedness is embedded in the nominal trajectory, rather than treated as a separate post-analysis step. This integration is essential for future urban UAV traffic management, where strict NFZ avoidance alone is insufficient to guarantee safe and resilient operations.
Together, these works highlight the importance of both pre-flight and in-flight safety mechanisms, particularly in urban environments. They show that integrating emergency landing planning, GPS-denied operation, and comm-failure resilience into path planning improves system robustness and mission safety across fixed-wing and multirotor drones operating in complex 2D and 3D settings.
To the best of the authors’ knowledge, no existing pre-flight path planning frameworks explicitly incorporate prior knowledge of the environment to enhance flight safety by maximizing proximity to emergency landing sites in anticipation of failure modes that may require immediate landing. Furthermore, no prior work has been identified that leverages a priori knowledge of communication tower locations to optimize network connectivity along the flight path, thereby increasing the availability of infrastructure for localization fallback, such as trilateration [,], when GPS signals are lost or degraded.
We believe the only related work is our previous study [], in which we initiated the investigation of safety-oriented path planning by focusing on the transportation of safety-critical medical supplies, particularly blood transfusion units. That work introduced a preliminary strategy for enhancing in-flight safety by identifying suitable emergency landing sites along the planned route. Inspired by the Extended Range Operations (ETOPS) regulatory principle from manned aviation, we assume a predefined gliding range for the drone and ensured that a reachable landing site was continuously maintained within this range throughout the flight. This approach laid the foundation for the integration of emergency preparedness into drone path planning.
The work we present here covers some of the shortcomings of our previous work, by focusing on more general operations, rather than only safety-critical medical deliveries. We also shift our focus to more urban settings, where drone operations are more dense. Furthermore, we consider more contingency plans, namely loss of communication and loss of GPS signal, in addition to emergency landing. Lastly, we illustrate the performance of our work in a simulator of unmanned operations at KAUST environment, with realistic geographic data.
The present work addresses the limitations of our previous study by extending the scope beyond safety-critical medical deliveries to include general drone operations. In contrast to the earlier rural and low-density focus of the communes surrounding Aix-en-Provence, France, this study emphasizes urban environments where drone activity is denser and operational constraints are more complex. Additionally, the framework incorporates a broader range of contingency scenarios, including emergency landing due to propulsion or structural failures and trilatiation for loss of GPS signal. To evaluate the effectiveness of the proposed approach, we implement and validate it within a simulator built on geographic data from the KAUST community.
3. System Outline
UTM systems are generally categorized into two architectural structures: centralized and decentralized []. The main difference between the two structures lies in the decision-maker of the system and the flow of information. For centralized UTM systems, a central entity governs the flow of information between the different stakeholders. As for a decentralized UTM, the responsibility is distributed among all the stakeholders. Information is shared among the stakeholders, enabling collaborative decision-making in compliance with regulatory frameworks [].
The simulator is designed after a centralized UTM system architecture because it enables stronger safety oversight and more effective policy enforcement. This is permitted by the central authority monitoring and managing all operations. Furthermore, such a structure will have a better emergency response by rerouting nearby vehicles, restricting access to airspace, and coordinating with emergency services better [].
To implement the simulator in software, we define a set of interconnected modules. The relationships between these modules are illustrated in Figure 1. The Physics Simulator simulates drone movement and detects collisions. Meanwhile, the Drone Model and Controller generate control inputs using a simplified representation of drone dynamics. In addition, the Decision Maker governs the flow of information, including the exchange of drone states, operational events, and command directives. Moreover, the Mission Planner and Manager assign missions to drones and monitor their execution. The Environment Module further provides essential geographic data, including 3D building models and airspace constraints. To introduce variability, the Random Event Generator triggers failures or disturbances based on probabilities derived from real-world operational data. Concurrently, the Data Logger records mission data for post-run safety and performance analysis. The Path Planner then computes optimal drone trajectories, balancing safety and performance trade-offs. In parallel, the Emergency Response Handler addresses unpredictable events that may disrupt nearby operations. Finally, the Contingency Manager executes predefined backup plans for handling failure scenarios.
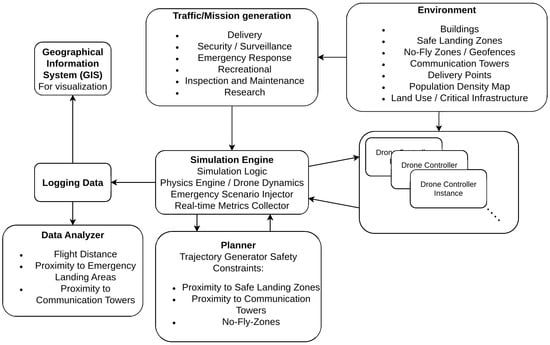
Figure 1.
Overview of the internal simulator architecture, showing the core modules and their interactions.
The proposed system adopts a centralized UTM architecture, characterized by a central decision-making entity that governs all aspects of drone operations, including information flow, mission planning, and emergency response coordination. This central authority manages a hierarchical information structure, where drones report their planned trajectories and statuses, allowing the system to maintain full situational awareness and perform conflict detection and resolution. All mission planning and path generation occur centrally rather than onboard, ensuring consistent and coordinated actions across the fleet. Additionally, the UTM system offers centralized services such as contingency planning, random event handling, and post-mission analysis. Figure 2 illustrates how our framework fits into the standard architecture of a centralized UTM system.
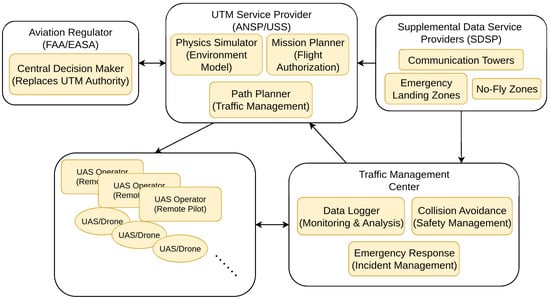
Figure 2.
Integration of our simulation framework into a centralized UTM system architecture.
4. Simulation Environment
In this work, we design and implement a simulator and provide a description of its functionalities. The simulator is capable of simulating dense airspace, where up to 100 drones may operate simultaneously. To accommodate the challenge of high computational times, we parallelize on high-performance CPUs (Intel(R) Xeon(R) CPU E5-2680 v4, 56 cores, Intel, Santa Clara, CA, USA) by assigning to each CPU core the control of a single drone. To ensure a realistic case study, we enhance the simulator using real-world datasets, such as environmental data based on a real location (KAUST). This data was collected from many sources, including OpenStreetMaps, the KAUST Security team, and the Campus and Community team. All simulation outputs are visualized using Quantum Geographic Information System (QGIS), chosen for its compatibility with geospatial data and regional accuracy. Additionally, all simulation traces are stored for offline analysis and future reproducibility.
4.1. Environment
The simulator models a detailed environment to inform drone decision-making. Points of Interest (POIs) represent locations like restaurants and residences used for trajectory endpoints, derived from OpenStreetMap data. Three-dimensional building models, constructed from building footprints and height data, provide realistic vertical constraints while optimizing performance with simplified polyhedra. Emergency landing zones, shown in Figure 3, are predesignated offline based on safety and regulatory criteria, allowing proximity-based trajectory planning. The airspace is defined by both permanent and temporary NFZ, shown in Figure 3, such as helipads and emergency areas, dynamically integrated into flight planning. Communication towers, shown in Figure 4, are integrated into the trajectory optimization, favoring paths with stronger connectivity and GPS fallback to support reliable operation and contingency handling.
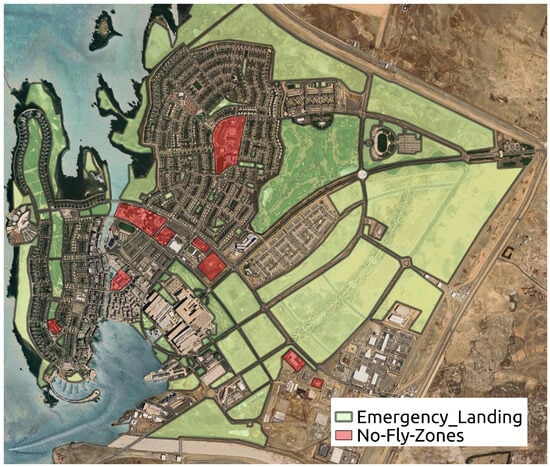
Figure 3.
Map of the KAUST community showing designated emergency landing areas and NFZs. Emergency landing areas were selected based on criteria such as low foot traffic, open flat terrain, accessibility, and regulatory compliance to ensure safe landings during in-flight failures. NFZs represent permanent flight restrictions applied for safety, security, or operational reasons.
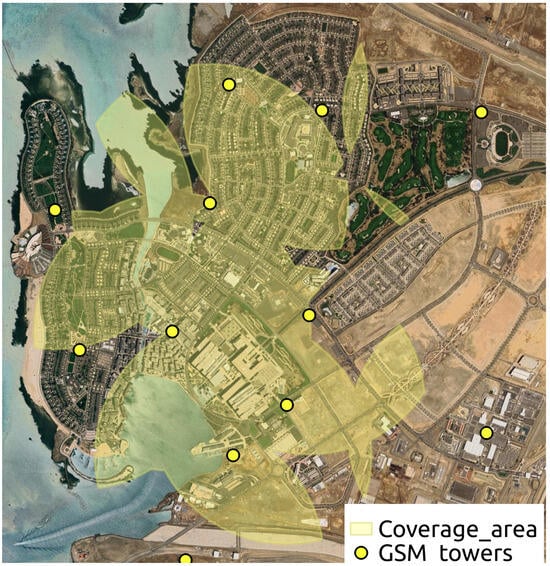
Figure 4.
Map of the KAUST community showing the locations of GSM towers in yellow points and highlighting regions of airspace that fall within the coverage intersection of three or more GSM towers. These areas support enhanced communication reliability and enable signal-based fallback localization strategies.
The current study is limited to a single site (KAUST). KAUST was chosen deliberately because of the authors’ familiarity and the availability of detailed data from OpenStreetMaps, the KAUST Security team, and the Campus and Community team. In addition, KAUST offers a unique environment that combines residential, academic, and service zones with diverse traffic patterns, making it a relevant testbed for autonomous traffic management research.
4.2. Missions
The simulator incorporates multiple mission types to emulate realistic drone activity in a community like KAUST. These missions include food delivery missions (the most frequent), ground traffic monitoring by drones hovering at intersections, and perimeter security patrolling. Research missions simulate environmental monitoring, such as coastal dye tracking [], while inspection missions focus on aerial assessments of rooftop solar panels. Recreational use is also included, modeled as unconstrained flight within a designated area, collectively generating diverse and representative drone traffic patterns.
4.3. Drone Dynamics
The drone is modeled as a point mass moving in a three-dimensional space. Its dynamics are simplified and described using a double integrator model. Specifically, the position and velocity move according to the equations
where is the control input corresponding to the acceleration. We denote and , where is the state vector and is the input vector. The equations of the dynamical model
We use the discretized double integrator model
where, for a discretization time ,
are the system and control matrices, respectively.
Since most delivery drones, in practice, are multirotors [], the double integrator model is used for its simplicity, scalability, and compatibility with standard control frameworks such as Model Predictive Control (MPC) and Mixed-Integer Linear Programming (MILP)-based collision avoidance, which will be discussed in the following sections. While it does not model rotational dynamics and external disturbances, this model is suitable for strategic, high-level multi-agent simulations that focus on the cruise phase of the flight. It can be extended in future work to capture more complex behaviors.
4.4. Controller
To control the drones, we use an MPC [], which is a control method that optimizes an objective function of the cost. Typically, the cost is a combination of state reference tracking and energy consumption. This optimization program is subject to model dynamics such as the ones described in Section 4.3, state limits constraints, and control input constraints. In addition, other problem-specific constraints can be incorporated to achieve certain behaviors, such as vehicle collision avoidance and obstacle avoidance constraints.
The MPC controller solves an optimization problem over a prediction horizon of N increments, with a time step of 0.1 s, corresponding to 50 increments and a total horizon of 5 s. At a simulated time , the optimization problem is solved, producing a prediction horizon from to . Only the control input from the first time step is applied at , and the process is repeated at .
In our simulation, we use a linear objective to improve the performance due to collision constraints described later in this section, which introduces integer programming to the optimization formulation. The linear objective function is achieved by linearizing the absolute value using auxiliary variables []. The absolute value function
is minimized in the objective by introducing slack variables , such that
which bounds the argument of the absolute value. The term
represents the sum of slack variables and replaces the absolute value, minimizing the state deviation. Doing so allows us to use the following formulation for the MPC, which has a linear objective and is subject to linear constraints:
4.4.1. Definitions
- : state vector at time step k.
- : velocity components of the state at time step k.
- : control input vector at time step k.
- : desired reference state.
- : slack variables for absolute value terms.
- : weighting factor for control effort.
- : state-space model matrices.
- : control input bounds.
- : state bounds.
- N: prediction horizon.
- : polyhedral approximation matrix for the maximum velocity constraint, with rows for .
- : maximum allowed velocity.
4.4.2. Velocity Constraints
To properly model the dynamics of the drone, we impose velocity constraints in the optimization problem. To maintain the linearity of the optimization problem formulation, the velocity limit is approximated using 16 discrete angles of , effectively forming a polyhedral approximation of the -norm constraint on the maximum velocity. Let for . The set of velocity constraints
form the linearized maximum velocity constraints for the drone. The velocity and acceleration limits are chosen to be similar to those of the drones Meituan [] uses for delivery, which can reach speeds of up to 10 m/s [], while the maximum acceleration is assumed to be approximately 2 m/s2 based on comparable delivery quadrotor systems.
4.4.3. Reference Tracking with Waypoints
In our setup, the reference trajectory is defined as the sequence of waypoints generated via the path planner. At any given time, the active reference corresponds to the current waypoint. The state deviation constraints
ensure that the optimization penalizes deviations from this reference, driving the drone toward the waypoint. Once the drone is within a threshold distance of the waypoint, the reference is updated to the next waypoint in the sequence. This mechanism allows the MPC to achieve reference tracking in line with the typical waypoint-based structure of drone navigation, such as QGroundControl [], Universal Ground Control Software [], and Mission Planner []. The slack variables then enable this tracking error to be expressed with the absolute value, or the -norm, directly in the cost function, as shown in Equation (2).
4.4.4. General Obstacle and NFZ Avoidance Constraints
To enable safe navigation in complex 3D environments, the simulator supports avoidance of both general obstacles and NFZs using a unified geometric constraint formulation. This is accomplished by modeling both as convex polyhedral regions and encoding the disjunctive collision avoidance constraints into an MILP framework.
4.4.5. Obstacle Avoidance in 3D Space
To achieve collision avoidance, we implement an MILP approach described in []. This approach uses a set of mixed-integer linear constraints to define the set of planes that define the objects. General obstacles are modeled as convex polyhedra, defined by the intersection of K half-spaces
which together specify the bounding surfaces of the obstacle.
To formulate a MILP-compatible constraint that ensures the drone avoids the obstacle, we introduce binary slack variables and a large positive constant M. Each constraint is then relaxed as follows,
This formulation allows the violation of any subset of constraints via the slack variables. To guarantee that the point lies outside the polyhedron, we enforce
which ensures that at least one of the half-space inequalities remains active, forcing the point to lie outside the convex polyhedral obstacle, since it cannot simultaneously satisfy all bounding planes. Figure 5a shows an example of this constraint.
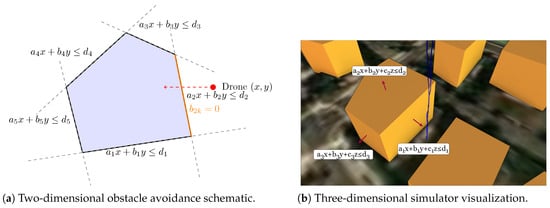
Figure 5.
Illustration of collision avoidance constraints. (a) shows the 2D case, where the pentagon (blue) represents the intersection of half-spaces and the drone (red) remains outside by relaxing at least one constraint (). (b) shows a 3D view from the simulator, where collision avoidance is enforced with respect to building obstacles.
4.4.6. NFZ Avoidance in 2D Projection
Similarly, NFZs are treated as vertical extrusions of 2D convex polygons. Each NFZ is defined by its horizontal footprint,
with no restriction on the z-axis. Using the same slack variable strategy, the constraints are relaxed as
where the binary variables allow individual inequalities to be deactivated. To ensure that the drone avoids entering the NFZ, we again require
which guarantees that at least one bounding plane remains active, keeping the trajectory outside the polygonal region.
This unified formulation enables consistent treatment of 3D obstacles such as buildings and 2D NFZs, enabling the scalable integration of environmental constraints, of KAUST buildings and NFZs, into trajectory planning.
4.4.7. Vehicle Collision Avoidance
We assume that there is a basic level of communication between the drones and that they share their intended trajectories, which correspond to their last generated prediction horizon. This intended trajectory is denoted as follows:
Let denote the position of drone i at time t, and let denote the intended trajectory of drone j at the same time. The following constraints ensure a minimum separation distance between the two drones along each axis using the Big-M method:
However, strict constraints may lead to infeasible solutions, which is undesirable. To address this, we introduce a slack variable, , to allow for a small violation of the constraint. This is acceptable since is chosen to be 3 m, significantly larger than the actual drone. The set constraints
are augmented with the slack variables, allowing for a small violation. Furthermore, we add
to the objective function to heavily penalize violations of the slack variables. We define as the penalty for violating the minimum separation distance constraint, set conservatively to 3 m.
5. Path Planner
Contingency planning is essential, especially given the projected growth in drone operations []. Even if future systems achieve safety levels comparable to those of commercial aviation [,], a fleet of 1.18 million commercial drones in the U.S. alone by 2029 [] would result in a non-negligible number of incidents. To support the safe operation of such a large-scale system, contingency-aware path planning must be employed to minimize the impact of inevitable failures.
Due to real-world limitations in the environment, it is not always possible to guarantee the availability of a viable contingency plan throughout the entire flight. Instead, our approach minimizes a cost function that accounts for the presence and accessibility of contingency options, such as proximity to safe landing zones and communication towers, along the planned route. These factors are treated as soft geometric constraints that guide the planner toward safer trajectories, without enforcing hard guarantees, since it is not always possible. In addition, standard airspace restrictions like NFZs and temporary flight restrictions (TFRs) are integrated to ensure regulatory compliance. Our work combines both preferred and restricted regions, along with static and dynamic airspace constraints, into a single unified planning framework.
5.1. Problem Setup
We formulate the drone path planning problem as a graph-based shortest path problem. The high-level overview of the method proceeds as follows: We first discretize the airspace by sampling the environment, making the nodes. Then, we construct the edges by connecting nodes, where these connections represent the potential flight paths. After that, we assign a cost to every edge based on the chosen metrics, distance, and risk. Finally, Dijkstra’s algorithm is applied to this weighted graph to compute the optimal path through the airspace [].
5.2. Geometric Constraints
To prioritize safety, we incorporate several geometric constraints into the planning process, including proximity to safe landing zones (shown in Figure 3), proximity to communication towers (shown in Figure 4), no-fly zones (NFZs, shown in Figure 3), and temporary flight restrictions (TFRs). These constraints are modeled as polygonal regions in the airspace. Most are static, such as safe landing, communication coverage, and NFZs. On the other hand, TFRs are time-dependent and may only be active during specific events, such as firefighting operations, VIP movement, or major sporting events. There are a few additional areas that may be considered as an NFZ or penalized, such as mountainous areas, areas with turbulent wind patterns, and high-rise buildings. These areas can be treated as NFZs described in our work. However, in our case study, which is KAUST community, these areas are not applicable due to KAUST being a flat area with no high-rise buildings.
5.2.1. Operational Altitude Constraints
In practice, most drone delivery operations are constrained to a planar altitude band, with vertical motion primarily relevant during takeoff and landing. High buildings are treated as obstacles to be circumnavigated, rather than flown over, since they often exceed the regulated operational altitude. This reflects current operational norms and ensures that our framework is aligned with real-world practices.
5.2.2. Trilateration Using Communication Towers
The authors of [,] talk about trilateration using communication towers or ground base stations as a fallback for GPS faults. They use received signal strength (RSS) as a way to localize the drone.
This approach has several underlying assumptions and limitations. We assume that the boundaries of all emergency landing areas, communication towers, and NFZs are known in advance and represented accurately. Wind and weather conditions, which can significantly impact drones’ performance and gliding ability, are not incorporated into the current model. The choice not to incorporate weather limits the planner’s reliability under unforeseen environmental conditions. In addition, risk and safety are encoded through discrete costs and weights in the cost function in Equation (21). This abstraction only implicitly addresses the nuanced or probabilistic aspects of risk exposure.
5.3. Sampling the Airspace and Connecting the Samples
We randomly but uniformly sample the airspace. These samples are separated by a minimum desired radius, which in our work was selected to be 70 m. Finer sampling will result in better results, however, at the cost of longer computational times. To construct the graph, each sampled node is connected to all other nodes within a maximum connection distance of 500 m. These edges form the candidate paths for route planning.
5.4. The Cost of the Connections
To compute the cost of each edge in the graph, we analyze how much of the edge lies within different geometric constraint regions. Initially, we measure the length of the connection within the baseline geometric constraint, which is the whole airspace, giving us simply the length of the edge. Similarly, we also measure the length that lies within the other geometric constraints, giving us the length of the portion of the edge within the geometric constraint. We repeat this process for all the geometric regions, such as safe landing areas, communication zones, NFZs, and TFRs. This process is illustrated in Figure 6. Doing so results in a separate graph for each of the geometric constraints.
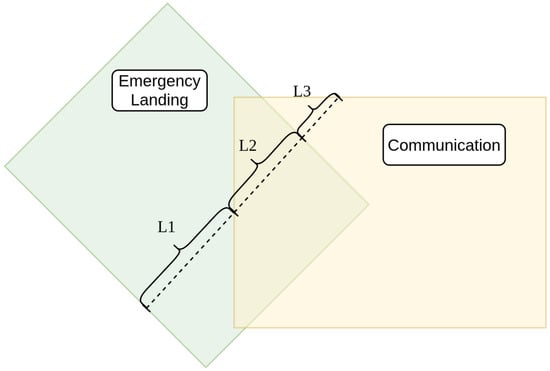
Figure 6.
Example of connection cost calculation. The baseline cost is the total length . This cost is reduced based on the portions of the connection within the emergency landing area, , and within communication proximity, .
5.5. Graph Fusion
We construct separate adjacency matrices for each region, where each matrix stores the length of each edge within that constraint region. The final cost matrix is a weighted combination of these individual matrices. We reward flying in proximity to the safe landing spots and communication towers by discounting the cost of the edge going through these areas, and significantly penalize flying through NFZs and TFRs by increasing the cost of the edges going through these areas.
We construct the graphs as adjacency matrices , and the reward or penalty for each of the geometrical constraints is . To calculate the adjacency graph , effectively fusing the individual adjacency graphs, we use
where the parameters are chosen to satisfy
where
- is normalized to 1 to measure the distance,
- to reward flying through these areas while ensuring the combined graph has no negative edges,
- and are set to very large values to heavily penalize restricted zones.
5.5.1. Tuning the Cost Function
The parameters and determine the degree to which distances are discounted when flying over safe landing areas or regions with good communication coverage. The values of directly control the behavior of the path planner. For instance, setting results in a planner that prioritizes the shortest distance, avoiding restricted areas but ignoring safety-enhancing features. Increasing or , subject to (22), increases the emphasis on flying through safer zones, potentially at the cost of longer paths. It is helpful to think of and as discount percentages whose sum must be less than one.
In this work, the weights were chosen heuristically to reflect the priorities of the KAUST case study. However, these hyperparameters can indeed be systematically adjusted to suit different operational environments or regulatory contexts. For example, higher values of are appropriate in densely populated areas, while becomes critical in BVLOS operations where continuous communication is mandated. Similarly, and can be directly tied to regulatory requirements, ensuring strict adherence to permanent and temporary restrictions.
5.5.2. Dynamic Updates
Since constraint relevance can change with environmental or flight area status updates, the framework supports real-time re-weighting. For example, when a TFR expires, setting in Equation (21) effectively removes the TFR from the planner. Similarly, increasing during high-risk conditions, such as strong winds, or in response to GPS jamming, encourages the planner toward routes that are safer or better connected. This cost structure makes the system adaptable to both static maps and dynamic airspace conditions. These updates are calculated online, and the updated plan is sent to the drone operator. Algorithm 1 integrates the components discussed in Section 5 and illustrates their interaction within the overall planning framework.
5.6. Key Limitations of the Path Planner
While the proposed pre-flight planner offers clear benefits for safety-aware routing, several important limitations remain. Its performance depends heavily on predesignated and accurate geospatial data, including emergency landing sites, building footprints, GSM tower locations, and NFZs/TFRs. Missing, outdated, or low-fidelity data can degrade routing effectiveness, as contingency proximity and communication-aware planning rely directly on these inputs. The planner also assumes a static environment, treating NFZs, TFRs, emergency sites, and GSM tower availability as fixed for the duration of a flight. Dynamic updates are instead handled as described in Section 5.5.2.
Additionally, the planner does not explicitly model ground risk or population exposure, relying instead on proxy measures. This simplification can lead to under- or over-estimation of the consequences of a forced landing in dynamic environments. Multi-actor coordination, strategic deconfliction, and congestion management are also absent, reducing applicability in high-density operations with multiple simultaneous flights. Finally, the framework uses heuristically chosen multi-objective weights and stylized failure models, limiting immediate transferability to other airframes or regulatory contexts without systematic tuning and hardware-specific calibration. These limitations highlight the need for future work on dynamic data integration, population-aware risk modeling, multi-actor deconfliction, systematic weight optimization, and richer failure-model characterization to enhance robustness and operational readiness.
| Algorithm 1 Geometrically constrained path planner. |
|
6. Experiment Setup
6.1. Simulation Setup
The simulation setup is composed of multiple interconnected components, as illustrated in Figure 1. The process begins with the Environment module, which is initialized with relevant spatial and regulatory data, including building geometries, delivery locations, emergency landing spots, and NFZs. Next, the Mission module generates a mission profile containing key parameters such as mission type, start time, and target waypoints. The Simulation Engine governs mission execution. It maintains the state and transition models of all drones and is responsible for simulating emergencies by injecting failure scenarios. A central part of this module is managing the Drone Controller Instances, which compute control inputs for each timestep. At the core of our system lies the Planner module, the primary focus of this work. It receives mission destinations and computes safe, feasible trajectories using the environment and mission parameters. Finally, the system logs all simulation data to enable visualization and performance analysis.
To study the performance of the path planner with increasingly stringent safety requirements, we focus our study on two operational modes: nominal conditions and emergency scenarios.
6.2. Nominal Operations
Nominal operations represent routine mission execution in a safety-aware environment. The planning framework incorporates considerations such as proximity to emergency landing sites and communication towers, enhancing operational safety while maintaining efficiency. These safety-oriented preferences are integrated into the path planning process, generating paths that are safe and efficient.
The simulation environment emulates the KAUST community, incorporating a diverse set of drone missions including food delivery, traffic monitoring, perimeter patrol, academic research, and recreational activities. The food delivery operations include 29 restaurants servicing 1981 residential homes and 102 student housing buildings, which collectively constitute the majority of simulated drone traffic. Food delivery requests are generated using a Poisson distribution. These missions constitute the mission profile, which is generated before the simulation. Each simulation runs for a fixed one-hour duration of simulated time and concludes when all active drones complete their missions.
Experiments
Performance is evaluated over a fixed mission profile while systematically varying the safety preference parameters and . For each configuration, the resulting flight distance and mission completion time are recorded. As there is no directly comparable work in the literature, we evaluate our approach by comparing each safety-aware configuration against a baseline scenario in which no preference is given to proximity-based safety criteria (), and only considers NFZs and TFR. These parameters are incorporated into the planner’s cost function, allowing the system to balance traditional performance metrics with spatial safety considerations. Table 1 summarizes the simulation parameters.

Table 1.
Planning and simulation parameters.
6.3. Emergency Scenarios
Performance is evaluated based on total flight distance and mission completion time, while safety is assessed by measuring the average proximity of drone trajectories to designated emergency landing areas and communication towers. The benefits of the proposed path planner become particularly evident during emergency scenarios, where drones must rely on pre-defined contingency plans. As discussed in Section 2, a variety of failure modes may occur, each triggering a corresponding contingency response. These contingency plans typically fall into one of the following categories:
- Immediate landing: the drone descends and lands at the nearest safe location.
- Rerouting: the drone deviates from its original path to avoid hazardous areas or system faults.
- Return to home (RTH): the drone navigates back to its launch point or a designated fallback location.
- Loitering or hover-and-wait: the drone holds position while awaiting further instructions or system recovery.
Among these contingency plans, only the immediate landing response imposes stringent spatial requirements, as it depends on proximity to predefined emergency landing sites. Additionally, the GPS fallback scenario, where drones must navigate safely despite a degraded or lost GPS signal, introduces another operational constraint. To evaluate the impact of safety-aware planning, we focus on both the immediate landing and GPS fallback scenarios. During the simulation, nominal operations proceed as described in Section 6.2, until the simulation engine module randomly injects an emergency scenario requiring the drones to execute one of the contingency plans. We compare outcomes across varying safety preference configurations of and , as well as a baseline configuration with no safety preferences. This comparison highlights how different planning strategies affect both mission performance and emergency preparedness.
7. Simulation Results
7.1. Nominal Operations
We evaluate nominal operations using the traffic profile described in Section 6.2. To investigate the impact of safety-awareness on path planning, we vary the weighting parameters and in the cost function, which is defined as
to quantify how different levels of emphasis on safety and communication affect the resulting path planning.
7.1.1. Emergency Landing
We begin by evaluating the performance of the emergency landing-aware path planner under nominal operating conditions. Table 2 summarizes the parameter settings used across the experiments described in Section 6.2.

Table 2.
Parameter settings for nominal operation experiments.
Figure 7 shows the results of Experiment 5, which places the most emphasis on safety among the five experiments.
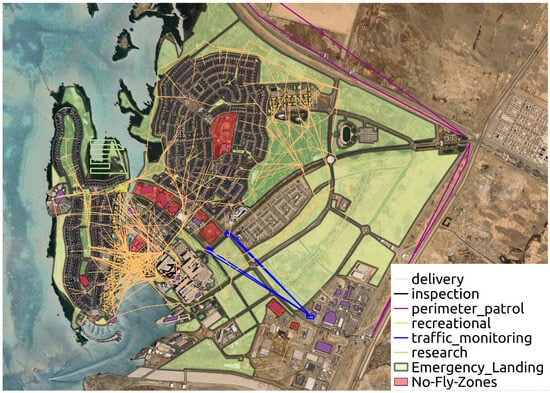
Figure 7.
Experiment 5: simulated trajectories for all missions under high safety weight ().
As the value of increases, the planner favors paths that remain closer to emergency landing zones. This leads to modest increases in total path length and mission duration, as shown in Figure 8, but it significantly improves the portion of the trajectory that lies within designated safe regions, as shown in Figure 9. The results illustrate that incorporating safety metrics into the cost function yields measurable benefits in operational safety while maintaining acceptable performance levels.
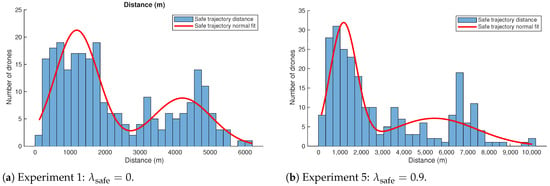
Figure 8.
Distribution of trajectory distances across drones under different safety-awareness settings. Each histogram shows the number of drones whose total trajectory length falls within a given distance bin. The distributions exhibit bimodal behavior, likely due to clustering of source-destination pairs.

Figure 9.
Comparison of per-drone trajectory composition across safety-awareness configurations. Each bar represents the total distance traveled by a drone, divided into safe segments near emergency landing areas (orange) and segments lacking nearby contingency options (blue). Note that the y-axis scale differs between the subplots.
7.1.2. GPS Fallback via Communication Towers
We next examined the planner’s ability to improve GPS failure resilience by prioritizing proximity to communication towers, which can support signal-based trilateration as a fallback localization strategy. These experiments were conducted under nominal operating conditions to evaluate how increasing the communication weight influences trajectory selection and improves the availability of alternative localization sources, which is illustrated in Figure 10 and Figure 11. Similar to the emergency landing experiments, we evaluated the performance of the trilateration-enabled path planner. Table 3 summarizes the experiments.
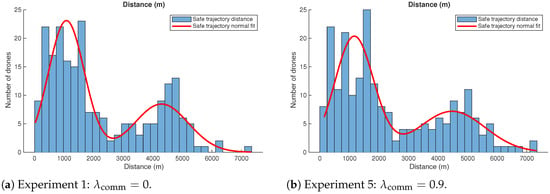
Figure 10.
Distribution of total trajectory distances across drones for two trilateration-enabled configurations. The bimodal patterns suggest that certain source-destination pairs are more frequent, contributing to distance clustering. The first mode of the bimodal distribution remains mostly unchanged, while the second mode shifts toward longer distances. This shift occurs because most drones heading to the clustered destination corresponding to the second mode must take a longer path.

Figure 11.
Comparison of individual drone trajectory compositions under different levels of trilateration-enabled planning. Each bar represents the total distance traveled by a single drone, segmented into portions within the coverage range of at least three communication towers (blue) and portions outside that coverage (orange).

Table 3.
Parameter configurations for experiments analyzing the impact of trilateration-enabled planning under GPS-related signal degradation. The communication weight is varied across experiments, while all other parameters remain fixed.
7.2. Emergency Scenarios
7.2.1. Effect of Emergency Landing-Aware Planning
The same range of safety weights is used as in the nominal case shown in Table 2. We compare the safety metrics over the aforementioned experiments, and measure the average total length of the trajectories, and the portion of the trajectory that falls within proximity of emergency landing areas.
The results in Table 4, represented by Figure 12a, show a consistent improvement in safety coverage as increases. Specifically, the distance traveled within safe regions increases by more than 628.5% between Experiment 1 and Experiment 5, indicating that the drone spends over six times the distance within proximity of emergency landing areas. In return, the increase in total trajectory length remains a relatively modest 31.1%. Figure 12b, plotting time instead of distance, shows nearly identical results. Table 5, represented by Figure 13a, further highlights this trend by showing that the percentage of the trajectory within proximity of emergency landing areas grows from only 10.7% at baseline to 59.2% at the highest weighting. Similarly, Figure 13b shows nearly identical results.

Table 4.
Trajectory length and safe distance under varying values of the safety-awareness weight . Values are reported as means (95% CI). Percentage improvements are measured relative to the baseline ().
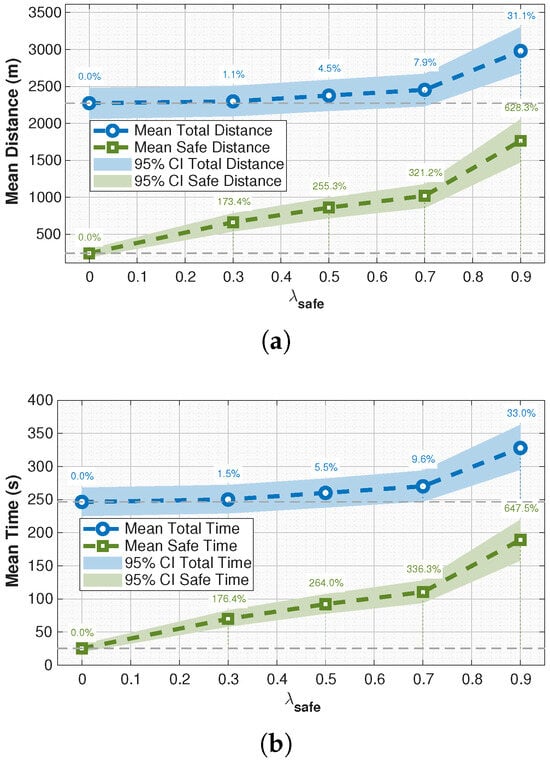
Figure 12.
Comparison of safety metrics across experiments. (a) Total vs. safe trajectory portions, with percentage improvement over baseline Experiment 1. (b) Total vs. safe trajectory times, with percentage improvement over baseline Experiment 1.

Table 5.
Percentage of trajectory length within proximity of emergency landing areas under varying safety weightings . Values are reported as mean and 95% CI. Difference is measured relative to the baseline ().
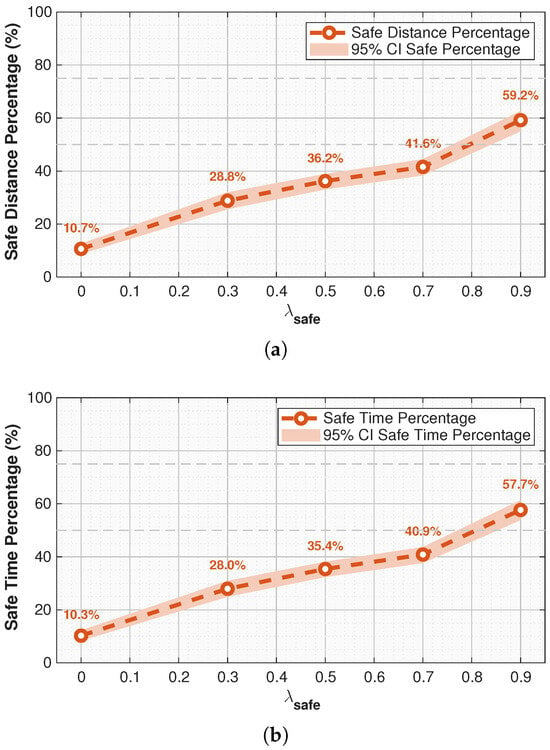
Figure 13.
Stacked comparison of trajectories within emergency landing areas across experiments. (a) Percentage of each trajectory’s total length that falls within designated emergency landing areas across different experiments. (b) Percentage of each trajectory’s total time that falls within designated emergency landing areas across different experiments.
7.2.2. Effect of Trilateration-Enabled Planning
To evaluate the effect of trilateration-enabled trajectory planning, we varied the communication weighting parameter from 0 to 0.9. Table 6, represented by Figure 14a, presents the absolute trajectory lengths for three categories: total path length, segments within range of at least three communication towers, and segments outside of that range. As increased, the mean total trajectory length increased from 2318.99 m to 2451.80 m. The portion of each trajectory within range of at least three communication towers increased from 1836.29 m to 2208.37 m, while the segment outside of coverage decreased from 482.70 m to 243.43 m. Figure 14b, showing the time spent within range of at least three towers, exhibits the same behavior.

Table 6.
Trajectory length and communication coverage under varying values of the communication-awareness weight . Values are reported as means (95% CI). Percentage improvements are measured relative to the baseline ().
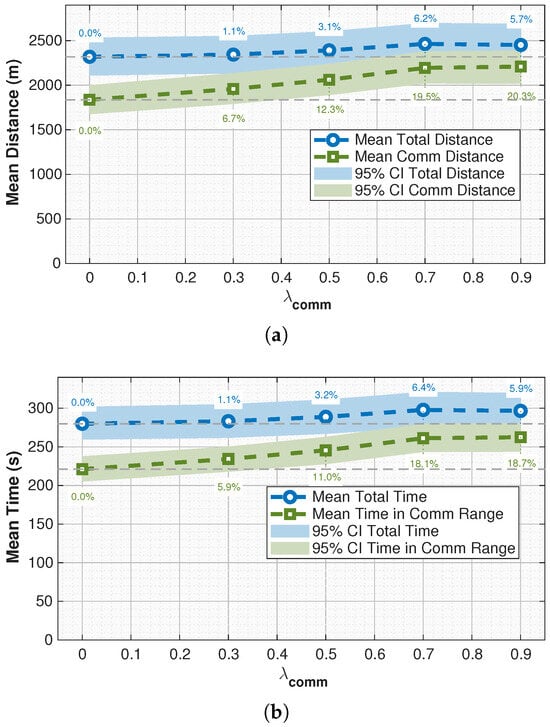
Figure 14.
Comparison of trilateration-enabled path planning metrics across varying values of . (a) Total trajectory length, and segment within range of at least three communication towers. Percentage improvements relative to the baseline (Experiment 1, ) are annotated. (b) Total trajectory time, and time within range of at least three communication towers. Percentage improvements relative to the baseline (Experiment 1, ) are annotated.
Table 7, represented by Figure 15a, further quantifies these improvements, showing that the percentage of the trajectory within range of at least three communication towers increases steadily from 79.2% at the baseline to 90.1% at . Figure 15b, showing time instead of distance, follows the same trend.

Table 7.
Percentage of trajectory length within range of at least three communication towers under varying communication-awareness weightings . Values are reported as mean and 95% CI. Difference is measured relative to the baseline ().
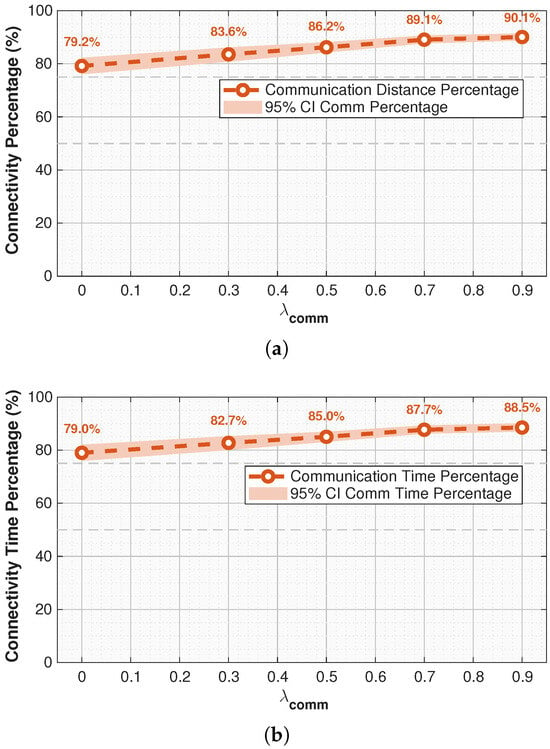
Figure 15.
Comparison of trajectory coverage within range of at least three communication towers for varying communication weightings . (a) Average percentage of each trajectory’s total length that remains within range of at least three communication towers across experiments with increasing . (b) Average percentage of each trajectory’s total time that remains within range of at least three communication towers across experiments with increasing .
These trends indicate that a higher weighting of communication coverage encourages path planning through regions with a denser communication infrastructure, with a consistent reduction in exposure to low-connectivity areas.
8. Discussion
8.1. Impact of Safety Weighting on Trajectory Behavior
To evaluate the effect of increasing the safety parameter , we analyze both the absolute and relative portions of each trajectory that fall within designated emergency landing areas. Figure 12a presents the raw distances covered in different regions, while Figure 13a shows the percentage of each trajectory that lies within safe landing zones.
As increases from 0 to 0.9, the mean total path length grows from approximately 2273.85 m to 2980.07 m. This increase reflects a trade-off in performance: longer trajectories are accepted in order to maintain safer routing. The distance traveled inside safe landing zones increases steadily, from 242.22 m at to 1764.01 m at , indicating a shift away from unsafe regions. The remaining trajectory length, outside both safe and unsafe areas, decreases consistently, dropping from 2030.78 m to 1216.06 m, as the planner deliberately shifts paths into safer corridors.
In relative terms, shown in Figure 13a, the percentage of each trajectory within safe zones increases from 10.7% at to 59.2% at . The most significant improvements are observed in the higher range: setting increases the coverage by more than 15% of the safe coverage compared to to 59.2%. achieves a clear majority of the trajectory within safe areas.
These results confirm the value of the safety weighting mechanism as a tunable parameter. Lower values of result in more direct and shorter routes, while higher values prioritize safety, guiding the drone closer to emergency landing zones. This provides flexibility in adapting flight plans to mission priorities, regulatory needs, or current environmental risk conditions.
These findings demonstrate the practical role of as a tunable mechanism for balancing efficiency and safety. Lower values produce direct, time-efficient paths but with limited contingency coverage, while higher values generate more conservative routes that align with regulatory expectations for emergency preparedness. This flexibility allows operators to adjust planning according to mission type, urban density, or regulatory requirements, such as prioritizing safety in densely populated areas. Unlike prior contingency planners for fixed-wing UAVs that generate fallback routes from a nominal trajectory [], our framework embeds safety considerations into the primary trajectory itself, ensuring that emergency landing proximity is proactively integrated, rather than being an afterthought. This closes a key gap for rotary-wing UAV operations in dense urban environments.
8.2. Effect of Trilateration-Enabled Planning
In addition to safety-aware routing, we examine the influence of trilateration-enabled planning by varying the communication weight from 0 to 0.9. The objective is to maintain better proximity to communication towers, thereby reducing the likelihood of losing the control or telemetry link, and enabling fallback positioning strategies such as signal trilateration in case of GPS disruption.
The results demonstrate clear benefits. With , drones spent an average of 1836.29.5 m of their flight within communication coverage, and 482.70 m outside coverage. As increased to 0.9, the in-range distance improved to 2208.37 m, while the out-of-coverage segment was reduced to 243.43 m. This shift confirms that incorporating communication tower proximity into the planner successfully steers trajectories toward better-connected airspace.
In relative terms, the proportion of the trajectory within acceptable coverage rose from 79.2% to over 90% across the tested range of . These gains are particularly relevant in urban UAV operations, where continuous command-and-control links are mandated by regulators, and communication availability provides an essential safeguard against GPS denial events.
These findings highlight the role of as a tunable resilience parameter. Low values prioritize efficiency, while higher values proactively shape trajectories into better-connected regions of the airspace. This ensures that drones remain within fallback localization zones and comply with operational safety requirements. Unlike existing mission planners that primarily focus on obstacle or NFZ avoidance [], our approach integrates communication availability directly into the trajectory optimization process, providing a systematic method for enhancing robustness against both link loss and GPS interference. In practice, this complements the safety weighting mechanism: the two parameters together allow operators to balance efficiency, contingency landing access, and communication resilience according to mission priorities and regulatory contexts.
9. Conclusions
This work has presented a centralized, safety-aware pre-flight path planning framework designed to enhance the safety of UAV operations in urban environments. By integrating environmental awareness into the planning process, the proposed system proactively accounts for emergency landing contingency, GPS signal loss, and communication link degradation, three critical failure modes that can severely impact UAV safety. We demonstrated how proximity to designated emergency landing zones and communication infrastructure can be optimized through tunable cost parameters, allowing operators to balance safety and efficiency, depending on mission needs.
Extensive simulations using real-world geographic data from the KAUST community showed that increasing safety and communication weights in the planning objective leads to significantly safer trajectories where drones are guided closer to emergency landing areas and maintain stronger communication coverage while incurring only modest increases in total flight distance and computation time. The paper also provides a set of operational metrics, including safe recovery probability and communication availability, that quantify these trade-offs and support informed weight selection for different mission profiles. These findings validate the benefit of leveraging a priori environmental knowledge for anticipatory risk mitigation.
The contributions listed above (planner, communication-aware objective, geospatial integration, scalable simulator, and quantitative evaluation) together provide a practical methodology that is directly applicable to campus- and city-scale pre-flight planning and that supports regulator-oriented safety arguments.
Future work will address several current limitations of the framework. At present, the planner does not incorporate population density, ground traffic, or wind conditions, all of which are important for risk-aware urban operations. The approach also assumes static environmental data (NFZs, TFRs, emergency landing sites, and GSM towers), whereas in practice, these can change dynamically and would require hybrid pre-flight/in-flight updates. Strategic deconfliction and congestion management across multiple vehicles are not yet included, limiting applicability to higher-density airspaces. Furthermore, the use of predesignated emergency landing areas and simplified 3D building models introduces dependencies on the quality of available geospatial data. Finally, weight selection in the multi-objective cost remains heuristic, and the simulator’s failure models are stylized, rather than hardware-specific. Addressing these gaps through dynamic data integration, population, and weather-aware modeling, congestion management strategies, systematic weight tuning, and real-world flight validation will further improve the robustness and generalizability of the proposed framework.
Author Contributions
Conceptualization, A.A. (Amin Almozel); methodology, A.A. (Amin Almozel) and A.A. (Ania Adil); software, A.A. (Amin Almozel); validation, A.A. (Amin Almozel) and A.A. (Ania Adil); formal analysis, A.A. (Amin Almozel); investigation, A.A. (Amin Almozel); resources, E.F.; data curation, A.A. (Amin Almozel); writing—original draft preparation, A.A. (Amin Almozel) and A.A. (Ania Adil); writing—review and editing, A.A. (Amin Almozel), A.A. (Ania Adil), and E.F.; visualization, A.A. (Amin Almozel); supervision, A.A. (Ania Adil) and E.F.; project administration, A.A. (Ania Adil) and E.F.; funding acquisition, E.F. All authors have read and agreed to the published version of the manuscript.
Funding
This research was funded by King Abdullah University of Science and Technology (KAUST) with the Base Research Fund (BAS/1/1682-01-01).
Data Availability Statement
The code and datasets generated and analyzed during the current study are openly available through Zenodo at https://doi.org/10.5281/zenodo.16994331.
Acknowledgments
The authors would like to thank Christian Cloiseau, product development manager at Thales, for his continued support, professional guidance, and valuable insights throughout the course of this project. We also thank the KAUST Security team and the Campus and Community team for providing input on regular operations and supplying relevant data.
Conflicts of Interest
The authors declare no conflicts of interest.
Appendix A
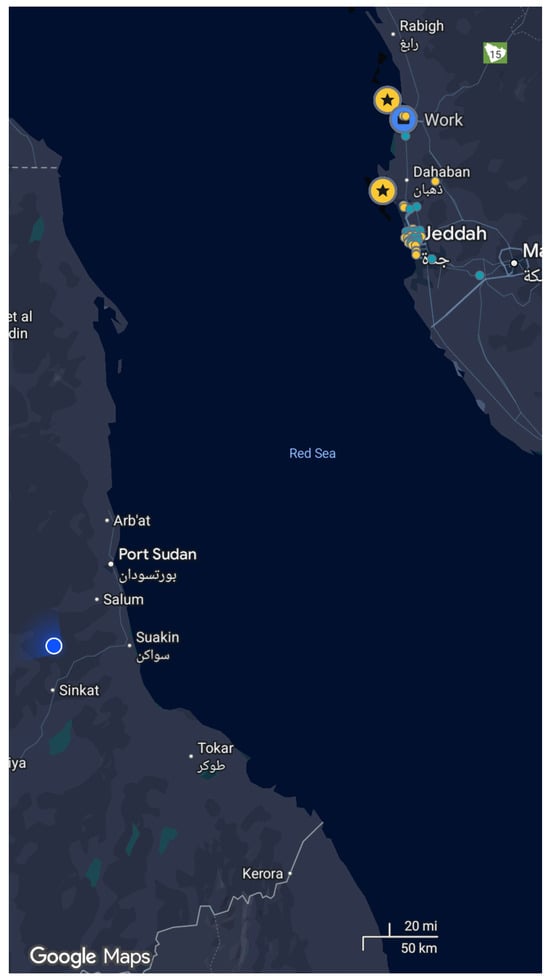
Figure A1.
A picture of the navigation app showing the GPS location in Sudan, while the actual location is in Jeddah, KSA.
References
- Jenkins, D.; Vasigh, B.; Oster, C.; Larsen, T. Forecast of the Commercial UAS Package Delivery Market; Embry-Riddle Aeronautical University: Daytona Beach, FL, USA, 2017. [Google Scholar]
- Federal Aviation Administration, Office of Aviation Policy and Plans (APO-100). FAA Aerospace Forecast: Fiscal Years 2025–2045; Technical Report; U.S. Department of Transportation, Federal Aviation Administration: Washington, DC, USA, 2025.
- Breunig, J.; Forman, J.; Sayed, S.; Audenaerd, L.; Branch, A.; Hadjimichael, M. Modeling Risk-Based Approach for Small Unmanned Aircraft Systems; Technical Report NASA/TP–2018–219858; NASA Technical Publication; NASA Ames Research Center: Moffett Field, CA, USA, 2018.
- Farajijalal, M.; Eslamiat, H.; Avineni, V.; Hettel, E.; Lindsay, C. Safety Systems for Emergency Landing of Civilian Unmanned Aerial Vehicles (UAVs)—A Comprehensive Review. Drones 2025, 9, 141. [Google Scholar] [CrossRef]
- Jung, J.; Nag, S. Automated Management of Small Unmanned Aircraft System Communications and Navigation Contingency. In Proceedings of the AIAA Scitech 2020 Forum, Orlando, FL, USA, 6–10 January 2020; p. 2195. [Google Scholar]
- Balamurugan, G.; Valarmathi, J.; Naidu, V. Survey on UAV Navigation in GPS Denied Environments. In Proceedings of the 2016 International Conference on Signal Processing, Communication, Power and Embedded System (SCOPES), Paralakhemundi, India, 3–5 October 2016; IEEE: New York, NY, USA, 2016; pp. 198–204. [Google Scholar]
- Tegler, E. GPS Spoofing in the Middle East Is Now Capturing Avionics. Available online: https://www.forbes.com/sites/erictegler/2023/12/05/gps-spoofing-in-the-middle-east-is-now-capturing-avionics/ (accessed on 17 July 2025).
- Lum, C.; Waggoner, B. A Risk Based Paradigm and Model for Unmanned Aerial Systems in the National Airspace. In Proceedings of the Infotech@Aerospace 2011, St. Louis, MI, USA, 29–31 March 2011; AIAA 2011-1424. American Institute of Aeronautics and Astronautics: Reston, VA, USA, 2011; pp. 1–31. [Google Scholar] [CrossRef]
- Civil Aviation Safety Authority (CASA). Recognising, Mitigating and Adapting to GNSS Interference During Flight. Available online: https://www.casa.gov.au/operations-safety-and-travel/aviation-safety-and-security-pilots/recognising-mitigating-and-adapting-gnss-interference-jamming-or-spoofing (accessed on 29 July 2025).
- Federal Aviation Administration (FAA). Concept of Operations v2.0: Unmanned Aircraft System Traffic Management (UTM). Available online: https://www.faa.gov/researchdevelopment/trafficmanagement/utm-concept-operations-version-20-utm-conops-v20 (accessed on 26 August 2025).
- European Union Aviation Safety Agency (EASA). Easy Access Rules for Unmanned Aircraft Systems. Consolidated Version of Regulation (EU) 2019/947 and 2019/945 with AMC and GM. 2022. Available online: https://www.easa.europa.eu/en/downloads/110913/en (accessed on 26 August 2025).
- Zipline. Zipline Drone Delivery and Logistics. Available online: https://www.zipline.com/ (accessed on 20 August 2025).
- Wing. Wing Drone Delivery. The Future of Delivery Is Here. Available online: https://wing.com/ (accessed on 20 August 2025).
- Meituan. Meituan—We Help People Eat Better, Live Better. Available online: https://www.meituan.com/en-US/about-us (accessed on 20 August 2025).
- UPS Flight Forward. UPS Flight Forward Adds New Aircraft. Available online: https://about.ups.com/us/en/newsroom/press-releases/innovation-driven/ups-flight-forward-adds-new-aircraft.html (accessed on 20 August 2025).
- Zipline. Walmart and Zipline Team up to Bring First-of-Its Kind Drone Delivery Service to the United States. Available online: https://corporate.walmart.com/news/2020/09/14/walmart-and-zipline-team-up-to-bring-first-of-its-kind-drone-delivery-service-to-the-united-states (accessed on 20 August 2025).
- Meituan. Meituan Secures China’s First Nationwide Drone Delivery License. Available online: https://technode.com/2025/04/23/meituan-secures-chinas-first-nationwide-drone-delivery-license-ramping-up-competition-with-google-wing/ (accessed on 20 August 2025).
- Lieb, J.; Volkert, A. Unmanned Aircraft Systems Traffic Management: A Comparison on the FAA UTM and the European CORUS ConOps Based on U-Space. In Proceedings of the 2020 AIAA/IEEE 39th Digital Avionics Systems Conference (DASC), Virtual, 11–15 October 2020; IEEE: New York, NY, USA, 2020; pp. 1–6. [Google Scholar]
- Weibel, R.; Hansman, R.J. Safety Considerations for Operation of Different Classes of UAVs in the NAS. In Proceedings of the AIAA 4th Aviation Technology, Integration and Operations (ATIO) Forum, Chicago, IL, USA, 20–22 September 2004; p. 6244. [Google Scholar]
- Clothier, R.A.; Walker, R.A. Safety Risk Management of Unmanned Aircraft Systems. In Handbook of Unmanned Aerial Vehicles; Springer: Berlin/Heidelberg, Germany, 2015; pp. 2229–2275. [Google Scholar]
- Ayhan, B.; Kwan, C.; Budavari, B.; Larkin, J.; Gribben, D. Preflight Contingency Planning Approach for Fixed-Wing UAVs with Engine Failure in the Presence of Winds. Sensors 2019, 19, 227. [Google Scholar] [CrossRef]
- Lin, C.E.; Shao, P.C. Failure Analysis for an Unmanned Aerial Vehicle Using Safe Path Planning. J. Aerosp. Inf. Syst. 2020, 17, 358–369. [Google Scholar] [CrossRef]
- Bobick, J.C.; Bryson, A.E., Jr. Improved Navigation by Combining VOR/DME Information with Air or Inertial Data; Technical Report STAN-M-72-31; Stanford University: Stanford, CA, USA, 1972. [Google Scholar]
- Sulieman, M.H.; Liu, M.; Gursoy, M.C.; Kong, F. Path Planning for UAVs Under GPS Permanent Faults. ACM Trans. Cyber-Phys. Syst. 2025, 8, 31. [Google Scholar] [CrossRef]
- Almozel, A.; Feron, E.M.; Saber, S.I.; Cloiseau, C.; Vanderventer, K. Safe Trajectory Planning for Safety Critical Drone Delivery. In Proceedings of the AIAA AVIATION 2023 Forum, San Diego, CA, USA, 12–16 June 2023; p. 3547. [Google Scholar]
- Hamissi, A.; Dhraief, A. A Survey on the Unmanned Aircraft System Traffic Management. ACM Comput. Surv. 2023, 56, 68. [Google Scholar] [CrossRef]
- Johansen, K.; Dunne, A.F.; Tu, Y.H.; Almashharawi, S.; Jones, B.H.; McCabe, M.F. Dye tracing and concentration mapping in coastal waters using unmanned aerial vehicles. Sci. Rep. 2022, 12, 1141. [Google Scholar] [CrossRef] [PubMed]
- Benarbia, T.; Kyamakya, K. A Literature Review of Drone-Based Package Delivery Logistics Systems and Their Implementation Feasibility. Sustainability 2021, 14, 360. [Google Scholar] [CrossRef]
- Holkar, K.S.; Waghmare, L.M. An Overview of Model Predictive Control. Int. J. Control Autom. 2010, 3, 47–63. [Google Scholar]
- Boyd, S.P.; Vandenberghe, L. Convex Optimization; Cambridge University Press: Cambridge, UK, 2004. [Google Scholar]
- Zhu, W. Getting a Drone to Deliver Your Coffee at the Great Wall! China Daily. 2025. Available online: https://www.chinadaily.com.cn/a/202503/24/WS67e0b04fa310c240449dc6c9.html (accessed on 20 August 2025).
- QGroundControl. QGroundControl: Ground Control Station for MAVLink Protocol. Available online: https://qgroundcontrol.com/ (accessed on 25 August 2025).
- SPH Engineering. UgCS: Flight Planning and Control Software. Available online: https://www.sphengineering.com/flight-planning/ugcs (accessed on 25 August 2025).
- ArduPilot Development Team. Mission Planner: Ground Control Station. Available online: https://ardupilot.org/planner/ (accessed on 25 August 2025).
- Schouwenaars, T.; How, J.; Feron, E. Receding Horizon Path Planning with Implicit Safety Guarantees. In Proceedings of the 2004 American Control Conference, Boston, MA, USA, 30 June–2 July 2004; IEEE: New York, NY, USA, 2004; Volume 6, pp. 5576–5581. [Google Scholar]
- Bondy, J.A.; Murty, U.S.R. Graph Theory with Applications; Macmillan: London, UK, 1976; Volume 290. [Google Scholar]
- Bridson, R. Fast Poisson Disk Sampling in Arbitrary Dimensions. In Proceedings of the SIGGRAPH07: Special Interest Group on Computer Graphics and Interactive Techniques Conference, San Diego, CA, USA, 5–9 August 2007; Volume 10, p. 1. [Google Scholar]
Disclaimer/Publisher’s Note: The statements, opinions and data contained in all publications are solely those of the individual author(s) and contributor(s) and not of MDPI and/or the editor(s). MDPI and/or the editor(s) disclaim responsibility for any injury to people or property resulting from any ideas, methods, instructions or products referred to in the content. |
© 2025 by the authors. Licensee MDPI, Basel, Switzerland. This article is an open access article distributed under the terms and conditions of the Creative Commons Attribution (CC BY) license (https://creativecommons.org/licenses/by/4.0/).