Highlights
What are the main findings?
- A complete UAV-mounted, non-invasive rodent-repellent concept is presented and prototyped: an eight-transducer spherical-cap ultrasonic loudspeaker array (20–70 kHz) with a custom PCB (signal generation + power amplification) for driving multiple ultrasonic transducers.
- The system is validated end-to-end using optimized coverage flight paths computed via a genetic algorithm and quantitative performance feedback enabled by AI-based rodent detection using a thermal camera, with experiments conducted in both laboratory and real field conditions.
What are the implications of the main findings?
- The work supports the feasibility of a more sustainable, chemical-free approach to crop protection by combining drones and ultrasound with optimized coverage planning, potentially improving efficiency compared with static deterrents.
- The field trials clarify what already works and what still blocks deployment, providing a practical roadmap for future iterations (e.g., improving real-world effectiveness and robustness) to move from a research prototype toward a deployable product.
Abstract
Unmanned aerial vehicles open new possibilities for developing technologies that support more sustainable and efficient agriculture. This paper presents a non-invasive method for repelling rodents from crop fields using ultrasound. The proposed system is implemented as a spherical-cap ultrasound loudspeaker array consisting of eight transducers, mounted on a drone that overflies the field while emitting sound in the 20–70 kHz range. The hardware design includes both the loudspeaker array and a custom printed circuit board hosting power amplifiers and a signal generator tailored to drive multiple ultrasonic transducers. In parallel, a genetic algorithm is used to compute flight paths that maximize coverage and increase the probability of driving rodents away from the protected area. As part of the validation phase, artificial intelligence models for rodent detection using a thermal camera are developed to provide quantitative feedback on system performance. The complete prototype is evaluated through a series of experiments conducted both in controlled laboratory conditions and in the field. Field trials highlight which parts of the concept are already effective and identify open challenges that need to be addressed in future work to move from a research prototype toward a deployable product.
1. Introduction
Rodent pest infestations represent one of the most persistent and economically significant challenges facing modern agriculture worldwide. Under traditional rice systems, rodent damage is often chronic at ~5–10% annually, while outbreak conditions in some cereal systems have been associated with losses up to ~48%, depending on crop, region, and management [1,2]. Rodents impose substantial agricultural losses in both standing crops and stored commodities, with reported damage ranging from a few percent to >30%, and in severe situations even approaching near-total crop loss [3]. Beyond direct consumption of crops, rodents compromise agricultural productivity through root damage, soil contamination, disease transmission, and reduction in overall crop quality [3].
Traditional approaches to rodent pest management have relied predominantly on chemical rodenticides, which, despite their efficacy in reducing rodent populations, present substantial environmental and ecological concerns [4,5]. The widespread application of chemical pesticides has been identified as a major contributor to biodiversity loss, with documented negative effects on over 800 non-target species including beneficial insects, soil microorganisms, birds, and mammals [6]. Pesticide drift can transport chemicals over hundreds or even thousands of kilometers, exposing unintended ecosystems to contamination and disrupting ecological balances that are fundamental to sustainable agricultural production [7,8]. Furthermore, the persistent nature of many pesticides in soil and water systems poses long-term threats to ecosystem integrity, while the development of pesticide resistance among target species diminishes the long-term effectiveness of chemical control strategies [9].
With the growing demand for sustainable agricultural practices, researchers have increasingly focused on developing non-chemical pest deterrence methods within Integrated Pest Management (IPM) frameworks [10,11]. Recent reviews describe IPM as an ecosystem-based strategy that combines multiple techniques, while reserving chemical interventions as a last resort [12]. Among emerging technologies, ultrasound-based deterrence systems have attracted attention due to their potential to create acoustic environments aversive to rodent pests without relying on toxic substances [13,14].
Research has demonstrated that different rodent species possess distinctly different hearing frequency ranges [15,16]. Feral house mice hear between 2.3 kHz to 96 kHz with peak sensitivity around 16 kHz, cotton rats between 1 kHz to 72 kHz, and kangaroo rats between 50 Hz to 62 kHz [17]. Laboratory mice demonstrated significantly reduced hearing sensitivity compared to wild and feral mice [15]. Small-headed rodent species rely more heavily on high-frequency hearing for localization, revealing a trade-off between high-frequency and low-frequency sensitivity [18]. These findings suggest that ultrasonic signals in the 20–80 kHz range may be efficacious in producing aversive behavioral responses in target rodent species, since these frequencies fall within the ranges where rodents demonstrate substantial auditory sensitivity. Ultrasound can affect rodents but not humans primarily because of species differences in hearing range and sensitivity. Human hearing is typically limited to frequencies below about 20 kHz, and sensitivity at the upper end generally decreases with age [19].
Recent advances in unmanned aerial vehicle (UAV) technology have opened new possibilities for precision agriculture, including targeted pest management applications [20,21,22]. Comprehensive reviews of UAV applications in agriculture have documented their use across diverse operations including crop health monitoring, pest and disease management, precision spraying, and field mapping [23,24]. The integration of ultrasonic emission systems onto mobile drone platforms presents a novel approach. That may address limitations of stationary ultrasonic devices by providing dynamic acoustic coverage and reducing habituation potential through varied exposure patterns [14,25].
A drone-based ultrasonic deterrence method is proposed in this paper for repelling rodents from agricultural fields using a loudspeaker array carried by an unmanned aerial vehicle flying above the crop area. The system is built around a compact spherical-cap loudspeaker array comprising eight ultrasonic transducers that emit high-frequency sound in the 20–70 kHz range, i.e., within the auditory sensitivity band of common rodent pests. This research is a result of the RODENT (Rodent Obstruction through Drone-Enabled Non-invasive Technology) project, developed within the ICAERUS Pull-2 Open Call, which addresses the broader challenge of integrating emerging drone technologies into sustainable agriculture [26,27,28]. As an alternative to conventional chemical- or trap-based control methods, the RODENT concept relies on a drone-mounted ultrasound deterrence system designed to prevent rodents from entering target plots without the use of toxic substances or mechanical killing devices; it does so by emitting high-frequency signals that create an uncomfortable acoustic environment for mice and other small pests while the drone overflies the field. The system aims to provide efficient coverage of large agricultural areas with minimal labor input and negligible disturbance to the soil surface and crop structure.
This paper is structured into three major phases. The first phase encompasses the design phase, during which individual system components are engineered and optimized. This includes the design of the ultrasonic loudspeaker array and the design and fabrication of the printed circuit board (PCB) hosting the power amplifiers and signal generator, as well as the development of an algorithm for computing an optimal drone flight path that maximizes rodent deterrence over the field. The second phase comprises the testing phase, where the characteristics of the designed components are evaluated, including measurements of the sound pressure level from the loudspeaker array in controlled conditions and field testing of the drone flight along mathematically calculated flight paths. The final phase represents the validation phase, which demonstrates system effectiveness through diverse field measurements and development of machine learning algorithms for rodent detection using thermal imaging [29,30]. The concluding section synthesizes the primary contributions of this paper and discusses implications for future deployment of ultrasonic drone-based rodent deterrence systems in agricultural environments.
2. Design Phase
The first phase of this paper involves the design of all components of the system for non-invasive rodent repulsion in agricultural fields. The design of the loudspeaker array and the analysis of the employed ultrasound transducers represent the initial step in developing the overall system architecture. Following the analysis of the rodents’ audible frequency range, it is necessary to define and design the signal generator and power amplifiers for the loudspeakers. All circuits must be integrated on a PCB that is sufficiently compact and efficient for the proposed system. Since the ultrasound repulsion system is intended to be carried by a drone, it is essential to design and implement a mechanical structure that can efficiently accommodate all system components. Furthermore, special attention has been devoted to defining the drone’s flight path above the field in order to maximize the overall efficiency of the rodent repulsion system.
2.1. Design of Loudspeaker Array
The concept of this study is based on a drone-mounted system that emits ultrasound waves and operates at an altitude of 1 m above the ground, which represents the minimum distance that ensures safe drone operation. The conceptual representation of this system is shown in Figure 1a, which will be explained in more detail later in the text after the introduction of the basic concepts. The idea of this work involves a drone-mounted system that emits ultrasound and acts on rodents within the area beneath the platform. As the drone overflies the field, the ultrasonic emission contributes to driving mice out of the protected zone. To enable implementation of the complete system, the individual subsystems that constitute it were analyzed.
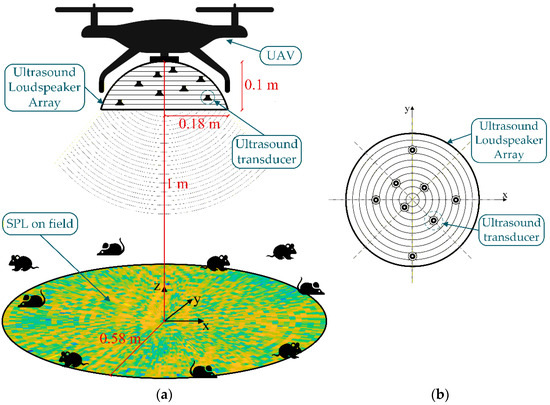
Figure 1.
(a) Conceptual illustration of a rodent-repellent system using a drone carrying an ultrasound loudspeaker array. (b) Arrangement of the loudspeakers on the spherical cap viewed toward the xy-plane.
Due to strong frequency-dependent attenuation in air, ultrasonic waves decay rapidly with distance, limiting the effective coverage of a single ultrasonic emitter [31]. In earlier research, the properties of different ultrasonic speakers were evaluated across multiple frequency bands [32] and affordable ultrasonic speakers were selected, with their specifications described in [33]. The attenuation of the sound pressure level of a single ultrasound transducer with increasing distance at 50 kHz is shown in red in Figure 2. This attenuation with increasing distance was measured under anechoic conditions using the same ultrasound driver that is integrated into the loudspeaker array. At this frequency, the level decreases by 19 dB with an increase of 80 cm distance, which represents a substantial reduction and leads to an insufficient sound pressure level on the surface below the transducer. For this reason, a loudspeaker array carried by the drone was introduced in order to provide a wider coverage area beneath the drone with an adequate sound pressure level. The attenuation of the sound pressure level of the designed loudspeaker array with increasing distance at 50 kHz is shown in green in Figure 2. The same excitation signal and the same power amplifiers are used when measuring the sound pressure level of a single ultrasound transducer and of the array, and the sound pressure level generated by the array exceeds that of the single transducer by between 3 dB and 10 dB at all distances from the center. At a distance of 1 m, the sound pressure level produced by the designed array is 20 dB lower than the level measured when the microphone is placed 20 cm away from the transducer. At a distance of 1 m, the sound pressure level produced by the designed array is 20 dB lower than the level measured when the microphone is placed 20 cm away from the transducer, as can be seen in Figure 2.
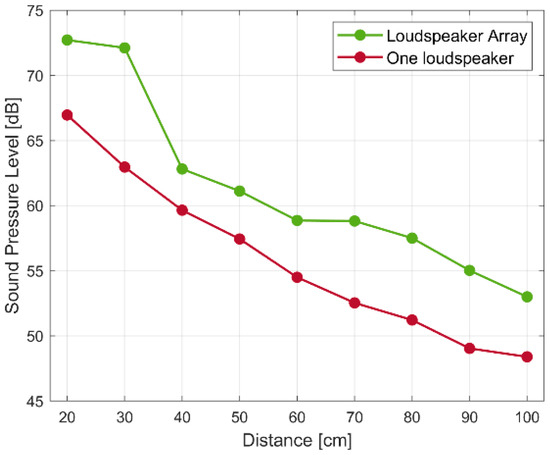
Figure 2.
Attenuation of the sound pressure level of a single ultrasound loudspeaker and ultrasound loudspeaker array with increasing distance.
The acoustic field beneath the prototype is required to be as uniform as possible, without pronounced variations in sound pressure level over the surface below the array. An example of the sound pressure level distribution produced by such a system is shown in Figure 1a. Due to the presence of the propellers and landing gear, the space available for integrating the array on the drone is limited, and the array must therefore be designed to maintain a stable sound pressure level over a circular surface with a radius of 0.58 m, with no significant level fluctuations. The radius of the circular surface was chosen so that the distance from the center of the loudspeaker array to the ground is 1 m, and the line connecting the array center and the circumference of the circle forms a 30° angle with the vertical at a height of 1 m, so radius is equal to .
The directivity patterns of a single ultrasound transducer measured at a distance of 50 cm for frequency bands of 20 kHz, 30 kHz, 40 kHz, 50 kHz, and 60 kHz are shown in Figure 3. The directivity patterns indicate that, at these frequency ranges, the acoustic energy is spread into multiple directions, whereas the goal is to concentrate it within a well-defined region beneath the loudspeaker array. The sound energy dispersed in various directions can be exploited through reflections from a reflective surface, thereby further increasing the energy concentration in the region below the array. To enable more efficient steering of the reflected energy into this region, the shape of the array, that is, its mechanical structure, was designed as the inner surface of a spherical cap [34,35]. In this configuration, the side lobes contribute to an increased sound pressure level due to reflections from the structure of the spherical cap.
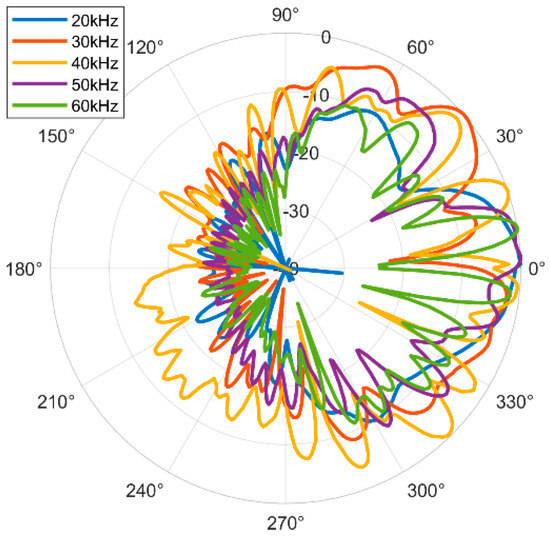
Figure 3.
Directivity pattern of single ultrasound loudspeaker.
The surface upon which the mounted loudspeakers form the array is concave, representing the inner part of a spherical cap. The dimensions of the cap are as follows: a height of 10 cm and a base radius of 18 cm. The surface was designed to be 3D-printable, with predefined slots for the integration of loudspeakers into the printed model. The arrangement of the loudspeakers was defined to ensure an appropriate sound field beneath the drone. The spherical cap is divided vertically into eight equal rings, excluding the bottom 1 cm and the top 1 cm zones, where loudspeaker placement is not possible due to 3D model constraints. One loudspeaker from the array is placed on each ring. The loudspeakers are positioned along imaginary axes emerging from the center of the spherical cap’s base, spaced 45° apart. The loudspeakers located on rings furthest from the center are placed on opposite sides, as are those closest to the center, ensuring a uniform distribution across the entire spherical surface. Figure 1b shows the arrangement of the loudspeakers in the xy-plane as viewed from below the spherical cap, whereas Figure 1a presents the arrangement of the loudspeakers in the xz-plane, providing a clearer illustration of the vertical division of the spherical cap into eight rings. The design of the 3D loudspeaker model and the details of the 3D printing process are presented in the following Section 2.4. In this subsection, the exterior and interior of the designed prototype are shown.
2.2. Design of the Signal Generation and Amplifiers
An essential part of the design phase involves the development of a signal generator operating in the frequency range between 20 kHz and 70 kHz, as well as the provision of power amplifiers for the loudspeakers. It is also necessary to supply power to all components and to integrate the required electronics on a single PCB, powered from a 5 V battery supply. In this section, a brief description of the signal-generation circuit and the amplifiers used in the prototype is provided. The complete circuit diagram of the designed signal generator and preamplifier is shown in Figure 4, where all functional blocks and their interconnections are illustrated.
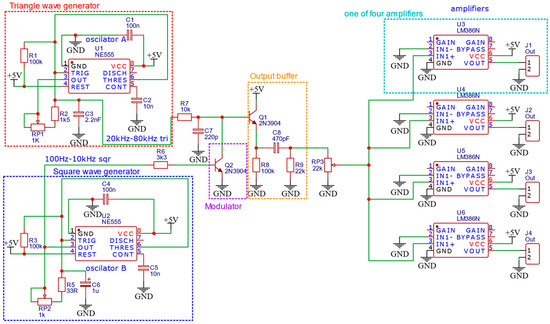
Figure 4.
Complete schematic of the printed circuit board with highlighted functional blocks: triangle wave generator, square wave generator, modulator, output buffers, and power amplifiers.
For generating the signal, two NE555 timer ICs are used, one (oscillator A) configured to generate a triangle wave and the other (oscillator B) to generate a square-wave signal with a duty cycle of 50%, both with a variable frequency set by potentiometers RP1 and RP2, respectively [36]. The frequency range for the square-wave signal is from 100 Hz to 10 kHz, and for the triangle wave the range is from 20 kHz to 80 kHz. These signals are used to generate the desired ultrasound excitation signal by using Q2 to modulate the amplitude of the triangle wave (the carrier signal in this case) with the square-wave signal (the modulating signal). R7 and C7 form a low-pass filter to clean up the triangle wave, and Q1 is implemented as a simple buffer stage. R9, RP3 and C8 form a high-pass filter that removes frequencies below 30 kHz, thereby attenuating components that lie within the human audible range.
For amplifying the signal, an integrated IC amplifier LM386N was chosen [37]. It was selected due to its availability, suitable operating supply-voltage range, and sufficient output power for the given application. For the given supply voltage, the output power can reach up to 200 mW, which is enough to drive three ultrasound loudspeakers wired in parallel. RP3 is used to control the input level to the amplifiers, with the amplifiers having a fixed gain of A = 20. Four of these amplifiers were used so that up to 12 loudspeakers can be driven, enabling a nearly uniform sound-pressure coverage over the targeted area.
As designed, the combined signal-generation and amplification circuitry provides flexible control of the excitation signal and sufficient drive capability to support the loudspeaker array required by the proposed ultrasound repulsion system.
2.3. Path Planning Using a Genetic Algorithm for Field Coverage
In path planning, several constraints need to be considered in order to make the flight feasible and safe. Such limitations may arise from the surrounding environment, vehicle dynamics, mission specifications, and energy consumption. Genetic algorithms (GA) emulate evolutionary mechanisms by applying principles of natural selection and recombination between individuals. In this paper, the genetic algorithm is applied to a specific problem scenario. A genetic algorithm is a stochastic global optimization method that operates on a population of candidate solutions and iteratively improves them through selection, recombination, and variation, with the goal of increasing solution fitness over successive generations [38,39].
In this paper, the optimization algorithm is used to determine the optimal flight trajectory of the drone carrying the loudspeaker array, so that the entire field area is covered as efficiently as possible and the maximum possible number of rodents is repelled. The problem is formulated on a rectangular grid measuring 10 × 10 m with a node spacing of 1 m. The chromosome represents a discrete sequence of control commands, with each gene corresponding to a movement direction. The trajectory is decoded iteratively while enforcing boundary constraints and avoiding immediate backtracking and is closed by returning to the starting position. Rodent movement dynamics are included for evaluation of fitness for candidate trajectories. When the drone reaches an occupied grid node, the rodents move away from the direction of approach, modeling avoidance behavior created by the combination of the drone presence and the emitted ultrasound. This simplified model allows the genetic algorithm to account for dynamic changes in rodent distribution while remaining feasible for offline optimization.
The objectives of the genetic algorithm are maximizing area coverage of the field, maximizing rodent deterrence from the protected area, minimizing redundant movements and limiting battery consumption. The resulting trajectories represent a trade-off between effective deterrence and operational efficiency. The optimization is an offline procedure and provides a baseline flight path which is adapted at the execution level during real-world deployment.
The genetic algorithm was executed on a 10 × 10 m field. The modelled drone speed was 0.7 m/s, and battery consumption was estimated based on average flight data. Sixteen rodents were uniformly distributed across the field. The genetic algorithm parameters were as follows:
- Population size: 100,000;
- Number of generations: 100;
- Mutation probability: 30%;
- Elitism: 10% of the population.
The stated fitness score is a relative indicator used to compare candidate trajectories during the optimization process. It indicates how well a given flight path, or a candidate, satisfies multiple objectives including maximizing field coverage, deterrence of rodents from the protected area, minimization of redundant movements and requirements regarding operational constraints. The actual value of fitness number is not a physical quantity, and it has meaning only relative to the fitness values of other generated candidate trajectories considered during the same optimization run. The fitness score is computed by simulating the drone trajectory on a grid-based field representation and it is implemented as a weighted aggregation of several normalized components, each reflecting a distinct planning objective. Positive contributions are assigned to newly covered grid cells and to successful rodent displacement events, while negative contributions are assigned to repeated visits to already covered cells, inefficient motion patterns (such as unnecessary turns), and excessive trajectory length relative to the field size. Deterrence-related terms are deliberately emphasized in the aggregation, such that candidate trajectories failing to expel rodents from the protected area receive a substantially lower overall fitness. Each of the parameters used to create the fitness function has its own attributes weight, and the adjustments of these weights influences which criteria will be the most important in creating the optimal path, e.g., assigning a higher weight to the rodent-displacement enforces trajectories that actively drive rodents out of the protected area even at the cost of longer flight paths, whereas assigning a higher weight to path-length or redundancy penalties makes the algorithm favor shorter paths at the cost of effective deterrence. This formulation ensures that coverage efficiency alone is insufficient to achieve high fitness without effective rodent deterrence. These contributions are accumulated over the full trajectory to yield a single scalar fitness value used to rank candidate solutions. Larger fitness values also mean a better global solution. After execution, the following results were obtained:
- Fitness score of the best individual: 4,210,934;
- Battery consumption: 47.32%;
- Covered cells: 35,500;
- Uncovered cells: 4500;
- Repelled rodents: 16.
Figure 5 illustrates the optimal drone flight path across the experimental field, showing the drone trajectory (blue line), the drone’s starting position (red circle), mouse starting positions (blue triangles), and mouse exit locations where they left the field (orange squares). The optimization algorithm is scalable and can be applied to fields of different dimensions, as well as adapted to a smaller number of waypoints at which the drone stops. Although this trajectory represents a theoretical solution for the optimal drone path, its practical applicability must be verified through testing under real field conditions. Therefore, the obtained trajectory serves as a baseline solution for subsequent experimental validation and further refinement of the path-planning strategy.
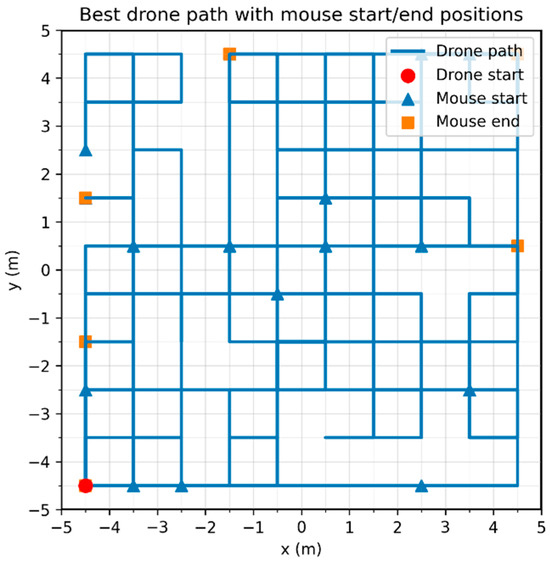
Figure 5.
Optimal flight path for the drone.
2.4. Prototype Design and 3D Modelling
The prototype of the loudspeaker array was designed and modelled to be suitable for 3D printing and subsequent integration with the drone. Once the overall dimensions and geometry of the spherical cap were defined, a model design was performed in SolidWorks (Version 2025, Dassault Systèmes, Waltham, MA, USA). The software model was divided into several segments that could be manufactured using a 3D printer and easily assembled into a compact unit. Adequate space was provided within the inner surface of the spherical cap to accommodate eight ultrasound transducers in predefined positions, while the upper part of the cap, above the transducer zone, was reserved for housing the PCB and a purpose-selected external battery, chosen to satisfy mass and dimensional constraints.
The complete 3D model of the prototype was first created in a software environment, where both the exterior and interior of the structure were defined, Figure 6a. The prototype was then 3D-printed in multiple segments and assembled into a functional loudspeaker array. The integrated PCB drives the eight ultrasound loudspeakers either by means of an on-board signal generator or via an external signal generator connected to the board. Two prototype versions were manufactured with different loudspeaker layouts and mechanical designs. The first model had a total mass of approximately 1900 g, which proved excessive for the available drone platform and did not allow safe and stable flight. In the second model, subsequently used in field experiments, the structural design was optimized in order to reduce both mass and height. The total mass was reduced by about 700 g by replacing the battery, decreasing the amount of printing material, and refining the body geometry, while the assembly method and loudspeaker arrangement were also modified and improved. The exterior of the loudspeaker array structure is shown in Figure 6b where it can be seen that the PCB and the battery are housed in a specially designed compartment. The interior of the printed prototype with eight ultrasound loudspeakers is presented in Figure 6c.
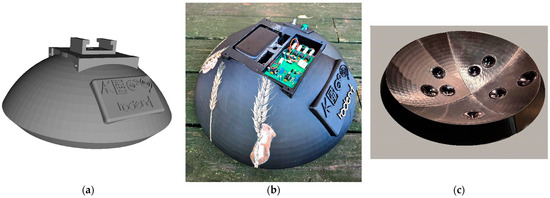
Figure 6.
The 3D prototype. (a) Model in SolidWorks, (b) External view of the printed model with the battery and PCB mounted on the top side of the loudspeaker array, (c) Interior of the loudspeaker array with eight integrated ultrasound transducers.
In Figure S3 of the Supplementary Material, the printed prototype mounted on the drone is shown, while Figure S4 presents the drone carrying the loudspeaker array.
3. Testing Phase
After the design and development of the complete system, it is necessary to perform tests under controlled experimental conditions, during which the sound pressure level generated by the loudspeaker array is measured. In addition, flight tests of the drone must be conducted along predefined trajectories obtained from calculations and optimization procedures. This phase is essential to verify the operation of the individual system components and to enable the transition to the third phase, in which the performance of the entire integrated system is evaluated.
3.1. Sound Pressure Level of the Loudspeaker Array
Experimental measurements of the sound field generated by the designed loudspeaker array were carried out under anechoic conditions. The purpose of these measurements was to determine the sound pressure level on a surface located 1 m away from the center of the array and to analyze the uniformity of the spatial distribution of the sound field. During the experiment in which the sound field level is measured, the same loudspeaker array is used as in the field tests of the system. In this experiment, the goal is solely to measure the sound pressure level generated by the designed loudspeaker array. The measurements were performed in the anechoic chamber of the Palace of Science in Belgrade, where the sound pressure level was recorded on a circular surface with a radius of 0.58 m positioned beneath the array [40]. The points on this surface at which the microphone was placed were distributed with an angular resolution of 1° in the xy-plane. The radius of the circular measurement surface within the measurement area was varied such that the angle between the center of the loudspeaker array and a point in the xy-plane ranged from 0° to 30° in steps of 1°. Precise positioning of the measurement points was achieved using a rotating ANT turntable [41]. The sound pressure level at each measurement position was recorded with a microphone connected to a dedicated, custom-designed preamplifier [42]. The described experimental setup is shown in Figure 7.
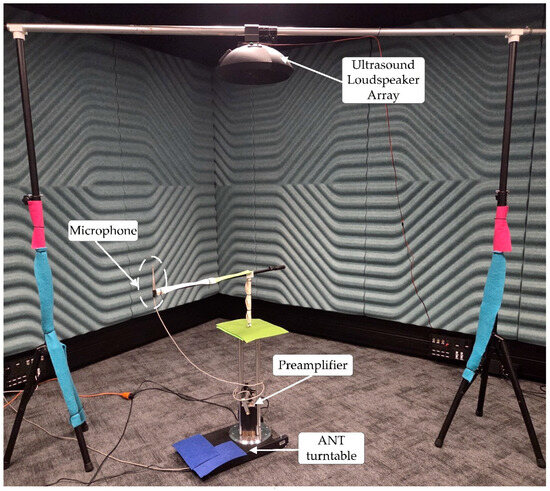
Figure 7.
Measurement setup for determining the SPL under anechoic conditions.
The signal reproduced during the experiment contains frequency components at 20 kHz, 30 kHz, 40 kHz, 50 kHz, and 60 kHz. These frequency components are extracted using specially designed FIR filters whose amplitude responses are shown in Figure 8 together with the signal spectrum. The filters were designed using an optimal FIR filter design procedure and have an order of 1511, the high filter order is required due to the very narrow frequency bands being isolated [43].
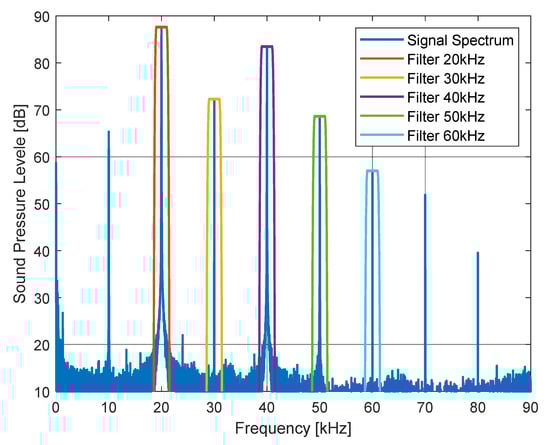
Figure 8.
Spectrum of the test signal and amplitude characteristics of the filters.
For each frequency band, the sound pressure level is calculated at all measurement positions, as well as the parameter J, which quantifies the uniformity of the spatial distribution of the sound field. The parameter J is defined as the standard deviation of the sound pressure level over the measurement surface located beneath the loudspeaker array, and its values for different frequency bands are given in Table 1 [44]. The maximum standard deviation is observed at 50 kHz. However, the differences in standard deviation between the individual frequency bands are small, indicating that the spatial distribution of the sound pressure is approximately the same for all analyzed frequency ranges. Figure 9 shows the measured sound field level at 30 kHz, where the sound pressure level varies between 55 dB and 75 dB. In the same figure, the positions of the loudspeakers forming the array, located above the measurement surface, are marked with red circles. In the Supplementary Material, Figure S1a–e show the measured sound pressure levels at different frequencies (20 kHz, 30 kHz, 40 kHz, 50 kHz, 60 kHz).

Table 1.
Standard deviation of the sound pressure level at different frequency bands on the surface beneath the loudspeaker array.
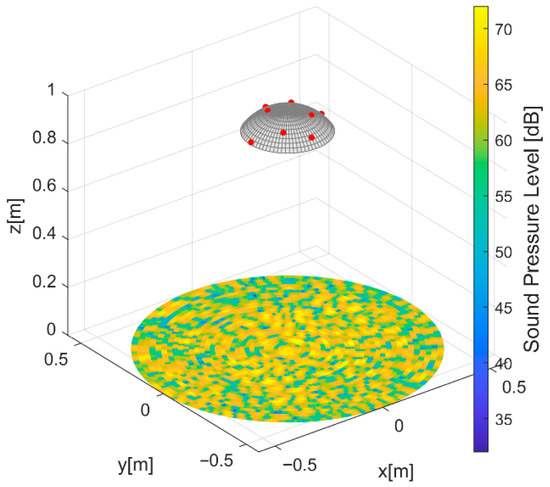
Figure 9.
Measured sound pressure level at 30 kHz and schematic view of the loudspeaker array (red circles indicate the positions of the ultrasound transducers).
This experiment was conducted to validate the selected geometry and the spatial arrangement of the loudspeakers within the array. In addition, the obtained SPL distribution beneath the array was used as an input to the drone trajectory-planning algorithm applied during prototype flights, as the results indicate that the coverage within the analyzed sector is approximately uniform (i.e., the SPL does not vary substantially with angle over 0–30°). Finally, these measurements provide a baseline for further optimization of the array geometry, enabling an assessment of how the SPL distribution would extend over a larger ground area beneath the drone (e.g., for larger lateral offsets and wider angular sectors).
3.2. Field Testing of Predefined Drone Flight Paths
A discrepancy was identified when the designed system was employed in actual outdoor fields regarding simulated flight time using UAVs. Although grid-based path-planning simulations showed high coverage efficiency, in-field operation demonstrated that stopping at too many closely spaced waypoints for covering leads to excessive battery consumption. This impact was most significant under payload and presumably resulted from the additional mass of the ultrasound system increasing the burden associated with repeated acceleration and deceleration.
The experiments were performed by testing waypoint-based missions of different levels of complexity. With the growth of waypoints, this led the drone to constantly slow down, stabilize its position for a while and then speed back up to the next node. Figure 10 shows the drone carrying the loudspeaker array prototype, captured during flight path testing [45]. Experimental results demonstrated that the battery consumption was more influenced by the enforced stops than by the total shape-based distance of the path. At the larger scales, longer missions and dense waypoint set often drained the remaining onboard battery power before completion of coverage indicating that the density of waypoints is an important parameter for application in UAV endurance.
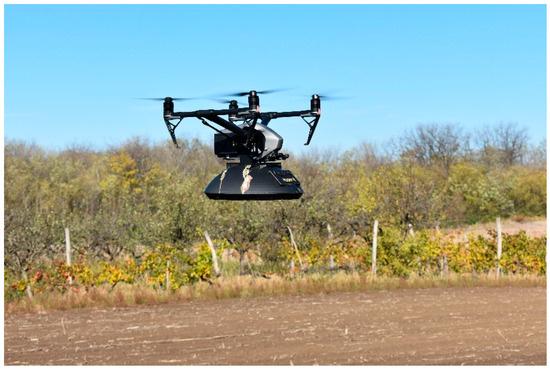
Figure 10.
Drone flight path testing.
To address this limitation, a trajectory simplification strategy that targets reducing the number of stopping events without decreasing the size of the target area or overall coverage need is proposed. Rather than reducing the spatial resolution of the grid or partitioning the mission, we exploit the geometric nature of our path. Consecutive waypoints standing in a straight line were collated to form one continuous motion. When three or more nodes in sequence were collinear, only the start and end points of the segment were recorded as explicit waypoints and intermediate nodes became treated as implicit on-the-route positions. In this way, the UAV was able to keep moving all the time and only stop for a while or hover at straight trajectory. This is quite interesting as this algorithm keeps the spatial footprints of the planned path and leaves unchanged the coverage pattern defined by the optimization processing. This change is in the execution layer only, and it helps to make the velocity profiles smoother leading to lesser transient power peaks due to frequent braking and re-accelerating.
The simplification method developed is in line with what was seen in the GA path optimization utilized in the simulation phase of the project. The GA in simulation also preferred minimal redundant trajectories and prolonged movement segments with directed motion (having the tendency to suppress excessive turning and local oscillations). As such, optimal paths frequently involved taking the long route across the field. In practice, while solutions found by the genetic algorithm were smooth and with guiding polygons covering obstacle edges in regions of local minima, when discretized along waypoint paths for motion execution on a real robot (with robots stopping at each grid node), part of their inherent smoothness was lost. Field execution with collinearity-based waypoint reduction was able to repair the structural properties of GA-optimized paths during field operation and therefore enabled behavior closer to the simulation assumptions.
It shows that the proposed simplified trajectories yielded similar area coverage compared to fully discretized paths and significantly longer flight endurance, as evidenced through field tests. While absolute energy savings are dependent on atmospheric conditions and payload mass, the general performance trends that we observe match well with what would be expected from a GA-optimized mission plan to maximize coverage over energy. The analysis highlights an important difference between the representation of a path used for optimization and that followed on any physical UAV system. Although the compact representations are appropriate to optimize distributions off-line and calculate coverage, their direct application is not efficient in practice due to vehicle dynamics and energy limitations.
The on-line planning and real deployment can be effectively bridged by execution-aware trajectory simplification. In the case of UAVs with limited endurances to meet energy budgets, lowering the enforced number of stop point may generate more significant gains in endurance than the reduction of vehicle granularity or target area. These results indicate that in a path-planning system for the future, especially involving an offline optimization method such as a genetic algorithm-based framework of UAVs, there exists the need to add post processing or execution level adaptations regarding dynamic aspects of the UAV. Hybrid representations that combine discrete planning with continuous trajectory execution can as well enhance the transferability from simulation to field. In addition, future extension of the framework could include more detailed rodent behavior models where exposure duration, or repeated encounters may become meaningful metrics.
4. Validation Phase
This phase comprises the testing of the complete system for non-invasive rodent repulsion in agricultural fields. The first part of the validation procedure involves recording the audio signal emitted by the loudspeaker array while it is suspended from the drone. This part of the experiment is challenging, since precise drone maneuvering is required to position the drone with the array at a distance of 1 m from the microphone. It is also necessary to analyze how the drone noise affects the synthesized ultrasound signal. The second part of this phase involves the development of a method to confirm that the rodents have been successfully repelled. For this purpose, a thermal camera is used to monitor the area of the field where the validation is carried out and to detect the presence of rodents. A field experiment involving rodents was conducted to demonstrate the proof-of-concept of the proposed system, which represents the final step of this phase. A comprehensive experimental evaluation campaign is planned as part of future work, while the results presented in this study demonstrate that the individual system components perform as intended and provide a solid foundation for full-system validation.
4.1. Field Testing of Loudspeaker Array
At lower frequencies, the dominant contributions to the soundscape are expected to be ambient environmental noise, traffic noise, and the drone itself. The aim of this measurement is to verify whether the signal produced by the loudspeaker array is sufficiently separated from these other sound sources, i.e., whether there are any relevant background signals in the ultrasonic band above 20 kHz in the field environment that could interfere with the signal emitted by the ultrasonic transmitters.
A microphone was placed on a stand in the agricultural field at a height of 20 cm above the ground, with the aim of recording the audio signal designed to repel rodents under real conditions in the presence of drone noise. In Figure S2 of the Supplementary Material, the setup used for field recording of this signal is shown. The signal was emitted by an internal generator integrated on the PCB. Figure 11 shows the spectrum of the signal recorded during the testing of the loudspeaker array. The recording was performed by flying the drone carrying the array directly over the microphone in order to analyze the combined signal arising from both the drone noise and the signal emitted by the array. The spectrum clearly indicates that the drone noise is concentrated within the human audible range, up to about 20 kHz, whereas the components generated by the proposed ultrasonic array lie at higher frequencies between 20 kHz and 60 kHz and are therefore independent of, and not masked by, the drone noise [46]. These two audio signals originate from different sound sources and are mutually independent, meaning that the noise produced by the propellers and the drone does not adversely affect the ultrasound frequency range under analysis. The acoustic output in the target ultrasonic range can be evaluated independently from the UAV’s audible noise. Consequently, future studies may explore alternative deterrence signals and modulation patterns while maintaining confidence that ambient/UAV audible noise will not materially affect the ultrasonic components under analysis.
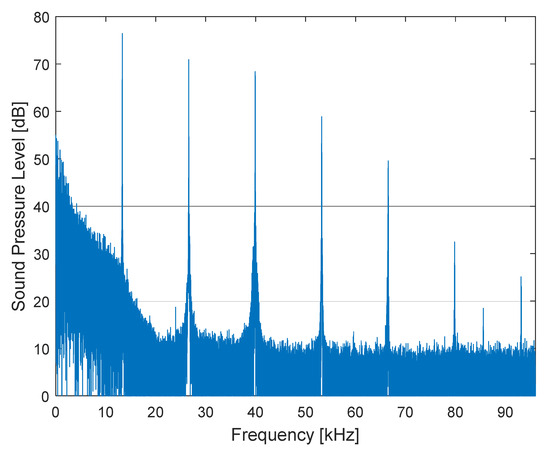
Figure 11.
Spectrum of the recorded field signal consisting of drone noise and ultrasound emitted by the loudspeaker array.
4.2. Field Testing of Whole System
Field testing of the complete system was carried out in the Deliblato Sands area, at the “Šumski mir” estate, where an enclosed area containing rodents was prepared, and the experiment was conducted in two phases [47]. The first phase involved emitting ultrasound by means of the loudspeaker array positioned above the area containing the rodents, whereas the second phase consisted of drone overflights above the enclosed area while carrying the array. In this way, the behavior of the rodents was analyzed in the presence of an ultrasound field. Two rodent species participated in the experiment field, mice and rats. The aim was to observe how different species responded to identical ultrasound stimuli.
Figure 12a shows the setup of the first part of the experiment, in which the loudspeaker array was suspended above the enclosed area containing the rats. During this phase, the rats moved freely within the enclosure, and upon entering the region directly beneath the array they started to run and move away from the area with a high ultrasound sound pressure level. The reactions of the field mice were noticeably weaker; they exhibited considerably less avoidance of the region under the ultrasound source. This behavior suggests that different rodent species are sensitive to different frequency ranges, and that they may also differ in how strongly they perceive ultrasound stimuli as a potential threat [15]. A more detailed analysis of inter-species differences in behavioral response and perception of ultrasound as a danger will be the subject of future work.
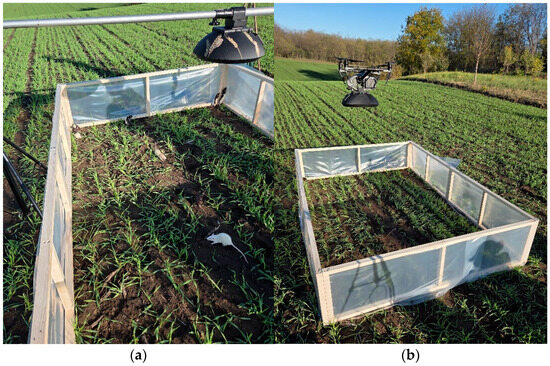
Figure 12.
Field testing of the system: (a) rodent reactions to ultrasound exposure, (b) rodent reactions when the complete drone-mounted system is used.
The second phase of the experiment focused on analyzing rodent reactions when the drone carried the ultrasound array and repeatedly flew over the enclosed area. This part of the setup is illustrated in Figure 12b. Observations indicate that the rodents perceive such a dynamic system as threatening and tend to move out of the zone beneath the drone. The experiment was intentionally conducted over a relatively small area in order to perform initial analyses of rodent behavior in response to the proposed system.
For more comprehensive validation and for subsequent analysis in scenarios where the drone overflies an entire field, a methodology was developed for assessing the effectiveness of the proposed approach and for analyzing rodent movement using a thermal camera combined with rodent detection algorithms.
4.3. Rodent Detection Using Thermal Images and Computer Vision
Accurate and timely rodent detection is essential for establishing a reliable feedback framework in non-invasive rodent deterrence and pest monitoring systems. Real-time image-based detection systems (i.e., camera traps) provide an effective way of remotely and automatically monitoring target areas for animal activity [29].
In the current stage of development, mouse detection is used only to verify rodent positions and to track their movement. The thermal camera-based detection system and the drone carrying the loudspeaker array do not operate simultaneously in this phase. In future research and system development, the proposed methods will be integrated so that rodent detection and the ultrasonic deterrence system can run simultaneously.
We developed an automated real-time camera-trap system for detecting rodents and moving bodies using thermal imaging methods. The system integrates two complementary pipelines: a finetuned DL-based rodent detector built on the You Only Look Once (YOLO) framework [48], and a classical digital image processing module based on the OpenCV library [49]. An overview of the infrared detection system is shown in Figure 13.
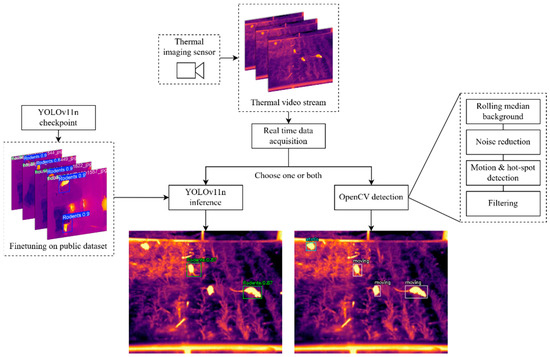
Figure 13.
Overview of the infrared rodent detection system. A commercially available thermal camera captures 14-bit frames at 60 Hz, which are streamed to the Python 3.13 application. The detection system consists of a finetuned YOLO-based detection module (left), and a classical image processing module using OpenCV (right).
4.3.1. YOLO Rodent Detection
We use a pre-trained YOLOv11n detection model checkpoint obtained from the Ultralights public GitHub repository [50]. The selected model is the nano variant, containing 2.6 million parameters, which represents an appropriate model size for edge-based AI inference on CPU-only hardware. The model is pre-trained for object detection on the COCO dataset [51].
We found the pre-trained YOLO model on a publicly available, rodent-specific thermal imaging dataset [52]. The dataset contains 3315 annotated thermal images, split into 2320 images for training, 663 for validation, and 332 images for testing. All annotated bounding boxes belong to a single class (“Rodents”), while the remainder of the scene is treated as background. We trained the model for 100 epochs using 640 × 640 pixel images with multi-scale augmentation, and a batch size of 16. We provide the trained model weights (with and without multi-scale augmentation) at the official project repository on GitHub [53].
The trained model was evaluated on the holdout test set, achieving an F1 score of 0.98 at a confidence threshold of 0.464, precision of 1.00 at a confidence threshold of 0.93, and a mean average precision (mAP) of 0.991 at 0.5 IoU. When trained with multi-scale augmentation, the model reached an F1 score of 0.98 at a lower confidence threshold of 0.328, precision of 1.00 at a confidence threshold of 0.919, and a slightly improved mAP of 0.992 at 0.5 IoU. Inference is performed on BGR-formatted thermal images, using a confidence threshold of 0.8 for positive detections, and intersection-over-union (IoU) threshold of 0.25 for non-maximum suppression (NMS). To accommodate variability in scene composition, sensor perspectives and viewpoints, and expected object sizes within the images, the system also supports optional multi-scale inference.
4.3.2. OpenCV Object Detection
To improve the robustness of the rodent detection platform, we developed a general-purpose, intensity-based object and motion detection framework, which relies on classical digital image processing. The OpenCV based detection operates directly on absolute 14-bit pixel values, without contrast stretching. The system consists of several plugins, as illustrated in Figure 13: a rolling median background used for all downstream processing, noise reduction, separate motion and hot-spot detection modules, and a final filtering and object tracking module.
A rolling median background is computed over 25 buffered frames and used for subsequent movement and hot-spot detection. To perform both motion and local static hot-spot detection, a Gaussian blur is applied on the current frame for smoothing and noise reduction. Motion detection is performed by subtracting the median background frame from the current frame (after Gaussian smoothing with a 7-pixel square kernel), and thresholding relative intensity changes above 2.5 °C. Hot-spot detection identifies local high-intensity objects by subtracting a blurred version of the current frame (using a 5-pixel square Gaussian smoothing kernel) from the current frame, followed by thresholding with a 5 °C threshold. Moving object masks are obtained from the intersection of motion and relative hot-spot masks, while static high-intensity objects are extracted by subtracting the moving masks from all hot-spot masks.
The masks are refined using morphological operations (opening, closing, and dilation) and filtered by absolute pixel area (between 125 and 1750 pixels). Bounding boxes are filtered by suppressing smaller boxes fully contained within larger ones. Objects are tracked by comparing bounding box overlaps between successive frames, using an IoU threshold of 0.3. To reduce false positives, a detected object is reported after a persistence threshold of 10 successive frames and removed after 5 successive frames without a detection. Persistence thresholds, IoU thresholds, and area and center tracking is also performed when relabeling masks from moving to static and vice versa. When used alongside the YOLO detection module, objects detected with the OpenCV module that are fully contained inside YOLO bounding boxes are removed to reduce redundancy.
The rodent detection system was tested through the field experiment described in Section 4.3. The resulting dataset, containing video recordings and per-frame detection outputs, is publicly available at [54]. Two videos were created that simultaneously display the thermal camera recording, in which rodents are detected, and the corresponding RGB recording of the real scene. The first video, named open_cv.mp4, is generated using an OpenCV-based approach, while the second, named yolo.mp4, uses a YOLO-based detection approach [54]. These videos illustrate how rodents behave when the rodent-deterrent system approaches them. The detection system was used solely as an experimental validation tool of the ultrasound deterrent platform and implemented as a proof of concept. Accordingly, its performance was assessed only qualitatively, without any formal evaluation of detection accuracy or other performance metrics.
In Table 2, quantitative measures are presented that describe our validation experiment. The table shows the dependence of the number of mice located in the center of the enclosed area at different time instants while the system is flying over the enclosed space. The time labeled 0 s represents the initial moment when the mice were released, while the remaining points of time show how they move. The counting of these mice is aligned with YOLO-based detection, where only mice located in the central zone are counted. For all videos in our dataset [54], the results are quite similar, and Table 2 shows the result for the demonstration video provided in the [54], named yolo.mp4. Initially, 10 rodents were present in the center of the enclosed area, while at the end, after 10 s, the mice are in the corners of the enclosed space, indicating that the system successfully repelled all 10 rodents within 10 s.
Table 2.
Number of mice that remained in the center of the enclosed area at a given time.
Nevertheless, inspection of the dataset indicates that both the OpenCV and the YOLO detection modules exhibit roughly complementary strengths and limitations. The YOLO-based module, mostly due to its high confidence threshold, is likely to produce fewer false positives, but this comes at the cost of increased false negatives. This behavior is observable in several frames within the dataset and in the example shown in Figure 13. False negatives also appear particularly often in scenarios and areas where the absolute temperature difference of the object of interest and the background is small, leading to reduced contrast in the corresponding 8-bit BGR images compared to the training dataset examples. In contrast, the OpenCV detection module achieves a substantial increase in computational speed in comparison to the YOLO module, at the expense of pure detection accuracy. As evident in multiple frames in the dataset, the OpenCV tool has a low detection threshold, resulting in frequent detections of non-rodent objects.
Taken together, these observations suggest that combining the complementary strengths of both modules could lead to a rodent detection system that is both efficient and accurate. However, rigorous quantitative evaluation and further optimization are necessary to assess the system’s performance under real-world conditions.
One of the ideas for future research is to use the trajectories of mice recorded by the thermal camera as input to the optimization process for computing drone paths, so that the entire system can adapt its movement to actual rodent behavior. Developing a fully integrated system will require, in addition to the already implemented rodent detection in thermal images, further technical, mechanical, and software design work to define how all components will operate together as a single, coordinated unit.
4.4. Limitations and Future Work
Table 3 positions the proposed concept against the most common rodent-control options. Chemical rodenticides remain widely used due to their high efficacy, but they come with well-recognized safety and environmental concerns as well as regulatory constraints [5]. Traps provide a non-chemical alternative, yet they can become operationally demanding at scale: performance depends on deployment density and routine checking/servicing, which directly increases running costs over large agricultural areas [55]. Static ultrasonic devices are attractive because they are easy to deploy and generally safe, but their outdoor performance is often uncertain, due to strong attenuation, occlusions, spatial non-uniformity of the sound field, and potential habituation [13].
Table 3.
Qualitative comparison of the proposed UAV-enabled ultrasound approach with common rodent-control options.
Against this backdrop, our approach is intended as a mobile, non-chemical option that can bring the ultrasound source to the required locations and thereby improve spatial coverage compared to static emitters. Importantly, the present paper focuses on validating key subsystems (the acoustic output of the designed array and controlled testing of planned trajectories), whereas comprehensive field validation of the fully integrated system (detection + UAV flight along optimized paths + ultrasound emission in real crop-field conditions) is planned as the next step. We therefore position the proposed method as a potential complementary element within IPM strategies, particularly where reducing chemical inputs is a priority.
The present study has several limitations that should be stated explicitly. First, the current operating parameters were demonstrated in a representative scenario with the UAV flying at approximately 1 m above ground level, and the evaluated “effective” footprint corresponds to the measurement surface used in this study. This does not yet cover all agronomic contexts, including fields with taller crops (e.g., maize/corn, wheat, rice), where both flight altitude and the resulting sound field at the ground level may need to be adapted. This limitation in high crops could be addressed by using a larger drone capable of carrying a heavier and physically larger loudspeaker array. Such an array could accommodate more ultrasonic transducers and provide wider acoustic coverage while operating at higher flight altitudes. Second, rodent habituation remains a plausible risk for any deterrence-based method: repeated exposure to the same stimulus may reduce behavioral response over time, particularly if the stimulus is predictable in frequency content and timing. Third, environmental and weather-related factors (e.g., wind, temperature gradients, humidity, rainfall) can affect both UAV operation and ultrasound propagation, leading to variability in the sound field at the target area. Fourth, battery endurance and flight-time constraints limit the achievable coverage per mission and may impose trade-offs between dwell time above a given area and overall field coverage. Fifth, real-world deployment is subject to operational constraints such as local UAV regulations, safety requirements, and practical access to charging and maintenance. Finally, it is important to note that this paper reports subsystem-level validation (acoustic characterization of the array and controlled testing of planned trajectories). Comprehensive evaluation of the fully integrated system in real crop-field conditions, including sustained deterrence and return dynamics, remains to be completed.
Building on these limitations, our next steps focus on targeted, measurable improvements.
- We will conduct longer-duration field trials to quantify behavioral response over time and explicitly assess habituation effects under realistic agricultural conditions.
- We will quantify deterrence effectiveness using longer-duration deployments and repeated revisits, explicitly assessing habituation and the likelihood of rodents returning after exposure
- To mitigate habituation, we will investigate adaptive emission strategies, such as frequency hopping within the operational band, temporally jittered schedules, and stimulus patterns conditioned on detections (closed-loop deterrence rather than continuous emission).
- We will extend the planning framework toward energy-aware and weather-aware path optimization, incorporating wind and battery models to balance coverage, dwell time, and safe return-to-home constraints.
- We will validate end-to-end performance with integrated sensing and control, combining thermal detection/tracking with real-time trajectory adjustment to concentrate exposure where rodent activity is detected.
- From a hardware perspective, we will evaluate improved transducer configurations and packaging (e.g., higher electro-acoustic efficiency, more robust mounting, and better shielding against environmental conditions) to increase reliability and reduce power demand.
These steps will enable a more definitive assessment of effectiveness, safety, and operational viability of the complete system in the intended use scenario.
5. Conclusions
This paper presented the development and testing of a drone-mounted ultrasound system for non-invasive rodent deterrence in agricultural fields. The system integrates a custom-designed loudspeaker array, a dedicated signal-generation and amplification PCB, an optimized 3D-printed mounting structure, a GA-based path-planning module, and a thermal-camera detection pipeline. Laboratory measurements in an anechoic room confirmed that the array generates stable ultrasound in the 20–70 kHz band, achieving sound pressure levels and spatial uniformity at 1 m below the system that closely match simulation predictions.
During the design phase, three main components of the system were developed. A loudspeaker array was designed along with an analysis of the employed ultrasound transducers. Due to the significant attenuation and high directivity of ultrasound, it was decided to use an array in the shape of a spherical cap consisting of eight transducers. Additionally, a PCB was designed, developed, and manufactured, integrating power amplifiers for the loudspeakers and a custom signal generator. To achieve the most efficient rodent repulsion from crops using this drone-carried system, a genetic algorithm was employed to determine optimal flight paths over the field.
The testing phase evaluated the key system components. Measurements under anechoic conditions assessed sound pressure coverage beneath the drone across different frequency bands. These tests showed a standard deviation of less than 6 dB across measurement points on the surface below the drone, which was considered satisfactory for our experiment. Drone flight tests along predefined trajectories were also conducted under real field conditions, revealing that while the computed paths were effective, additional optimizations are needed for better battery efficiency and resilience to external factors.
In the final phase, experiments with live rodents tested the system’s effectiveness for crop protection. The first part involved playing signals from the prototype array and observing rodent behavior, while the second part analyzed reactions when the drone carried the array and flew over the enclosed area containing the rodents. However, visual analysis of rodent behavior proved insufficient, so a validation method using thermal imaging was developed during this phase. Two rodent detection models were created, which will enable more comprehensive analysis of rodent responses to our system in future work.
This paper presents the initial concept and first steps toward realizing a complete system for non-invasive rodent deterrence in agricultural fields. Future research will involve more detailed analysis of different rodent species behavior under prolonged ultrasound exposure. As our initial tests showed, various species react differently to both the drone and our designed system, underscoring the need for species-specific studies. Laboratory experiments exposing rodents to different signal types and developing variable signals will provide clearer insights into their responses. The next step involves full-field testing where the drone follows optimized trajectories while thermal cameras monitor the entire plot to detect and track rodents. For this stage, higher-quality thermal cameras will be required to achieve sufficient resolution for comprehensive field analysis.
The experimental results validate the core technical feasibility of the approach and demonstrate its potential as a sustainable alternative to chemical pest control. Traditional chemical pest control poses environmental risks and diminishes effectiveness over time, while our system offers a sustainable alternative that creates acoustic barriers without ecosystem harm. Preliminary field observations suggest scalability for larger agricultural operations, particularly when integrated with automated path planning and real-time rodent tracking. In future, farmers could adopt this as a complementary tool in integrated pest management, potentially reducing rodenticide use and crop losses by 20% or more in test plots, while supporting biodiversity through chemical-free deterrence. These findings provide a foundation for practical deployment and further refinement toward commercial viability in precision agriculture.
Supplementary Materials
The following supporting information can be downloaded at: https://www.mdpi.com/article/10.3390/drones10020084/s1, Figure S1. Sound pressure level over a circular surface with a radius of 0.58 m located 1 m below the loudspeaker array; Figure S2. Recording of the sound produced by the drone and the ultrasonic loudspeaker array; Figure S3. Prototype of ultrasonic loudspeaker array mounted on the drone; Figure S4. Flight of the drone while carrying the loudspeaker array.
Author Contributions
Conceptualization, M.B. and T.M.; methodology, M.M. and T.M.; software, M.R., M.M. and V.K.; validation, M.K., M.R. and V.K.; formal analysis, M.R.; investigation, M.R., M.M. and T.M.; resources, V.K. and M.K.; data curation, M.M.; writing—original draft preparation, M.R., V.K., M.M. and M.K.; writing—review and editing, M.R.; visualization, M.R. and M.M.; supervision, M.B.; project administration, V.K.; funding acquisition, M.B. All authors have read and agreed to the published version of the manuscript.
Funding
This research was funded by EU’s HORIZON-CL6-2021-GOVERNANCE-01-2 under grant 101060643 ICAERUS-Innovation and Capacity building in Agricultural Environmental and Rural UAV Services, with the project RODENT (Rodent Obstruction through Drone-Enabled Non-invasive Technology) through the 2nd Pull Open Call. This work was financially supported by the Ministry of Science, Technological Development and Innovation of the Republic of Serbia, under contract numbers 451-03-136/2025-03/200103, 451-03-137/2025-03/200103.
Data Availability Statement
The dataset of thermal camera video recordings used in this study is openly available at the following SharePoint link: https://etfbgacrs-my.sharepoint.com/:f:/g/personal/bjelic_etf_bg_ac_rs/IgBeXSrPGSDjTrBs_3PNdhKuAbWnXeenJjPO3TJx-BvP53M?e=YomGah (accessed on 24 December 2025).
Acknowledgments
The research was partially conducted in the premises of the Palace of Science, Miodrag Kostić Endowment. We would like to thank our friend, Jovan Jeličić from Šumski Mir, for their essential partnership and support throughout the project. The authors would especially like to thank Pavle Majstorović for his assistance and helpful discussions regarding the creation of the 3D prototype model.
Conflicts of Interest
The authors declare no conflicts of interest.
Abbreviations
The following abbreviations are used in this manuscript:
| SPL | Sound Pressure Level |
| UAV | Unmanned Aerial Vehicle |
| RODENT | Rodent Obstruction through Drone-Enabled Non-invasive Technology |
| PCB | Printed Circuit Board |
| IPM | Integrated Pest Management |
References
- Benjamin, J.; Idowu, O.; Babalola, O.K.; Oziegbe, E.V.; Oyedokun, D.O.; Akinyemi, A.M.; Adebayo, A. Cereal Production in Africa: The Threat of Certain Pests and Weeds in a Changing Climate—A Review. Agric. Food Secur. 2024, 13, 18. [Google Scholar] [CrossRef]
- Singleton, G.; Singleton, G.R. Impacts of Rodents on Rice Production in Asia; IRRI Discussion Paper Series No. 45; International Rice Research Institute: Los Baños, Philippines, 2003; p. 30. [Google Scholar]
- Witmer, G. Rodents in Agriculture: A Broad Perspective. Agronomy 2022, 12, 1458. [Google Scholar] [CrossRef]
- Rattner, B.A.; Mastrota, F.N. Anticoagulant Rodenticide Toxicity to Non-Target Wildlife Under Controlled Exposure Conditions. In Anticoagulant Rodenticides and Wildlife; van den Brink, N.W., Elliott, J.E., Shore, R.F., Rattner, B.A., Eds.; Springer International Publishing: Cham, Switzerland, 2018; pp. 45–86. [Google Scholar]
- Rached, A.; Moriceau, M.-A.; Serfaty, X.; Lefebvre, S.; Lattard, V. Biomarkers Potency to Monitor Non-Target Fauna Poisoning by Anticoagulant Rodenticides. Front. Vet. Sci. 2020, 7, 616276. [Google Scholar] [CrossRef]
- Wan, N.-F.; Fu, L.; Dainese, M.; Kiær, L.P.; Hu, Y.-Q.; Xin, F.; Goulson, D.; Woodcock, B.A.; Vanbergen, A.J.; Spurgeon, D.J.; et al. Pesticides Have Negative Effects on Non-Target Organisms. Nat. Commun. 2025, 16, 1360. [Google Scholar] [CrossRef] [PubMed]
- Mayer, L.; Degrendele, C.; Šenk, P.; Kohoutek, J.; Přibylová, P.; Kukučka, P.; Melymuk, L.; Durand, A.; Ravier, S.; Alastuey, A.; et al. Widespread Pesticide Distribution in the European Atmosphere Questions Their Degradability in Air. Environ. Sci. Technol. 2024, 58, 3342–3352. [Google Scholar] [CrossRef] [PubMed]
- Unsworth, J.B.; Wauchope, R.D.; Klein, A.W.; Dorn, E.; Zeeh, B.; Yeh, S.M.; Akerblom, M.; Racke, K.D.; Rubin, B. Pesticides Report 41. Significance of the Long Range Transport of Pesticides in the Atmosphere (Technical Report). Pure Appl. Chem. 1999, 71, 1359–1383. [Google Scholar] [CrossRef]
- Ediagbonya, T.F.; Areo, I.O.; Mupenzi, C.; Mind’je, R.; Kamuhanda, J.K.; Kabano, S. Reduced Pesticide Dependency through Crop Management. Discov. Appl. Sci. 2025, 7, 776. [Google Scholar] [CrossRef]
- Subramanian, K.S.; Pazhanivelan, S.; Srinivasan, G.; Santhi, R.; Sathiah, N. Drones in Insect Pest Management. Front. Agron. 2021, 3, 640885. [Google Scholar] [CrossRef]
- Barzman, M.; Bàrberi, P.; Birch, A.N.E.; Boonekamp, P.; Dachbrodt-Saaydeh, S.; Graf, B.; Hommel, B.; Jensen, J.E.; Kiss, J.; Kudsk, P.; et al. Eight Principles of Integrated Pest Management. Agron. Sustain. Dev. 2015, 35, 1199–1215. [Google Scholar] [CrossRef]
- Quasim, M.A.; Karn, A.K.; Paul, S.; Hmar, E.B.L.; Sharma, H.K. Herbal Rodent Repellent: A Dependable and Dynamic Approach in Defiance of Synthetic Repellent. Bull. Natl. Res. Cent. 2023, 47, 82. [Google Scholar] [CrossRef]
- Sousa-Guedes, D.; Ribeiro, H.; Vaz-Freire, M.T.; Mira, A.; Sillero, N. Ultrasonic Device Effectiveness in Keeping Rodents off the Road. Eur. J. Wildl. Res. 2020, 66, 23. [Google Scholar] [CrossRef]
- Awal, M.A.; Partha, P.K.P.; Islam, M.R. Design and Development of a Variable Ultrasonic Frequency Generator for Rodents Repellent. Smart Agric. Technol. 2024, 7, 100414. [Google Scholar] [CrossRef]
- Ralls, K. Auditory Sensitivity in Mice, Peromyscus and Mus Musculus. Anim. Behav. 1967, 15, 123–128. [Google Scholar] [CrossRef]
- Dent, M.L.; Screven, L.A.; Kobrina, A. Hearing in Rodents. In Rodent Bioacoustics; Dent, M.L., Fay, R.R., Popper, A.N., Eds.; Springer International Publishing: Cham, Switzerland, 2018; pp. 71–105. [Google Scholar]
- Heffner, H.; Masterton, B. Hearing in Glires: Domestic Rabbit, Cotton Rat, Feral House Mouse, and Kangaroo Rat. J. Acoust. Soc. Am. 1980, 68, 1584–1599. [Google Scholar] [CrossRef]
- Heffner, R.S.; Koay, G.; Heffner, H.E. Audiograms of Five Species of Rodents: Implications for the Evolution of Hearing and the Perception of Pitch. Hear. Res. 2001, 157, 138–152. [Google Scholar] [CrossRef] [PubMed]
- Jacewicz, E.; Alexander, J.M.; Fox, R.A. Introduction to the Special Issue on Perception and Production of Sounds in the High-Frequency Range of Human Speech. J. Acoust. Soc. Am. 2023, 154, 3168–3172. [Google Scholar] [CrossRef]
- Radoglou-Grammatikis, P.; Sarigiannidis, P.; Lagkas, T.; Moscholios, I. A Compilation of UAV Applications for Precision Agriculture. Comput. Netw. 2020, 172, 107148. [Google Scholar] [CrossRef]
- Zhang, S.; Wang, X.; Lin, H.; Dong, Y.; Qiang, Z. A Review of the Application of UAV Multispectral Remote Sensing Technology in Precision Agriculture. Smart Agric. Technol. 2025, 12, 101406. [Google Scholar] [CrossRef]
- Tsouros, D.C.; Bibi, S.; Sarigiannidis, P.G. A Review on UAV-Based Applications for Precision Agriculture. Information 2019, 10, 349. [Google Scholar] [CrossRef]
- Hafeez, A.; Husain, M.A.; Singh, S.P.; Chauhan, A.; Khan, M.T.; Kumar, N.; Chauhan, A.; Soni, S.K. Implementation of Drone Technology for Farm Monitoring & Pesticide Spraying: A Review. Inf. Process. Agric. 2023, 10, 192–203. [Google Scholar] [CrossRef]
- Kim, J.; Kim, S.; Ju, C.; Son, H.I. Unmanned Aerial Vehicles in Agriculture: A Review of Perspective of Platform, Control, and Applications. IEEE Access 2019, 7, 105100–105115. [Google Scholar] [CrossRef]
- Panthawong, A.; Doggett, S.L.; Chareonviriyaphap, T. The Efficacy of Ultrasonic Pest Repellent Devices against the Australian Paralysis Tick, Ixodes holocyclus (Acari: Ixodidae). Insects 2021, 12, 400. [Google Scholar] [CrossRef] [PubMed]
- ICAERUS. Available online: https://icaerus.eu/ (accessed on 23 December 2025).
- EU Funding & Tenders Portal. Available online: https://ec.europa.eu/info/funding-tenders/opportunities/portal/screen/opportunities/topic-details/horizon-cl6-2021-governance-01-02 (accessed on 23 December 2025).
- RODENT—Rodent Obstruction Through Drone-Enabled Non-Invasive Technology. Available online: https://icaerus.eu/open-calls-trials/rodent/ (accessed on 23 December 2025).
- Trolliet, F.; Huynen, M.-C.; Vermeulen, C.; Hambuckers, A. Use of Camera Traps for Wildlife Studies. A Review. Biol. Agric. Sci. Environ. 2014, 18, 446–454. [Google Scholar]
- Zualkernan, I.; Dhou, S.; Judas, J.; Sajun, A.R.; Gomez, B.R.; Hussain, L.A. An IoT System Using Deep Learning to Classify Camera Trap Images on the Edge. Computers 2022, 11, 13. [Google Scholar] [CrossRef]
- Carotenuto, R.; Pezzimenti, F.; Della Corte, F.G.; Iero, D.; Merenda, M. Ranging with Frequency Dependent Ultrasound Air Attenuation. Sensors 2021, 21, 4963. [Google Scholar] [CrossRef]
- Kovačević, V.; Ratković, M.; Miljković, T.; Kostadinov, M.; Bjelić, M. Drone-Based Ultrasound System Towards High Frequency Pest Deterrence. In Proceedings of the 2025 12th International Conference on Electrical, Electronic and Computing Engineering (IcETRAN), Cacak, Serbia, 9–12 June 2025; pp. 1–5. [Google Scholar]
- Ultrasound Speaker. Available online: https://aliexpi.com/4Ak (accessed on 23 December 2025).
- Asfandiyarov, S.A.; Tsysar, S.A.; Sapozhnikov, O.A. A Multielement Low-Frequency Ultrasonic Transducer as a Source of High-Intensity Focused Ultrasound in Air. Acoust. Phys. 2024, 70, 759–768. [Google Scholar] [CrossRef]
- Vercammen, M.L.S. Reflection of Sound by Concave Surfaces. In Proceedings of the 20th International Congress on Acoustics, ICA 2010, Sydney, Australia, 23–27 August 2010. [Google Scholar]
- Xx555 Precision Timers Datasheet (Rev. J). Available online: https://www.ti.com/lit/ds/symlink/ne555.pdf (accessed on 23 December 2025).
- LM386 Low Voltage Audio Power Amplifier Datasheet (Rev. D). Available online: https://www.ti.com/lit/ds/symlink/lm386.pdf (accessed on 23 December 2025).
- Holland, J.H. Adaptation in Natural and Artificial Systems: An Introductory Analysis with Applications to Biology, Control, and Artificial Intelligence; The MIT Press: Cambridge, MA, USA, 1992. [Google Scholar]
- Mitchell, M. An Introduction to Genetic Algorithms; The MIT Press: Cambridge, MA, USA, 1996. [Google Scholar]
- Centre for 3D Sound—Palace of Science. Available online: https://palatanauke.rs/en/science-centers/centre-for-3d-sound/ (accessed on 23 December 2025).
- ANT—Turntable for Loudspeaker Directivity Measurements. Available online: https://www.four-audio.com/en/products/ant-turntable/ (accessed on 23 December 2025).
- Product Data: Condenser Microphone Cartridges—Types 4130, 4133, 4134, 4135, 4136, 4138, 4144, 4145, 4155, 4160, 4165, 4166, 4176, 4178, 4179, 4180, 4181 (Bp0100). Available online: https://www.bksv.com/media/doc/bp0100.pdf (accessed on 23 December 2025).
- Sanjit, K.; Mitra, K.; Hirano, S.; Nishimura, K. Sugahara Design of Digital Bandpass/Bandstop Filters with Independent Tuning Characteristics. Frequenz 1990, 44, 117–121. [Google Scholar] [CrossRef]
- Suzuki, R.; Hoshi, K.; Hanyu, T. A Method for Evaluating the Spatial Uniformity of Sound Pressure in a Small Room by Using Power Spectra at Fewer Measurement Points. J. Acoust. Soc. Am. 2023, 154, A312. [Google Scholar] [CrossRef]
- DJI Inspire 2 Series User Manual. Available online: https://dl.djicdn.com/downloads/inspire_2/INSPIRE+2+User+Manual+.pdf (accessed on 23 December 2025).
- Schäffer, B.; Pieren, R.; Heutschi, K.; Wunderli, J.M.; Becker, S.; Schäffer, B.; Pieren, R.; Heutschi, K.; Wunderli, J.M.; Becker, S. Drone Noise Emission Characteristics and Noise Effects on Humans—A Systematic Review. Int. J. Environ. Res. Public Health 2021, 18, 5940. [Google Scholar] [CrossRef]
- Deliblatska Peščara Sumski Mir. Available online: https://sumskimir.org/ (accessed on 23 December 2025).
- Redmon, J.; Divvala, S.; Girshick, R.; Farhadi, A. You Only Look Once: Unified, Real-Time Object Detection. In Proceedings of the 2016 IEEE Conference on Computer Vision and Pattern Recognition (CVPR), Las Vegas, NV, USA, 27–30 June 2016; pp. 779–788. [Google Scholar]
- Bradski, G. The OpenCV Library. Dr. Dobb’s J. Softw. Tools 2000, 120, 122–125. [Google Scholar]
- Ultralights Public GitHub Repository. Available online: https://github.com/ultralytics/assets/releases/download/v8.3.0/yolo11n.pt (accessed on 24 December 2025).
- COCO Dataset. Available online: https://cocodataset.org (accessed on 25 December 2025).
- Rodent-Specific Thermal Imaging Dataset. Available online: https://universe.roboflow.com/panav2/rodent-thermal/dataset (accessed on 26 December 2025).
- ICAERUS-EU-OCT-RODENT. Available online: https://github.com/ICAERUS-EU/OCT-RODENT (accessed on 24 December 2025).
- Detection Rodents Dataset. Available online: https://etfbgacrs-my.sharepoint.com/:f:/g/personal/bjelic_etf_bg_ac_rs/IgBeXSrPGSDjTrBs_3PNdhKuAbWnXeenJjPO3TJx-BvP53M?e=PQ8K6S (accessed on 30 December 2025).
- Taylor, P.J.; Downs, S.; Monadjem, A.; Eiseb, S.J.; Mulungu, L.S.; Massawe, A.W.; Mahlaba, T.A.; Kirsten, F.; Maltitz, E.V.; Malebane, P.; et al. Experimental Treatment-Control Studies of Ecologically Based Rodent Management in Africa: Balancing Conservation and Pest Management. Wildl. Res. 2012, 39, 51–61. [Google Scholar] [CrossRef]


Disclaimer/Publisher’s Note: The statements, opinions and data contained in all publications are solely those of the individual author(s) and contributor(s) and not of MDPI and/or the editor(s). MDPI and/or the editor(s) disclaim responsibility for any injury to people or property resulting from any ideas, methods, instructions or products referred to in the content. |
© 2026 by the authors. Licensee MDPI, Basel, Switzerland. This article is an open access article distributed under the terms and conditions of the Creative Commons Attribution (CC BY) license.